Embed Size (px)
Citation preview
ZOOPLANKTON COMMUNITY.IN BATANG KAYAN ESTUARY, LUNDU, SARAWAK
Harold Tinggang Ngau
QL 123 Hl92
Bachelor of. Science with Honours1011 (Aquatic Resource Science and Management)
2011
'usat Kbld..at Maldumat Akademik UNIVERSm MALAYSIA SARAWAK
Zooplankton Community in Batang Kayan Estuary,
Lundu Sarawak. P.KHIDMAT MAKLUMAT AKADIMIK
111111111 fiiilll1l1lllll 1000235824
Harold Tinggang Ngau
The Final Year Project is submitted in partial fulfilment of requirement for degree of
Bachelor of Science with Honours
Aquatic Resource Science and Management Programme
Department of Aquatic Science
Faculty Resource Science and Technology
University Malaysia Sarawak
2011
I
I'
ACKNOWLEDGEMENT
First of all, I would like to thanks GOD for His Blessing that I had managed to finish my final ., y·ear project on time. Secondly, I would like to thanks my supervisor, Prof. Dr. Shabdin Mohd
Long for giving me an opportunity and trusted me to conduct Zooplankton Community in
Batang Kayan, estuary Lundu Sarawak research. Besides that, I am very appreciating for his
guidance and support from the beginning until the end of my project. Next, I would like to
thank my beloved family who always support and trust me during my studies.
In addition, my grateful thanks also to both Mr. Richard Toh and Mr. Zaidi Ibrahim with both
contribution and hard work during my sampling. I am also thankful to my senior Mr. Chen
Cheng Ann and Ms. Nur Atiqah binti Mohamad Yusoff for their advice and encouragement
during my project. Last but not least I would like to thank my supportive friends Mr. Abang
Azizil Fansuri bin Abang Abdullah, Mr. Abdul Halim Karim, Ms. Asmyrita Husna binti
Ahmad and Ms. Siti Nur Sakinah Zainuddin. Thank You.
, \
I

DECLARATION
This thesis was based on my original research work at Batang Kayan estuarfLundu Sarawak.
Based on my knowledge and belief, there was no portion of the work referred to in dissertation
has been submitted in support of an application for another degree of qualification of this or
any other university or institution of higher learning.
HAROLD TINGGANG NGAU
Aquatic Resource Science and Management Programme
Faculty of Resource Science and Technology
\..Universiti Malaysia Sarawak.
II
Pusat Khidmat M.ldumat Akademik UNIVERSm MALAYSIA SARAWAK
Table of Contents
Acknowledgement................................................................ ............. .
IIDeclaration.......................................................................................
Table of Contents................................. ............... ... ........................ ... III
List of tables. . . . . . . . . . . . . . . . . . . . . . . . . . . . . . . . . . . . . . . . . . . . . . . . . . . . . . . . . . . . . . . . . . . . . . . . . . . . . . . . . . . ... VI
List of figures. . . . . . . . . . . . . . . . . . . . . . . . . . . . . . . . . . . . . . . . . . . . . . . . . . . . . . . . . . . . . . . . . . . . . . . . . . . . . . . . . . . . VII
Abstract........................................................................................... VIII
1.0 Introduction ..................................................................................
2.0 Literature Review. . . . . . . . . . . . . . . . . . . . . . . . . . . . . . . . . . . . . . . . . . . .. . . . . . . . . . .. . . . . . . . . . . . . . . . . .. 3
2.1 Zooplankton composition......... ... ......... ................................... ....... 3
2.2 Adaptation of zooplankton................................................ ...... .. ........ 4
2.3 Distribution and migration of zooplankton..................... ...................... 5
2.4 Factor influence the zooplankton distribution.................................... .... 6
2.5 Zooplankton as bio-indicator of the river........................... .................. 7
2.6 Zooplankton composition in Sarawak..................... ............................ 8
3.0 Materials and methods............... ...... ......... ........................ ...... ........ 9
3.1 Study Site................................................................................. 9
3.2 Zooplankton sampling.................................................................. 11
3.2.1 Vertical sampling ............................. :............................... .. 11 ,
3.2.2 Horizontal sampling ................. ~ .......................................... 11
3.3 Physico-chemical parameters. .................. ................... .... ............... 12
3.4 Laboratory works...... ............................. .......... .................. ..... ... 12
III
I
3.4.1 Sieving......................................................................... .... 12
3.4.2 Sub-sample, sorting and counting......................................... ..... 12
3.4.3 Species identification of zooplankton..................................':...... 13
3.5 Data analysis... ....................... ............................................... ... 13
4.0 Results. . . . . . . . . . . . . . . . . . . . . . . . . . . . . . . . . . . . . . . . . . . . . . . . . . . . . . . . . . . . . . . . . . . . . . . . . . . . . . . . . . . . . . .. 16
4.1 Zooplankton........................................................................... ... 16
4.1.1 Vertical distribution............................................................. 16
4.1.1.1 Species composition... .................................... ...... ........... 16
4.1.1.2 Species density and percentage .......................................... . 19: I
4.1.2 Horizontal distribution ......................................................... . 24
4.1.2.1 Species composition........................................................ 24
4.1.2.2 Species density and percentage........................................... 26
4.1.2.3 Correlation between zooplankton community and physico
chemical parameters of the water. . . . . . . . . . . . . . . . . . . . . . . . . . . . . . . . . . . . . . . . 31
4.1.3 Species richness (D), Species diversity (H'), Species evenness (J)
and Species number........................................................ ... 33
4.2 Physico-chemical parameters of water................................................ . 35
5.0 Discussion............................................................................... ..... 41
5.1 Physico-chemical parameters of the water and zooplankton... ................... 41
5.2 Zooplankton composition .......................... :................ .................. 43
5.3 Correlation between zooplankton community and physico-chemical
parameters.............................. ................................................ 44
IV

I
1
6.0 Conclusion. . . . . . . . . . . . . . . . . . . . . . . . . . . . . . . . . . . . . . . . . . . . . . . . . . . . . . . . . . . . . . . . . . . . . . . . . . . . . . . . ..
7.0 References...................................................................................
8.0 Appendices. . . . . . . . . . . . . . . . . . . . . . . . . . . . . . . . . . . . . . . . . . . . . . . . . . . . . . . . . . . . . . . . . . . . . . . . . . . . . . . . ..
47
48
52
"
v
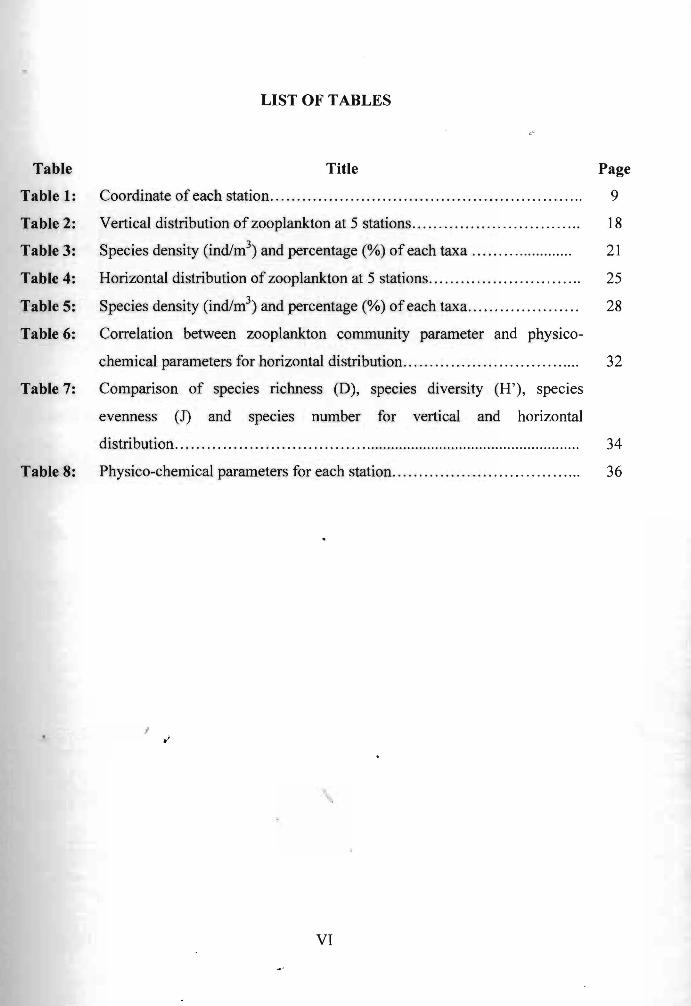
LIST OF TABLES
Table Title Page
Table 1: Coordinate of each station................................ . .......................... 9
Table 2: Vertical distribution of zooplankton at 5 stations............................. ... 18
Table 3: Species density (ind/m3) and percentage (%) of each taxa ........ .............. 21
Table 4: Horizontal distribution of zooplankton at 5 stations............................. 25
Table 5: Species density (ind/m3) and percentage (%) of each taxa.............. . ...... 28
Table 6: Correlation between zooplankton community parameter and physico
chemical parameters for horizontal distribution..... . ......... ...... ..... . ... .... 32
Table 7: Comparison of species richness (D), species diversity (H'), species
evenness (1) and speCIes number for vertical and horizontal
distribution............... . ....... . . . .......... ......................................... ............ 34
Table 8: Physico-chemical parameters for each station................................ .... 36
VI
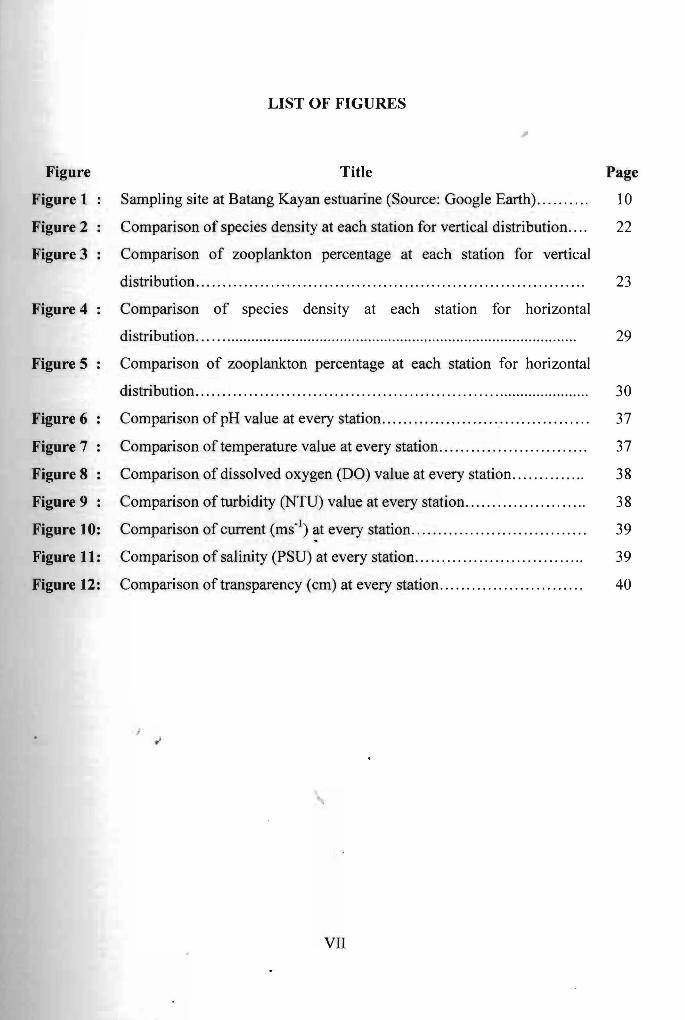
LIST OF FIGURES
Figure Title Page
Figure 1 Sampling site at Batang Kayan estuarine (Source: Google Earth)...... .... 10
Figure 2 Comparison of species density at each station for vertical distribution.... 22
Figure 3 Comparison of zooplankton percentage at each station for vertical
distribution......................................................................... 23
Figure 4 Comparison of species density at each station for horizontal
distribution. . . . . ......... .......... ......................... ........................... ................. 29
Figure 5 Comparison of zooplankton percentage at each station for horizontal
distribution........ . ....................... . .............. . ......... .................. .... 30
Figure 6 Comparison of pH value at every station ...................................... . 37
Figure 7 Comparison of temperature value at every station ..................... . ..... . 37
Figure 8 Comparison of dissolved oxygen (DO) value at every station .. . ......... .. 38
Figure 9 Comparison of turbidity (NTU) value at every station ..... . ................ . 38
Figure 10: Comparison of current (ms· l) at every station .. . ............................. . 39
Figure 11: Comparison of salinity (PSU) at every station .................. . ....... . ... .. 39
Figure 12: Comparison of transparency (cm) at every station .............. . '" ........ . 40
;
VII
Zooplankton Community in Batang Kayan Estuary
Lundu, Sarawak
Harold Tinggang Ngau
Aquatic Resource Science and Management
Faculty of Resource Science and Technology
Universiti Malaysia Sarawak
ABSTRACT
The main purpose of this study was to record the zooplankton community and its relation with the water quality. A study on zooplankton community in Batang Kayan estuary Lundu, Sarawak area was carried out during high tide. The main purpose of this study was to record the zooplankton community and its relation with the water quality. As result, 13 taxa of zooplankton were identified. The zooplankton taxa were commonly found along the estuary was calanoida Copepoda, cyclopoida Copepoda, harpaticoida Copepoda, Gastropoda larvae and Bivalvia larvae. Calanoida Copepoda was dominant taxa and high percentage of distribution. The range of zooplankton percentage was between 0.23 % - 55.15 %. The distributions of zooplankton community at Batang Kayan estuary was influence by temperature, pH, transparency and current of the water. The data of zooplankton density, abundance and correlation with physico-chemical parameter can be used as a basic database for future research and biological programme planning.
Key words: zooplanktons, physico-chemical parameter, taxa
ABSTRAK
Tujuan utama kajian ini adalah untuk merekod data komuniti zooplankton dan hubungannya dengan faktor jizikokimia air. Kajian tentang komuniti zooplankton di muara Batang Kayan daerah Lundu Sarawak telah dilakukan semasa air pasang. Hasil daripada kajian ini, terdapat 13 taksa zooplankton yang telah dikenalpasti. Taksa zooplankton yang dijumpai di sepanjang muara ialah Copepoda calanoid, Copepoda cyclopoid, Copepoda harpaticoid, larva Gastropoda dan larva Bivalvia. Copepoda calanoid merupakan taksa dominan dan menpunyai taburan peratusan yang tinggi. Julat peratusan zooplankton adalah antara 0.23 %- 55.15 %. Taburan komuniti zooplankton di muara Batang Kayan dipengaruhi oleh suhu, pH, transparansi dan arus air. Data kepadatan dan kelimpahan zooplankton kelimpahan serta k<Jrelasinya dengan 1Jarameter jizikokimia air boleh digunakan sebagai data asas kepada kajian dan perancangan program pemantauan biologt pada masa akan datang.
Kata Kunci: zooplankton, parameter jizikokimia, taksa
VIII
1
1.0 Introduction
Plankton is known as microscopic organisms that float and swim freely in oceanic currents "
and in other bodies of water. Plankton is made up of tiny plants which called phytoplankton
and tiny animals called zooplankton. In addition, zooplankton is known as pelagic organism
which cannot maintain their position in the water bodies or against the water flow (ldris,
1988). There are many species of zooplankton that can be found in estuarine area such as
copepod, isopod, bivalve and gastropod larvae.
Zooplankton can be divided into group such as holoplankton and meroplankton. Holoplankton
is known as zooplankton that spend whole of their lifecycle in form of plankton while
meroplankton is zooplankton that spend only a part of their lifecycle as plankton.
Meroplanktons are usually spending their life as plankton during eggs or larvae stage (ldris,
1988). In addition, larvae of invertebrate organism such as mollusc and crustacean can be
classified as meroplankton. Holoplankton in estuarine is usually dominated by copepode
which can adapt with marine and freshwater environment.
Based on annual report of Natural Resource and Environmental Board, Batang Kayan River
was considered as poUuted river (NREB, 2004). Zooplankton communities are well known to
be used as bio-indicator to determine the conditi9n of water quality in Batang Kayan. Some
species of zooplanktop such as Copepoda (Cyclops) and Cladoceran (Daphnia) are able to ~
survive in acidic condition (Ferdous and Muktadir, 2009).
There were few studies of zooplankton that has been carried out in Sarawak such as Kuching ~
Bay by Jane (2005), Batang Lupar by Suhartina (2007), Punang, Lawas and Limbang by Nur
(2009). Based on these studies, there were 16 taxa found in Kuching Bay, 6 taxa in Batang
Lupar and 10 taxa in Punang, Lawas and Limbang. Meanwhile, there was no study or
information on zooplankton community at Batang Kayan River. The main purposes of this
study are:
i) to record the zooplankton community and its relation with the water quality.
ii) to determine the species density, species diversity, species evenness and
species composition of zooplankton
iii) to produce the zooplankton community database for future biological
monitoring in Batang Kayan River estuary.
,
2
1
2.0 Literature Review
2.1 Zooplankton composition
Plankton can be divided into 2 groups which are zooplankton and phytoplankton.
Zooplanktons are also known as the heterotrophic plankton. The diversity of aquatic
organism is increase towards the equator (Idris, 1983). Zooplankton can be divided into
five different types of group which are microcrustacea, rotifers, coelenterates, ctenophores,
annelids and mollusc (Idris, 1988). Some zooplankton species are known as single-celled
animals such as foraminifera. Crustecea is the most common of zooplankton found in
Malaysian freshwater and the number of zooplankton in tropical increasing, while at the
temperate will remain unchanged (Idris, 1983).
In Peninsula Malaysia, the most common zooplankton that can be found is Cladocera.
Acoording to Idris (1988), there are 6 families of common Cladocera found in Peninsula
Malaysia. The six common families such as Family Sididae, Oaphiniidae, Moinidae,
Bosminidae, Macrothricidae and Chydoridae.
Zooplankton that is usually found in Sarawak can be classified in the lowest taxa such as
Copepoda, Malacostraca, Ostracoda, Polychaeta, Appendicularia, Gastropoda, Bivalvia, , .' Thecostraca, Hydrozoa, Amphipoda, Chaetognatha, Foraminifera, Chordata and
Echinodermaia (Jane, 2005).
3
.I
2.2 Adaptation of zooplankton
The distributions of zooplankton are usually based on the adaptation of zooplankton
species. Salinity is one of physico-chemical the factors that can affect the distribution of
zooplankton. Zooplankton in estuarine area can be divided into 4 different component
based on the zooplankton adaptation. For example, stenohaline zooplankton such as
Corycaeus sp. is usually found only at the river mouth of estuarine (Idris, 1988).
Euryhaline zooplankton such as Paracalanus sp. can be found further into the mangrove
area. Some species of zooplankton would not be able to tolerate with wide range of salinity
changes. Zooplankton species such as Pseudodiaptomus sp. and Diaptomus sp. can only be
found in estuarine and freshwater respectively.
The zooplankton community is abundant as compared to phytoplankton community in the
estuarine (ldris, 1988). This is due to the zooplankton community is dominated by the
benthic invertebrate, fish and crustacean larvae. The high population of zooplankton is
recorded at continental area (Samolyk et al., 2003). The abundance of zooplankton will
increased with increasing temperature, salinity and chlorophyll a values (Jane, 2005).
Some species of zooplankton has ability to tolerate with wide range of salinity and pH
. changes. This spe~es is usually found in the estuarine such as Acartia tonsa (2 ppt - 36
ppt), Acartia clause (14 ppt - 36 ppt), Gammarus zaddachi zaddachi (1 ppt - 15 ppt) and
Gamrnanus locusta (25 ppt - 35 ppt). (Wilson, 1994). Some species of copepods has the
ability to adapt polluted sites (Bednarski & Ramirez, 2004).
4
Pusat Khidmat Maklumat Akademik lP~IV[It.'olm MALAYSIA SARAWAK
2.3 Distribution and migration of zooplankton I'
Zooplankton community is important in marine ecosystem food chain. Zooplankton can be
classified based on their size such as picoplankton « 2 11m), nanoplankton (2-20 11m),
microplankton (20~200 11m), mesoplankton (0.2-20 mm), macroplankton (> 200 mm).
Zooplanktons are usually migrating into water bodies during day time and move to the
surface during night time (Liu et at., 2003). This type of migration is known as vertically
migration. However, the vertical distribution of zooplankton is influenced by physio
chemical parameter of the water such as temperature, salinity, dissolved oxygen (DO) and
nutrient. Holocline is one of the factors that cause zooplankton change their vertical
distribution and migration (Lougee et at., 2002). The main reason that zooplankton
migrate deep into the water bodies during day time is to avoid from predator (Lampert,
1989). At lower temperature, the rate metabolism of zooplankton is lower than warm water
(Pia, 2007). Hence, zooplankton can save energy by feeding in the cool water (Ellis,
2007). In addition, zooplankton will inhabit the habitat that rich source of nutrient or food.
Zooplankton is more abundance at the coastal area. This is due to the amount of nutrient
and chlorophyll a at coastal area is high which provides food for zooplankton (Rezai et at.,
QOOO). I
The total number of zooplankton species outside of the bay is higher than shoreline areas
(Webber, 2005). Hence, shallow nature of inshore areas may affect low species numbers as
a result of absence of those species of common deep levels zooplankton (Webber, 2005).
In the estuary, abundance and biomass of mesozooplankton species is usually depending
5
upon of changes in salinity. Hence, the abundance of zooplankton is depending on the
amount of freshwater input from the river (Pia, 2007) . High tides occur due to a variety of
physiological and physical processes which can cause the result has highe( concentrations
of larva and other meso zooplankton (Pia, 2007). Temperature and salinity may playa role
in the distribution of zooplankton in estuaries.
2.4 Factors influence the zooplankton distribution
Zooplankton distribution in the estuaries is influenced by physico-chemical parameters of
the water. In the estuaries, salinity is varied due to the large input of seawater during flood
and large input of freshwater during ebb tides. The water salinity is also varied at different
depth due to different in mixing in the rivers (Villate, 1997). The salinity range from 30 to
35 PPT is known as euhaline waters. Euhaline water is usually found at the mouth of the
river where the freshwater meet the seawater (Pia, 2007). The large input of seawater
during high tide will increase the marine zooplankton distribution and vice versa during
low tide.
Temperature is also play an important role of the zooplankton distribution. The
temperature is varied from the surface to the bottom of the water. The temperature has the
effect on the zooplankton abundance in multiple levels (Pia, 2007). The growth of
,phytoplankton such as diatom is influenced by temperature. Diatom growth shows that w
positive correlated with the growth of zooplankton such as Acartia tansa.
6
In addition, zooplankton community in aquatic ecosystems is decreased by increased of
eutrophication (Lazzoro, 2006). The physico-chemical parameters and nutrient status of
.. water body is important in governing the production of plankton such as zooplankton
constitute important food source of many aquatic organism such as fishes (Basu e/ ai.,
2010).
2.5 Zooplankton as bio-indicator of the river
Bio-indicator is defined as an organism that presence will indicates the quality of water
environment condition (Wilson, 1994). Zooplankton is one of the aquatic organisms that
could be used as a bio-indicator to determine the condition of the river. There are three
component of estuari_ne system which can be used to assess the contamination. They are
water, sediment and organism (Wilson, 1994). The changing of the water condition will
stimulate the organism to adapt to the changes (Dulic e/ al., 2006). If the organisms fail to
adapt with the changes, they cannot survive in the estuary. Then, condition of the water
can be assessed by quantifying the degree of the organism adaptation (Wilson, 1994).
Zooplankton responds quickly with the changes of water condition such as pH and
nutrient. Therefore, zooplankton can be used as bio-indicators of the aquatic environment
(Dulic e/ al., 2006). High amount of DO in water column is an indication of healthy
system in a water body. Hence, this condition of the water suitable for aquatic organism to oi
inhabit.
7
2.6 Zooplankton composition in Sarawak
At least 58 families and 79 species of zooplankton is recorded (Jane, 2005). The example
of species founds are Oithona spp., Acartia spp., Longipedia spp., Cyclops spp. and others.
The study in razor clam area was carried out before and after the razor clam season.
According to the study, they were 14 species commonly found before the razor clam
season. The example of species found before razor clam season are Oi/hona spp.,
Pseudocalanus spp., Paracalanus spp. and Ameira spp. The common taxa found during
razor clam season at Asajaya Laut is nauphli copepods, Thespesiopsyl/us spp., spionid
larvae and bivalve larvae. Foraminifera, Bivalvia larvae, spionid larvae and Gastropoda
larvae are the common species found at Pasir Puteh.
Based on the study done at Batang Lupar, there are 6 taxa were documented (Suhartina,
2007). Taxa of zooplankton that has been documented such as copepod, polycheate,
cumacea, branchyura, gastropoda and mysidacea.
8
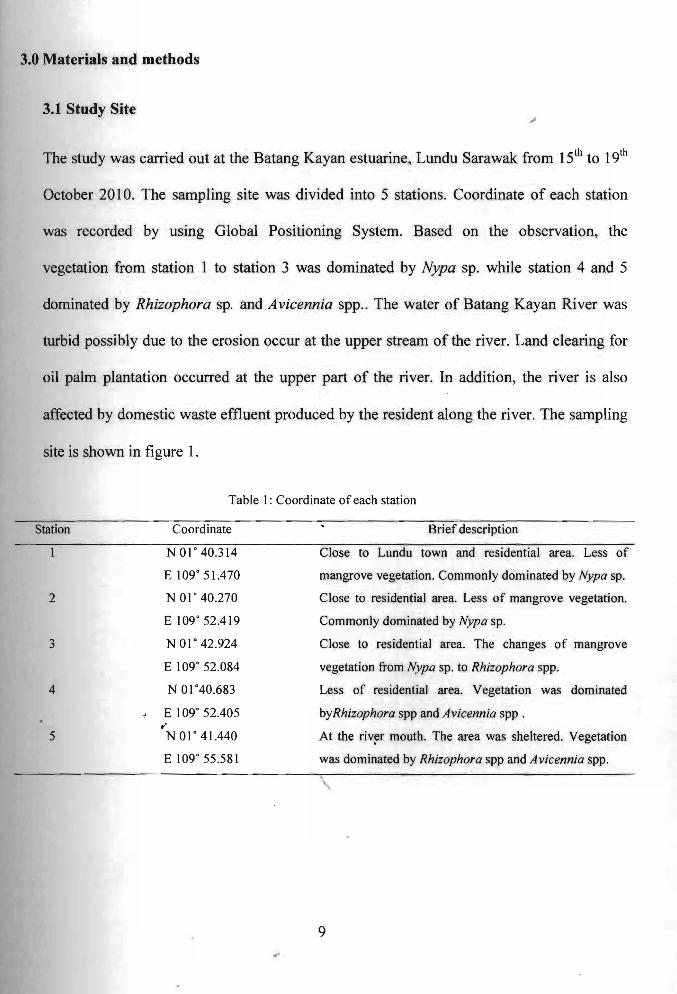
3.0 Materials and methods
3.1 Study Site
The study was carried out at the Batang Kayan estuarine, Lundu Sarawak from 15th to 19th
October 2010. The sampling site was divided into 5 stations. Coordinate of each station
was recorded by using Global Positioning System. Based on the observation, the
vegetation from station 1 to station 3 was dominated by Nypa sp. while station 4 and 5
dominated by Rhizophora sp. and Avicennia spp.. The water of Batang Kayan River was
turbid possibly due to the erosion occur at the upper stream of the river. Land clearing for
oil palm plantation occurred at the upper part of the river. In addition, the river is also
affected by domestic waste effluent produced by the resident along the river. The sampling
site is shown in figure 1.
Table I: Coordinate of each station
Station Coordinate Brief description
NOlO 40.314
E 109° 51.470
2 N 01" 40.270
E 109° 52.419
3 NOl o 42.924
E 109° 52.084
4 N 01°40.683
E 109° 52.405 r'
5 NOl o 41.440
E 109° 55.581
Close to Lundu town and residential area. Less of
mangrove vegetation. Commonly dominated by Nypa sp.
Close to residential area. Less of mangrove vegetation.
Commonly dominated by Nypa sp.
Close to residential area. The changes of mangrove
vegetation from Nypa sp. to Rhizophora spp.
Less of residential area. Vegetation was dominated
byRhizophora spp and Avicennia spp .
At the riv~r mouth. The area was sheltered. Vegetation
was dominated by Rhizophora spp and Avicennia spp.
9
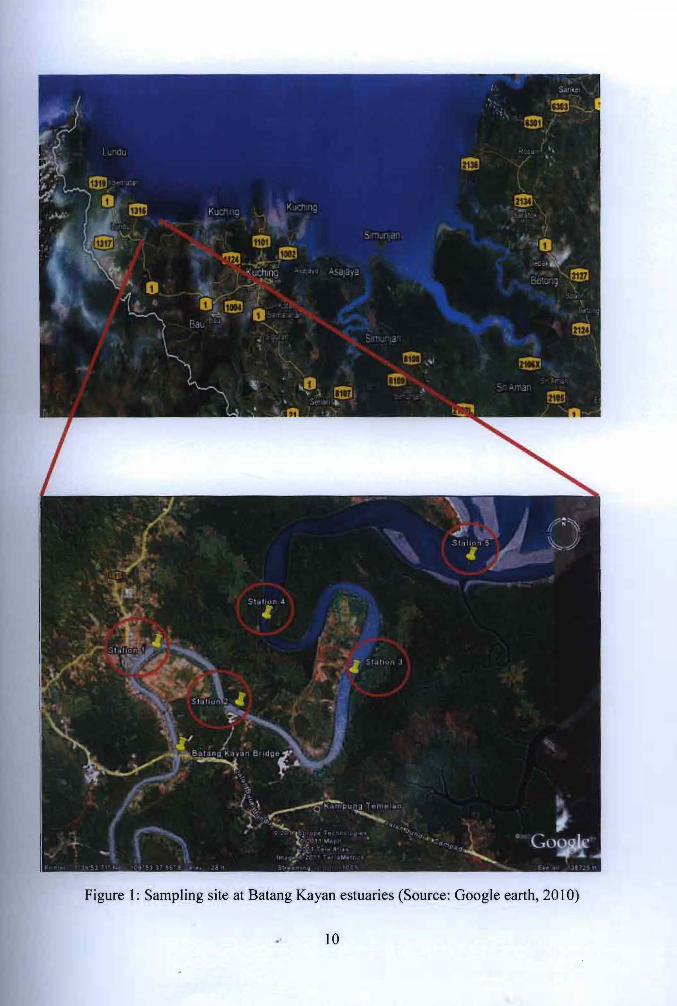
Figure I: Sampling site at Batang Kayan estuaries (Source: GoogJe earth, 20 I 0)
10
3.2 Zooplankton sampling
The zooplankton sampling was carried out during high tides due to obtained estuary ~
zooplankton. The mesh size of plankton net which has been used was 100 Ilm. Flow meter
was placed at the mouth of the plankton net. Two replicate of zooplankton was collected for
both distributions.
3.2.1 Vertical distribution
For vertical distribution sampling, initial reading of the flow meter was recorded.
Then, the plankton net was dropped down into the water up to 3.35 m (11 ft). Next,
plankton net was pulled with moderate speed. The final reading of flow meter was
recorded right after the plankton net was completely pulled out from the water. Then,
the sample was put in the Nasco whirl-pak plastic bag and preserved using Lugol's
solution. Lastly, the sample was labeled according to each station. Two rep~icate of .
sample were collected at every station (Goswami, 2004).
3.2.2 Horizontal distribution
For horizontal distribution sampling, initial reading of flow meter was recorded before
towed. After that, plankton net was towed horizontally for 5 minute at every station.
The time was recorded exactly right after the plankton net was towed. Then, plankton
net was pulled out after 5 minute and the final reading of flow meter was recorded. The
sample was put in Nesco whirl-pak plastic and preserved using Lugol's solution. Two
replicate of sample were collected at every station (Goswami, 2004).
11
3.3 Physico-chemical parameters
The water parameter such as dissolved oxygen (DO), pH and temperature were recorded in ".
situ by using Eutech instrument (Model PCD 650) while the turbidity was measured using
Eutech turbidity (Model TN-I 00) and salinity was measured using Hand refractometer (Model
Atago S-10). The reading of water quality parameters were taken triplicates and the average
value were recorded. Three replicate of water quality was recorded for the accurate reading.
3.4 Laboratory works
3.4.1 Sieving
The samples ware sieved using 100 !lm mesh size sieve to drain out the water sample.
Any organism that retained on the sieve was transfer to specimen container which
filled by distilled water.
3.4.2 Sub-sample, sorting and counting
After sieving process, the sample was subsampled using Folsom's Splitter. The
samples were divided into equal half. A half of sample was poured onto petri dish and
observed under Stereo Microscope (RaxVision Model: S 42904). The different shapes
ofzooplankton were separated and enumeratyd.
12
3.4.3 Species identification of zooplankton
For identification process, a sample from each taxa was sorted out and placed on the .. prepared slide. Then, the sample was observed under compound microscope (LEICA
CME). The guide books and journals for the zooplankton identification was 'Marine
Plankton' by NeweU (1979) , 'A guide to identification of Decapoda, Euphausiacea
and Mysidacea from the Southern Beaufort Sea' by Keast and Lawrence (1990) and
'Zooplankton Identification Guide' by Yamaguchi and Bell (2007).
3.5 Data analysis
i) Species richness (D) was to measure of the number of species found in a
sample. Species richness was calculated by using Margalef index (Margalef,
1958).
Marga]ef index (Margalef, 195~).
(S-1)Dr=-
Ln N
Where, S = total number of species in a sample.
N = total number of individual in a sample.
13
ii) Shannon-Weiner Index (H') to calculate the species diversity in certain area.
Shannon-Weiner Index (H') (Poole, 1974)
H'= -Lf=l Pi logz Pi
n Pi=
N
Where s= number of species found in a sample,
n= total of individual one species in a sample
N= total number of all species in the sample.
iii) Species evenness (1) was to determine the species dominance in a certain area.
Species evenness was calculateo by using Pielou Index (Pielou, 1975)
Pielou Index (Pielou, 1975)
HI! 1'---
Ln S
•Where H'= species diversity
S = the number of, species
14