Embed Size (px)
Citation preview
Finance a úv r - Czech Journal of Economics and Finance, 57, 2007, no. 7-8 341
UDC: 336.761 JEL Classification: C23, G15, G12 Keywords: beta convergence, new EU member states, sigma convergence, stock markets
Financial Integration of Stock Markets among New EU Member States and the Euro Area * Ian BABETSKII – Czech National Bank, Prague; CERGE-EI, Charles University, Prague;
and CES, Université Paris 1 Panthéon Sorbonne ([email protected]), ([email protected])
Luboš KOMÁREK – Czech National Bank, Prague, and Prague School of Economics ([email protected]), ([email protected])
Zlatuše KOMÁRKOVÁ – Czech National Bank, Prague ([email protected]), ([email protected])
Abstract The paper considers the empirical dimension of financial integration among stock-ex-change markets in four new European Union member states (Czech Republic, Hungary, Poland, and Slovakia) in comparison with the euro area. The main objective is to test for the existence and determine the degree of the four states’ financial integration relative to the euro currency union. The analysis is performed at the country level (using national stock-exchange indices) and at the sectoral level (considering banking, chemical, elec-tricity, and telecommunication indices). Our empirical evaluation consists of (1) a har-monization analysis (by means of standard and rolling correlation analysis) to outline the overall pattern of integration; (2) the application of the concept of beta convergence (through the use of time series, panel, and state-space techniques) to identify the speed of integration; and (3) the application of so-called sigma convergence to measure the de-gree of integration. We find evidence of respective stock-market integration on both na-tional and sectoral levels between the Czech Republic, Hungary, Poland, and the euro area.
1. Introduction In a monetary union, integration of financial markets (e.g. money, credit, bond,
and equity markets) plays the key role in assuring the effective transmission of a com-mon monetary policy. The importance of conducting an assessment of the degree of financial integration across the euro area member countries is stressed by the Euro-pean Central Bank – see (Baele et al., 2004). As financial markets expand, their fluc-tuations have stronger effects on real economic variables such as, e.g., private con-sumption. Along with a number of benefits, financial integration brings certain costs; a detailed discussion of the costs and benefits of financial integration is provided by Agénor (2003). It is widely believed that benefits outweigh costs, provided that the mechanisms of controlling for financial stability are implemented.
Joining the euro area without a sufficient degree of financial market integra-tion can cause problems in terms of transmission of a common monetary policy and
* This paper represents the authors’ own views and do not necessarily reflect those of their institutions.However, all errors and omissions remain entirely the fault of the authors. The research is supported by the Czech National Bank research project No. C1/07 and partly by the Grant Agency of the Czech Re-public within a project No. 402/05/2758.
342 Finance a úv r - Czech Journal of Economics and Finance, 57, 2007, no. 7-8
common shocks. A high degree of financial market integration implies that euro-area- -wide shocks dominate; hence, a common monetary policy can be effectively applied to react to common shocks. On the other hand, in the case of weak financial market integration local (i.e. country-specific) shocks prevail, which diminishes the effec-tiveness of a common monetary policy. In the case of new EU member states, which are committed to adopting the euro at some point, it is especially important to ana-lyze the alignment of their markets including the financial ones with those of the euro area countries.
This paper focuses on financial integration among stock exchange markets in four new EU member states (the Czech Republic, Hungary, Poland and Slovakia) in com-parison with the euro area. As stock markets grow in size, they represent an incresingly important but not yet well-examined segment of the financial system. Our main objec-tive is to test for the existence and determine the degree of financial integration of the se-lected new member states relative to the euro area. The empirical analysis is conducted at the country level (using national stock exchange indices) and at the sectoral level (considering banking, chemical, electricity and telecommunications indices).
How can the degree of financial market integration be measured in practice? Financial market integration is a broad concept. Baele et al. (2004) propose to quantify financial integration using three main dimensions, namely (i) price-based, (ii) news- -based and (iii) quantity-based measures. The first class of measures could be viewed as the direct check of the law of one price on the condition that the compared assets have similar characteristics. Price-based measures can then be quantified by means of, e.g., beta and sigma convergence. The second class of measures makes it possible to identify existing market imperfections such as frictions and barriers, due to the reason that in the integrated area new information of a local character should have a smaller impact on particular assets than global news. The third class of mea-sures quantifies the effects of mainly legal and other non-price frictions and barriers from both the supply and demand sides of the investment decision-taking process.1
In this paper we make use of the price-based approach to measure stock mar-ket integration, while fully acknowledging the importance of alternative measures.2Adam et al. (2002) argue that “financial markets are integrated when the law of one price holds”.3 Given this definition, stock market integration implies convergence of returns on assets that are issued in different countries and generate identical cash flows – see (Adjouté, Danthine, 2003), (Baele et al., 2004), (Bekaert, Harvey, 1997). In a hypothetical example of perfectly integrated stock markets, assets which have the same risk factor and yield are priced identically by markets, regardless of the par-ticular location where such assets are traded. Identifying such assets is a difficult task, however.
In reality, the law of one price could not hold true in the case of different as-sets, i.e. different national stock exchange indices, which are calculated based not on
1 The European Commission (1997) finds that coordination and harmonization of capital market rules andconventions appear to be less important than for other financial markets before introduction of the euro. Nevertheless, a high degree of integration can not be achieved without a successful harmonization process. 2 New-based and quantity-based measures require the use of different data and estimation techniques; suchan analysis could be a subject for future research. 3 See also (Baele et al., 2004) and (Goldberg, Verboven, 2001).
Finance a úv r - Czech Journal of Economics and Finance, 57, 2007, no. 7-8 343
the same underlying stock exchange assets. In addition, the law of one price does not necessarily hold true in the presence of market frictions. Nevertheless, while the law of one price represents rather a very long-term phenomenon, an alternative argument of why we could expect equalization of stock market returns in the long- to medium- -run is based on the Walras law of markets as applied to the financial system: if n–1(financial) markets are in equilibrium (i.e. exchange rate, money, bond markets), then the last (stock exchange) market cannot be in disequilibrium. Another reason for con-vergence in stock market returns is based on the practical investor’s point of view, when assets are considered on sectoral rather than on national levels. Indeed, invest-ments of many funds are made based on the general index, which includes shares of different territories (for example, the Morgan Stanley Capital International index, MSCI). It is for this reason that we include in our analysis both national and sectoral stock market indices.
Notice that even if the underlying assets are not identical, comparing asset re-turns gives insight into their degree of synchronicity. Co-movement between asset returns could then be due to the similarity of the underlying assets, due to common shocks, or because of the mixture of both effects.
This paper addresses the following three main questions, similar to those earlier raised by Adam et al. (2002) with respect to the euro area: (i) Is there a con-vergence of stock markets between the Czech Republic, Hungary, Poland and Slova-kia on one side and the euro area on the other side? (ii) If there is convergence, how fast it is? (iii) How does the degree of financial market convergence change over time at the national and sectoral levels? In particular, are there any effects related to the announcement of EU enlargement or to the EU enlargement itself?
The structure of the paper is as follows. Section 2 briefly discusses the rele-vant literature focusing on the integration of stock markets. Section 3 provides sty-lized facts on the development of the EU-4 stock exchange markets at the national level and at the level of four industrial sectors (banking, chemical, electricity and telecommunications). Section 4 provides a discussion of the theoretical approaches for estimating financial integration. Section 5 shows empirical evaluation of the fi-nancial integration by using the time series, panel, and state-space techniques. Sec-tion 6 concludes.
2. Review of the Literature The research on stock market integration is largely conducted as applied to
the developed OECD countries and the Asian emerging markets. With regard to Western Europe, analysis of capital markets integration on national levels is reported by the European Commission (1999) and by Hartmann, Maddaloni and Manganelli (2003); the analysis on national and sectoral levels is performed by Baca, Garbe and Weiss (2000) and Heston and Rouwenhorst (1995). Portes and Rey (2005) employ the gravity equation framework to describe the determinants of cross-border equity flows. A new aspect – change of integration over time – is introduced by Bekaert and Harvey (1995), who construct a time-varying measure of financial integration. Over-all, their results show what world capital markets are becoming more integrated. Yet on the individual country level there are some cases of declining integration. Apply-ing an alternative time-varying approach, Ayuso and Blanco (2000) find that fi-
344 Finance a úv r - Czech Journal of Economics and Finance, 57, 2007, no. 7-8
nancial market integration between the stock markets of the euro area countries increased during the 1990s. Besides this, Bekaert, Campbell and Lumsdaine (2000) find that when structural breaks in the series are accounted for, the degree of in-tegration among emerging equity markets is higher than it was thought before. The impact of the introduction of the euro on capital markets has been studied by, for example, Hardouvelis, Malliaropulos and Priestley (2006). The degree of integration is found to have increased along with the formation of the European Monetary Union (EMU), particularly since 1995.
A number of studies evaluate the extent of stock market integration in non- -OECD countries. Piesse and Hearn (2002) employ the co-integration approach to test for long-run relationships and Granger causality links between equity market indices in the Southern Africa Customs Union countries. Several cases of co-integration are reported. Applying similar techniques, Azman-Saini et al. (2002) find limited evi-dence of long-run relationships among five Asian equity markets. Yang et al. (2003) present further evidence on co-movements among ten Asian emerging stock markets and in relation to the U.S. and Japan. A distinction is made between long- and short- -run linkages and the Asian financial crisis of 1997–1998 is explicitly controlled for. The degree of integration among Asian countries is found to increase for a post- -crisis period; particularly strong financial linkages are detected during the crisis episode.
Evidence of stock market integration among transition countries, especially those in Central and Eastern Europe (CEE), remains relatively scarce. Using cor-relation analysis, Horská (2005) finds that the correlation among the Czech, U.S., and European stock markets increased in time, which restricting the room for portfolio diversification. Hanousek and Filer (2000) identify interconnections between fluc-tuations in equity market returns and economic variables in selected CEE countries. An application of conditional heteroscedasticity (GARCH) analysis to stock market indices in the CEE region in relation to the G-7 is reported by Égert and Kouba (2004). Stock markets in the CEE region are found to exhibit more asymmetry and volatility as compared to the G-7. Dvo ák and Podpiera (2006) examine a relatively recent phenomenon – a rise in stock market prices in the accession countries fol-lowed the announcement of the European Union enlargement. It was found that about one-fifth of the observed stock price increases were found related to the decreasing market premium in the CEE region. Syllignakis and Kouretas (2006) find evidence of co-integration among stock markets of the selected CEE countries relative to Ger-many and the U.S; in the short-run, cross-country stock market links are stronger du-ring the periods of, e.g., the Asian and Russian crises.
Cappiello et al. (2006) carry out the analysis of returns on equity market in-dices. The results suggest that integration of the new EU member states with the euro area increased during the process of EU accession. The Czech Republic, Hungary and Poland are found to exhibit return co-movements both between themselves and with the euro area. A study of co-movements between stock markets in these three Central and Eastern European countries (CEECs), on the one hand, and between the CEECs and Western European countries also represents a subject of research of Égert and Ko enda (2005). Evidence from intraday data reveals no robust co-inte-gration relationship for either intra-CEEC or CEEC-Western European stock market linkages. The results suggest that it is rather transmission of volatility of returns, not
Finance a úv r - Czech Journal of Economics and Finance, 57, 2007, no. 7-8 345
linkages in the levels of returns, which occurs in reality. Using similar intraday data of stock market indices, erný (2004) does not find a co-integration relationship except in one particular pair of indices. However, the applied Granger causality tests show that the stock markets in Warsaw and Prague do react to price fluctuations stemming from the stock market in Frankfurt, not vice versa. Interestingly, the delay with which such fluctuations transmit from Frankfurt is about 30 minutes for the Prague market and nearly one hour for the one in Warsaw. While most of the available studies focus on national stock market indices, to our knowledge no study attempts to compare inte-gration on national and sectoral levels. There is also limited evidence on the effects of EU enlargement or the announcement thereof on stock market dynamics in new EU member states. Our study contributes to filling this gap in the empirical literature.
3. Development on the EU-4 Stock Exchange Markets: Stylized Facts 3.1 National Stock Exchange Indices
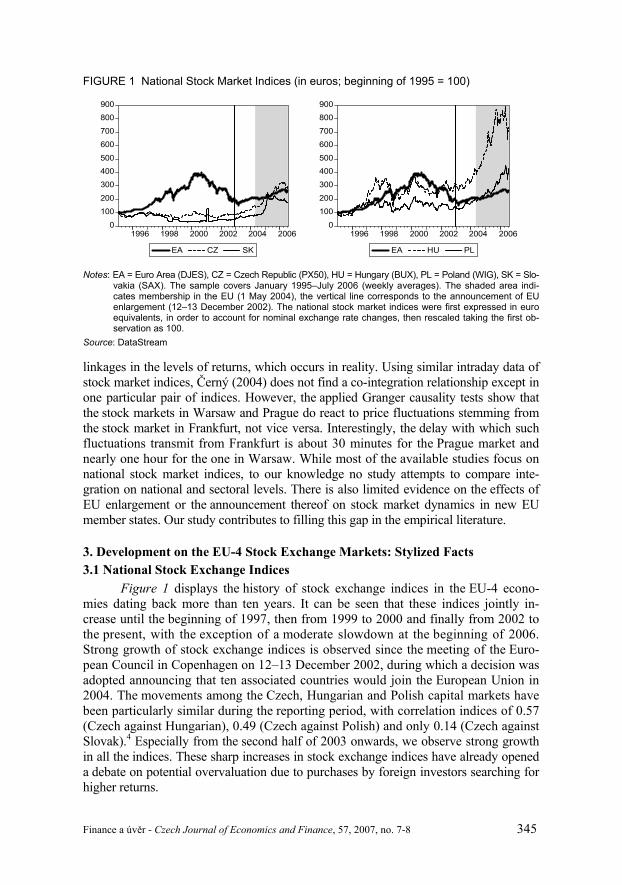
Figure 1 displays the history of stock exchange indices in the EU-4 econo-mies dating back more than ten years. It can be seen that these indices jointly in-crease until the beginning of 1997, then from 1999 to 2000 and finally from 2002 to the present, with the exception of a moderate slowdown at the beginning of 2006. Strong growth of stock exchange indices is observed since the meeting of the Euro-pean Council in Copenhagen on 12–13 December 2002, during which a decision was adopted announcing that ten associated countries would join the European Union in 2004. The movements among the Czech, Hungarian and Polish capital markets have been particularly similar during the reporting period, with correlation indices of 0.57 (Czech against Hungarian), 0.49 (Czech against Polish) and only 0.14 (Czech against Slovak).4 Especially from the second half of 2003 onwards, we observe strong growth in all the indices. These sharp increases in stock exchange indices have already opened a debate on potential overvaluation due to purchases by foreign investors searching for higher returns.
FIGURE 1 National Stock Market Indices (in euros; beginning of 1995 = 100)
0
100
200
300
400
500
600
700
800
900
1996 1998 2000 2002 2004 2006
EA CZ SK
0
100
200
300
400
500
600
700
800
900
1996 1998 2000 2002 2004 2006
EA HU PL
Notes: EA = Euro Area (DJES), CZ = Czech Republic (PX50), HU = Hungary (BUX), PL = Poland (WIG), SK = Slo-vakia (SAX). The sample covers January 1995–July 2006 (weekly averages). The shaded area indi-cates membership in the EU (1 May 2004), the vertical line corresponds to the announcement of EU enlargement (12–13 December 2002). The national stock market indices were first expressed in euro equivalents, in order to account for nominal exchange rate changes, then rescaled taking the first ob-servation as 100.
Source: DataStream
346 Finance a úv r - Czech Journal of Economics and Finance, 57, 2007, no. 7-8
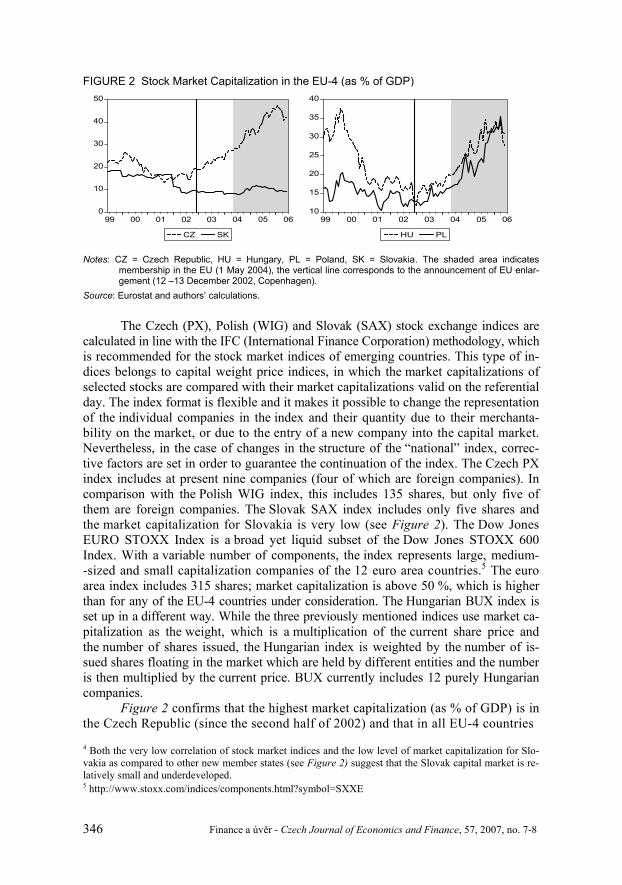
The Czech (PX), Polish (WIG) and Slovak (SAX) stock exchange indices are calculated in line with the IFC (International Finance Corporation) methodology, which is recommended for the stock market indices of emerging countries. This type of in-dices belongs to capital weight price indices, in which the market capitalizations of selected stocks are compared with their market capitalizations valid on the referential day. The index format is flexible and it makes it possible to change the representation of the individual companies in the index and their quantity due to their merchanta-bility on the market, or due to the entry of a new company into the capital market. Nevertheless, in the case of changes in the structure of the “national” index, correc-tive factors are set in order to guarantee the continuation of the index. The Czech PX index includes at present nine companies (four of which are foreign companies). In comparison with the Polish WIG index, this includes 135 shares, but only five of them are foreign companies. The Slovak SAX index includes only five shares and the market capitalization for Slovakia is very low (see Figure 2). The Dow Jones EURO STOXX Index is a broad yet liquid subset of the Dow Jones STOXX 600 Index. With a variable number of components, the index represents large, medium- -sized and small capitalization companies of the 12 euro area countries.5 The euro area index includes 315 shares; market capitalization is above 50 %, which is higher than for any of the EU-4 countries under consideration. The Hungarian BUX index is set up in a different way. While the three previously mentioned indices use market ca-pitalization as the weight, which is a multiplication of the current share price and the number of shares issued, the Hungarian index is weighted by the number of is-sued shares floating in the market which are held by different entities and the number is then multiplied by the current price. BUX currently includes 12 purely Hungarian companies.
Figure 2 confirms that the highest market capitalization (as % of GDP) is in the Czech Republic (since the second half of 2002) and that in all EU-4 countries 4 Both the very low correlation of stock market indices and the low level of market capitalization for Slo-vakia as compared to other new member states (see Figure 2) suggest that the Slovak capital market is re-latively small and underdeveloped. 5 http://www.stoxx.com/indices/components.html?symbol=SXXE
FIGURE 2 Stock Market Capitalization in the EU-4 (as % of GDP)
Notes: CZ = Czech Republic, HU = Hungary, PL = Poland, SK = Slovakia. The shaded area indicates membership in the EU (1 May 2004), the vertical line corresponds to the announcement of EU enlar-gement (12 –13 December 2002, Copenhagen).
Source: Eurostat and authors’ calculations.
10
15
20
25
30
35
40
99 00 01 02 03 04 05 06
HU PL
0
10
20
30
40
50
99 00 01 02 03 04 05 06
CZ SK
Finance a úv r - Czech Journal of Economics and Finance, 57, 2007, no. 7-8 347
the levels are increasing (strongly in the Czech Republic, Hungary and Poland, and weakly in Slovakia), while remaining below the euro area level (approximately 50 %). The Slovak stock exchange market plays a minor role compared to those in the other EU-4 countries.
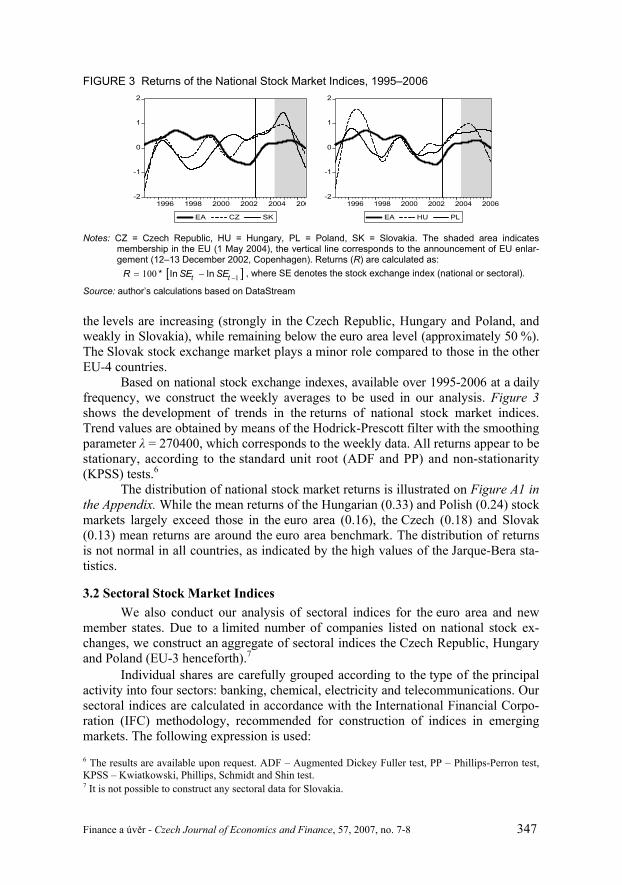
Based on national stock exchange indexes, available over 1995-2006 at a daily frequency, we construct the weekly averages to be used in our analysis. Figure 3shows the development of trends in the returns of national stock market indices. Trend values are obtained by means of the Hodrick-Prescott filter with the smoothing parameter = 270400, which corresponds to the weekly data. All returns appear to be stationary, according to the standard unit root (ADF and PP) and non-stationarity (KPSS) tests.6
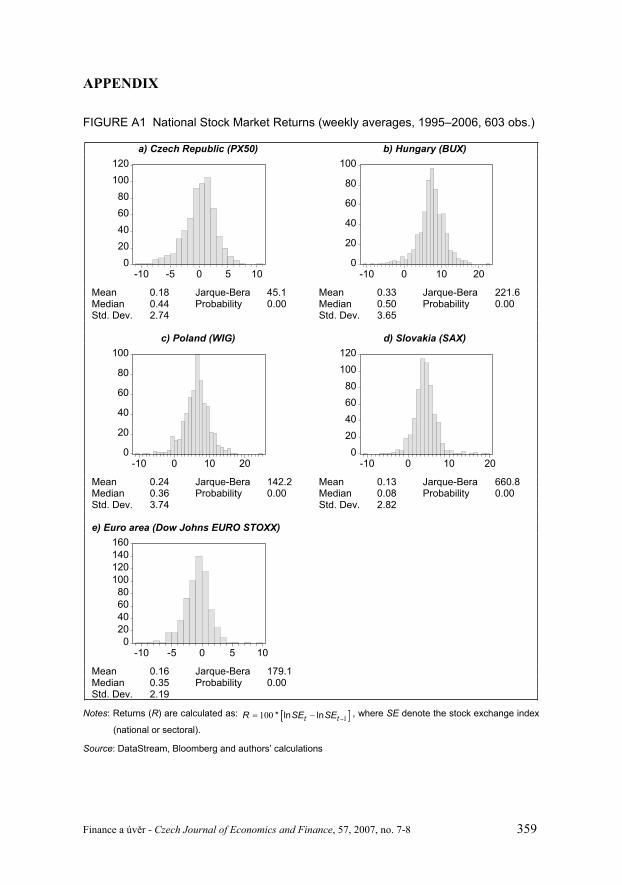
The distribution of national stock market returns is illustrated on Figure A1 in the Appendix. While the mean returns of the Hungarian (0.33) and Polish (0.24) stock markets largely exceed those in the euro area (0.16), the Czech (0.18) and Slovak (0.13) mean returns are around the euro area benchmark. The distribution of returns is not normal in all countries, as indicated by the high values of the Jarque-Bera sta-tistics.
3.2 Sectoral Stock Market Indices We also conduct our analysis of sectoral indices for the euro area and new
member states. Due to a limited number of companies listed on national stock ex-changes, we construct an aggregate of sectoral indices the Czech Republic, Hungary and Poland (EU-3 henceforth).7
Individual shares are carefully grouped according to the type of the principal activity into four sectors: banking, chemical, electricity and telecommunications. Our sectoral indices are calculated in accordance with the International Financial Corpo-ration (IFC) methodology, recommended for construction of indices in emerging markets. The following expression is used:
FIGURE 3 Returns of the National Stock Market Indices, 1995–2006
-2
-1
0
1
2
1996 1998 2000 2002 2004 200
EA CZ SK
-2
-1
0
1
2
1996 1998 2000 2002 2004 2006
EA HU PL
Notes: CZ = Czech Republic, HU = Hungary, PL = Poland, SK = Slovakia. The shaded area indicates membership in the EU (1 May 2004), the vertical line corresponds to the announcement of EU enlar-gement (12–13 December 2002, Copenhagen). Returns (R) are calculated as:
1100 * ln lnt tR SE SE , where SE denotes the stock exchange index (national or sectoral).
Source: author’s calculations based on DataStream
6 The results are available upon request. ADF – Augmented Dickey Fuller test, PP – Phillips-Perron test, KPSS – Kwiatkowski, Phillips, Schmidt and Shin test. 7 It is not possible to construct any sectoral data for Slovakia.

348 Finance a úv r - Czech Journal of Economics and Finance, 57, 2007, no. 7-8
( )Index( ) ( ) 1000(0)
M tt K tM
(1)
where K(t) is the chaining factor at time t, which accounts for changes in the base of the index. For the initial observation – 6 January 1995 in our case – K(0) is set to unity; M(0) is the initial market capitalization – 6 January 1995 in our case; M(t), ca-pitalization at time t is defined as:
( )
1( ) ( ) ( )
N t
i ii
M t q t p t (2)
where ( )iq t denotes the number of i-th basic share, ( )ip t is the close price of the i-th basic emission, and N(t) is the number of basic emissions at time t. In each sector the number of basic shares ( )iq t is weighted by the country’s GDP level. The num-ber of basic shares does not change over time.
Figure 4 shows the development of four EU-3 sectoral indices, which are com-pared with the euro area sectoral stock market indices. As can be seen, after the an-nouncement of EU enlargement (12–13 December 2002 in Copenhagen) banking sec-tor indices developed nearly identically. This period also coincides with privatization
FIGURE 4 Sectoral Stock Market Indices (in euros; beginning of 1995 = 100)
50
100
150
200
250
300
350
400
1996 1998 2000 2002 2004
BANKING_EA BANKING_EU-3
0
100
200
300
400
1996 1998 2000 2002 2004
CHEMICAL_EA CHEMICAL_EU-3
0
100
200
300
400
1996 1998 2000 2002 2004
ELECTRICITY_EA ELECTRICITY_EU-3
0
200
400
600
800
1000
1200
1400
1996 1998 2000 2002 2004
TELECOM_EA TELECOM_EU-3
Notes: EA = euro area, EU-3 = Czech Republic, Hungary and Poland. The sample covers January 1995– –March 2006 (weekly averages). The shaded area indicates membership in the EU (1 May 2004), the vertical line corresponds to the announcement of EU enlargement (12–13 December 2002, Copen-hagen).
Source: DataStream and Bloomberg
Finance a úv r - Czech Journal of Economics and Finance, 57, 2007, no. 7-8 349
of the large commercial banks. Other sectoral indices also show patterns similar to the euro area indices.
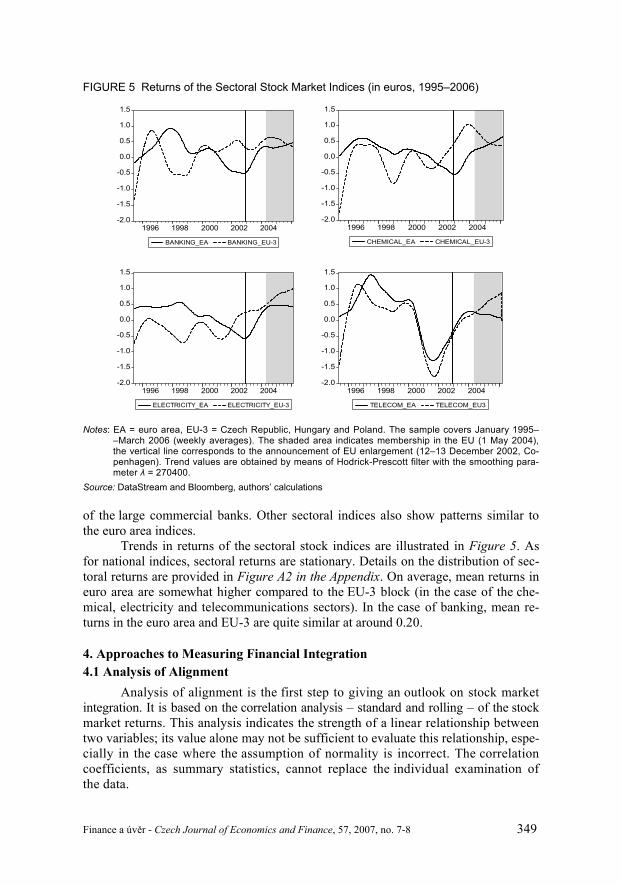
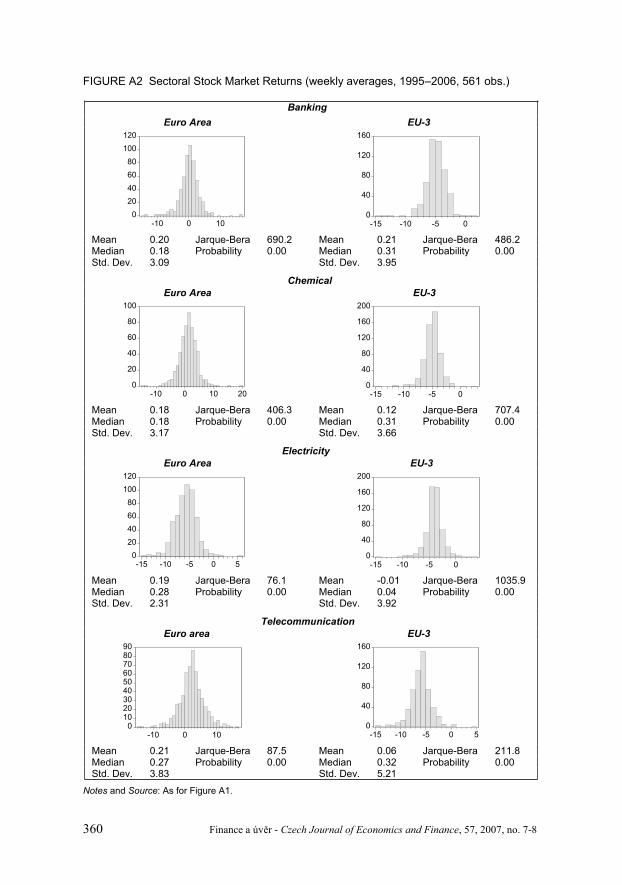
Trends in returns of the sectoral stock indices are illustrated in Figure 5. As for national indices, sectoral returns are stationary. Details on the distribution of sec-toral returns are provided in Figure A2 in the Appendix. On average, mean returns in euro area are somewhat higher compared to the EU-3 block (in the case of the che-mical, electricity and telecommunications sectors). In the case of banking, mean re-turns in the euro area and EU-3 are quite similar at around 0.20.
4. Approaches to Measuring Financial Integration 4.1 Analysis of Alignment
Analysis of alignment is the first step to giving an outlook on stock market integration. It is based on the correlation analysis – standard and rolling – of the stock market returns. This analysis indicates the strength of a linear relationship between two variables; its value alone may not be sufficient to evaluate this relationship, espe-cially in the case where the assumption of normality is incorrect. The correlation coefficients, as summary statistics, cannot replace the individual examination of the data.
FIGURE 5 Returns of the Sectoral Stock Market Indices (in euros, 1995–2006)
-2.0
-1.5
-1.0
-0.5
0.0
0.5
1.0
1.5
1996 1998 2000 2002 2004
BANKING_EA BANKING_EU-3
-2.0
-1.5
-1.0
-0.5
0.0
0.5
1.0
1.5
1996 1998 2000 2002 2004
CHEMICAL_EA CHEMICAL_EU-3
-2.0
-1.5
-1.0
-0.5
0.0
0.5
1.0
1.5
1996 1998 2000 2002 2004
ELECTRICITY_EA ELECTRICITY_EU-3
-2.0
-1.5
-1.0
-0.5
0.0
0.5
1.0
1.5
1996 1998 2000 2002 2004
TELECOM_EA TELECOM_EU3
Notes: EA = euro area, EU-3 = Czech Republic, Hungary and Poland. The sample covers January 1995– –March 2006 (weekly averages). The shaded area indicates membership in the EU (1 May 2004), the vertical line corresponds to the announcement of EU enlargement (12–13 December 2002, Co-penhagen). Trend values are obtained by means of Hodrick-Prescott filter with the smoothing para-meter = 270400.
Source: DataStream and Bloomberg, authors’ calculations
350 Finance a úv r - Czech Journal of Economics and Finance, 57, 2007, no. 7-8
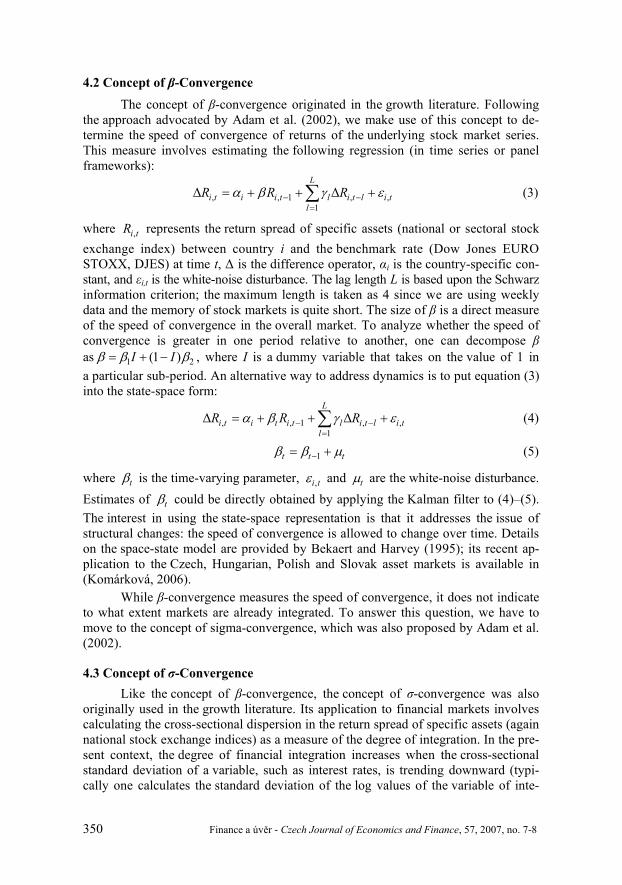
4.2 Concept of -ConvergenceThe concept of -convergence originated in the growth literature. Following
the approach advocated by Adam et al. (2002), we make use of this concept to de-termine the speed of convergence of returns of the underlying stock market series. This measure involves estimating the following regression (in time series or panel frameworks):
, , 1 , ,1
L
i t i i t l i t l i tl
R R R (3)
where ,i tR represents the return spread of specific assets (national or sectoral stock exchange index) between country i and the benchmark rate (Dow Jones EURO STOXX, DJES) at time t, is the difference operator, i is the country-specific con-stant, and i,t is the white-noise disturbance. The lag length L is based upon the Schwarz information criterion; the maximum length is taken as 4 since we are using weekly data and the memory of stock markets is quite short. The size of is a direct measure of the speed of convergence in the overall market. To analyze whether the speed of convergence is greater in one period relative to another, one can decompose as 1 2(1 )I I , where I is a dummy variable that takes on the value of 1 in a particular sub-period. An alternative way to address dynamics is to put equation (3) into the state-space form:
, , 1 , ,1
L
i t i t i t l i t l i tl
R R R (4)
1t t t (5)
where t is the time-varying parameter, ,i t and t are the white-noise disturbance. Estimates of t could be directly obtained by applying the Kalman filter to (4)–(5). The interest in using the state-space representation is that it addresses the issue of structural changes: the speed of convergence is allowed to change over time. Details on the space-state model are provided by Bekaert and Harvey (1995); its recent ap-plication to the Czech, Hungarian, Polish and Slovak asset markets is available in (Komárková, 2006).
While -convergence measures the speed of convergence, it does not indicate to what extent markets are already integrated. To answer this question, we have to move to the concept of sigma-convergence, which was also proposed by Adam et al. (2002).
4.3 Concept of -Convergence Like the concept of -convergence, the concept of -convergence was also
originally used in the growth literature. Its application to financial markets involves calculating the cross-sectional dispersion in the return spread of specific assets (again national stock exchange indices) as a measure of the degree of integration. In the pre-sent context, the degree of financial integration increases when the cross-sectional standard deviation of a variable, such as interest rates, is trending downward (typi-cally one calculates the standard deviation of the log values of the variable of inte-
Finance a úv r - Czech Journal of Economics and Finance, 57, 2007, no. 7-8 351
rest). If the cross-sectional distribution collapses to a single point, and the standard deviation converges to zero, full integration is achieved.
For quantification of -convergence, a calculation is used of the (cross-sec-tion) standard deviation ( ), according to the formula:
2
1
1 log1
N
t it ti
y yN
(6)
where yit is the yield on asset i at time t, and ty is the cross-section mean yield at time t. Index i can stand for separate countries or sectors (i = 1, 2, …, N). For the pur-poses of this analysis, we introduce N = 2, i.e. we examine development of the -con-vergence over time between the euro area and one of the countries under review (in the case of national indices) and between the euro area and EU-3 aggregate (when considering sectoral indices). The value of takes only a positive value in theory. The lower is, the higher the level of convergence that has been reached. In theory, full integration is reached, where the standard deviation is zero, while high (several- -digit) values of reflect a very low degree of integration. For the chart-type expres-sion, the results were filtered using the Hodrick-Prescott filter with the recommended weekly time series coefficient = 270400.
It is important to note that the two convergence indicators have different in-formational contents: -convergence does not imply -convergence. In fact, -con-vergence could even be associated with -divergence see (Quah, 1993) for further details on this issue. Therefore, we propose both notions of convergence to assess financial integration.
- and -convergence are estimated for the EU-4 countries on the national level and EU-3 countries on the sectoral level. Since the number of observations for each country is substantially greater than the number of cross-section units, the model described by (1) is estimated using a method suitable for time-series panel data. There are essentially two procedures applied to time-series panels. At one extreme, one can estimate each equation separately for each country and then look at the dis-tribution of the estimated coefficients across countries. One can thus be looking at the mean, median or mode of the distribution where the mean would be of primary interest. However, such an estimator does not take into account the possible homoge-neity of some coefficients across countries. At the other extreme are the traditional panel data estimators, e.g. the fixed effect estimator, which allows the intercepts to vary across countries while constraining all the other coefficients, including the error variance, to be the same. In our study we use both approaches and compare their results.
5. Empirical Results 5.1 Analysis of Alignment
Simple period-average correlations of stock market returns, shown in Table 1,indicate that the Czech, Hungarian and Polish markets are strongly linked, on the one hand among themselves (correlation from 0.49 to 0.60), on the other hand vis-à-vis the euro area (correlation in the range of 0.42–0.50). The respective pair-wise cor-relation coefficients are all significant at the 1% level. In contrast, the Slovak stock

352 Finance a úv r - Czech Journal of Economics and Finance, 57, 2007, no. 7-8
market stands apart: its returns appear to be uncorrelated to those in the euro area (coefficient 0.06, insignificant) and only weakly correlated with returns in other new EU member states (low correlation of 0.09–0.14, though significant at the 1%–5% level).
Correlation between euro area and EU-3 returns on the sectoral level are illustrated in Table 2. All correlations are significant at the 1% level. The banking sector is characterized by the highest correlation (0.45), followed by the telecommu-nications (0.32), chemical (0.31) and electricity (0.22) sectors.
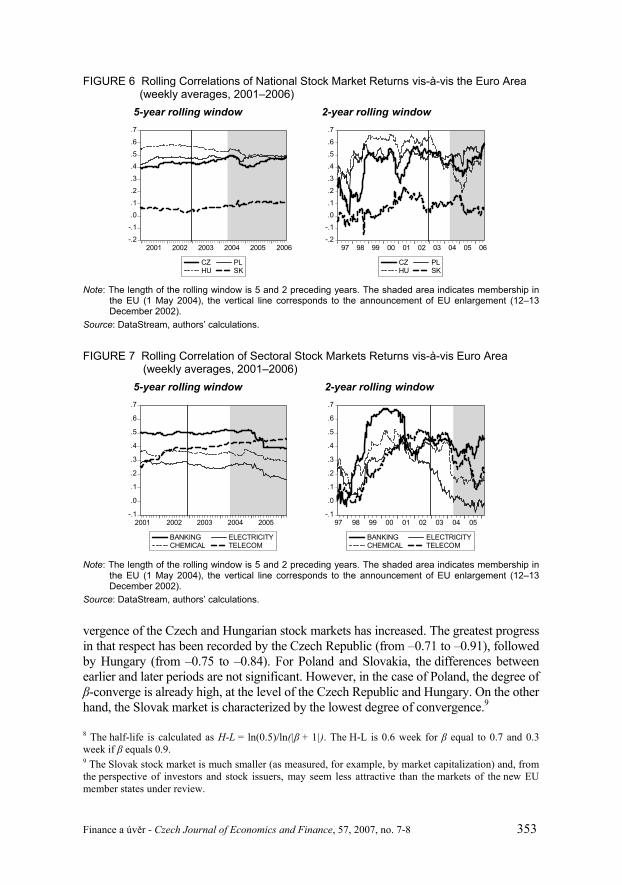
Figures 6 and 7 show the evolution of EU-4 stock market returns vis-à-vis the euro area, using rolling window correlations. The shorter the window (two years against five years), the more volatile the correlation coefficient is. Nevertheless, one can observe pronounced co-movement between the Czech, Hungarian and Polish markets, with correlation of returns around 0.5 by the end of 2006. Again, the Slovak stock market returns remain weakly correlated with the euro area benchmark.
On the sectoral level (Figure 7), correlation of returns exhibits richer dyna-mics, particularly when considered on the two-year rolling window. Overall, correla-tions on the sectoral level are somewhat lower compared to the national indices.
5.2 -convergence 5.2.1 Time Series and Panel Regression Analysis
The results of the -convergence analysis are given in Table 3. All the values in the table are negative; hence there is convergence of stock market returns. The ab-solute values of the -coefficient are close to one for all of the countries, which means that the leveling of newly arising differences in return differentials between the rele-vant national economy and the euro area can be labeled as fast. Indeed, the shock half-life, defined as the period during which the magnitude of a shock becomes half of the initial shock, is less than a week for the values of betas reported in Table 38.A comparison of the periods 1995–2000 and 2001–2006 reveals that the pace of -con-
TABLE 1 Correlation of National Stock Market Returns (weekly averages, 1995–2006) Czech Rep. Hungary Poland Slovakia Euro area
Czech Republic 1.00
Hungary 0.57*** 1.00
Poland 0.49*** 0.60*** 1.00
Slovakia 0.14*** 0.13*** 0.09** 1.00
Euro Area 0.42*** 0.50*** 0.44*** 0.06 1.00
Note: ***, **, * denote significance at the 1%, 5% and 10% levels. Bold italic indicate strong and significant cor-relation coefficients.
Source: DataStream and authors’ calculations
TABLE 2 Correlation of Sectoral Stock Market Returns between the Euro Area and EU-3 (weekly averages, 1995-2006)
Banking Chemical Electricity Telecom- munication
(Euro Area, EU-3) 0.45*** 0.31*** 0.22*** 0.32***
Note: EU-3 = Czech Republic, Hungary and Poland. *** denotes significance at the 1% level. Source: DataStream, Bloomberg and authors’ calculations.
Finance a úv r - Czech Journal of Economics and Finance, 57, 2007, no. 7-8 353
vergence of the Czech and Hungarian stock markets has increased. The greatest progress in that respect has been recorded by the Czech Republic (from –0.71 to –0.91), followed by Hungary (from –0.75 to –0.84). For Poland and Slovakia, the differences between earlier and later periods are not significant. However, in the case of Poland, the degree of -converge is already high, at the level of the Czech Republic and Hungary. On the other
hand, the Slovak market is characterized by the lowest degree of convergence.9
FIGURE 6 Rolling Correlations of National Stock Market Returns vis-à-vis the Euro Area (weekly averages, 2001–2006)
5-year rolling window 2-year rolling window
-.2
-.1
.0
.1
.2
.3
.4
.5
.6
.7
2001 2002 2003 2004 2005 2006
CZHU
PLSK
-.2
-.1
.0
.1
.2
.3
.4
.5
.6
.7
97 98 99 00 01 02 03 04 05 06
CZHU
PLSK
Note: The length of the rolling window is 5 and 2 preceding years. The shaded area indicates membership in the EU (1 May 2004), the vertical line corresponds to the announcement of EU enlargement (12–13 December 2002).
Source: DataStream, authors’ calculations.
FIGURE 7 Rolling Correlation of Sectoral Stock Markets Returns vis-à-vis Euro Area (weekly averages, 2001–2006)
5-year rolling window 2-year rolling window
-.1
.0
.1
.2
.3
.4
.5
.6
.7
2001 2002 2003 2004 2005
BANKINGCHEMICAL
ELECTRICITYTELECOM
-.1
.0
.1
.2
.3
.4
.5
.6
.7
97 98 99 00 01 02 03 04 05
BANKINGCHEMICAL
ELECTRICITYTELECOM
Note: The length of the rolling window is 5 and 2 preceding years. The shaded area indicates membership in the EU (1 May 2004), the vertical line corresponds to the announcement of EU enlargement (12–13 December 2002).
Source: DataStream, authors’ calculations.
8 The half-life is calculated as H-L = ln(0.5)/ln(| + 1|). The H-L is 0.6 week for equal to 0.7 and 0.3 week if equals 0.9. 9 The Slovak stock market is much smaller (as measured, for example, by market capitalization) and, fromthe perspective of investors and stock issuers, may seem less attractive than the markets of the new EU member states under review.
354 Finance a úv r - Czech Journal of Economics and Finance, 57, 2007, no. 7-8
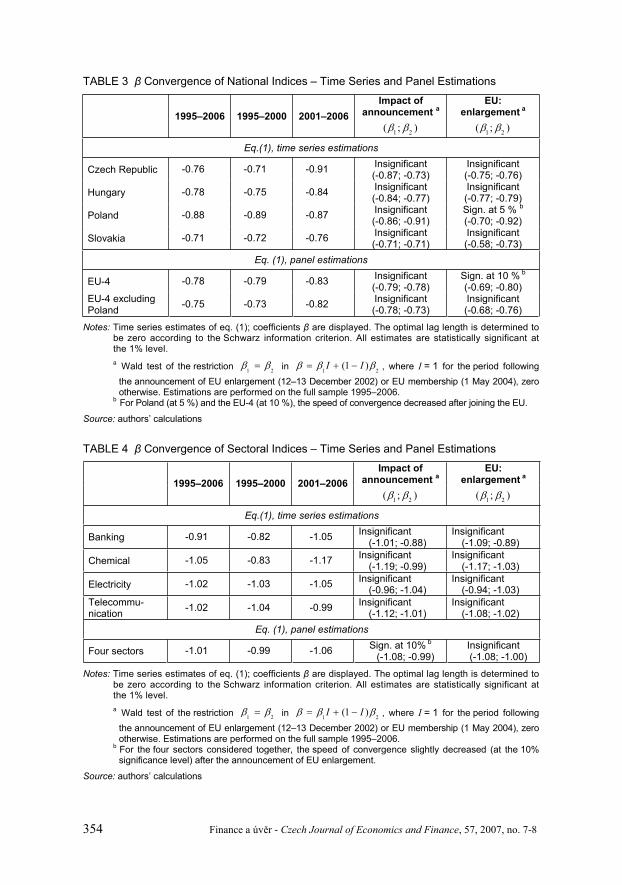
TABLE 3 Convergence of National Indices – Time Series and Panel Estimations
1995–2006 1995–2000 2001–2006 Impact of
announcement a
1 2( ; )
EU:enlargement a
1 2( ; )
Eq.(1), time series estimations
Czech Republic -0.76 -0.71 -0.91 Insignificant (-0.87; -0.73)
Insignificant (-0.75; -0.76)
Hungary -0.78 -0.75 -0.84 Insignificant (-0.84; -0.77)
Insignificant (-0.77; -0.79)
Poland -0.88 -0.89 -0.87 Insignificant(-0.86; -0.91)
Sign. at 5 % b(-0.70; -0.92)
Slovakia -0.71 -0.72 -0.76 Insignificant (-0.71; -0.71)
Insignificant (-0.58; -0.73)
Eq. (1), panel estimations
EU-4 -0.78 -0.79 -0.83 Insignificant(-0.79; -0.78)
Sign. at 10 % b
(-0.69; -0.80) EU-4 excluding Poland -0.75 -0.73 -0.82 Insignificant
(-0.78; -0.73) Insignificant (-0.68; -0.76)
Notes: Time series estimates of eq. (1); coefficients are displayed. The optimal lag length is determined to be zero according to the Schwarz information criterion. All estimates are statistically significant at the 1% level. a Wald test of the restriction 1 2 in 1 2
(1 )I I , where I = 1 for the period following the announcement of EU enlargement (12–13 December 2002) or EU membership (1 May 2004), zero otherwise. Estimations are performed on the full sample 1995–2006.
b For Poland (at 5 %) and the EU-4 (at 10 %), the speed of convergence decreased after joining the EU.
Source: authors’ calculations
TABLE 4 Convergence of Sectoral Indices – Time Series and Panel Estimations
Impact of announcement a
EU:enlargement a
1995–2006 1995–2000 2001–2006 1 2( ; ) 1 2( ; )
Eq.(1), time series estimations
Banking -0.91 -0.82 -1.05 Insignificant (-1.01; -0.88)
Insignificant (-1.09; -0.89)
Chemical -1.05 -0.83 -1.17 Insignificant (-1.19; -0.99)
Insignificant (-1.17; -1.03)
Electricity -1.02 -1.03 -1.05 Insignificant(-0.96; -1.04)
Insignificant(-0.94; -1.03)
Telecommu-nication -1.02 -1.04 -0.99 Insignificant
(-1.12; -1.01) Insignificant
(-1.08; -1.02) Eq. (1), panel estimations
Four sectors -1.01 -0.99 -1.06 Sign. at 10% b
(-1.08; -0.99) Insignificant(-1.08; -1.00)
Notes: Time series estimates of eq. (1); coefficients are displayed. The optimal lag length is determined to be zero according to the Schwarz information criterion. All estimates are statistically significant at the 1% level. a Wald test of the restriction 1 2 in 1 2
(1 )I I , where I = 1 for the period following the announcement of EU enlargement (12–13 December 2002) or EU membership (1 May 2004), zero otherwise. Estimations are performed on the full sample 1995–2006.
b For the four sectors considered together, the speed of convergence slightly decreased (at the 10% significance level) after the announcement of EU enlargement.
Source: authors’ calculations
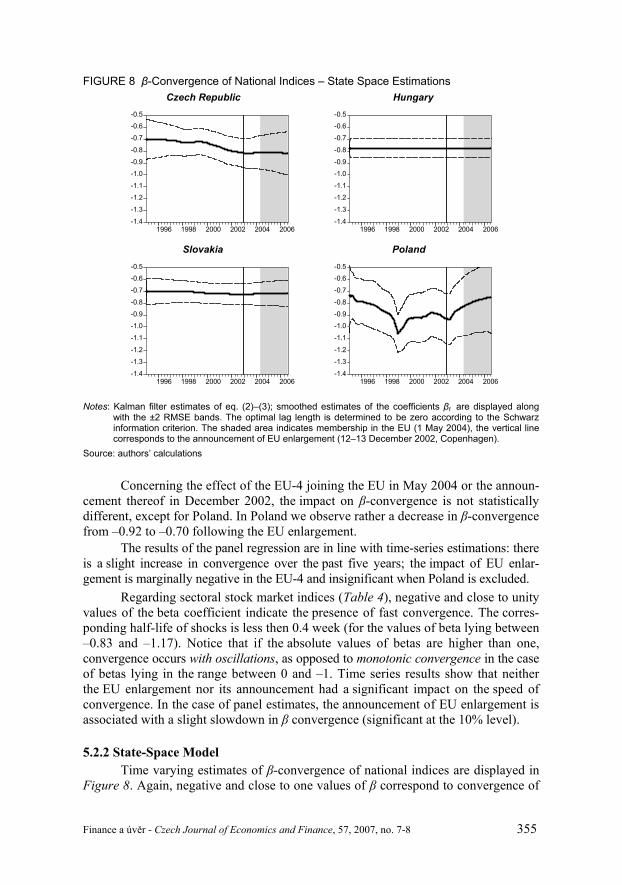
Finance a úv r - Czech Journal of Economics and Finance, 57, 2007, no. 7-8 355
Concerning the effect of the EU-4 joining the EU in May 2004 or the announ-cement thereof in December 2002, the impact on -convergence is not statistically different, except for Poland. In Poland we observe rather a decrease in -convergence from –0.92 to –0.70 following the EU enlargement.
The results of the panel regression are in line with time-series estimations: there is a slight increase in convergence over the past five years; the impact of EU enlar-gement is marginally negative in the EU-4 and insignificant when Poland is excluded.
Regarding sectoral stock market indices (Table 4), negative and close to unity values of the beta coefficient indicate the presence of fast convergence. The corres-ponding half-life of shocks is less then 0.4 week (for the values of beta lying between –0.83 and –1.17). Notice that if the absolute values of betas are higher than one, convergence occurs with oscillations, as opposed to monotonic convergence in the case of betas lying in the range between 0 and –1. Time series results show that neither the EU enlargement nor its announcement had a significant impact on the speed of convergence. In the case of panel estimates, the announcement of EU enlargement is associated with a slight slowdown in convergence (significant at the 10% level).
5.2.2 State-Space Model Time varying estimates of -convergence of national indices are displayed in
Figure 8. Again, negative and close to one values of correspond to convergence of
FIGURE 8 -Convergence of National Indices – State Space Estimations Czech Republic Hungary
-1.4
-1.3
-1.2
-1.1
-1.0
-0.9
-0.8
-0.7
-0.6
-0.5
1996 1998 2000 2002 2004 2006-1.4
-1.3
-1.2
-1.1
-1.0
-0.9
-0.8
-0.7
-0.6
-0.5
1996 1998 2000 2002 2004 2006
Slovakia Poland
-1.4
-1.3
-1.2
-1.1
-1.0
-0.9
-0.8
-0.7
-0.6
-0.5
1996 1998 2000 2002 2004 2006-1.4
-1.3
-1.2
-1.1
-1.0
-0.9
-0.8
-0.7
-0.6
-0.5
1996 1998 2000 2002 2004 2006
Notes: Kalman filter estimates of eq. (2)–(3); smoothed estimates of the coefficients t are displayed along with the ±2 RMSE bands. The optimal lag length is determined to be zero according to the Schwarz information criterion. The shaded area indicates membership in the EU (1 May 2004), the vertical line corresponds to the announcement of EU enlargement (12–13 December 2002, Copenhagen).
Source: authors’ calculations
356 Finance a úv r - Czech Journal of Economics and Finance, 57, 2007, no. 7-8
returns between the given country and the euro area. Although there are indications of rising convergence in the case of, e.g., the Czech Republic, the estimates of are little changed for Hungary and Slovakia. For Poland, the speed of convergence rises until the end of the 1990s, followed by a decrease afterwards; yet large confidence intervals surround the Polish estimates. There is no significant change in -conver-gence since EU enlargement or the announcement thereof, except for a gradual slow-down of the speed of convergence in the case of Poland since 2002.
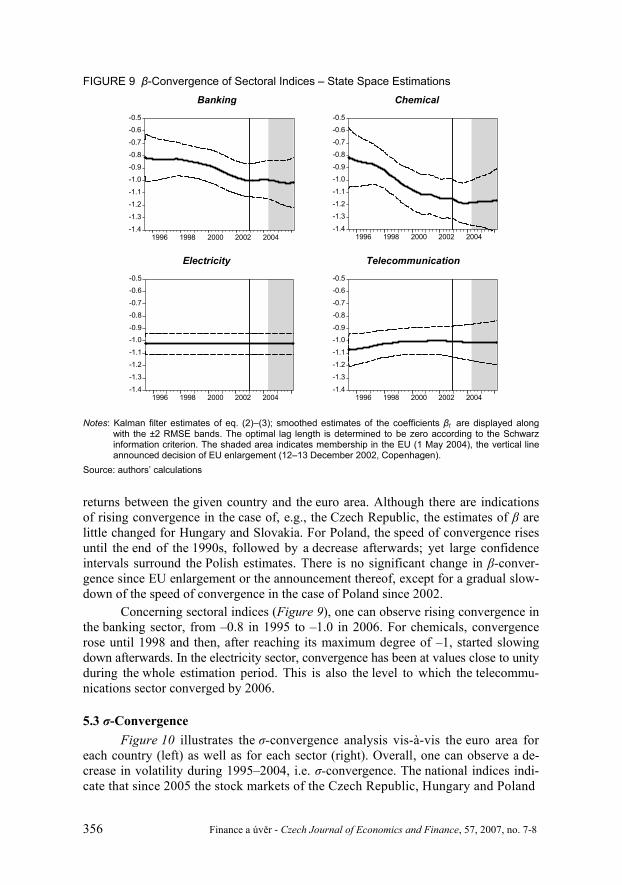
Concerning sectoral indices (Figure 9), one can observe rising convergence in the banking sector, from –0.8 in 1995 to –1.0 in 2006. For chemicals, convergence rose until 1998 and then, after reaching its maximum degree of –1, started slowing down afterwards. In the electricity sector, convergence has been at values close to unity during the whole estimation period. This is also the level to which the telecommu-nications sector converged by 2006.
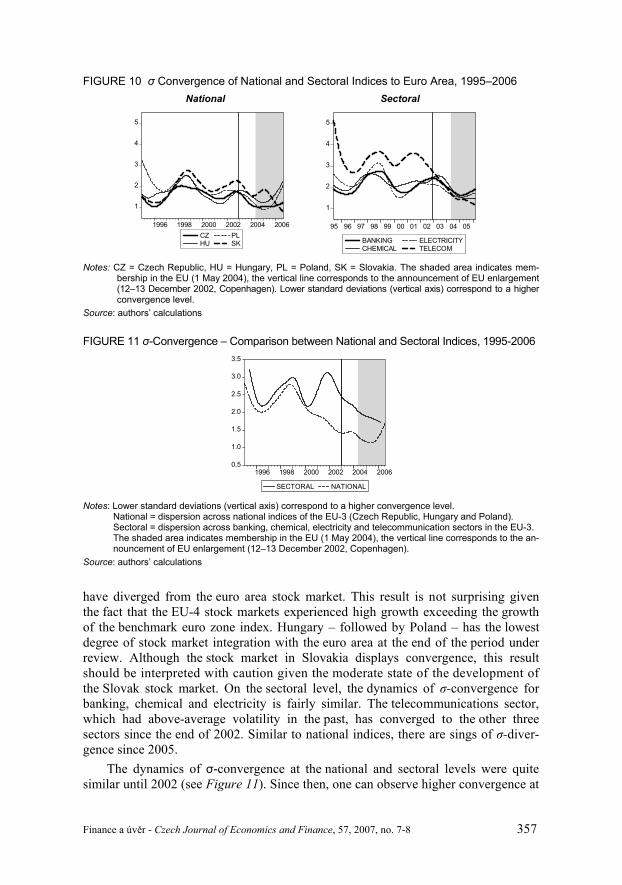
5.3 -Convergence Figure 10 illustrates the -convergence analysis vis-à-vis the euro area for
each country (left) as well as for each sector (right). Overall, one can observe a de-crease in volatility during 1995–2004, i.e. -convergence. The national indices indi-cate that since 2005 the stock markets of the Czech Republic, Hungary and Poland
FIGURE 9 -Convergence of Sectoral Indices – State Space Estimations Banking Chemical
-1.4
-1.3
-1.2
-1.1
-1.0
-0.9
-0.8
-0.7
-0.6
-0.5
1996 1998 2000 2002 2004-1.4
-1.3
-1.2
-1.1
-1.0-0.9
-0.8
-0.7
-0.6
-0.5
1996 1998 2000 2002 2004
Electricity Telecommunication
-1.4
-1.3
-1.2
-1.1
-1.0-0.9
-0.8
-0.7
-0.6
-0.5
1996 1998 2000 2002 2004-1.4
-1.3
-1.2
-1.1
-1.0-0.9
-0.8
-0.7
-0.6
-0.5
1996 1998 2000 2002 2004
Notes: Kalman filter estimates of eq. (2)–(3); smoothed estimates of the coefficients t are displayed along with the ±2 RMSE bands. The optimal lag length is determined to be zero according to the Schwarz information criterion. The shaded area indicates membership in the EU (1 May 2004), the vertical line announced decision of EU enlargement (12–13 December 2002, Copenhagen).
Source: authors’ calculations
Finance a úv r - Czech Journal of Economics and Finance, 57, 2007, no. 7-8 357
have diverged from the euro area stock market. This result is not surprising given the fact that the EU-4 stock markets experienced high growth exceeding the growth of the benchmark euro zone index. Hungary – followed by Poland – has the lowest degree of stock market integration with the euro area at the end of the period under review. Although the stock market in Slovakia displays convergence, this result should be interpreted with caution given the moderate state of the development of the Slovak stock market. On the sectoral level, the dynamics of -convergence for banking, chemical and electricity is fairly similar. The telecommunications sector, which had above-average volatility in the past, has converged to the other three sectors since the end of 2002. Similar to national indices, there are sings of -diver-gence since 2005.
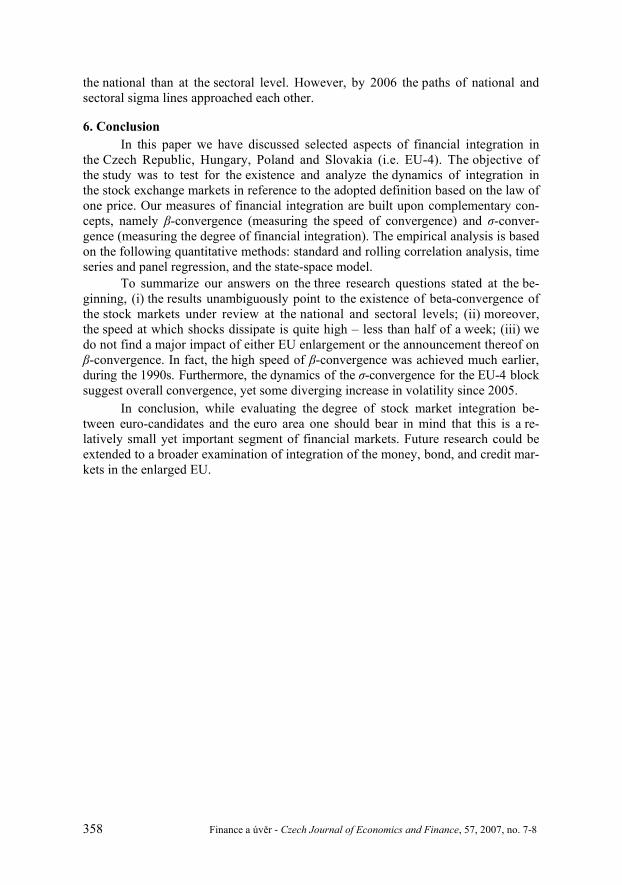
The dynamics of -convergence at the national and sectoral levels were quite similar until 2002 (see Figure 11). Since then, one can observe higher convergence at
FIGURE 10 Convergence of National and Sectoral Indices to Euro Area, 1995–2006 National Sectoral
1
2
3
4
5
1996 1998 2000 2002 2004 2006CZHU
PLSK
1
2
3
4
5
95 96 97 98 99 00 01 02 03 04 05
BANKINGCHEMICAL
ELECTRICITYTELECOM
Notes: CZ = Czech Republic, HU = Hungary, PL = Poland, SK = Slovakia. The shaded area indicates mem-bership in the EU (1 May 2004), the vertical line corresponds to the announcement of EU enlargement (12–13 December 2002, Copenhagen). Lower standard deviations (vertical axis) correspond to a higher convergence level.
Source: authors’ calculations
FIGURE 11 -Convergence – Comparison between National and Sectoral Indices, 1995-2006
0.5
1.0
1.5
2.0
2.5
3.0
3.5
1996 1998 2000 2002 2004 2006
SECTORAL NATIONAL
Notes: Lower standard deviations (vertical axis) correspond to a higher convergence level. National = dispersion across national indices of the EU-3 (Czech Republic, Hungary and Poland). Sectoral = dispersion across banking, chemical, electricity and telecommunication sectors in the EU-3. The shaded area indicates membership in the EU (1 May 2004), the vertical line corresponds to the an-nouncement of EU enlargement (12–13 December 2002, Copenhagen).
Source: authors’ calculations
358 Finance a úv r - Czech Journal of Economics and Finance, 57, 2007, no. 7-8
the national than at the sectoral level. However, by 2006 the paths of national and sectoral sigma lines approached each other.
6. Conclusion In this paper we have discussed selected aspects of financial integration in
the Czech Republic, Hungary, Poland and Slovakia (i.e. EU-4). The objective of the study was to test for the existence and analyze the dynamics of integration in the stock exchange markets in reference to the adopted definition based on the law of one price. Our measures of financial integration are built upon complementary con-cepts, namely -convergence (measuring the speed of convergence) and -conver-gence (measuring the degree of financial integration). The empirical analysis is based on the following quantitative methods: standard and rolling correlation analysis, time series and panel regression, and the state-space model.
To summarize our answers on the three research questions stated at the be-ginning, (i) the results unambiguously point to the existence of beta-convergence of the stock markets under review at the national and sectoral levels; (ii) moreover, the speed at which shocks dissipate is quite high – less than half of a week; (iii) we do not find a major impact of either EU enlargement or the announcement thereof on -convergence. In fact, the high speed of -convergence was achieved much earlier,
during the 1990s. Furthermore, the dynamics of the -convergence for the EU-4 block suggest overall convergence, yet some diverging increase in volatility since 2005.
In conclusion, while evaluating the degree of stock market integration be-tween euro-candidates and the euro area one should bear in mind that this is a re-latively small yet important segment of financial markets. Future research could be extended to a broader examination of integration of the money, bond, and credit mar-kets in the enlarged EU.
Finance a úv r - Czech Journal of Economics and Finance, 57, 2007, no. 7-8 359
APPENDIX
FIGURE A1 National Stock Market Returns (weekly averages, 1995–2006, 603 obs.)
a) Czech Republic (PX50) b) Hungary (BUX)
020406080
100120
-10 -5 0 5 100
20
40
60
80
100
-10 0 10 20
Mean 0.18 Jarque-Bera 45.1 Mean 0.33 Jarque-Bera 221.6 Median 0.44 Probability 0.00 Median 0.50 Probability 0.00 Std. Dev. 2.74 Std. Dev. 3.65
c) Poland (WIG) d) Slovakia (SAX)
0
20
40
60
80
100
-10 0 10 200
20406080
100120
-10 0 10 20
Mean 0.24 Jarque-Bera 142.2 Mean 0.13 Jarque-Bera 660.8 Median 0.36 Probability 0.00 Median 0.08 Probability 0.00 Std. Dev. 3.74 Std. Dev. 2.82
e) Euro area (Dow Johns EURO STOXX)
020406080
100120140160
-10 -5 0 5 10
Mean 0.16 Jarque-Bera 179.1 Median 0.35 Probability 0.00 Std. Dev. 2.19
Notes: Returns (R) are calculated as: 1100 * ln lnt tR SE SE , where SE denote the stock exchange index
(national or sectoral).
Source: DataStream, Bloomberg and authors’ calculations
360 Finance a úv r - Czech Journal of Economics and Finance, 57, 2007, no. 7-8
FIGURE A2 Sectoral Stock Market Returns (weekly averages, 1995–2006, 561 obs.)
Banking Euro Area EU-3
020406080
100120
-10 0 100
40
80
120
160
-15 -10 -5 0
Mean 0.20 Jarque-Bera 690.2 Mean 0.21 Jarque-Bera 486.2 Median 0.18 Probability 0.00 Median 0.31 Probability 0.00 Std. Dev. 3.09 Std. Dev. 3.95
Chemical Euro Area EU-3
0
20
40
60
80
100
-10 0 10 200
40
80
120
160
200
-15 -10 -5 0
Mean 0.18 Jarque-Bera 406.3 Mean 0.12 Jarque-Bera 707.4 Median 0.18 Probability 0.00 Median 0.31 Probability 0.00 Std. Dev. 3.17 Std. Dev. 3.66
Electricity Euro Area EU-3
020406080
100120
-15 -10 -5 0 50
40
80
120
160
200
-15 -10 -5 0
Mean 0.19 Jarque-Bera 76.1 Mean -0.01 Jarque-Bera 1035.9 Median 0.28 Probability 0.00 Median 0.04 Probability 0.00 Std. Dev. 2.31 Std. Dev. 3.92
Telecommunication Euro area EU-3
0102030405060708090
-10 0 100
40
80
120
160
-15 -10 -5 0 5
Mean 0.21 Jarque-Bera 87.5 Mean 0.06 Jarque-Bera 211.8 Median 0.27 Probability 0.00 Median 0.32 Probability 0.00 Std. Dev. 3.83 Std. Dev. 5.21
Notes and Source: As for Figure A1.
Finance a úv r - Czech Journal of Economics and Finance, 57, 2007, no. 7-8 361
REFERENCES
Adam K, Japelli T, Menichini A, Padula M, Pagano M (2002): Analyse, Compare, and Apply Alter-native Indicators and Monitoring Methodologies to Measure the Evolution of Capital Market Inte-gration in the European Union. European Commission, pp.1–95. Adjouté K, Danthine J (2003): European Financial Integration and Equity Returns: A Theory-Based Assessment. In: Gaspar V, Hartmann P, Slejpen O (eds.): The transformation of the European finan-cial system. European Central Bank, Frankfurt, pp. 185–246. Agénor PR (2003): Benefits and Costs of International Financial Integration: Theory and Facts. World Economy, 26(8):1089–118. Ayuso J, Blanco R (2000): Has Financial Market Integration Increased during the Nineties? Journal of International Financial Markets, Institutions and Money, 11(3):265–287. Azman-Saini WNW, Azali M, Habibullah MS, Matthews KG (2002): Financial integration and the ASEAN-5 equity markets. Applied Economics, 34:2283–2288. Baca SP, Garbe B, Weiss RA (2000): The Rise of Sector Effects in Major Equity Markets. Financial Analysts Journal (September/October):35–40. Baele L, Ferrando A, Hördahl P, Krylova E, Monnet C (2004): Measuring Financial Integration in the Euro Area. European Central Bank, Occasional paper Series (14):1–93. Barro RJ, Sala-I-Martin X (1992): Convergence. Journal of Political Economy, 100:223–251. Bartolini L, Drazen AH (1997): Capital Account Liberalization as a Signal. American Economic Review, 87(March 1997):138–54. Bekaert G, Campbell RH, Lumsdaine RL (2000): Dating the Integration of World Equity Markets. Journal of Financial Economics, 65(2):203–247. Bekaert G, Harvey CR (1995): Time-Varying World Market Integration. Journal of Finance,50:403–444. Bekaert G, Harvey CR (1997): Emerging Equity Market Volatility. Journal of Financial Econo-mics, 43:29–77. Cappiello L, Kadareja GA, Manganelli S (2006): Financial integration of new EU Member States. ECB working paper Series, no. 683.
erný A (2004): Stock Market Integration and the Speed of Information Transmission. CERGE-EI Working paper series, no. 242. Chen Z, Knez PJ (1995): Measurement of Market Integration and Arbitrage. The Review of Finan-cial Studies, 8(2):287–325. Dvo ák T, Podpiera R (2006): European Union enlargement and equity markets in accession coun-tries. Emerging Markets Review, 7(2):129–146. Égert B, Ko enda E (2007): Interdependence between Eastern and Western European Stock Markets: Evidence from intraday data. Economic Systems, 31(2):184–203. Égert B, Koubaa Y (2004): Modelling Stock Returns in the G-7 and in Selected CEE Economies: A Non-linear GARCH Approach. William Davidson Institute Working Paper, no. 663. European Commission (1997): The impact of the introduction of the euro on capital markets. Brussels, Euro Papers, no. 3 (July). European Commission (1999): Financial services: implementing the framework for financial servi-ces: action plan. COM (1999)232, Brussels, 11 May. Goldberg P, Verboven F (2001): Market Integration and Convergence of the Law of One Price: Evidence from the European Car Market. CEPR Discussion Paper, no. 2926, London. Hanousek J, Filler R (2000): The relationship between economic factors and equity markets in Cen-tral Europe. Economics of Transition, 8(3):623–638. Hardouvelis G, Malliaropulos D, Priestley R (2006): EMU and European Stock Market Integration. Journal of Business, 79(1):365–392.
362 Finance a úv r - Czech Journal of Economics and Finance, 57, 2007, no. 7-8
Hartmann P, Maddaloni A, Manganelli S (2003): The euro area financial system: structure, inte-gration and policy initiatives. Oxford Review of Economic Policy, 19(1-Spring):180–213. Heston SL, Rouwenhorst KG (1995): Industry and Country Effects in International Stock Returns. The Journal of Portfolio Management, Spring, pp. 53–58. Horská H (2005): eský akciový trh – jeho efektivnost a makroekonomické souvislosti. Finance a úv r-The Czech Journal of Economics and Finance, 55(5-6):283–301. Komárková Z (2006): Financial Market Integration between the Czech Republic and the Euro Area.Ph.D thesis, Prague School of Economics. Martin P, Rey H (2004): Financial Super-Markets: Size Matters for Asset Trade. Journal of Interna-tional Economics, 64(2):335–361. Obstfeld M (1998): The Global Capital Market: Benefactor or Menace? Journal of Economics Per-spectives, 12(4):9–30. Piesse J, Hearn B (2002): Equity market integration versus segmentation in three dominant mar-kets of the Southern African Customs Union: Cointegration and causality tests. Applied Economics,14:1711–1722. Portes R, Rey H (2005): The Determinants of Cross-Border Equity Flows. Journal of International Economics, 65(2):269–296. Quah D (1993): Galton’s Fallacy and Tests of the Convergence Hypothesis. Scandinavian Journal of Economics, 95(4):427–443. Sala-I-Martin X (1996): The Classical Approach to Convergence Analysis. Economic Journal, 106 (437):1019–1036. Syllignakis M, Kouretas G (2006): Long and Short-Run Linkages in Cee Stock Markets: Im-plications for Portfolio Diversification and Stock Market Integration. William Davidson Institute Working Papers Series, no. 832. Yang J, Kolari JW, Min I (2003): Stock market integration and financial crises: The case of Asia. Applied Financial Economics, 13:477–486.


![DPufnalski.edu.pl/proceedings/pilecki2019/Pilecki_2019... · 2019-06-06 · 7kh h[srqhqwldo jurzwk ri gdwd 7kh vl]h ri wkh gljlwdo xqlyhuvh grxeohv hyhu\ wzr \hduv iurp wr qwhuqhw](https://img.pdfslide.tips/doc/110x75/5e7f4886d72689606a46c4ca/2019-06-06-7kh-hsrqhqwldo-jurzwk-ri-gdwd-7kh-vlh-ri-wkh-gljlwdo-xqlyhuvh-grxeohv.jpg)


![$JXDV 5HVLGXDOHV › descargas › WILO 2018.pdf · 2018-09-29 · ] 6 hq vwrfn $ dsur[ vhpdqdv % dsur[ vhpdqdv & dsur[ vhpdqdv ' ² edmr frqvxowd 5hvhuydgr ho ghuhfkr d lqwurgxflu](https://img.pdfslide.tips/doc/110x75/5f111951a05d665c054a32c1/jxdv-5hvlgxdohv-a-descargas-a-wilo-2018pdf-2018-09-29-6-hq-vwrfn-dsur.jpg)
![LVF %UDNH SDUWV LQ VWRFN DW (DVW 0IJ · 2020. 11. 18. · 'LVF %UDNH SDUWV LQ VWRFN DW (DVW 0IJ v ] Æ î îy [ o u } } u u } v Ç u D } } u u } v o Ç µ o u v W l ] , v ] l } v](https://img.pdfslide.tips/doc/110x75/60cf5da5bc40d214f75692f5/lvf-udnh-sduwv-lq-vwrfn-dw-dvw-0ij-2020-11-18-lvf-udnh-sduwv-lq-vwrfn.jpg)