Embed Size (px)
Citation preview
– 1 –
yiu.tsui
A161291 1st Proof Time/date: 25-08-2016_14:21:50 Cre8 (852) 3693 2600 yiu.tsui
Hong Kong Exchanges and Clearing Limited and The Stock Exchange of Hong Kong Limited take no responsibility for the contents of this announcement, make no representation as to its accuracy or completeness and expressly disclaim any liability whatsoever for any loss howsoever arising from or in reliance upon the whole or any part of the contents of this announcement.
ZTE CORPORATION中興通訊股份有限公司
(a joint stock limited company incorporated in the People’s Republic of China with limited liability)(Stock Code: 763)
2016 INTERIM REPORT SUMMARY AND RESULTS ANNOUNCEMENT
1. IMPORTANT
1.1 The Board of Directors, Supervisory Committee and the Directors, Supervisors and senior management of ZTE Corporation (“ZTE” or the “Company”) confirm that the 2016 interim report (the “Interim Report”) does not contain any false information, misleading statements or material omissions, and collectively and individually accept responsibility for the truthfulness, accuracy and completeness of the contents of the Interim Report.
The Interim Report containing all information required to be presented in interim reports in accordance with Appendix 16 to the Rules (the “Hong Kong Listing Rules”) Governing the Listing of Securities on The Stock Exchange of Hong Kong Limited (the “Hong Kong Stock Exchange”) will be posted on the website of the Hong Kong Stock Exchange (www.hkexnews.com.hk) and the Company’s website (www.zte.com.cn) in due course.
1.2 There are no Directors, Supervisors or senior management who do not warrant or who dispute the truthfulness, accuracy and completeness of the contents of the Interim Report.
1.3 The Interim Report has been considered and approved at the Eighth Meeting of the Seventh Session of the Board of Directors of the Company. Mr. Luan Jubao, Vice Chairman, was unable to attend the meeting due to work reasons and has authorised Mr. Zhan Yichao, Director, to vote on his behalf. Mr. Tian Dongfang, Director, was unable to attend the meeting due to work reasons and has authorised Mr. Wang Yawen, Director, to vote on his behalf. Mr. Yin Yimin, Director, was unable to attend the meeting due to work reasons and has authorised Mr. Shi Lirong, Director, to vote on his behalf. Mr. Lü Hongbing, Independent Non-executive Director, was unable to attend the meeting due to work reasons and has authorised Mr. Chen Shaohua, Independent Non-executive Director, to vote on his behalf.
1.4 The interim financial reports of ZTE and its subsidiaries (the “Group”) for the six months ended 30 June 2016 were unaudited.
1.5 Mr. Zhao Xianming, Chairman of the Company, Mr. Wei Zaisheng, Chief Financial Officer of the Company and Mr. Shi Chunmao, Head of Finance Division of the Company, hereby declare that they warrant the truthfulness, accuracy and completeness of the financial reports contained in the Interim Report.
1.6 No profit distribution or conversion of capital reserves will be implemented in respect of the interim period of 2016.
– 2 –
yiu.tsui
A161291 1st Proof Time/date: 25-08-2016_14:21:50 Cre8 (852) 3693 2600 yiu.tsui
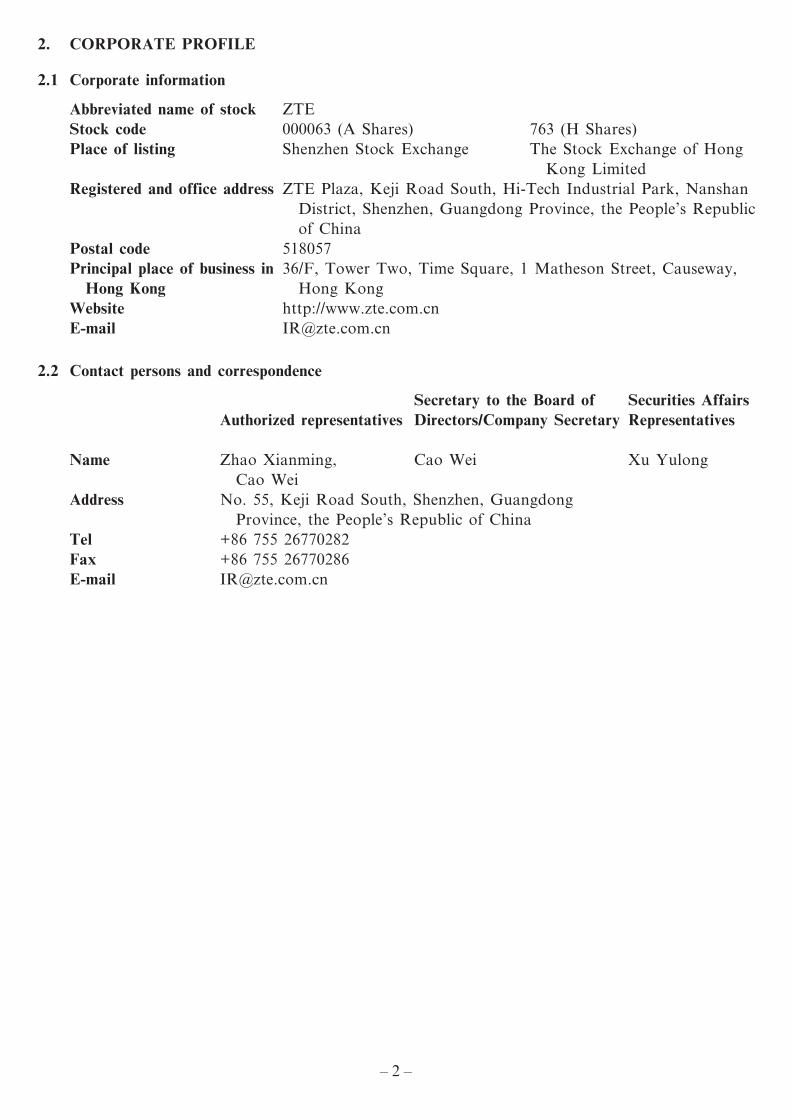
2. CORPORATE PROFILE
2.1 Corporate information
Abbreviated name of stock ZTEStock code 000063 (A Shares) 763 (H Shares)Place of listing Shenzhen Stock Exchange The Stock Exchange of Hong
Kong LimitedRegistered and office address ZTE Plaza, Keji Road South, Hi-Tech Industrial Park, Nanshan
District, Shenzhen, Guangdong Province, the People’s Republic of China
Postal code 518057Principal place of business in
Hong Kong36/F, Tower Two, Time Square, 1 Matheson Street, Causeway,
Hong KongWebsite http://www.zte.com.cnE-mail [email protected]
2.2 Contact persons and correspondence
Authorized representativesSecretary to the Board of Directors/Company Secretary
Securities Affairs Representatives
Name Zhao Xianming, Cao Wei
Cao Wei Xu Yulong
Address No. 55, Keji Road South, Shenzhen, Guangdong Province, the People’s Republic of China
Tel +86 755 26770282Fax +86 755 26770286E-mail [email protected]
– 3 –
yiu.tsui
A161291 1st Proof Time/date: 25-08-2016_14:21:50 Cre8 (852) 3693 2600 yiu.tsui
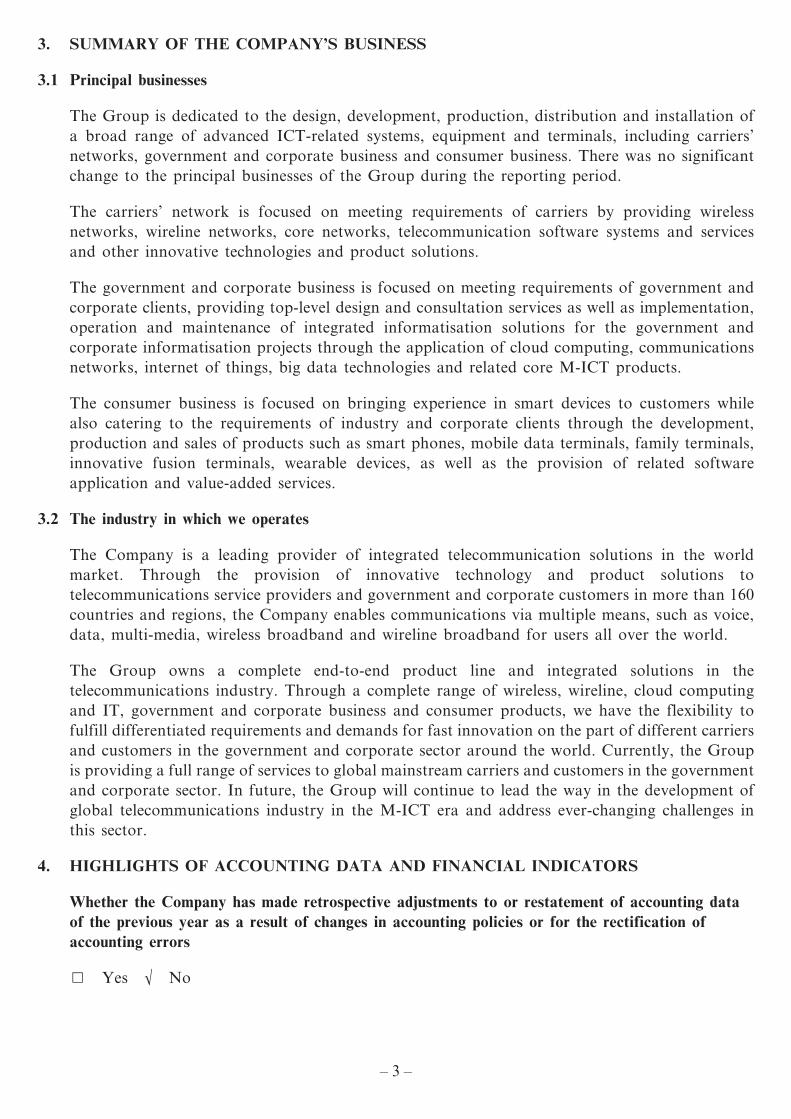
3. SUMMARY OF THE COMPANY’S BUSINESS
3.1 Principal businesses
The Group is dedicated to the design, development, production, distribution and installation of a broad range of advanced ICT-related systems, equipment and terminals, including carriers’ networks, government and corporate business and consumer business. There was no significant change to the principal businesses of the Group during the reporting period.
The carriers’ network is focused on meeting requirements of carriers by providing wireless networks, wireline networks, core networks, telecommunication software systems and services and other innovative technologies and product solutions.
The government and corporate business is focused on meeting requirements of government and corporate clients, providing top-level design and consultation services as well as implementation, operation and maintenance of integrated informatisation solutions for the government and corporate informatisation projects through the application of cloud computing, communications networks, internet of things, big data technologies and related core M-ICT products.
The consumer business is focused on bringing experience in smart devices to customers while also catering to the requirements of industry and corporate clients through the development, production and sales of products such as smart phones, mobile data terminals, family terminals, innovative fusion terminals, wearable devices, as well as the provision of related software application and value-added services.
3.2 The industry in which we operates
The Company is a leading provider of integrated telecommunication solutions in the world market. Through the provision of innovative technology and product solutions to telecommunications service providers and government and corporate customers in more than 160 countries and regions, the Company enables communications via multiple means, such as voice, data, multi-media, wireless broadband and wireline broadband for users all over the world.
The Group owns a complete end-to-end product line and integrated solutions in the telecommunications industry. Through a complete range of wireless, wireline, cloud computing and IT, government and corporate business and consumer products, we have the flexibility to fulfill differentiated requirements and demands for fast innovation on the part of different carriers and customers in the government and corporate sector around the world. Currently, the Group is providing a full range of services to global mainstream carriers and customers in the government and corporate sector. In future, the Group will continue to lead the way in the development of global telecommunications industry in the M-ICT era and address ever-changing challenges in this sector.
4. HIGHLIGHTS OF ACCOUNTING DATA AND FINANCIAL INDICATORS
Whether the Company has made retrospective adjustments to or restatement of accounting data of the previous year as a result of changes in accounting policies or for the rectification of accounting errors
□ Yes √ No
– 4 –
yiu.tsui
A161291 1st Proof Time/date: 25-08-2016_14:21:50 Cre8 (852) 3693 2600 yiu.tsui
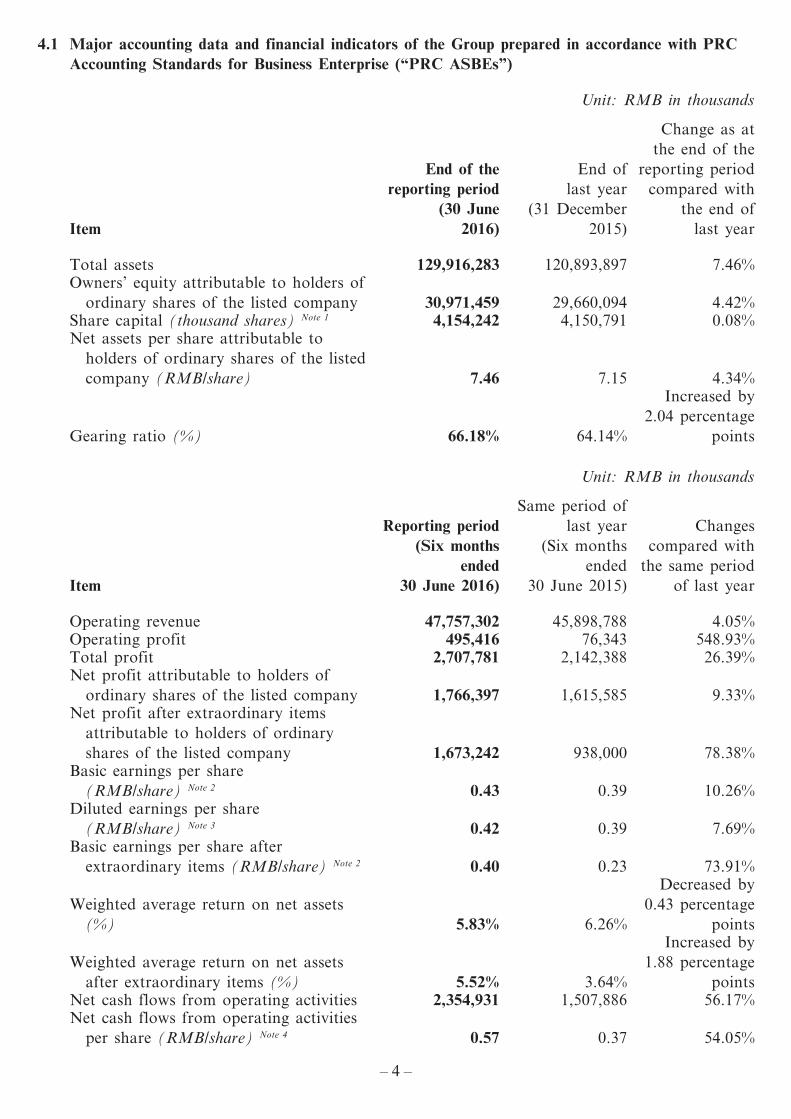
4.1 Major accounting data and financial indicators of the Group prepared in accordance with PRC Accounting Standards for Business Enterprise (“PRC ASBEs”)
Unit: RMB in thousands
Item
End of the reporting period
(30 June 2016)
End of last year
(31 December 2015)
Change as at the end of the
reporting period compared with
the end of last year
Total assets 129,916,283 120,893,897 7.46%Owners’ equity attributable to holders of
ordinary shares of the listed company 30,971,459 29,660,094 4.42%Share capital (thousand shares) Note 1 4,154,242 4,150,791 0.08%Net assets per share attributable to
holders of ordinary shares of the listed company (RMB/share) 7.46 7.15 4.34%
Gearing ratio (%) 66.18% 64.14%
Increased by 2.04 percentage
points
Unit: RMB in thousands
Item
Reporting period (Six months
ended 30 June 2016)
Same period of last year
(Six months ended
30 June 2015)
Changes compared with
the same period of last year
Operating revenue 47,757,302 45,898,788 4.05%Operating profit 495,416 76,343 548.93%Total profit 2,707,781 2,142,388 26.39%Net profit attributable to holders of
ordinary shares of the listed company 1,766,397 1,615,585 9.33%Net profit after extraordinary items
attributable to holders of ordinary shares of the listed company 1,673,242 938,000 78.38%
Basic earnings per share (RMB/share) Note 2 0.43 0.39 10.26%
Diluted earnings per share (RMB/share) Note 3 0.42 0.39 7.69%
Basic earnings per share after extraordinary items (RMB/share) Note 2 0.40 0.23 73.91%
Weighted average return on net assets (%) 5.83% 6.26%
Decreased by 0.43 percentage
points
Weighted average return on net assets after extraordinary items (%) 5.52% 3.64%
Increased by 1.88 percentage
pointsNet cash flows from operating activities 2,354,931 1,507,886 56.17%Net cash flows from operating activities
per share (RMB/share) Note 4 0.57 0.37 54.05%
– 5 –
yiu.tsui
A161291 1st Proof Time/date: 25-08-2016_14:21:50 Cre8 (852) 3693 2600 yiu.tsui
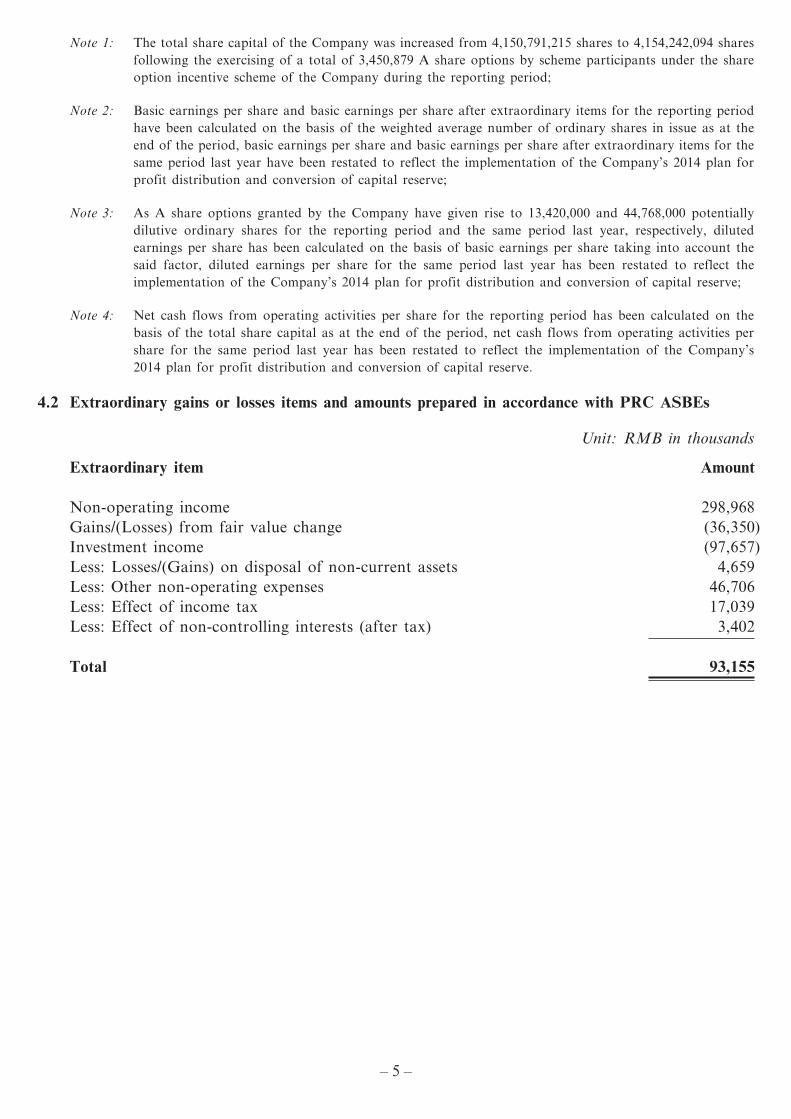
Note 1: The total share capital of the Company was increased from 4,150,791,215 shares to 4,154,242,094 shares following the exercising of a total of 3,450,879 A share options by scheme participants under the share option incentive scheme of the Company during the reporting period;
Note 2: Basic earnings per share and basic earnings per share after extraordinary items for the reporting period have been calculated on the basis of the weighted average number of ordinary shares in issue as at the end of the period, basic earnings per share and basic earnings per share after extraordinary items for the same period last year have been restated to reflect the implementation of the Company’s 2014 plan for profit distribution and conversion of capital reserve;
Note 3: As A share options granted by the Company have given rise to 13,420,000 and 44,768,000 potentially dilutive ordinary shares for the reporting period and the same period last year, respectively, diluted earnings per share has been calculated on the basis of basic earnings per share taking into account the said factor, diluted earnings per share for the same period last year has been restated to reflect the implementation of the Company’s 2014 plan for profit distribution and conversion of capital reserve;
Note 4: Net cash flows from operating activities per share for the reporting period has been calculated on the basis of the total share capital as at the end of the period, net cash flows from operating activities per share for the same period last year has been restated to reflect the implementation of the Company’s 2014 plan for profit distribution and conversion of capital reserve.
4.2 Extraordinary gains or losses items and amounts prepared in accordance with PRC ASBEs
Unit: RMB in thousands
Extraordinary item Amount
Non-operating income 298,968Gains/(Losses) from fair value change (36,350)Investment income (97,657)Less: Losses/(Gains) on disposal of non-current assets 4,659Less: Other non-operating expenses 46,706Less: Effect of income tax 17,039Less: Effect of non-controlling interests (after tax) 3,402
Total 93,155
– 6 –
yiu.tsui
A161291 1st Proof Time/date: 25-08-2016_14:21:50 Cre8 (852) 3693 2600 yiu.tsui
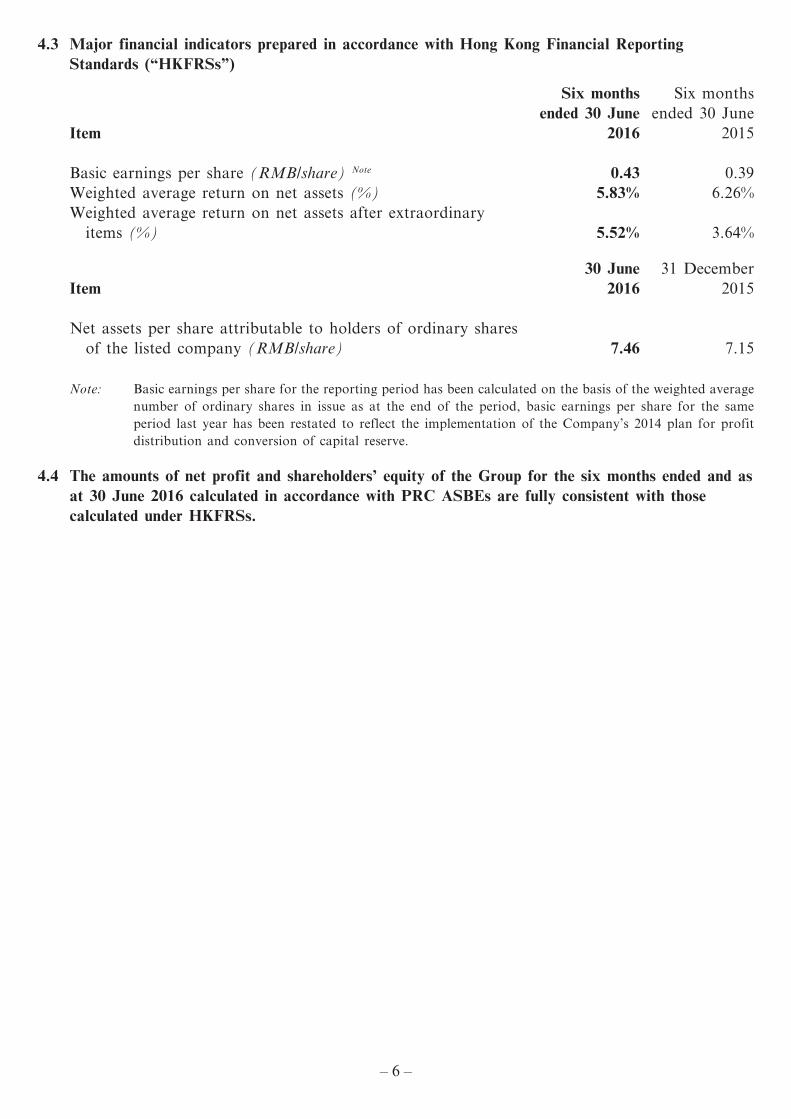
4.3 Major financial indicators prepared in accordance with Hong Kong Financial Reporting Standards (“HKFRSs”)
Item
Six months ended 30 June
2016
Six months ended 30 June
2015
Basic earnings per share (RMB/share) Note 0.43 0.39Weighted average return on net assets (%) 5.83% 6.26%Weighted average return on net assets after extraordinary
items (%) 5.52% 3.64%
Item30 June
201631 December
2015
Net assets per share attributable to holders of ordinary shares of the listed company (RMB/share) 7.46 7.15
Note: Basic earnings per share for the reporting period has been calculated on the basis of the weighted average number of ordinary shares in issue as at the end of the period, basic earnings per share for the same period last year has been restated to reflect the implementation of the Company’s 2014 plan for profit distribution and conversion of capital reserve.
4.4 The amounts of net profit and shareholders’ equity of the Group for the six months ended and as at 30 June 2016 calculated in accordance with PRC ASBEs are fully consistent with those calculated under HKFRSs.
– 7 –
yiu.tsui
A161291 1st Proof Time/date: 25-08-2016_14:21:50 Cre8 (852) 3693 2600 yiu.tsui
5. SHAREHOLDINGS OF THE SHAREHOLDERS
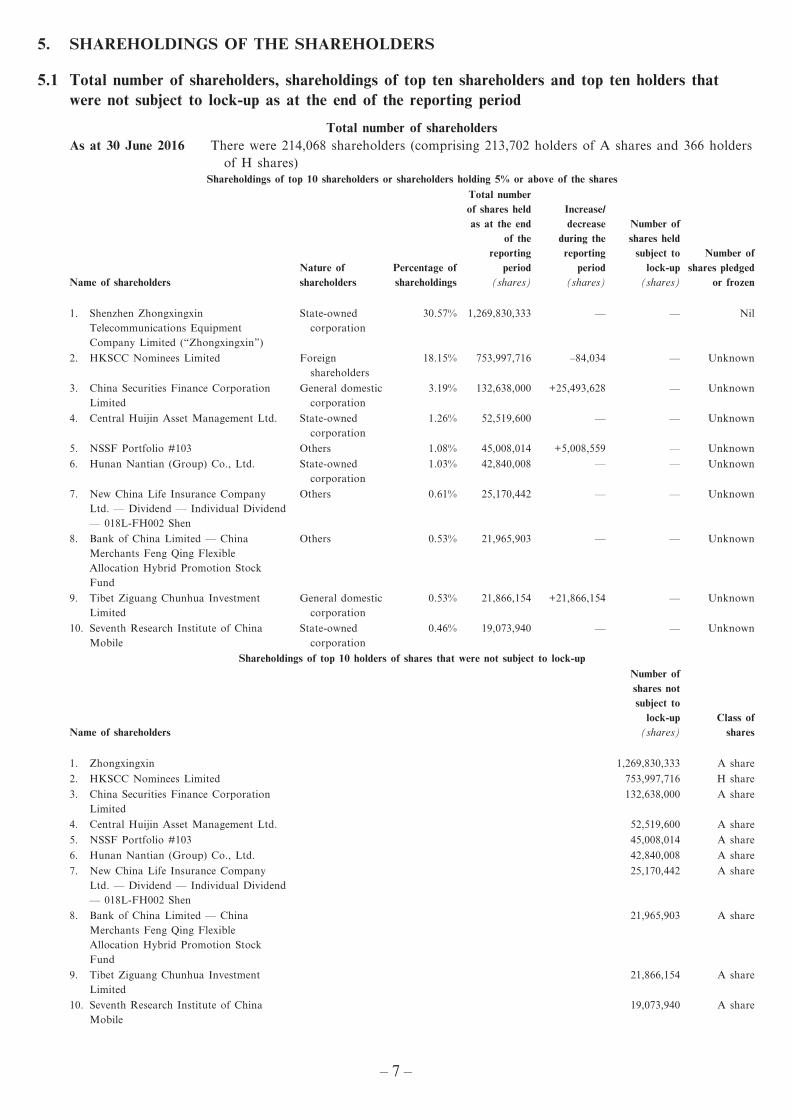
5.1 Total number of shareholders, shareholdings of top ten shareholders and top ten holders that were not subject to lock-up as at the end of the reporting period
Total number of shareholdersAs at 30 June 2016 There were 214,068 shareholders (comprising 213,702 holders of A shares and 366 holders
of H shares)Shareholdings of top 10 shareholders or shareholders holding 5% or above of the shares
Name of shareholdersNature of shareholders
Percentage of shareholdings
Total number of shares held as at the end
of the reporting
period (shares)
Increase/decrease
during the reporting
period (shares)
Number of shares held
subject to lock-up
(shares)
Number of shares pledged
or frozen
1. Shenzhen Zhongxingxin Telecommunications Equipment Company Limited (“Zhongxingxin”)
State-owned corporation
30.57% 1,269,830,333 — — Nil
2. HKSCC Nominees Limited Foreign shareholders
18.15% 753,997,716 –84,034 — Unknown
3. China Securities Finance Corporation Limited
General domestic corporation
3.19% 132,638,000 +25,493,628 — Unknown
4. Central Huijin Asset Management Ltd. State-owned corporation
1.26% 52,519,600 — — Unknown
5. NSSF Portfolio #103 Others 1.08% 45,008,014 +5,008,559 — Unknown
6. Hunan Nantian (Group) Co., Ltd. State-owned corporation
1.03% 42,840,008 — — Unknown
7. New China Life Insurance Company Ltd. — Dividend — Individual Dividend — 018L-FH002 Shen
Others 0.61% 25,170,442 — — Unknown
8. Bank of China Limited — China Merchants Feng Qing Flexible Allocation Hybrid Promotion Stock Fund
Others 0.53% 21,965,903 — — Unknown
9. Tibet Ziguang Chunhua Investment Limited
General domestic corporation
0.53% 21,866,154 +21,866,154 — Unknown
10. Seventh Research Institute of China Mobile
State-owned corporation
0.46% 19,073,940 — — Unknown
Shareholdings of top 10 holders of shares that were not subject to lock-up
Name of shareholders
Number of shares not subject to
lock-up (shares)
Class of shares
1. Zhongxingxin 1,269,830,333 A share
2. HKSCC Nominees Limited 753,997,716 H share
3. China Securities Finance Corporation Limited
132,638,000 A share
4. Central Huijin Asset Management Ltd. 52,519,600 A share
5. NSSF Portfolio #103 45,008,014 A share
6. Hunan Nantian (Group) Co., Ltd. 42,840,008 A share
7. New China Life Insurance Company Ltd. — Dividend — Individual Dividend — 018L-FH002 Shen
25,170,442 A share
8. Bank of China Limited — China Merchants Feng Qing Flexible Allocation Hybrid Promotion Stock Fund
21,965,903 A share
9. Tibet Ziguang Chunhua Investment Limited
21,866,154 A share
10. Seventh Research Institute of China Mobile
19,073,940 A share
– 8 –
yiu.tsui
A161291 1st Proof Time/date: 25-08-2016_14:21:50 Cre8 (852) 3693 2600 yiu.tsui
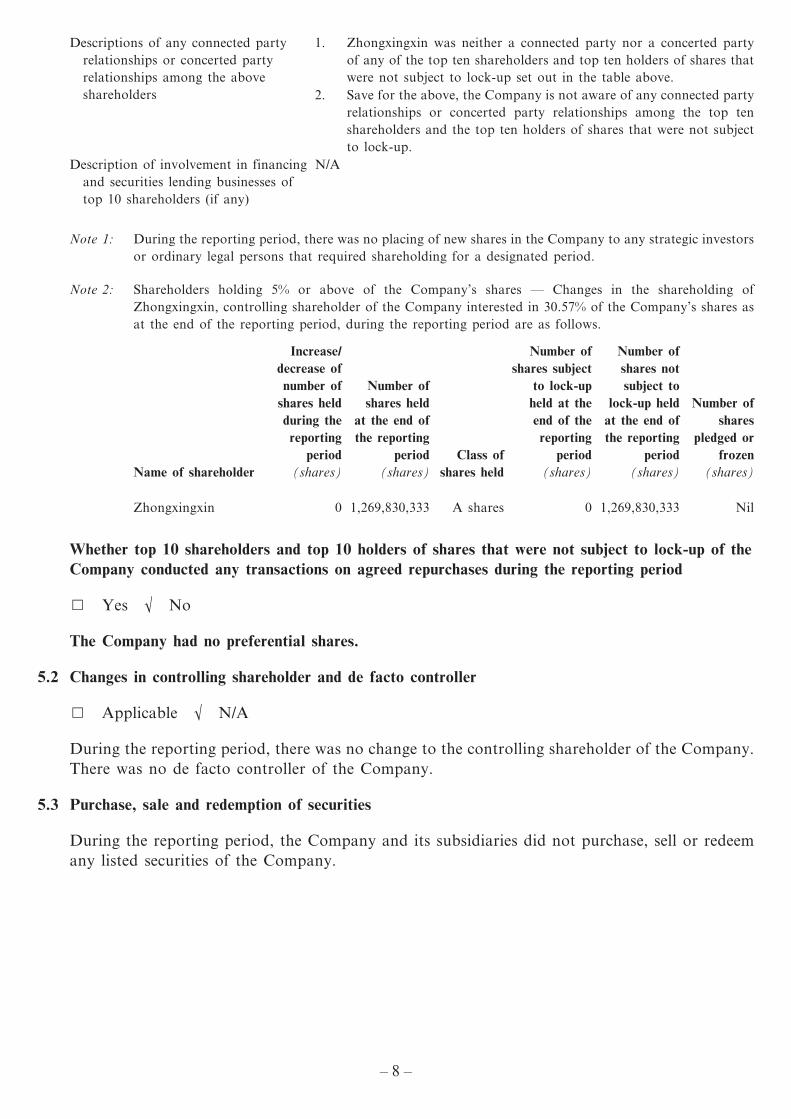
Descriptions of any connected party relationships or concerted party relationships among the above shareholders
1. Zhongxingxin was neither a connected party nor a concerted party of any of the top ten shareholders and top ten holders of shares that were not subject to lock-up set out in the table above.
2. Save for the above, the Company is not aware of any connected party relationships or concerted party relationships among the top ten shareholders and the top ten holders of shares that were not subject to lock-up.
Description of involvement in financing and securities lending businesses of top 10 shareholders (if any)
N/A
Note 1: During the reporting period, there was no placing of new shares in the Company to any strategic investors or ordinary legal persons that required shareholding for a designated period.
Note 2: Shareholders holding 5% or above of the Company’s shares — Changes in the shareholding of Zhongxingxin, controlling shareholder of the Company interested in 30.57% of the Company’s shares as at the end of the reporting period, during the reporting period are as follows.
Name of shareholder
Increase/decrease of number of
shares held during the
reporting period
(shares)
Number of shares held
at the end of the reporting
period (shares)
Class of shares held
Number of shares subject
to lock-up held at the end of the reporting
period (shares)
Number of shares not subject to
lock-up held at the end of the reporting
period (shares)
Number of shares
pledged or frozen
(shares)
Zhongxingxin 0 1,269,830,333 A shares 0 1,269,830,333 Nil
Whether top 10 shareholders and top 10 holders of shares that were not subject to lock-up of the Company conducted any transactions on agreed repurchases during the reporting period
□ Yes √ No
The Company had no preferential shares.
5.2 Changes in controlling shareholder and de facto controller
□ Applicable √ N/A
During the reporting period, there was no change to the controlling shareholder of the Company. There was no de facto controller of the Company.
5.3 Purchase, sale and redemption of securities
During the reporting period, the Company and its subsidiaries did not purchase, sell or redeem any listed securities of the Company.
– 9 –
yiu.tsui
A161291 1st Proof Time/date: 25-08-2016_14:21:50 Cre8 (852) 3693 2600 yiu.tsui
6. DIRECTORS, SUPERVISORS AND SENIOR MANAGEMENT
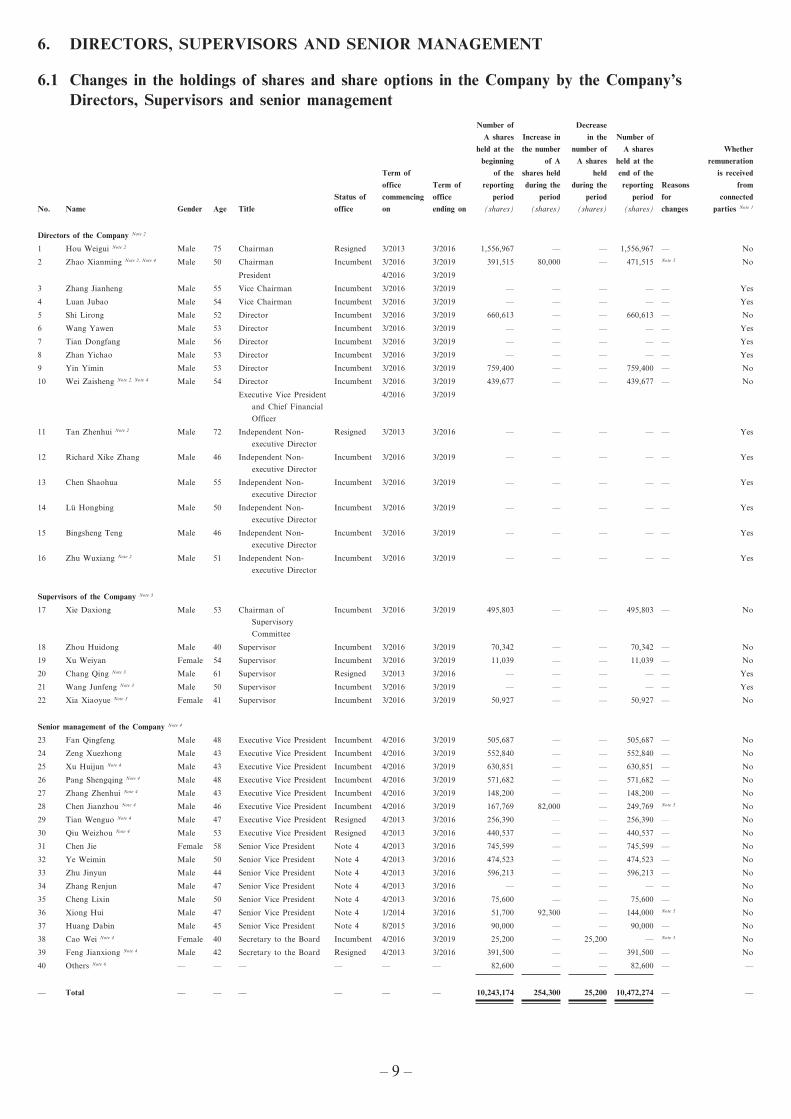
6.1 Changes in the holdings of shares and share options in the Company by the Company’s Directors, Supervisors and senior management
No. Name Gender Age Title
Status of
office
Term of
office
commencing
on
Term of
office
ending on
Number of
A shares
held at the
beginning
of the
reporting
period
(shares)
Increase in
the number
of A
shares held
during the
period
(shares)
Decrease
in the
number of
A shares
held
during the
period
(shares)
Number of
A shares
held at the
end of the
reporting
period
(shares)
Reasons
for
changes
Whether
remuneration
is received
from
connected
parties Note 1
Directors of the Company Note 2
1 Hou Weigui Note 2 Male 75 Chairman Resigned 3/2013 3/2016 1,556,967 — — 1,556,967 — No
2 Zhao Xianming Note 2, Note 4 Male 50 Chairman Incumbent 3/2016 3/2019 391,515 80,000 — 471,515 Note 5 No
President 4/2016 3/2019
3 Zhang Jianheng Male 55 Vice Chairman Incumbent 3/2016 3/2019 — — — — — Yes
4 Luan Jubao Male 54 Vice Chairman Incumbent 3/2016 3/2019 — — — — — Yes
5 Shi Lirong Male 52 Director Incumbent 3/2016 3/2019 660,613 — — 660,613 — No
6 Wang Yawen Male 53 Director Incumbent 3/2016 3/2019 — — — — — Yes
7 Tian Dongfang Male 56 Director Incumbent 3/2016 3/2019 — — — — — Yes
8 Zhan Yichao Male 53 Director Incumbent 3/2016 3/2019 — — — — — Yes
9 Yin Yimin Male 53 Director Incumbent 3/2016 3/2019 759,400 — — 759,400 — No
10 Wei Zaisheng Note 2, Note 4 Male 54 Director Incumbent 3/2016 3/2019 439,677 — — 439,677 — No
Executive Vice President
and Chief Financial
Officer
4/2016 3/2019
11 Tan Zhenhui Note 2 Male 72 Independent Non-
executive Director
Resigned 3/2013 3/2016 — — — — — Yes
12 Richard Xike Zhang Male 46 Independent Non-
executive Director
Incumbent 3/2016 3/2019 — — — — — Yes
13 Chen Shaohua Male 55 Independent Non-
executive Director
Incumbent 3/2016 3/2019 — — — — — Yes
14 Lü Hongbing Male 50 Independent Non-
executive Director
Incumbent 3/2016 3/2019 — — — — — Yes
15 Bingsheng Teng Male 46 Independent Non-
executive Director
Incumbent 3/2016 3/2019 — — — — — Yes
16 Zhu Wuxiang Note 2 Male 51 Independent Non-
executive Director
Incumbent 3/2016 3/2019 — — — — — Yes
Supervisors of the Company Note 3
17 Xie Daxiong Male 53 Chairman of
Supervisory
Committee
Incumbent 3/2016 3/2019 495,803 — — 495,803 — No
18 Zhou Huidong Male 40 Supervisor Incumbent 3/2016 3/2019 70,342 — — 70,342 — No
19 Xu Weiyan Female 54 Supervisor Incumbent 3/2016 3/2019 11,039 — — 11,039 — No
20 Chang Qing Note 3 Male 61 Supervisor Resigned 3/2013 3/2016 — — — — — Yes
21 Wang Junfeng Note 3 Male 50 Supervisor Incumbent 3/2016 3/2019 — — — — — Yes
22 Xia Xiaoyue Note 3 Female 41 Supervisor Incumbent 3/2016 3/2019 50,927 — — 50,927 — No
Senior management of the Company Note 4
23 Fan Qingfeng Male 48 Executive Vice President Incumbent 4/2016 3/2019 505,687 — — 505,687 — No
24 Zeng Xuezhong Male 43 Executive Vice President Incumbent 4/2016 3/2019 552,840 — — 552,840 — No
25 Xu Huijun Note 4 Male 43 Executive Vice President Incumbent 4/2016 3/2019 630,851 — — 630,851 — No
26 Pang Shengqing Note 4 Male 48 Executive Vice President Incumbent 4/2016 3/2019 571,682 — — 571,682 — No
27 Zhang Zhenhui Note 4 Male 43 Executive Vice President Incumbent 4/2016 3/2019 148,200 — — 148,200 — No
28 Chen Jianzhou Note 4 Male 46 Executive Vice President Incumbent 4/2016 3/2019 167,769 82,000 — 249,769 Note 5 No
29 Tian Wenguo Note 4 Male 47 Executive Vice President Resigned 4/2013 3/2016 256,390 — — 256,390 — No
30 Qiu Weizhou Note 4 Male 53 Executive Vice President Resigned 4/2013 3/2016 440,537 — — 440,537 — No
31 Chen Jie Female 58 Senior Vice President Note 4 4/2013 3/2016 745,599 — — 745,599 — No
32 Ye Weimin Male 50 Senior Vice President Note 4 4/2013 3/2016 474,523 — — 474,523 — No
33 Zhu Jinyun Male 44 Senior Vice President Note 4 4/2013 3/2016 596,213 — — 596,213 — No
34 Zhang Renjun Male 47 Senior Vice President Note 4 4/2013 3/2016 — — — — — No
35 Cheng Lixin Male 50 Senior Vice President Note 4 4/2013 3/2016 75,600 — — 75,600 — No
36 Xiong Hui Male 47 Senior Vice President Note 4 1/2014 3/2016 51,700 92,300 — 144,000 Note 5 No
37 Huang Dabin Male 45 Senior Vice President Note 4 8/2015 3/2016 90,000 — — 90,000 — No
38 Cao Wei Note 4 Female 40 Secretary to the Board Incumbent 4/2016 3/2019 25,200 — 25,200 — Note 5 No
39 Feng Jianxiong Note 4 Male 42 Secretary to the Board Resigned 4/2013 3/2016 391,500 — — 391,500 — No
40 Others Note 6 — — — — — — 82,600 — — 82,600 — —
— Total — — — — — — 10,243,174 254,300 25,200 10,472,274 — —
– 10 –
yiu.tsui
A161291 1st Proof Time/date: 25-08-2016_14:21:50 Cre8 (852) 3693 2600 yiu.tsui
Note 1: Pursuant to Rule 10.1.3(III) of the Rules Governing the Listing of Stocks on the Shenzhen Stock Exchange, legal entities or other entities in which the Directors, Supervisors and senior management of a listed company acted as directors and senior management (other than the listed company and its subsidiaries) are deemed as connected parties of the listed company.
Note 2: The term of office of the Sixth Session of the Board of Directors of the Company concluded on 29 March 2016. At the First Extraordinary General Meeting of 2016 of the Company held on 3 March 2016, Mr. Zhang Jianheng, Mr. Luan Jubao, Mr. Shi Lirong, Mr. Wang Yawen, Mr. Tian Dongfang and Mr. Zhan Yichao were elected Non-executive Directors of the Seventh Session of the Board of Directors of the Company; Mr. Zhao Xianming, Mr. Yin Yimin and Mr. Wei Zaisheng were elected Executive Directors of the Seventh Session of the Board of Directors of the Company; and Mr. Richard Xike Zhang, Mr. Chen Shaohua, Mr. Lü Hongbing, Mr. Bingsheng Teng and Mr. Zhu Wuxiang were elected Independent Non-executive Directors of the Seventh Session of the Board of Directors of the Company. The term of office of the Seventh Session of the Board of Directors of the Company shall commence on 30 March 2016 and end on 29 March 2019. At the First Meeting of the Seventh Session of the Board of Directors of the Company held on 5 April 2016, Mr. Zhao Xianming was elected Chairman of the Company, Mr. Zhang Jianheng and Mr. Luan Jubao were each elected Vice Chairman of the Company.
Note 3: The term of office of the Sixth Session of Supervisory Committee of the Company concluded on 29 March 2016. At the First Extraordinary General Meeting of 2016 of the Company held on 3 March 2016, Ms. Xu Weiyan and Mr. Wang Junfeng were elected Shareholders’ Representative Supervisors of the Seventh Session of the Supervisory Committee of the Company. On 17 February 2016, Mr. Xie Daxiong, Mr. Zhou Huidong and Ms. Xia Xiaoyue were elected Staff Representative Supervisors of the Seventh Session of the Supervisory Committee of the Company through democratic elections by the staff representatives of the Company. The term of office of the Seventh Session of the Supervisory Committee of the Company shall commence on 30 March 2016 and end on 29 March 2019. At the First Meeting of the Seventh Session of the Supervisory Committee of the Company held on 6 April 2016, Mr. Xie Daxiong was elected Chairman of the Supervisory Committee of the Company.
Note 4: The term of office of the senior management appointed by the Sixth Session of the Board of Directors of the Company concluded on 29 March 2016. At the First Meeting of the Seventh Session of the Board of Directors of the Company held on 5 April 2016, Mr. Zhao Xianming was appointed President of the Company; Mr. Wei Zaisheng, Mr. Fan Qingfeng, Mr. Zeng Xuezhong, Mr. Xu Huijun, Mr. Pang Shengqing, Mr. Zhang Zhenhui and Mr. Chen Jianzhou were each appointed Executive Vice President of the Company; Mr. Wei Zaisheng was concurrently appointed Chief Financial Officer of the Company; and Ms. Cao Wei was appointed Secretary to the Board of Directors of the Company and removed from the position of securities affairs representative of the Company. The term of office of the aforesaid new session of senior management shall commence on the date on which the appointment was considered and approved at the said meeting of the Board of Directors and end on the date of conclusion of the term of office of the Seventh Session of the Board of Directors (namely, 29 March 2019).
Note 5: Reduction or increase of shareholdings in accordance with “Rules Governing the Holding of Shares in the Company by Directors, Supervisors and Senior Management of Listed Companies and Changes Thereof”, including the exercise of A share options.
Note 6: As disclosed in the “Further Announcement on the Fulfillment and Completion of Undertaking of Directors and Senior Management to Increase Shareholdings in the Company” published by the Company on 26 August 2015, then Director Mr. He Shiyou and then senior management members Mr. Zhang Zhenhui, Mr. Qiu Weizhao, Mr. Chen Jianzhou, Mr. Fan Qingfeng, Mr. Pang Shengqing, Mr. Zhang Renjun, Mr. Ye Weimin, Mr. Xiong Hui and Mr. Feng Jianxiong had undertaken to increase shareholdings in the Company, and increased their shareholdings in the Company by 82,600 A shares indirectly through an asset management plan. Such shares are not included in the shareholdings of the senior management in the A shares of the Company set out in the above table.
Note 7: As at the end of the reporting period, Mr. Wei Zaisheng held 30,000 H shares of the Company. Save as that, no other Directors, Supervisors or senior management of the Company held any H shares in the issued share capital of the Company.
– 11 –
yiu.tsui
A161291 1st Proof Time/date: 25-08-2016_14:21:50 Cre8 (852) 3693 2600 yiu.tsui
During the reporting period, no share options had been granted to the Directors, Supervisors and senior management of the Company.
For details of the A share options of the Company held by Directors and senior management of the Company during the reporting period, please refer to the section headed “Material Matters — (VII) Information on the Share Option Incentive Scheme of the Company” in the Interim Report. Supervisors of the Company did not hold any A share options of the Company.
6.2 Interests of Directors, Supervisors and Chief Executive Officer of the Company in shares or debentures
The interests in shares of the Company held by Directors, Supervisors and Chief Executive Officer of the Company as at 30 June 2016 are set out in the section of this chapter headed “6.1 Changes in the holdings of shares and share options in the Company by the Company’s Directors, Supervisors and senior management”.
Save as disclosed above, as at 30 June 2016, none of the Directors, Supervisors and Chief Executive Officer of the Company had any interest or short position in the shares, underlying shares and debentures of the Company and its associated corporations (within the meaning of Part XV of the SFO) that is required to be recorded in the register to be kept under Section 352 of the SFO, or otherwise notified to the Company and the Hong Kong Stock Exchange pursuant to the Model Code for Securities Transactions by Directors of Listed Issuers (the “Model code”) as set out in Appendix 10 to the Hong Kong Listing Rules.
Save as disclosed above, as at 30 June 2016, none of the Directors, Supervisors or the Chief Executive Officer of the Company, or their respective spouses or children under the age of 18 had been granted or had exercised any rights to subscribe for the share capital or debentures of the Company or its associated corporations.
7. REPORT OF THE BOARD OF DIRECTORS
7.1 Review of business in the first half of 2016
(1) Overview of the domestic telecommunications industry for the first half of 2016
During the first half of 2016, data flow handled by carriers increased rapidly with the further expansion of 4G networks operated by domestic carriers, advance of the Broadband China strategy, ongoing penetration and application of cloud computing and big data, development of big video and big bandwidth services and the acceleration of mobile interconnection of all things. To cope with the pressure of increasing data flow and drive business transformation, carriers increased their investment in smart pipes, cloud computing, big data, internet of things and big video, while remaining focused on the construction of wireless, transmission and broadband networks.
(2) Overview of the global telecommunications industry for the first half of 2016
Traditional telecommunication businesses were exposed to increasing pressure in operations during the first half of 2016, as the transformation and upgrade of the industry gained pace. Elsewhere, the advances and application of Pre-5G technologies, expansion of “internet+” in traditional industries, development of integrated new businesses, preliminary application of SDN/NFV technologies, balance of security and privacy, development of AR/VR technologies represented some of the latest trends in the industry. Meanwhile, the
– 12 –
yiu.tsui
A161291 1st Proof Time/date: 25-08-2016_14:21:50 Cre8 (852) 3693 2600 yiu.tsui
telecommunications sector welcomed opportunities for innovation afforded by the development of industry 4.0, artificial intelligence, smart city, intelligent manufacturing, internet of things and internet of energy.
(3) Operating results of the Group for the first half of 2016
For the first half of 2016, the Group’s overall operating revenue increased by 4.05% to RMB47,757 million, as compared to the first half of 2015, reflecting primarily the increase in operating revenue from 4G system products and cloud computing and IT products in the domestic and international markets, as well as optical transmission products and handset products in the domestic market. The Group’s net profit attributable to holders of ordinary shares of the listed company amounted to RMB1,766 million for the six months ended 30 June 2016, representing a year-on-year growth of 9.33%. Basic earnings per share amounted to RMB0.43.
A. By market
The domestic market
During the reporting period, the Group reported operating revenue of RMB27,803 million from the domestic market, accounting for 58.22% of the Group’s overall operating revenue. The Group worked proactively in support of the network construction plans and application requirements of domestic carriers and government and corporate clients, while increasing investments in channel development and brand building for our consumer business. Meanwhile, we were also vigorously expanding our cloud computing and big data services and businesses in smart city, high-end routers, big video, internet of things, VR and quantum communication, etc.
The international market
During the reporting period, the Group reported operating revenue of RMB19,954 million from the international market, accounting for 41.78% of the Group’s overall operating revenue. The Group forged closer strategic partnerships with global mainstream carriers by introducing innovations in technologies and product solutions and improving its competitive strengths, in persistent implementation of its strategy of focusing on populous nations and mainstream carriers. In the meantime, the Group served government and corporate customers extensively by launching new products and solutions in government informatisation services, corporate IT services and consumer smart terminals, aiming to drive sustainable development in the future.
B. By business segment
During the reporting period, the Group reported operating revenue of RMB28,735 million for carriers’ networks. Operating revenue for government and corporate business amounted to RMB4,607 million. Operating revenue for the consumer business amounted to RMB14,415 million.
– 13 –
yiu.tsui
A161291 1st Proof Time/date: 25-08-2016_14:21:50 Cre8 (852) 3693 2600 yiu.tsui
Carriers’ network
In connection with wireless products, the Group persisted in innovation to enhance its competitiveness. The profile of the domestic and overseas markets for 4G products was optimized, as we capitalized on the window for large-scale 4G construction to help global carriers lower their consolidated costs and improve their operational capabilities. For the future developments in wireless communications, the planning and subsequent launch of the Pre-5G product series has provided an effective backing for the implementation of an evolvable high-performance network. Pre-5G tests for large-scale operation were actively underway, while the Group’s work in the formulation of 5G standards has also achieved initial results. In connection with the market for the internet of things, the Group has expedited progress in the formulation of standards for the internet of things, technological research and development, product design and application of solutions in close tandem with its M-ICT strategy, laying a solid foundation for large-scale growth in the future.
In connection with wireline and optical communications products, the Group seized opportunities arising from the implementation of the Broadband China strategy and overseas demand for broadband network construction, and strengthened the marketing of solutions in various sectors such as big video, data centre, smart city and government and corporate services, giving assurance to ongoing solid operations.
In connection with cloud computing and IT products, the Group strengthened its research, development and investment in RCS, big video, cloud computing, big data and internet of things, while establishing its presence in distributed database, AR, artificial intelligence and in-depth learning to assure balanced development.
Government and corporate business
With the adoption of smart city as its main strategy, the Group was focused on key sectors and markets, such as the government, energy, transportation, finance and education. Our market position was steadily enhanced with sustained market growth, as we accelerated expansion through the dual strategy of being ready “to integrate as well as to be integrated,” while strengthening the standardised operation of projects and launching fast replication of successful projects.
Consumer business
In connection with handset terminals, the Group continued to reinforce its global strategic set up with ongoing effort to enhance its ability in product innovation, channel development, brand marketing and services. Our product series, notably AXON, Blade and Spro, have been well received by the market and users. In connection with the home media centre, the Group continued to expand its market and launch new products on the back of the rapid growth in domestic and international home video markets, developments in 4K and HDR technologies and the upgrade and replacement demands for relevant equipment and technologies. In connection with fixed-network broadband terminals, the Group launched a new-generation interactive home entertainment and smart home solution as well as home security products with initial success.
– 14 –
yiu.tsui
A161291 1st Proof Time/date: 25-08-2016_14:21:50 Cre8 (852) 3693 2600 yiu.tsui
7.2 Management discussion and analysis prepared in accordance with PRC ASBEs
The financial data below are extracted from the Group’s unaudited financial statements prepared in accordance with PRC ASBEs. The following discussion and analysis should be read in conjunction with the Group’s financial statements and the accompanying notes as set out in the Interim Report.
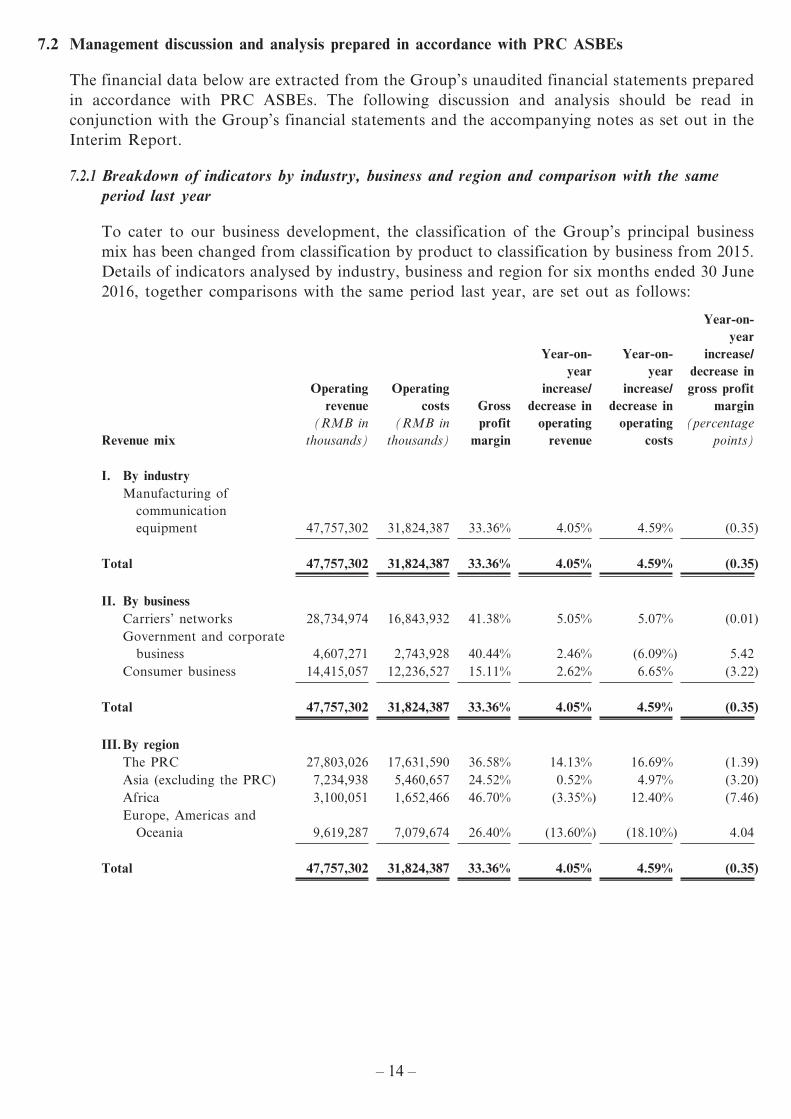
7.2.1 Breakdown of indicators by industry, business and region and comparison with the same period last year
To cater to our business development, the classification of the Group’s principal business mix has been changed from classification by product to classification by business from 2015. Details of indicators analysed by industry, business and region for six months ended 30 June 2016, together comparisons with the same period last year, are set out as follows:
Revenue mix
Operating revenue
(RMB in thousands)
Operating costs
(RMB in thousands)
Gross profit
margin
Year-on-year
increase/decrease in
operating revenue
Year-on-year
increase/decrease in
operating costs
Year-on-year
increase/decrease in gross profit
margin (percentage
points)
I. By industryManufacturing of
communication equipment 47,757,302 31,824,387 33.36% 4.05% 4.59% (0.35)
Total 47,757,302 31,824,387 33.36% 4.05% 4.59% (0.35)
II. By businessCarriers’ networks 28,734,974 16,843,932 41.38% 5.05% 5.07% (0.01)Government and corporate
business 4,607,271 2,743,928 40.44% 2.46% (6.09%) 5.42Consumer business 14,415,057 12,236,527 15.11% 2.62% 6.65% (3.22)
Total 47,757,302 31,824,387 33.36% 4.05% 4.59% (0.35)
III. By regionThe PRC 27,803,026 17,631,590 36.58% 14.13% 16.69% (1.39)Asia (excluding the PRC) 7,234,938 5,460,657 24.52% 0.52% 4.97% (3.20)Africa 3,100,051 1,652,466 46.70% (3.35%) 12.40% (7.46)Europe, Americas and
Oceania 9,619,287 7,079,674 26.40% (13.60%) (18.10%) 4.04
Total 47,757,302 31,824,387 33.36% 4.05% 4.59% (0.35)
– 15 –
yiu.tsui
A161291 1st Proof Time/date: 25-08-2016_14:21:50 Cre8 (852) 3693 2600 yiu.tsui
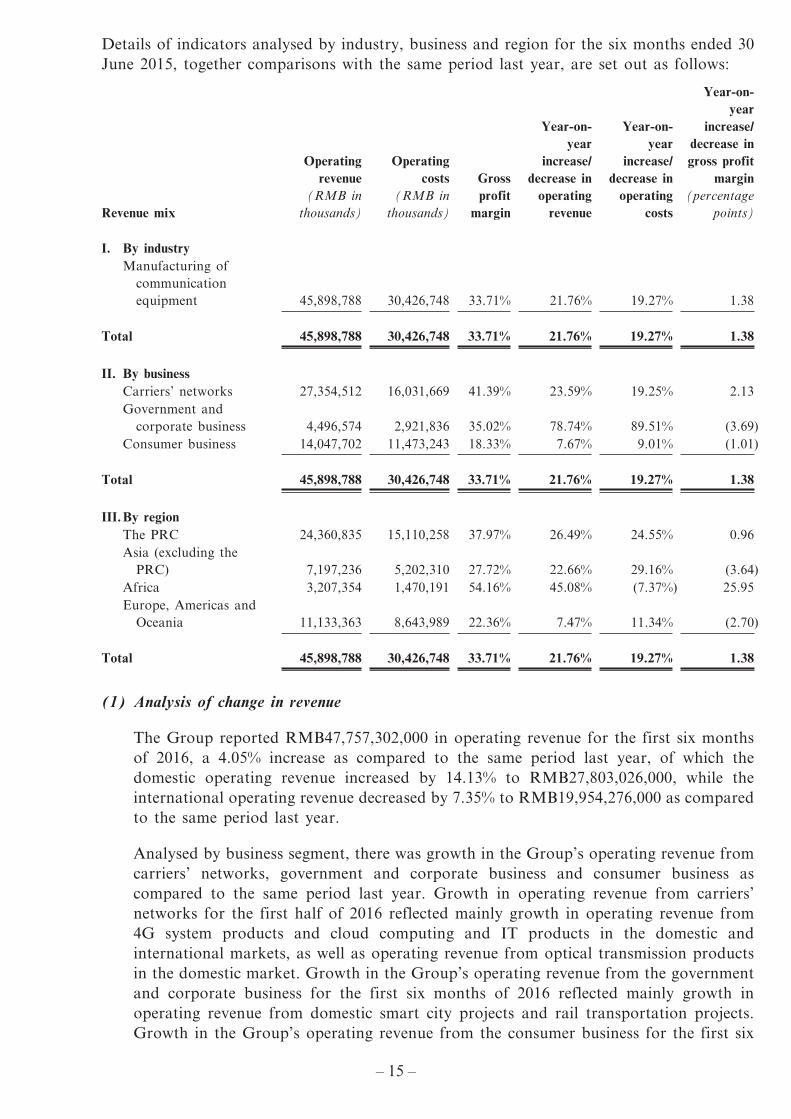
Details of indicators analysed by industry, business and region for the six months ended 30 June 2015, together comparisons with the same period last year, are set out as follows:
Revenue mix
Operating revenue
(RMB in thousands)
Operating costs
(RMB in thousands)
Gross profit
margin
Year-on-year
increase/decrease in
operating revenue
Year-on-year
increase/decrease in
operating costs
Year-on-year
increase/decrease in gross profit
margin (percentage
points)
I. By industryManufacturing of
communication equipment 45,898,788 30,426,748 33.71% 21.76% 19.27% 1.38
Total 45,898,788 30,426,748 33.71% 21.76% 19.27% 1.38
II. By businessCarriers’ networks 27,354,512 16,031,669 41.39% 23.59% 19.25% 2.13Government and
corporate business 4,496,574 2,921,836 35.02% 78.74% 89.51% (3.69)Consumer business 14,047,702 11,473,243 18.33% 7.67% 9.01% (1.01)
Total 45,898,788 30,426,748 33.71% 21.76% 19.27% 1.38
III. By regionThe PRC 24,360,835 15,110,258 37.97% 26.49% 24.55% 0.96Asia (excluding the
PRC) 7,197,236 5,202,310 27.72% 22.66% 29.16% (3.64)Africa 3,207,354 1,470,191 54.16% 45.08% (7.37%) 25.95Europe, Americas and
Oceania 11,133,363 8,643,989 22.36% 7.47% 11.34% (2.70)
Total 45,898,788 30,426,748 33.71% 21.76% 19.27% 1.38
(1) Analysis of change in revenue
The Group reported RMB47,757,302,000 in operating revenue for the first six months of 2016, a 4.05% increase as compared to the same period last year, of which the domestic operating revenue increased by 14.13% to RMB27,803,026,000, while the international operating revenue decreased by 7.35% to RMB19,954,276,000 as compared to the same period last year.
Analysed by business segment, there was growth in the Group’s operating revenue from carriers’ networks, government and corporate business and consumer business as compared to the same period last year. Growth in operating revenue from carriers’ networks for the first half of 2016 reflected mainly growth in operating revenue from 4G system products and cloud computing and IT products in the domestic and international markets, as well as operating revenue from optical transmission products in the domestic market. Growth in the Group’s operating revenue from the government and corporate business for the first six months of 2016 reflected mainly growth in operating revenue from domestic smart city projects and rail transportation projects. Growth in the Group’s operating revenue from the consumer business for the first six
– 16 –
yiu.tsui
A161291 1st Proof Time/date: 25-08-2016_14:21:50 Cre8 (852) 3693 2600 yiu.tsui
months of 2016 reflected mainly growth in operating revenue from handset products in the domestic and European markets and home terminal products in the domestic market.
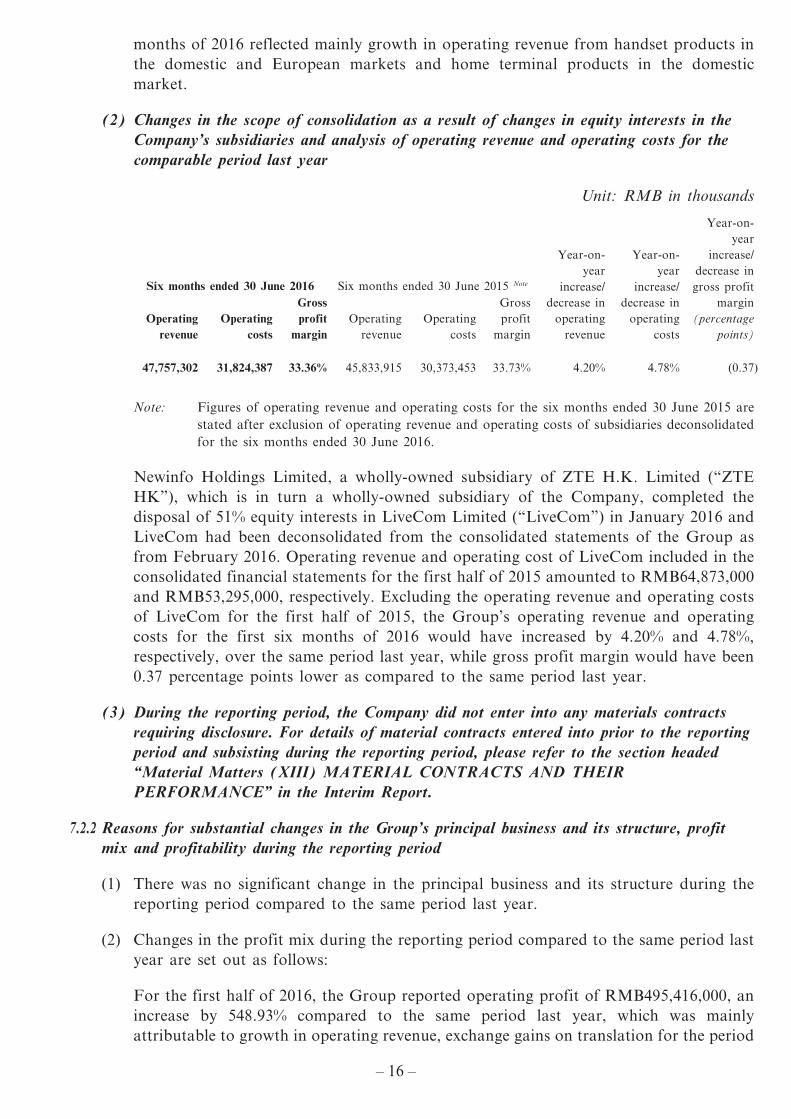
(2) Changes in the scope of consolidation as a result of changes in equity interests in the Company’s subsidiaries and analysis of operating revenue and operating costs for the comparable period last year
Unit: RMB in thousands
Six months ended 30 June 2016 Six months ended 30 June 2015 Note
Year-on-year
increase/decrease in
operating revenue
Year-on-year
increase/decrease in
operating costs
Year-on-year
increase/decrease in gross profit
margin (percentage
points)Operating
revenueOperating
costs
Gross profit
marginOperating
revenueOperating
costs
Gross profit
margin
47,757,302 31,824,387 33.36% 45,833,915 30,373,453 33.73% 4.20% 4.78% (0.37)
Note: Figures of operating revenue and operating costs for the six months ended 30 June 2015 are stated after exclusion of operating revenue and operating costs of subsidiaries deconsolidated for the six months ended 30 June 2016.
Newinfo Holdings Limited, a wholly-owned subsidiary of ZTE H.K. Limited (“ZTE HK”), which is in turn a wholly-owned subsidiary of the Company, completed the disposal of 51% equity interests in LiveCom Limited (“LiveCom”) in January 2016 and LiveCom had been deconsolidated from the consolidated statements of the Group as from February 2016. Operating revenue and operating cost of LiveCom included in the consolidated financial statements for the first half of 2015 amounted to RMB64,873,000 and RMB53,295,000, respectively. Excluding the operating revenue and operating costs of LiveCom for the first half of 2015, the Group’s operating revenue and operating costs for the first six months of 2016 would have increased by 4.20% and 4.78%, respectively, over the same period last year, while gross profit margin would have been 0.37 percentage points lower as compared to the same period last year.
(3) During the reporting period, the Company did not enter into any materials contracts requiring disclosure. For details of material contracts entered into prior to the reporting period and subsisting during the reporting period, please refer to the section headed “Material Matters (XIII) MATERIAL CONTRACTS AND THEIR PERFORMANCE” in the Interim Report.
7.2.2 Reasons for substantial changes in the Group’s principal business and its structure, profit mix and profitability during the reporting period
(1) There was no significant change in the principal business and its structure during the reporting period compared to the same period last year.
(2) Changes in the profit mix during the reporting period compared to the same period last year are set out as follows:
For the first half of 2016, the Group reported operating profit of RMB495,416,000, an increase by 548.93% compared to the same period last year, which was mainly attributable to growth in operating revenue, exchange gains on translation for the period
– 17 –
yiu.tsui
A161291 1st Proof Time/date: 25-08-2016_14:21:50 Cre8 (852) 3693 2600 yiu.tsui
versus exchange losses on translation for the same period last year due to exchange rate volatility, as well as the reduction in impairment losses owing to changes in the mix of trade receivables requiring new charge for bad debt provisions. Expenses for the period amounted to RMB14,336,698,000, which was 9.94% higher as compared to the same period last year, reflecting mainly increased investment in research and development for the period. Investment income amounted to RMB357,965,000, a slight decrease by 1.19% as compared to the same period last year. Net non-operating income and expenses amounted to RMB2,212,365,000, a year-on-year increase of 7.08%, reflecting increase in income from financial subsidies for the period.
(3) Changes in the profitability (gross profit margin) of our principal business during the reporting period compared to the same period last year are set out as follows:
The gross profit margin of the Group for the first half of 2016 was 33.36%, which was 0.35 percentage points lower compared with the same period last year, reflecting lower gross profit margin for carriers’ networks in the international markets and the consumer business in the domestic market.
7.3 Management discussion and analysis prepared in accordance with HKFRSs
The financial data below are extracted from the Group’s unaudited financial statements prepared in accordance with HKFRSs. The following discussion and analysis should be read in conjunction with the Group’s financial statements and the accompanying notes as set out in the Interim Report.
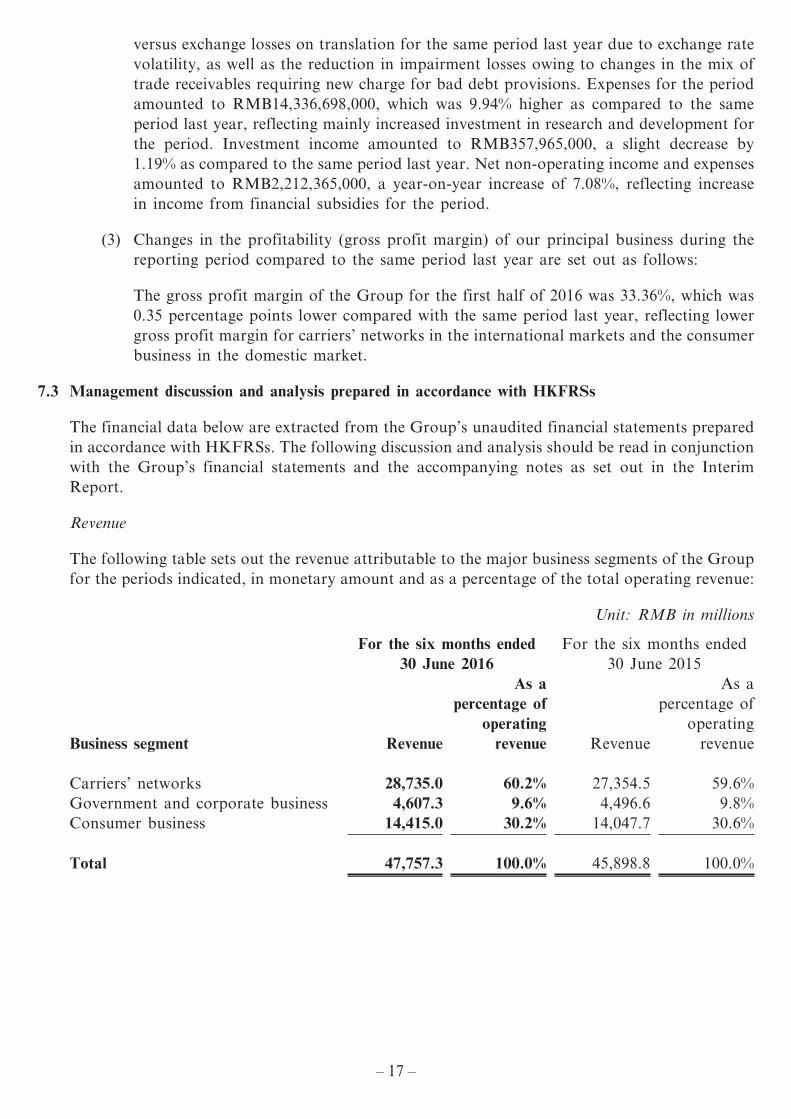
Revenue
The following table sets out the revenue attributable to the major business segments of the Group for the periods indicated, in monetary amount and as a percentage of the total operating revenue:
Unit: RMB in millions
For the six months ended 30 June 2016
For the six months ended 30 June 2015
Business segment Revenue
As a percentage of
operating revenue Revenue
As a percentage of
operating revenue
Carriers’ networks 28,735.0 60.2% 27,354.5 59.6%Government and corporate business 4,607.3 9.6% 4,496.6 9.8%Consumer business 14,415.0 30.2% 14,047.7 30.6%
Total 47,757.3 100.0% 45,898.8 100.0%
– 18 –
yiu.tsui
A161291 1st Proof Time/date: 25-08-2016_14:21:50 Cre8 (852) 3693 2600 yiu.tsui
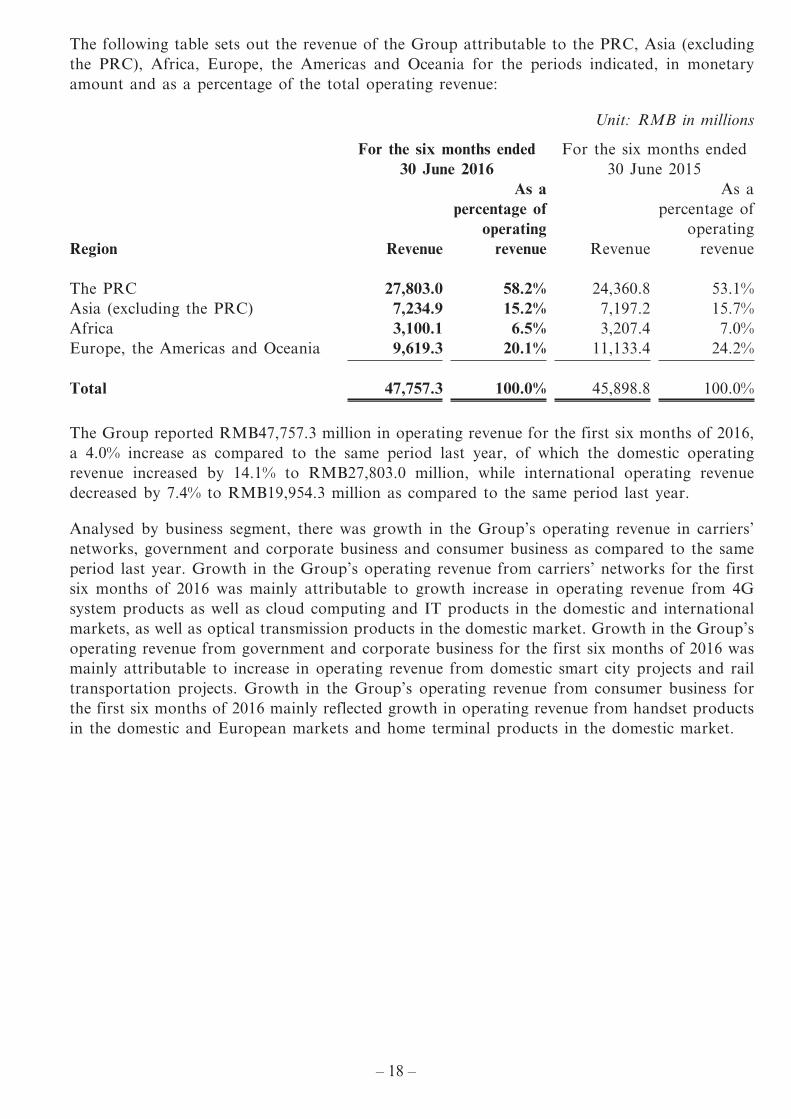
The following table sets out the revenue of the Group attributable to the PRC, Asia (excluding the PRC), Africa, Europe, the Americas and Oceania for the periods indicated, in monetary amount and as a percentage of the total operating revenue:
Unit: RMB in millions
For the six months ended 30 June 2016
For the six months ended 30 June 2015
Region Revenue
As a percentage of
operating revenue Revenue
As a percentage of
operating revenue
The PRC 27,803.0 58.2% 24,360.8 53.1%Asia (excluding the PRC) 7,234.9 15.2% 7,197.2 15.7%Africa 3,100.1 6.5% 3,207.4 7.0%Europe, the Americas and Oceania 9,619.3 20.1% 11,133.4 24.2%
Total 47,757.3 100.0% 45,898.8 100.0%
The Group reported RMB47,757.3 million in operating revenue for the first six months of 2016, a 4.0% increase as compared to the same period last year, of which the domestic operating revenue increased by 14.1% to RMB27,803.0 million, while international operating revenue decreased by 7.4% to RMB19,954.3 million as compared to the same period last year.
Analysed by business segment, there was growth in the Group’s operating revenue in carriers’ networks, government and corporate business and consumer business as compared to the same period last year. Growth in the Group’s operating revenue from carriers’ networks for the first six months of 2016 was mainly attributable to growth increase in operating revenue from 4G system products as well as cloud computing and IT products in the domestic and international markets, as well as optical transmission products in the domestic market. Growth in the Group’s operating revenue from government and corporate business for the first six months of 2016 was mainly attributable to increase in operating revenue from domestic smart city projects and rail transportation projects. Growth in the Group’s operating revenue from consumer business for the first six months of 2016 mainly reflected growth in operating revenue from handset products in the domestic and European markets and home terminal products in the domestic market.
– 19 –
yiu.tsui
A161291 1st Proof Time/date: 25-08-2016_14:21:50 Cre8 (852) 3693 2600 yiu.tsui
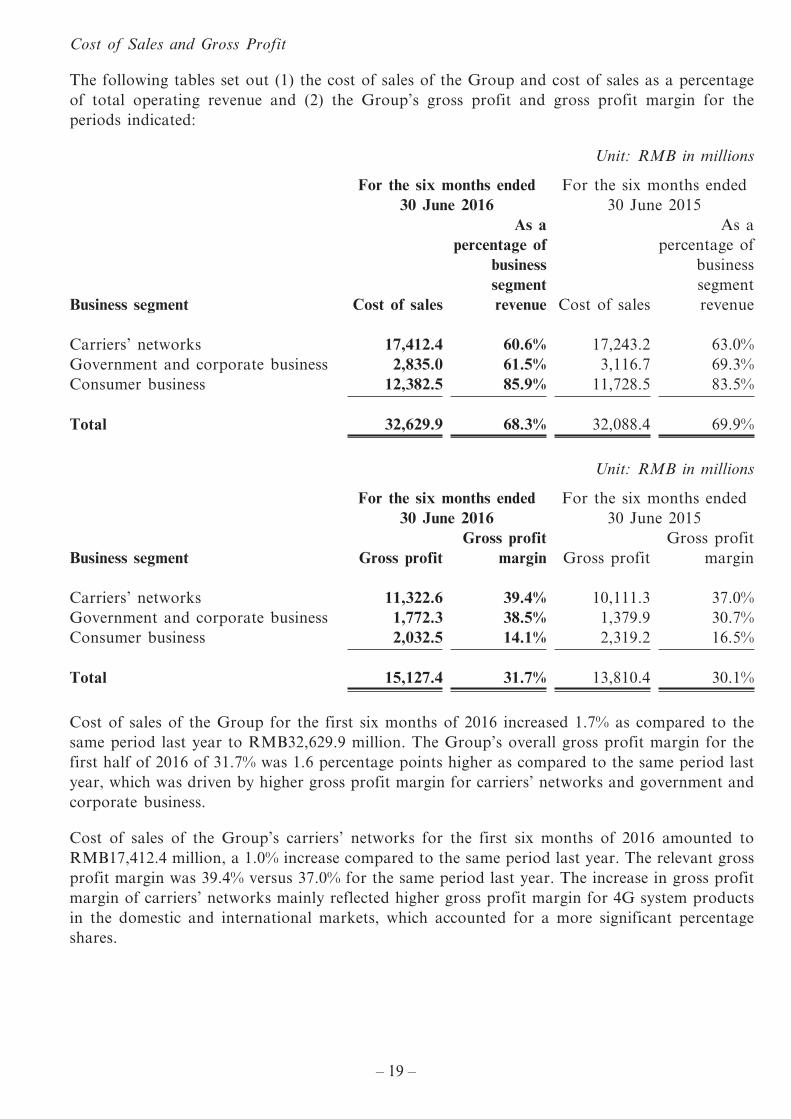
Cost of Sales and Gross Profit
The following tables set out (1) the cost of sales of the Group and cost of sales as a percentage of total operating revenue and (2) the Group’s gross profit and gross profit margin for the periods indicated:
Unit: RMB in millions
For the six months ended 30 June 2016
For the six months ended 30 June 2015
Business segment Cost of sales
As a percentage of
business segment revenue Cost of sales
As a percentage of
business segment revenue
Carriers’ networks 17,412.4 60.6% 17,243.2 63.0%Government and corporate business 2,835.0 61.5% 3,116.7 69.3%Consumer business 12,382.5 85.9% 11,728.5 83.5%
Total 32,629.9 68.3% 32,088.4 69.9%
Unit: RMB in millions
For the six months ended 30 June 2016
For the six months ended 30 June 2015
Business segment Gross profitGross profit
margin Gross profitGross profit
margin
Carriers’ networks 11,322.6 39.4% 10,111.3 37.0%Government and corporate business 1,772.3 38.5% 1,379.9 30.7%Consumer business 2,032.5 14.1% 2,319.2 16.5%
Total 15,127.4 31.7% 13,810.4 30.1%
Cost of sales of the Group for the first six months of 2016 increased 1.7% as compared to the same period last year to RMB32,629.9 million. The Group’s overall gross profit margin for the first half of 2016 of 31.7% was 1.6 percentage points higher as compared to the same period last year, which was driven by higher gross profit margin for carriers’ networks and government and corporate business.
Cost of sales of the Group’s carriers’ networks for the first six months of 2016 amounted to RMB17,412.4 million, a 1.0% increase compared to the same period last year. The relevant gross profit margin was 39.4% versus 37.0% for the same period last year. The increase in gross profit margin of carriers’ networks mainly reflected higher gross profit margin for 4G system products in the domestic and international markets, which accounted for a more significant percentage shares.
– 20 –
yiu.tsui
A161291 1st Proof Time/date: 25-08-2016_14:21:50 Cre8 (852) 3693 2600 yiu.tsui
Cost of sales of the Group’s government and corporate business for the first six months of 2016 amounted to RMB2,835.0 million, a decline of 9.0% compared to the same period last year. The relevant gross profit margin was 38.5% versus 30.7% for the same period last year. The increase in the gross profit margin of government and corporate business was mainly driven by the increase in the gross profit margin of international government and corporate projects.
Cost of sales of the Group’s consumer business for the first six months of 2016 amounted to RMB12,382.5 million, increasing by 5.6% compared to the same period last year. The relevant gross profit margin was 14.1%, compared to 16.5% for the same period last year. The decline in the gross profit margin of consumer business reflected mainly lower gross profit margin for domestic home terminal products.
Other Income and Gains
Other income and gains of the Group for the first six months of 2016 amounted to RMB3,681.4 million, representing a 29.6% increase compared to RMB2,840.3 million for the first six months of 2015. The increase reflected mainly increased net gains as a result of exchange rate volatility and increased gains from the disposal of available-for-sale financial assets of the Group for the period.
Research and Development Costs
The Group’s research and development costs for the first six months of 2016 increased by 28.5% to RMB7,059.2 million from RMB5,491.9 million for the first six months of 2015, which was mainly attributable to the ongoing increase in the Group’s investment in the research and development of products such as 5G, high-end routers, LTE, SDN, GPON and core chipsets during the period. Research and development costs as a percentage of operating revenue increased by 2.8 percentage points to 14.8%, as compared to 12.0% for the six months ended 30 June 2015.
Selling and Distribution Expenses
The Group’s selling and distribution expenses for the first six months of 2016 increased by 11.9% to RMB6,052.2 million from RMB5,406.8 million for the first six months of 2015, which was mainly attributable to increased investment in the domestic market by the Group during the period. Selling and distribution expenses as a percentage of operating revenue was 12.7%, increasing by 0.9 percentage points compared to 11.8% for the first six months of 2015.
Administrative Expenses
Administrative expenses of the Group for the first six months of 2016 increased by 17.0% to RMB1,454.7 million, as compared to RMB1,243.8 million for the first six months of 2015, which was mainly attributable to the increase in the Group’s per capita remuneration for the period. Administrative expenses as a percentage of operating revenue increased by 0.3 percentage points to 3.0% from 2.7% for the first six months of 2015.
Other Expenses
Other expenses comprise mainly asset impairment losses, exchange losses and non-operating expenses. Other expenses of the Group for the first six months of 2016 decreased by 44.2% to RMB912.3 million, as compared to RMB1,635.6 million for the first six months of 2015. Provision for bad debts of trade receivables decreased by RMB456.3 million as compared to the same period last year, reflecting mainly the change in the mix of the Group’s trade receivables
– 21 –
yiu.tsui
A161291 1st Proof Time/date: 25-08-2016_14:21:50 Cre8 (852) 3693 2600 yiu.tsui
requiring new charge for bad debt provisions for the period. Exchange losses for the same period last year amounted to RMB428.3 million, while net gains arising from exchange rate volatility for the period were accounted for as other income and gains.
Profit from Operating Activities
The Group’s profit from operating activities for the first six months of 2016 increased by 15.9% to RMB3,330.5 million, as compared to RMB2,872.6 million for the first six months of 2015, while the operating profit margin increased by 0.7 percentage points to 7.0% from 6.3% for the first six months of 2015, reflecting primarily the combined effect of the increase in gross profit and the decrease in bad debt provisions for trade receivables of the Group for the period.
Finance Costs
Finance costs of the Group for the first six months of 2016 decreased by 12.8% to RMB603.2 million as compared to RMB692.1 million for the first six months of 2015, which was attributable mainly to the Group’s efforts to enhance treasury management, optimise debt structure and lower interest expenses during the period.
Income Tax Expense
The Group’s income tax expense for the first six months of 2016 was RMB519.4 million, which was 67.4% higher as compared to RMB310.2 million for the first six months of 2015. The increase was mainly attributable to the increase in profit for the period and the application of profit for the same period last year to make up for losses in previous years.
Profit Attributable to Non-Controlling Interests
The Group’s profit attributable to non-controlling interests for the first six months of 2016 amounted to RMB172.0 million, representing an increase of 380.4% compared to RMB35.8 million for the first six months of 2015, reflecting mainly higher gains from the disposal of equity interests in other companies held by the fund partnerships under Shenzhen ZTE Capital Management Company Limited.
Other Comprehensive Income
Other comprehensive income of the Group for the first six months of 2016 amounted to RMB-673.7 million, compared to RMB559.6 million for the first six months of 2015, which was mainly attributable to greater translation losses on the Group’s statements denominated in foreign currencies owing to exchange rate volatility for the period, as well as losses arising from volatility in the market prices of restricted equity interests in listed companies held recorded for the period versus significant gains recorded for the same period last year.
Debt-Equity Ratio and the Basis of Calculation
Debt-equity ratio is calculated by dividing interest-bearing liabilities by the sum of interest-bearing liabilities and equity (including non-controlling interests).
The Group’s debt-equity ratio for the first six months of 2016 was 36.0%, decreasing by 1.0 percentage point as compared to 37.0% for 2015. The decrease was mainly attributable to the repayment of the super short-term commercial paper by the Group during the period.
– 22 –
yiu.tsui
A161291 1st Proof Time/date: 25-08-2016_14:21:50 Cre8 (852) 3693 2600 yiu.tsui
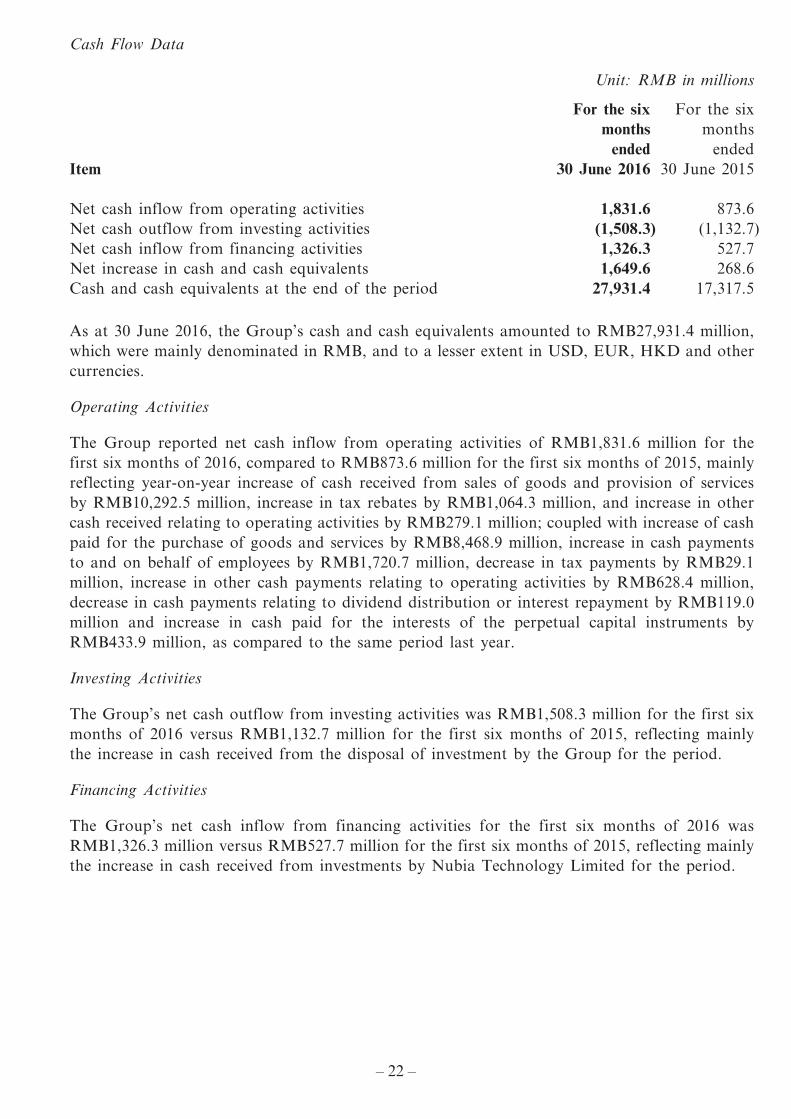
Cash Flow Data
Unit: RMB in millions
Item
For the six months
ended 30 June 2016
For the six months
ended 30 June 2015
Net cash inflow from operating activities 1,831.6 873.6Net cash outflow from investing activities (1,508.3) (1,132.7)Net cash inflow from financing activities 1,326.3 527.7Net increase in cash and cash equivalents 1,649.6 268.6Cash and cash equivalents at the end of the period 27,931.4 17,317.5
As at 30 June 2016, the Group’s cash and cash equivalents amounted to RMB27,931.4 million, which were mainly denominated in RMB, and to a lesser extent in USD, EUR, HKD and other currencies.
Operating Activities
The Group reported net cash inflow from operating activities of RMB1,831.6 million for the first six months of 2016, compared to RMB873.6 million for the first six months of 2015, mainly reflecting year-on-year increase of cash received from sales of goods and provision of services by RMB10,292.5 million, increase in tax rebates by RMB1,064.3 million, and increase in other cash received relating to operating activities by RMB279.1 million; coupled with increase of cash paid for the purchase of goods and services by RMB8,468.9 million, increase in cash payments to and on behalf of employees by RMB1,720.7 million, decrease in tax payments by RMB29.1 million, increase in other cash payments relating to operating activities by RMB628.4 million, decrease in cash payments relating to dividend distribution or interest repayment by RMB119.0 million and increase in cash paid for the interests of the perpetual capital instruments by RMB433.9 million, as compared to the same period last year.
Investing Activities
The Group’s net cash outflow from investing activities was RMB1,508.3 million for the first six months of 2016 versus RMB1,132.7 million for the first six months of 2015, reflecting mainly the increase in cash received from the disposal of investment by the Group for the period.
Financing Activities
The Group’s net cash inflow from financing activities for the first six months of 2016 was RMB1,326.3 million versus RMB527.7 million for the first six months of 2015, reflecting mainly the increase in cash received from investments by Nubia Technology Limited for the period.
– 23 –
yiu.tsui
A161291 1st Proof Time/date: 25-08-2016_14:21:50 Cre8 (852) 3693 2600 yiu.tsui
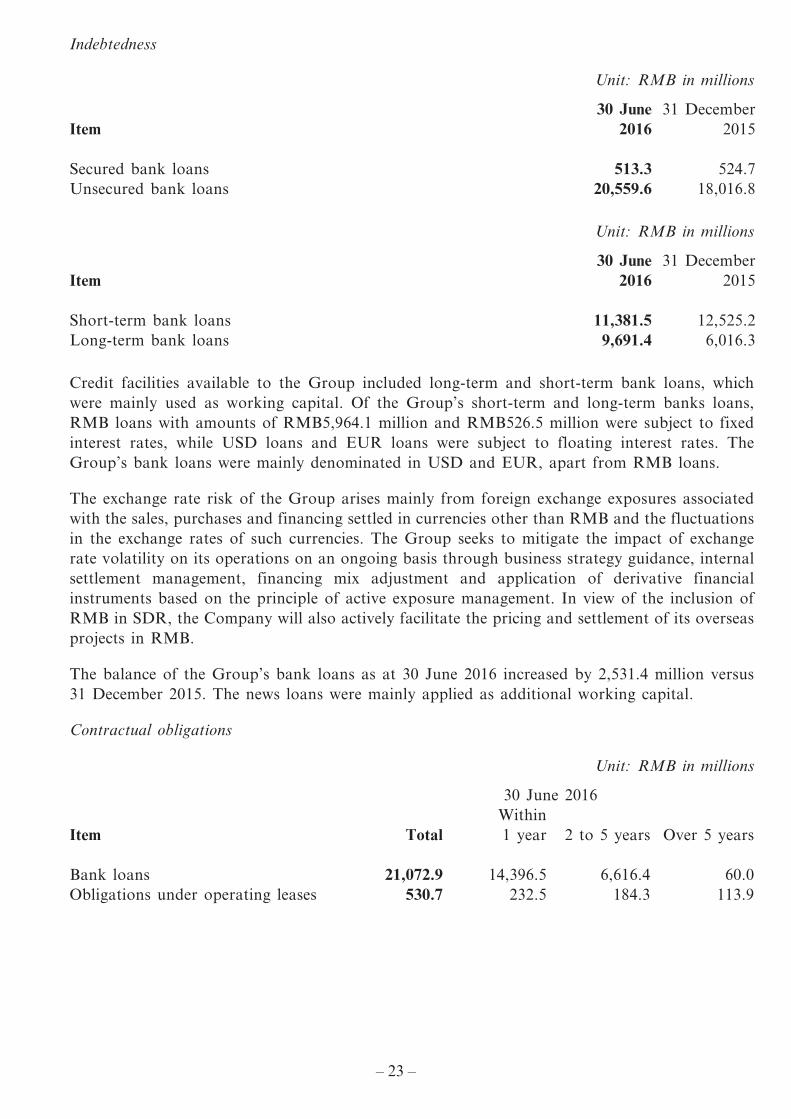
Indebtedness
Unit: RMB in millions
Item30 June
201631 December
2015
Secured bank loans 513.3 524.7Unsecured bank loans 20,559.6 18,016.8
Unit: RMB in millions
Item30 June
201631 December
2015
Short-term bank loans 11,381.5 12,525.2Long-term bank loans 9,691.4 6,016.3
Credit facilities available to the Group included long-term and short-term bank loans, which were mainly used as working capital. Of the Group’s short-term and long-term banks loans, RMB loans with amounts of RMB5,964.1 million and RMB526.5 million were subject to fixed interest rates, while USD loans and EUR loans were subject to floating interest rates. The Group’s bank loans were mainly denominated in USD and EUR, apart from RMB loans.
The exchange rate risk of the Group arises mainly from foreign exchange exposures associated with the sales, purchases and financing settled in currencies other than RMB and the fluctuations in the exchange rates of such currencies. The Group seeks to mitigate the impact of exchange rate volatility on its operations on an ongoing basis through business strategy guidance, internal settlement management, financing mix adjustment and application of derivative financial instruments based on the principle of active exposure management. In view of the inclusion of RMB in SDR, the Company will also actively facilitate the pricing and settlement of its overseas projects in RMB.
The balance of the Group’s bank loans as at 30 June 2016 increased by 2,531.4 million versus 31 December 2015. The news loans were mainly applied as additional working capital.
Contractual obligations
Unit: RMB in millions
30 June 2016
Item TotalWithin 1 year 2 to 5 years Over 5 years
Bank loans 21,072.9 14,396.5 6,616.4 60.0Obligations under operating leases 530.7 232.5 184.3 113.9
– 24 –
yiu.tsui
A161291 1st Proof Time/date: 25-08-2016_14:21:50 Cre8 (852) 3693 2600 yiu.tsui
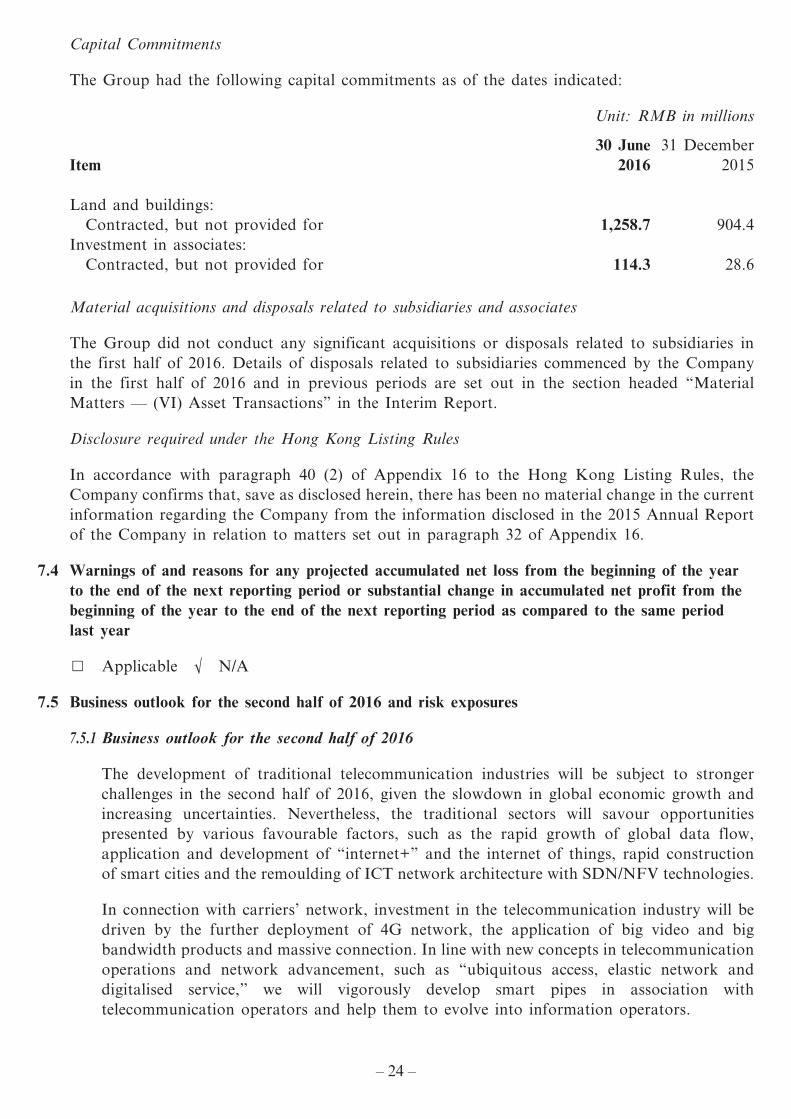
Capital Commitments
The Group had the following capital commitments as of the dates indicated:
Unit: RMB in millions
Item30 June
201631 December
2015
Land and buildings:Contracted, but not provided for 1,258.7 904.4
Investment in associates:Contracted, but not provided for 114.3 28.6
Material acquisitions and disposals related to subsidiaries and associates
The Group did not conduct any significant acquisitions or disposals related to subsidiaries in the first half of 2016. Details of disposals related to subsidiaries commenced by the Company in the first half of 2016 and in previous periods are set out in the section headed “Material Matters — (VI) Asset Transactions” in the Interim Report.
Disclosure required under the Hong Kong Listing Rules
In accordance with paragraph 40 (2) of Appendix 16 to the Hong Kong Listing Rules, the Company confirms that, save as disclosed herein, there has been no material change in the current information regarding the Company from the information disclosed in the 2015 Annual Report of the Company in relation to matters set out in paragraph 32 of Appendix 16.
7.4 Warnings of and reasons for any projected accumulated net loss from the beginning of the year to the end of the next reporting period or substantial change in accumulated net profit from the beginning of the year to the end of the next reporting period as compared to the same period last year
□ Applicable √ N/A
7.5 Business outlook for the second half of 2016 and risk exposures
7.5.1 Business outlook for the second half of 2016
The development of traditional telecommunication industries will be subject to stronger challenges in the second half of 2016, given the slowdown in global economic growth and increasing uncertainties. Nevertheless, the traditional sectors will savour opportunities presented by various favourable factors, such as the rapid growth of global data flow, application and development of “internet+” and the internet of things, rapid construction of smart cities and the remoulding of ICT network architecture with SDN/NFV technologies.
In connection with carriers’ network, investment in the telecommunication industry will be driven by the further deployment of 4G network, the application of big video and big bandwidth products and massive connection. In line with new concepts in telecommunication operations and network advancement, such as “ubiquitous access, elastic network and digitalised service,” we will vigorously develop smart pipes in association with telecommunication operators and help them to evolve into information operators.
– 25 –
yiu.tsui
A161291 1st Proof Time/date: 25-08-2016_14:21:50 Cre8 (852) 3693 2600 yiu.tsui
In connection with the government and corporate business, universal mobile interconnection and big data will drive the upgrade of traditional industries, while the penetration of “internet+”, construction of smart cities, development of cloud computing and data centres, digitalisation of railway transport, and informatisation of the energy sector will also give rise to opportunities for development. We will help our government and corporate clients to expedite their planning and application of new products and solutions.
In connection with the consumer business, with the continuous application and promotion of big video, home internet of things and smart hardware, users will be more demanding in terms of the integration of big data, cloud services and contents and user experience, in addition to expectations in technological innovation.
In the second half of 2016, the Group will continue to persist in “adding value through information by leveraging opportunities present in the age of restructuring,” focusing on three major strategic directions, namely “in-depth development of the carriers’ market; value creation in government and corporate business; integration and innovation in the consumers’ market”, and driving business development in the “new sectors”. We will continue to make advances in our transition to the M-ICT strategy, persisting in research and development with stronger efforts in innovation whiling strengthening project management. We will pursue mutual growth with our customers, partners and other stakeholders and seek to create a positive ecosphere for the sector.
7.5.2 Risk Exposures
(1) Country risk
Given the complex nature of international economic and political conditions and the presence of the Group’s business and branch organisations in over 160 countries, the Group will continue to be exposed to trade protection, debtors’ risks, political risks or even warfare or the succession of political regimes in countries where the Group’s projects are operated. Meanwhile, import and export regulation, tax compliance and antitrust measures of national governments around the world means that a very high level of operational and risk control capabilities is required of the Group. Currently, the Group conducts systematic management of country risks mainly through studies in the political and economic developments and policies of various countries, regular assessment, timely warning and proactive response. We also control such risks by taking out country risk insurance policies.
(2) Risk associated with intellectual property rights
The Group has always attached great importance to product technology research and development as well as the protection and management of intellectual property rights. Trademarks of the Group’s products and services are all registered, and such products and services are all protected under relevant patent rights. While the Group has adopted highly stringent measures to protect its intellectual property rights, potential disputes over intellectual property rights between the Group and other telecommunications equipment manufacturers, franchisee companies and carriers which partner with the Group cannot be totally ruled out. The Group will continue to drive the solution of related issues with an open-minded, cooperative and mutually beneficial approach.
– 26 –
yiu.tsui
A161291 1st Proof Time/date: 25-08-2016_14:21:50 Cre8 (852) 3693 2600 yiu.tsui
(3) Exchange risks
The Group’s consolidated financial statements are expressed in RMB. The exchange rate risk of the Group arises mainly from foreign exchange exposures associated with the sales, purchases and financing settled in currencies other than RMB and the volatility of exchange rates. The Group seeks to mitigate the impact of exchange rate volatility on its operations on an ongoing basis by managing its foreign exchange risks through the use of measures such as the business strategic guidance, internal settlement management, adjustment of financing structure, internal exchange settlement and derivative financial instruments based on the principle of prudent exposure management, aiming to retain favourable exposures as appropriate, strictly control unfavourable exposures subject to apparent adverse developments or which are without value-protection features. The Group will also actively facilitate RMB pricing and settlement for overseas projects to lower its exchange rate risks in the long run.
(4) Interest rate risk
The interest rate risk of the Group is mainly associated with interest-bearing liabilities. Fluctuations in the interest rates of RMB or foreign currencies will result in changes in the total amount of interest payable by the Group and will therefore affect the Group’s profitability. The Group seeks to lower its interest rate risk mainly by managing the total amount and structure of its interest-bearing liabilities. Control over the total amount of interest-bearing liabilities is mainly achieved by improving the cash turnover efficiency and increasing the free cash flow of the Group. Structural management of interest-bearing liabilities is achieved mainly through portfolio control with a mixture of long-term/short-term domestic and overseas loans denominated in RMB or foreign currencies with fix or floating interests, complemented by derivative instruments such as interest rate swaps, while exploring low-cost financing opportunities in the global market.
(5) Credit risk
The Group provides one-stop communications solutions to its customers. With the rapid expansion of its business, the Group is serving a large customer base with differing credit status, and its business will inevitably be affected by the varied credit profiles of these customers. The Group seeks to mitigate the aforesaid impact by adopting various credit management measures, such as international customer credit rating, customer credit limit management, credit risk assessment for projects, stringent credit control against customers with faulty payment records, the purchase of credit insurance and the transfer of credit risks through appropriate financial instruments, etc.
– 27 –
yiu.tsui
A161291 1st Proof Time/date: 25-08-2016_14:21:50 Cre8 (852) 3693 2600 yiu.tsui
8. COMPLIANCE OF THE CORPORATE GOVERNANCE CODE AND OTHER MATTERS
8.1 Compliance of the Corporate Governance Code
During the period from 1 January to 30 June 2016, the Company was in full compliance with the principles and code provisions of the Corporate Governance Code set out in Appendix 14 of the Hong Kong Listing Rules, except for the following:
Code Provision A.2.1
Code Provision A.2.1 stipulates that the roles of chairman and chief executive should be separate and should not be performed by the same individual.
From 5 April 2016 to the present, the office of the Chairman and the office of the President have been concurrently assumed by Mr. Zhao Xianming. The Company is of the view that, the structure of the Company operated as such will not undermine the checks and balances between the Board and the management. Members of the Board have made contributions to the Company with their extensive experience, and the Company believes that it will be able to ensure that the checks and balances between the Board and the management will remain unaffected. Having the office of the Chairman and the office of the President taken up by the same person will enhance the Company’s efficiency in management and decision making.
8.2 Securities transactions by Directors and Supervisors
The Directors and Supervisors of the Company confirmed that the Company had adopted the Model Code as set out in Appendix 10 to the Hong Kong Listing Rules. Having made due enquiries with all Directors and Supervisors of the Company, the Company was not aware of any information that reasonably suggested that the Directors and Supervisors had not complied with the requirements in the Model Code during the reporting period.
9. FINANCIAL REPORTS
9.1 The Audit Committee
The Audit Committee of the Company has discussed with the management the accounting standards and practices adopted by the Group, and has also discussed and reviewed the Interim Report, including the financial statements of the Group for the six months ended 30 June 2016.
9.2 Audit opinion
√ Unaudited □ Audited
9.3 Comparative financial statements
9.3.1 Financial statements prepared in accordance with PRC ASBEs (Unaudited) (Please see Appendix I)
9.3.2 Financial statements prepared in accordance with HKAS 34 (Unaudited) and notes thereto (Please see Appendix II)
9.4 Explanatory statement on changes in the accounting policies, accounting estimates, and auditing methods for the reporting period in comparison with the last annual financial report
□ Applicable √ N/A
– 28 –
yiu.tsui
A161291 1st Proof Time/date: 25-08-2016_14:21:50 Cre8 (852) 3693 2600 yiu.tsui
9.5 Explanatory statement on rectification of significant accounting errors for the reporting period requiring retrospective restatement.
□ Applicable √ N/A
9.6 Explanation of changes to the scope of consolidated financial statement in comparison with the last annual financial report.
New subsidiaries established during the period included: tier-one subsidiaries ZTE Feiliu IT Company Limited* (中興飛流信息科技有限公司), ZTE Gaoneng Technology Company Limited* (中興高能技術有限責任公司), Jiyuan ZTE Smart Technology Industries Company Limited* (濟源中興智慧科技產業有限公司); and tier-two subsidiaries ZTE MOZAMBIQUE LDA, Shanghai Xingxin New Energy Auto Company Limited* (上海興新新能源汽車有限公司), Shenzhen Hengdian New Energy Technology Company Limited* (深圳市恒電新能源科技有限責任公司), Shenzhen ZTE Golden Cloud Technology Company Limited* (深圳中興金雲科技有限公司), ZTESOFT TECHNOLOGY INDIA PRIVATE LIMITED, ZTE Cameroon Sarl, ZTE Telecommunications Limited and Shenzhen ZTE Gaoda Communications Technology Company Limited* (深圳市中興高達通信技術有限公司).
Newinfo Holdings Limited, a wholly-owned subsidiary of ZTE HK, which is in turn a wholly-owned subsidiary of the Company, completed the disposal of 51% equity interests in LiveCom Limited in January 2016 and LiveCom Limited had been deconsolidated from the consolidated statements of the Group as from February 2016.
By Order of the Board Zhao Xianming
Chairman
Shenzhen, the PRC 25 August 2016
As at the date of this announcement, the Board of Directors of the Company comprises three executive directors, Zhao Xianming, Yin Yimin and Wei Zaisheng; six non-executive directors, Zhang Jianheng, Luan Jubao, Shi Lirong, Wang Yawen, Tian Dongfang and Zhan Yichao; and five independent non-executive directors, Richard Xike Zhang, Chen Shaohua, Lü Hongbing, Bingsheng Teng and Zhu Wuxiang.
* for identification purposes only
– 29 –
yiu.tsui
A161291 1st Proof Time/date: 25-08-2016_14:21:50 Cre8 (852) 3693 2600 yiu.tsui
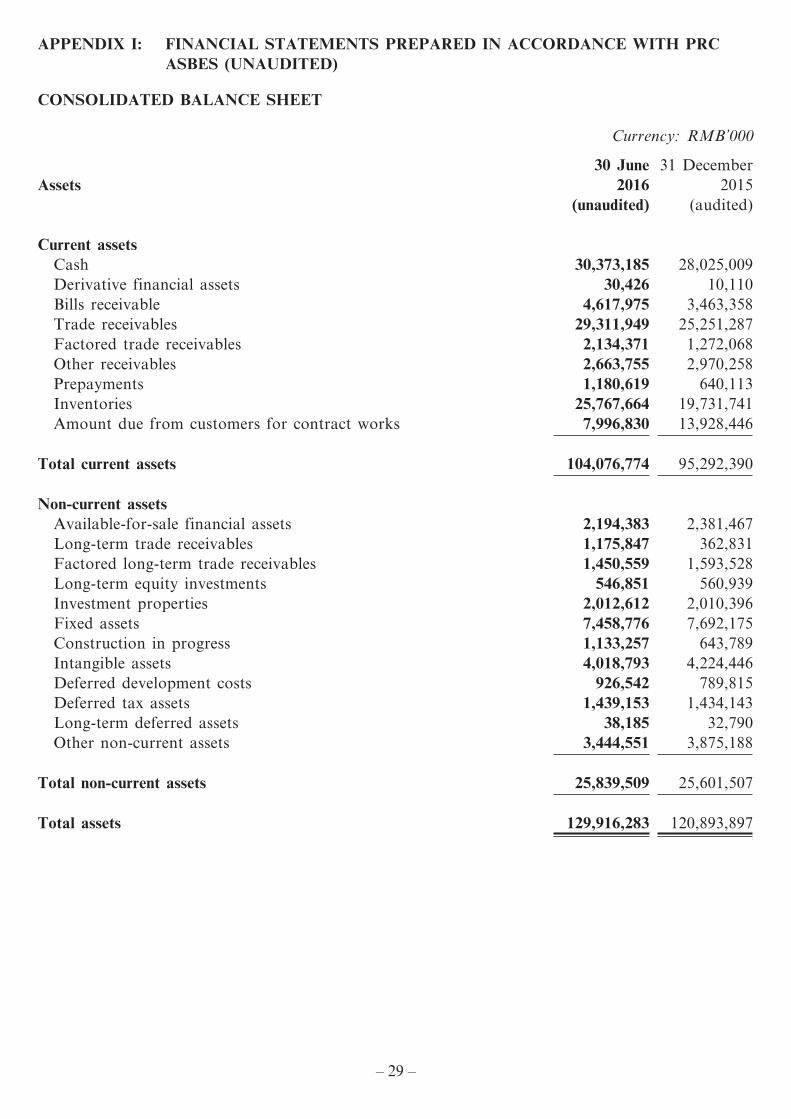
APPENDIX I: FINANCIAL STATEMENTS PREPARED IN ACCORDANCE WITH PRC ASBES (UNAUDITED)
CONSOLIDATED BALANCE SHEET
Currency: RMB’000
Assets30 June
201631 December
2015(unaudited) (audited)
Current assetsCash 30,373,185 28,025,009Derivative financial assets 30,426 10,110Bills receivable 4,617,975 3,463,358Trade receivables 29,311,949 25,251,287Factored trade receivables 2,134,371 1,272,068Other receivables 2,663,755 2,970,258Prepayments 1,180,619 640,113Inventories 25,767,664 19,731,741Amount due from customers for contract works 7,996,830 13,928,446
Total current assets 104,076,774 95,292,390
Non-current assetsAvailable-for-sale financial assets 2,194,383 2,381,467Long-term trade receivables 1,175,847 362,831Factored long-term trade receivables 1,450,559 1,593,528Long-term equity investments 546,851 560,939Investment properties 2,012,612 2,010,396Fixed assets 7,458,776 7,692,175Construction in progress 1,133,257 643,789Intangible assets 4,018,793 4,224,446Deferred development costs 926,542 789,815Deferred tax assets 1,439,153 1,434,143Long-term deferred assets 38,185 32,790Other non-current assets 3,444,551 3,875,188
Total non-current assets 25,839,509 25,601,507
Total assets 129,916,283 120,893,897
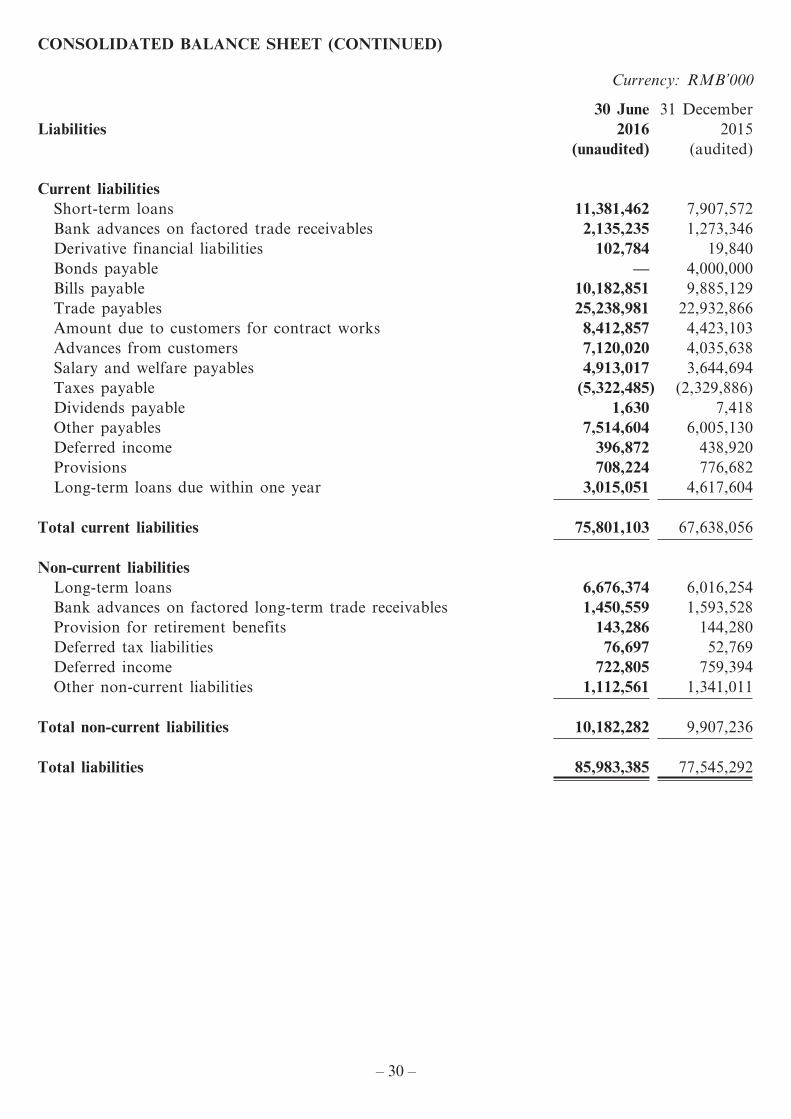
– 30 –
yiu.tsui
A161291 1st Proof Time/date: 25-08-2016_14:21:50 Cre8 (852) 3693 2600 yiu.tsui
CONSOLIDATED BALANCE SHEET (CONTINUED)
Currency: RMB’000
Liabilities30 June
201631 December
2015(unaudited) (audited)
Current liabilitiesShort-term loans 11,381,462 7,907,572Bank advances on factored trade receivables 2,135,235 1,273,346Derivative financial liabilities 102,784 19,840Bonds payable — 4,000,000Bills payable 10,182,851 9,885,129Trade payables 25,238,981 22,932,866Amount due to customers for contract works 8,412,857 4,423,103Advances from customers 7,120,020 4,035,638Salary and welfare payables 4,913,017 3,644,694Taxes payable (5,322,485) (2,329,886)Dividends payable 1,630 7,418Other payables 7,514,604 6,005,130Deferred income 396,872 438,920Provisions 708,224 776,682Long-term loans due within one year 3,015,051 4,617,604
Total current liabilities 75,801,103 67,638,056
Non-current liabilitiesLong-term loans 6,676,374 6,016,254Bank advances on factored long-term trade receivables 1,450,559 1,593,528Provision for retirement benefits 143,286 144,280Deferred tax liabilities 76,697 52,769Deferred income 722,805 759,394Other non-current liabilities 1,112,561 1,341,011
Total non-current liabilities 10,182,282 9,907,236
Total liabilities 85,983,385 77,545,292
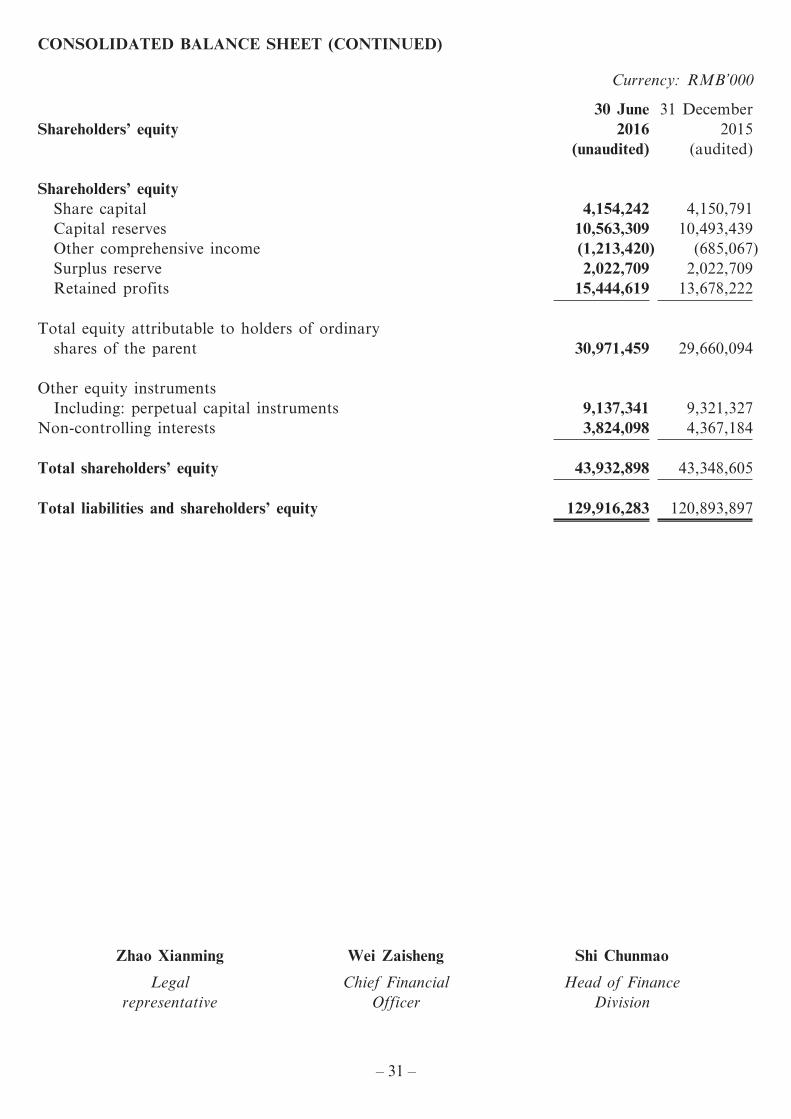
– 31 –
yiu.tsui
A161291 1st Proof Time/date: 25-08-2016_14:21:50 Cre8 (852) 3693 2600 yiu.tsui
CONSOLIDATED BALANCE SHEET (CONTINUED)
Currency: RMB’000
Shareholders’ equity30 June
201631 December
2015(unaudited) (audited)
Shareholders’ equityShare capital 4,154,242 4,150,791Capital reserves 10,563,309 10,493,439Other comprehensive income (1,213,420) (685,067)Surplus reserve 2,022,709 2,022,709Retained profits 15,444,619 13,678,222
Total equity attributable to holders of ordinary shares of the parent 30,971,459 29,660,094
Other equity instrumentsIncluding: perpetual capital instruments 9,137,341 9,321,327
Non-controlling interests 3,824,098 4,367,184
Total shareholders’ equity 43,932,898 43,348,605
Total liabilities and shareholders’ equity 129,916,283 120,893,897
Zhao Xianming Wei Zaisheng Shi Chunmao
Legal representative
Chief Financial Officer
Head of Finance Division
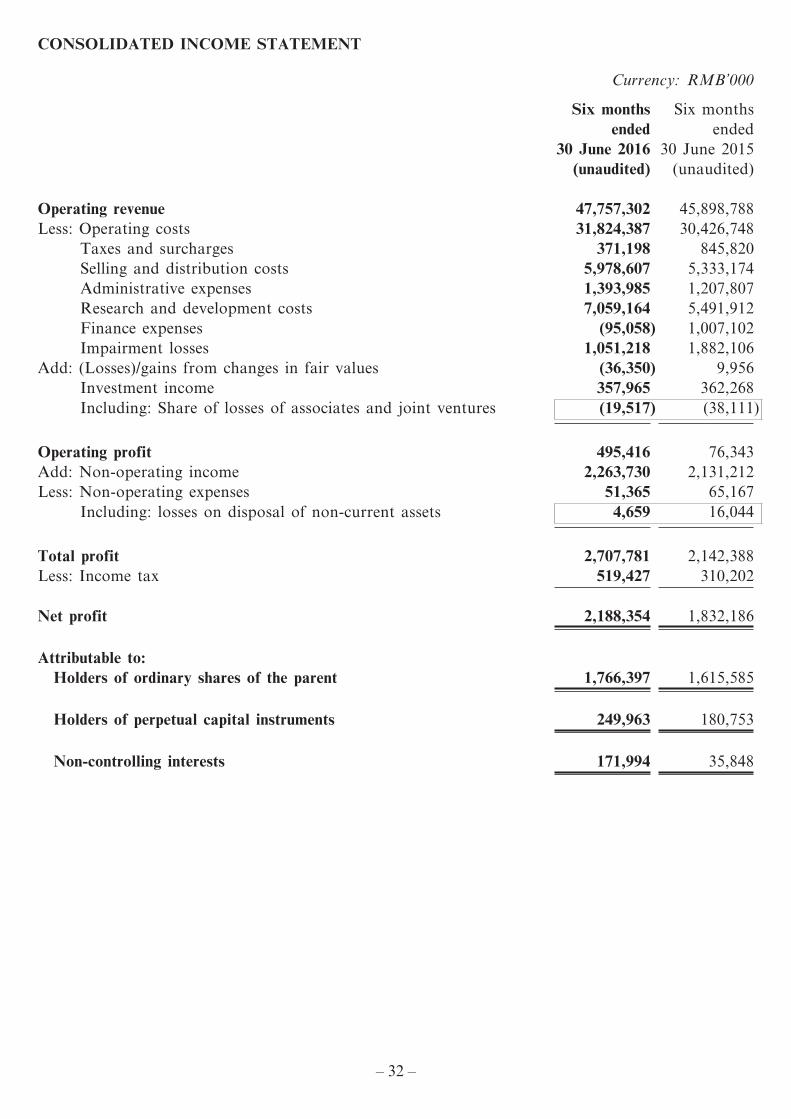
– 32 –
yiu.tsui
A161291 1st Proof Time/date: 25-08-2016_14:21:50 Cre8 (852) 3693 2600 yiu.tsui
CONSOLIDATED INCOME STATEMENT
Currency: RMB’000
Six months ended
30 June 2016
Six months ended
30 June 2015(unaudited) (unaudited)
Operating revenue 47,757,302 45,898,788Less: Operating costs 31,824,387 30,426,748
Taxes and surcharges 371,198 845,820Selling and distribution costs 5,978,607 5,333,174Administrative expenses 1,393,985 1,207,807Research and development costs 7,059,164 5,491,912Finance expenses (95,058) 1,007,102Impairment losses 1,051,218 1,882,106
Add: (Losses)/gains from changes in fair values (36,350) 9,956Investment income 357,965 362,268Including: Share of losses of associates and joint ventures (19,517) (38,111)
Operating profit 495,416 76,343Add: Non-operating income 2,263,730 2,131,212Less: Non-operating expenses 51,365 65,167
Including: losses on disposal of non-current assets 4,659 16,044
Total profit 2,707,781 2,142,388Less: Income tax 519,427 310,202
Net profit 2,188,354 1,832,186
Attributable to:Holders of ordinary shares of the parent 1,766,397 1,615,585
Holders of perpetual capital instruments 249,963 180,753
Non-controlling interests 171,994 35,848
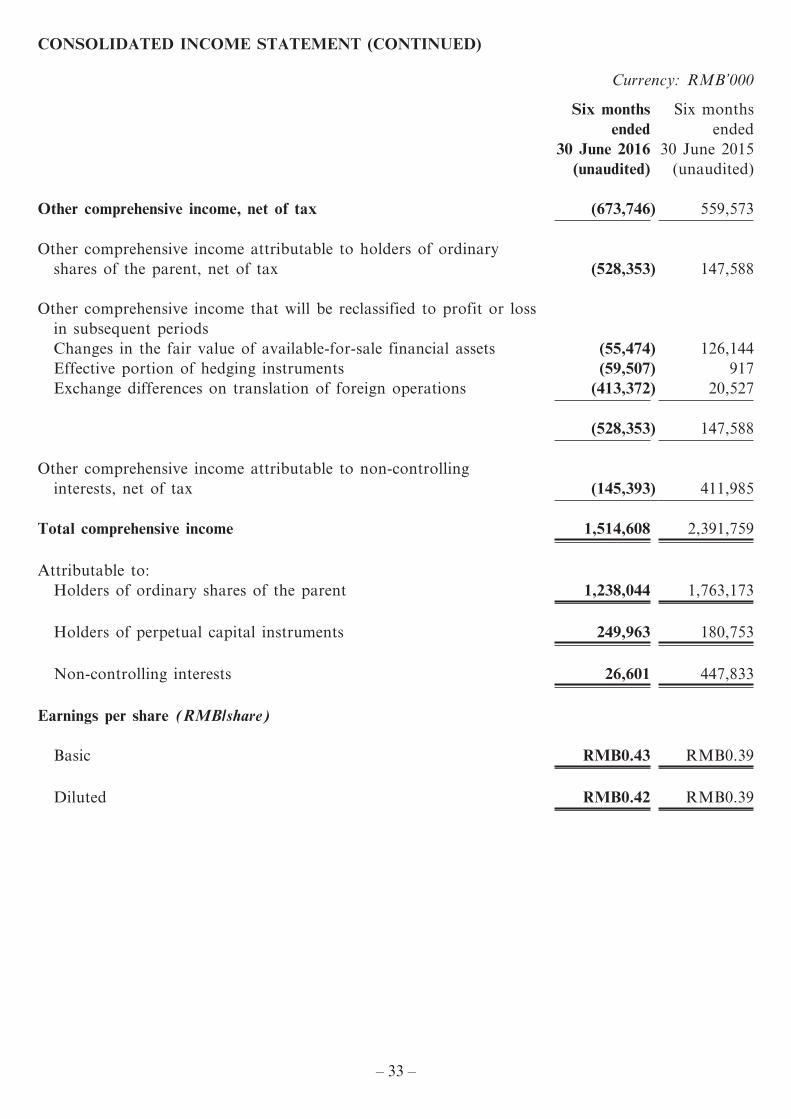
– 33 –
yiu.tsui
A161291 1st Proof Time/date: 25-08-2016_14:21:50 Cre8 (852) 3693 2600 yiu.tsui
CONSOLIDATED INCOME STATEMENT (CONTINUED)
Currency: RMB’000
Six months ended
30 June 2016
Six months ended
30 June 2015(unaudited) (unaudited)
Other comprehensive income, net of tax (673,746) 559,573
Other comprehensive income attributable to holders of ordinary shares of the parent, net of tax (528,353) 147,588
Other comprehensive income that will be reclassified to profit or loss in subsequent periodsChanges in the fair value of available-for-sale financial assets (55,474) 126,144Effective portion of hedging instruments (59,507) 917Exchange differences on translation of foreign operations (413,372) 20,527
(528,353) 147,588
Other comprehensive income attributable to non-controlling interests, net of tax (145,393) 411,985
Total comprehensive income 1,514,608 2,391,759
Attributable to:Holders of ordinary shares of the parent 1,238,044 1,763,173
Holders of perpetual capital instruments 249,963 180,753
Non-controlling interests 26,601 447,833
Earnings per share (RMB/share)
Basic RMB0.43 RMB0.39
Diluted RMB0.42 RMB0.39
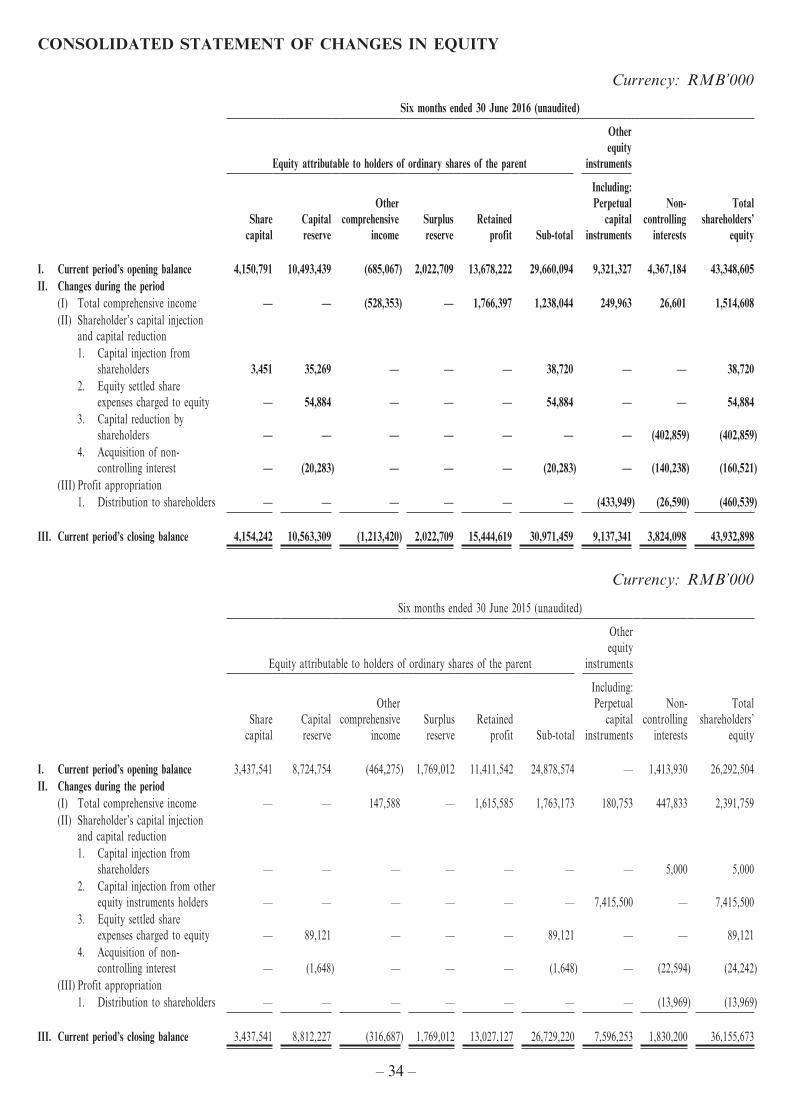
– 34 –
yiu.tsui
A161291 1st Proof Time/date: 25-08-2016_14:21:50 Cre8 (852) 3693 2600 yiu.tsui
CONSOLIDATED STATEMENT OF CHANGES IN EQUITY
Currency: RMB’000
Six months ended 30 June 2016 (unaudited)
Equity attributable to holders of ordinary shares of the parent
Other equity
instruments
Share capital
Capital reserve
Other comprehensive
incomeSurplus reserve
Retained profit Sub-total
Including: Perpetual
capital instruments
Non-controlling
interests
Total shareholders’
equity
I. Current period’s opening balance 4,150,791 10,493,439 (685,067) 2,022,709 13,678,222 29,660,094 9,321,327 4,367,184 43,348,605II. Changes during the period (I) Total comprehensive income — — (528,353) — 1,766,397 1,238,044 249,963 26,601 1,514,608 (II) Shareholder’s capital injection
and capital reduction 1. Capital injection from
shareholders 3,451 35,269 — — — 38,720 — — 38,720 2. Equity settled share
expenses charged to equity — 54,884 — — — 54,884 — — 54,884 3. Capital reduction by
shareholders — — — — — — — (402,859) (402,859) 4. Acquisition of non-
controlling interest — (20,283) — — — (20,283) — (140,238) (160,521) (III) Profit appropriation 1. Distribution to shareholders — — — — — — (433,949) (26,590) (460,539)
III. Current period’s closing balance 4,154,242 10,563,309 (1,213,420) 2,022,709 15,444,619 30,971,459 9,137,341 3,824,098 43,932,898
Currency: RMB’000
Six months ended 30 June 2015 (unaudited)
Equity attributable to holders of ordinary shares of the parent
Other equity
instruments
Share capital
Capital reserve
Other comprehensive
incomeSurplus reserve
Retained profit Sub-total
Including: Perpetual
capital instruments
Non-controlling
interests
Total shareholders’
equity
I. Current period’s opening balance 3,437,541 8,724,754 (464,275) 1,769,012 11,411,542 24,878,574 — 1,413,930 26,292,504II. Changes during the period (I) Total comprehensive income — — 147,588 — 1,615,585 1,763,173 180,753 447,833 2,391,759 (II) Shareholder’s capital injection
and capital reduction 1. Capital injection from
shareholders — — — — — — — 5,000 5,000 2. Capital injection from other
equity instruments holders — — — — — — 7,415,500 — 7,415,500 3. Equity settled share
expenses charged to equity — 89,121 — — — 89,121 — — 89,121 4. Acquisition of non-
controlling interest — (1,648) — — — (1,648) — (22,594) (24,242) (III) Profit appropriation 1. Distribution to shareholders — — — — — — — (13,969) (13,969)
III. Current period’s closing balance 3,437,541 8,812,227 (316,687) 1,769,012 13,027,127 26,729,220 7,596,253 1,830,200 36,155,673
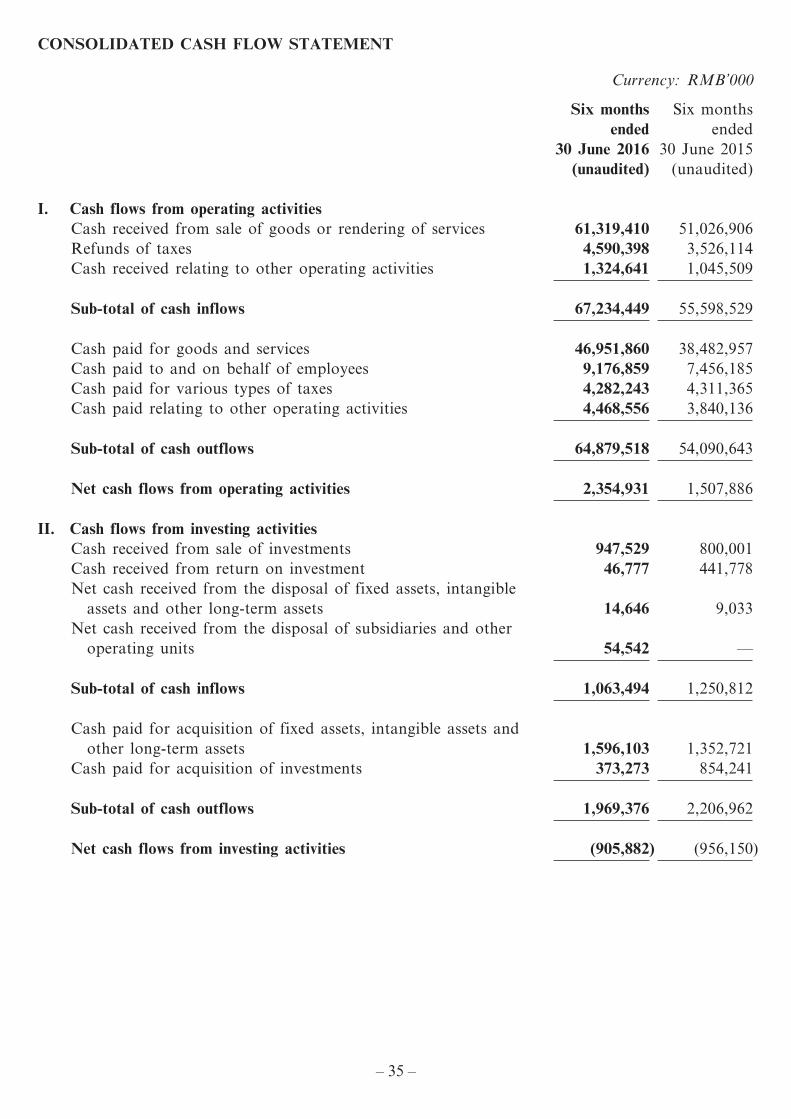
– 35 –
yiu.tsui
A161291 1st Proof Time/date: 25-08-2016_14:21:50 Cre8 (852) 3693 2600 yiu.tsui
CONSOLIDATED CASH FLOW STATEMENT
Currency: RMB’000
Six months ended
30 June 2016
Six months ended
30 June 2015(unaudited) (unaudited)
I. Cash flows from operating activitiesCash received from sale of goods or rendering of services 61,319,410 51,026,906Refunds of taxes 4,590,398 3,526,114Cash received relating to other operating activities 1,324,641 1,045,509
Sub-total of cash inflows 67,234,449 55,598,529
Cash paid for goods and services 46,951,860 38,482,957Cash paid to and on behalf of employees 9,176,859 7,456,185Cash paid for various types of taxes 4,282,243 4,311,365Cash paid relating to other operating activities 4,468,556 3,840,136
Sub-total of cash outflows 64,879,518 54,090,643
Net cash flows from operating activities 2,354,931 1,507,886
II. Cash flows from investing activitiesCash received from sale of investments 947,529 800,001Cash received from return on investment 46,777 441,778Net cash received from the disposal of fixed assets, intangible
assets and other long-term assets 14,646 9,033Net cash received from the disposal of subsidiaries and other
operating units 54,542 —
Sub-total of cash inflows 1,063,494 1,250,812
Cash paid for acquisition of fixed assets, intangible assets and other long-term assets 1,596,103 1,352,721
Cash paid for acquisition of investments 373,273 854,241
Sub-total of cash outflows 1,969,376 2,206,962
Net cash flows from investing activities (905,882) (956,150)
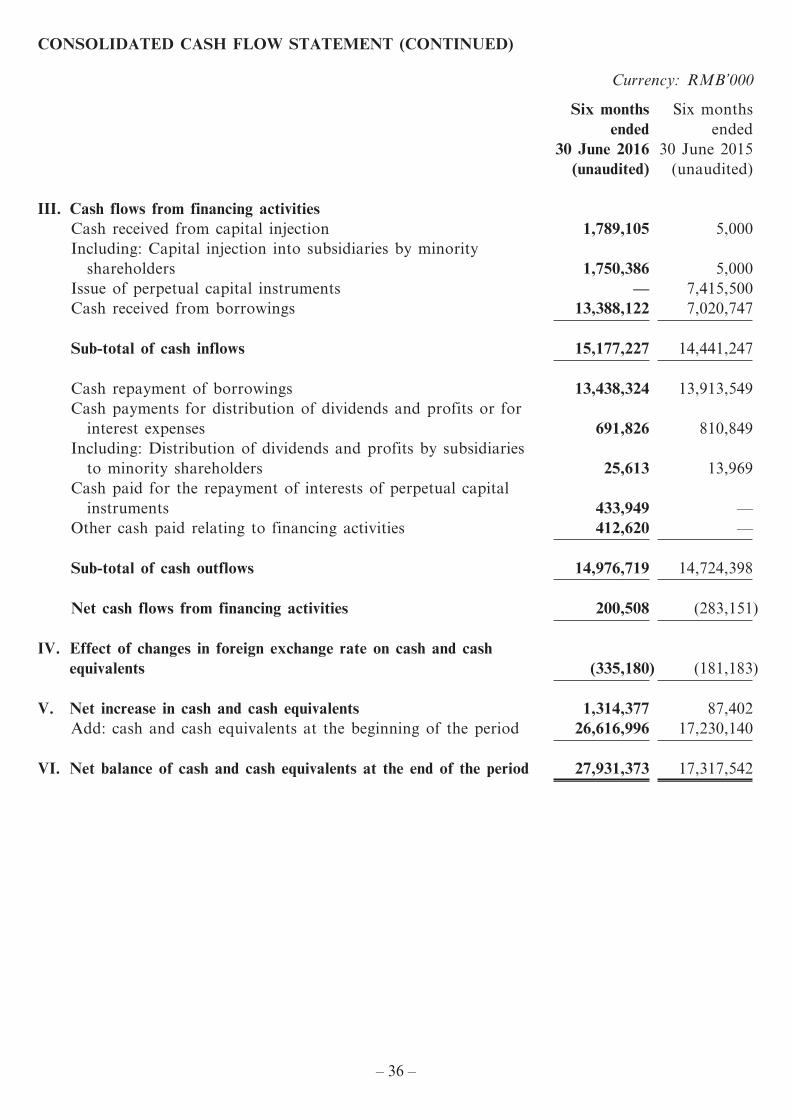
– 36 –
yiu.tsui
A161291 1st Proof Time/date: 25-08-2016_14:21:50 Cre8 (852) 3693 2600 yiu.tsui
CONSOLIDATED CASH FLOW STATEMENT (CONTINUED)
Currency: RMB’000
Six months ended
30 June 2016
Six months ended
30 June 2015(unaudited) (unaudited)
III. Cash flows from financing activitiesCash received from capital injection 1,789,105 5,000Including: Capital injection into subsidiaries by minority
shareholders 1,750,386 5,000Issue of perpetual capital instruments — 7,415,500Cash received from borrowings 13,388,122 7,020,747
Sub-total of cash inflows 15,177,227 14,441,247
Cash repayment of borrowings 13,438,324 13,913,549Cash payments for distribution of dividends and profits or for
interest expenses 691,826 810,849Including: Distribution of dividends and profits by subsidiaries
to minority shareholders 25,613 13,969Cash paid for the repayment of interests of perpetual capital
instruments 433,949 —Other cash paid relating to financing activities 412,620 —
Sub-total of cash outflows 14,976,719 14,724,398
Net cash flows from financing activities 200,508 (283,151)
IV. Effect of changes in foreign exchange rate on cash and cash equivalents (335,180) (181,183)
V. Net increase in cash and cash equivalents 1,314,377 87,402Add: cash and cash equivalents at the beginning of the period 26,616,996 17,230,140
VI. Net balance of cash and cash equivalents at the end of the period 27,931,373 17,317,542
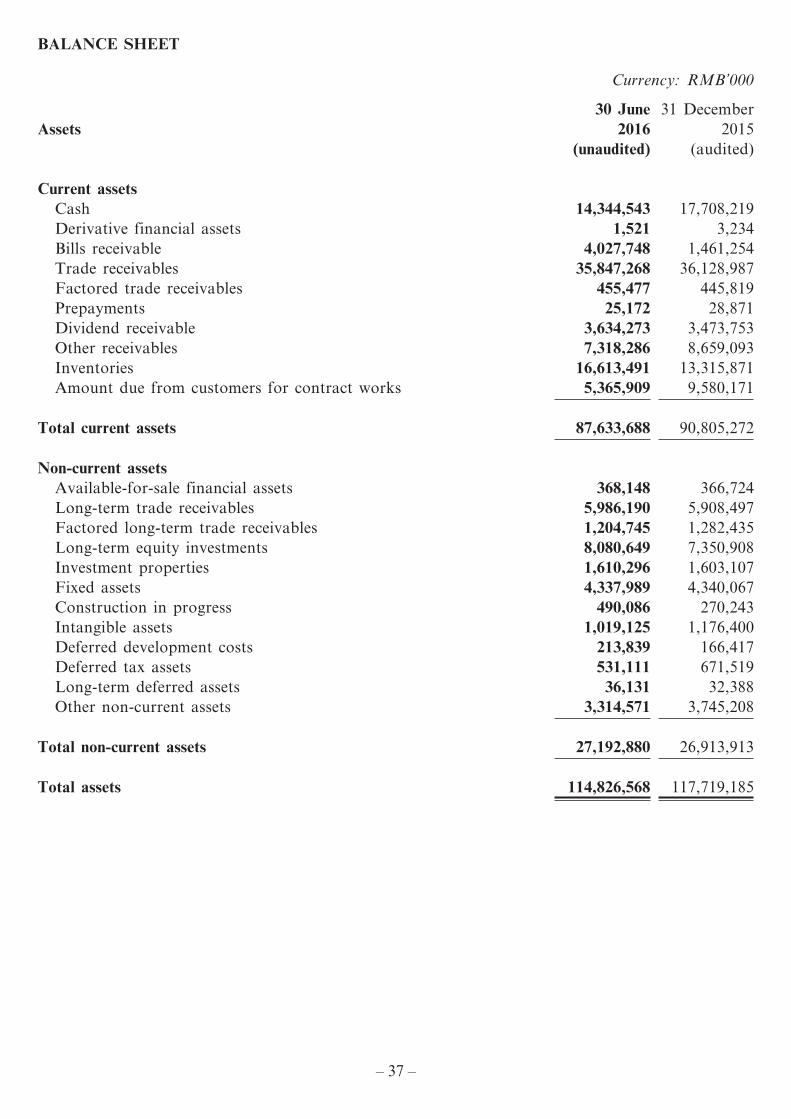
– 37 –
yiu.tsui
A161291 1st Proof Time/date: 25-08-2016_14:21:50 Cre8 (852) 3693 2600 yiu.tsui
BALANCE SHEET
Currency: RMB’000
Assets30 June
201631 December
2015(unaudited) (audited)
Current assetsCash 14,344,543 17,708,219Derivative financial assets 1,521 3,234Bills receivable 4,027,748 1,461,254Trade receivables 35,847,268 36,128,987Factored trade receivables 455,477 445,819Prepayments 25,172 28,871Dividend receivable 3,634,273 3,473,753Other receivables 7,318,286 8,659,093Inventories 16,613,491 13,315,871Amount due from customers for contract works 5,365,909 9,580,171
Total current assets 87,633,688 90,805,272
Non-current assetsAvailable-for-sale financial assets 368,148 366,724Long-term trade receivables 5,986,190 5,908,497Factored long-term trade receivables 1,204,745 1,282,435Long-term equity investments 8,080,649 7,350,908Investment properties 1,610,296 1,603,107Fixed assets 4,337,989 4,340,067Construction in progress 490,086 270,243Intangible assets 1,019,125 1,176,400Deferred development costs 213,839 166,417Deferred tax assets 531,111 671,519Long-term deferred assets 36,131 32,388Other non-current assets 3,314,571 3,745,208
Total non-current assets 27,192,880 26,913,913
Total assets 114,826,568 117,719,185
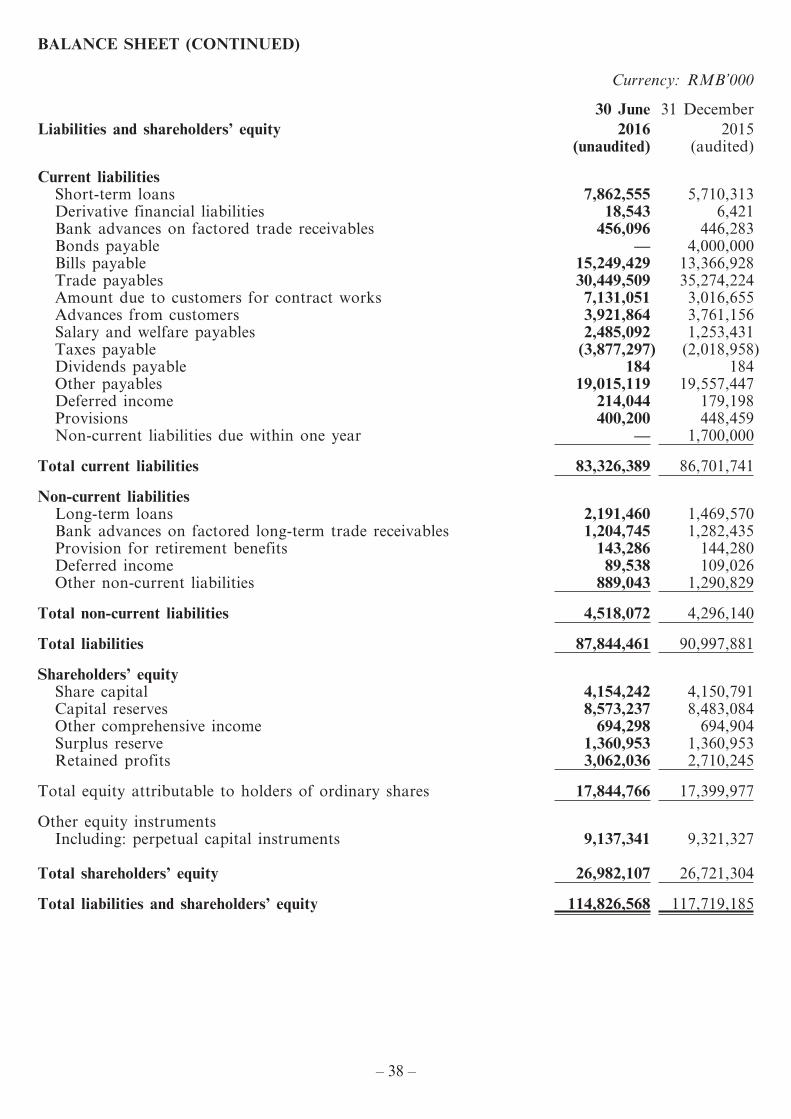
– 38 –
yiu.tsui
A161291 1st Proof Time/date: 25-08-2016_14:21:50 Cre8 (852) 3693 2600 yiu.tsui
BALANCE SHEET (CONTINUED)
Currency: RMB’000
Liabilities and shareholders’ equity30 June
201631 December
2015(unaudited) (audited)
Current liabilitiesShort-term loans 7,862,555 5,710,313Derivative financial liabilities 18,543 6,421Bank advances on factored trade receivables 456,096 446,283Bonds payable — 4,000,000Bills payable 15,249,429 13,366,928Trade payables 30,449,509 35,274,224Amount due to customers for contract works 7,131,051 3,016,655Advances from customers 3,921,864 3,761,156Salary and welfare payables 2,485,092 1,253,431Taxes payable (3,877,297) (2,018,958)Dividends payable 184 184Other payables 19,015,119 19,557,447Deferred income 214,044 179,198Provisions 400,200 448,459Non-current liabilities due within one year — 1,700,000
Total current liabilities 83,326,389 86,701,741
Non-current liabilitiesLong-term loans 2,191,460 1,469,570Bank advances on factored long-term trade receivables 1,204,745 1,282,435Provision for retirement benefits 143,286 144,280Deferred income 89,538 109,026Other non-current liabilities 889,043 1,290,829
Total non-current liabilities 4,518,072 4,296,140
Total liabilities 87,844,461 90,997,881
Shareholders’ equityShare capital 4,154,242 4,150,791Capital reserves 8,573,237 8,483,084Other comprehensive income 694,298 694,904Surplus reserve 1,360,953 1,360,953Retained profits 3,062,036 2,710,245
Total equity attributable to holders of ordinary shares 17,844,766 17,399,977
Other equity instrumentsIncluding: perpetual capital instruments 9,137,341 9,321,327
Total shareholders’ equity 26,982,107 26,721,304
Total liabilities and shareholders’ equity 114,826,568 117,719,185
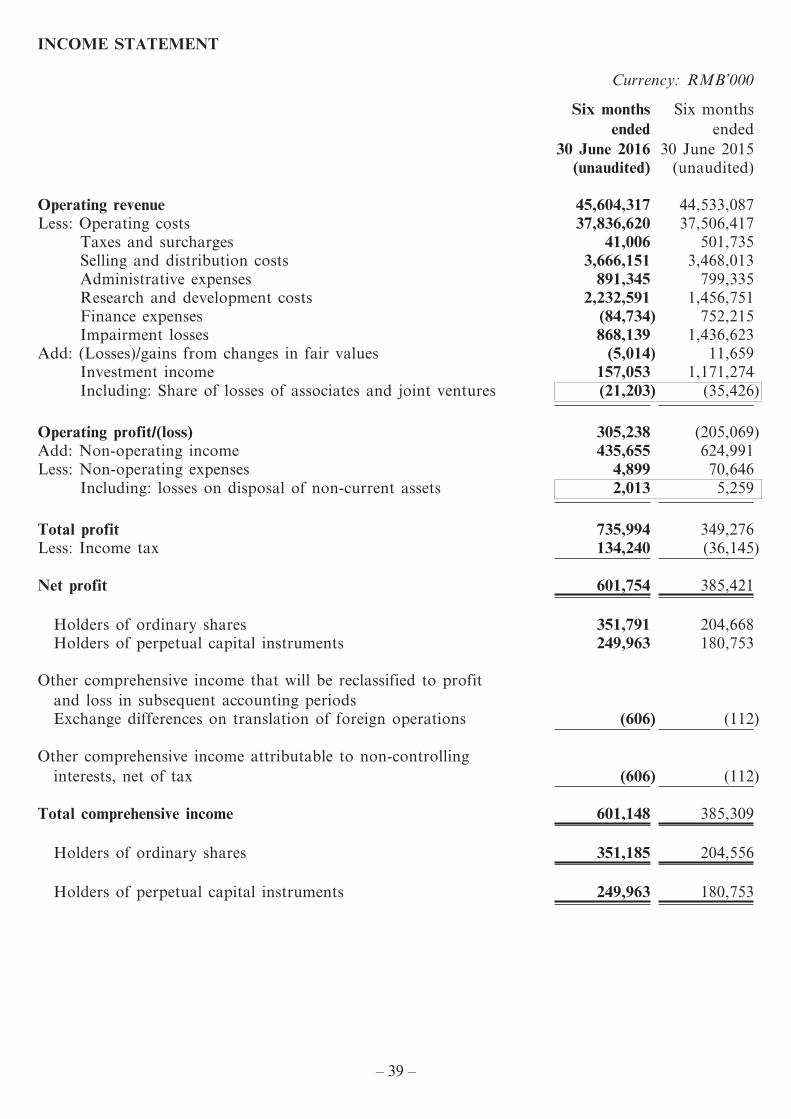
– 39 –
yiu.tsui
A161291 1st Proof Time/date: 25-08-2016_14:21:50 Cre8 (852) 3693 2600 yiu.tsui
INCOME STATEMENT
Currency: RMB’000
Six months ended
30 June 2016
Six months ended
30 June 2015(unaudited) (unaudited)
Operating revenue 45,604,317 44,533,087Less: Operating costs 37,836,620 37,506,417
Taxes and surcharges 41,006 501,735Selling and distribution costs 3,666,151 3,468,013Administrative expenses 891,345 799,335Research and development costs 2,232,591 1,456,751Finance expenses (84,734) 752,215Impairment losses 868,139 1,436,623
Add: (Losses)/gains from changes in fair values (5,014) 11,659Investment income 157,053 1,171,274Including: Share of losses of associates and joint ventures (21,203) (35,426)
Operating profit/(loss) 305,238 (205,069)Add: Non-operating income 435,655 624,991Less: Non-operating expenses 4,899 70,646
Including: losses on disposal of non-current assets 2,013 5,259
Total profit 735,994 349,276Less: Income tax 134,240 (36,145)
Net profit 601,754 385,421
Holders of ordinary shares 351,791 204,668Holders of perpetual capital instruments 249,963 180,753
Other comprehensive income that will be reclassified to profit and loss in subsequent accounting periodsExchange differences on translation of foreign operations (606) (112)
Other comprehensive income attributable to non-controlling interests, net of tax (606) (112)
Total comprehensive income 601,148 385,309
Holders of ordinary shares 351,185 204,556
Holders of perpetual capital instruments 249,963 180,753
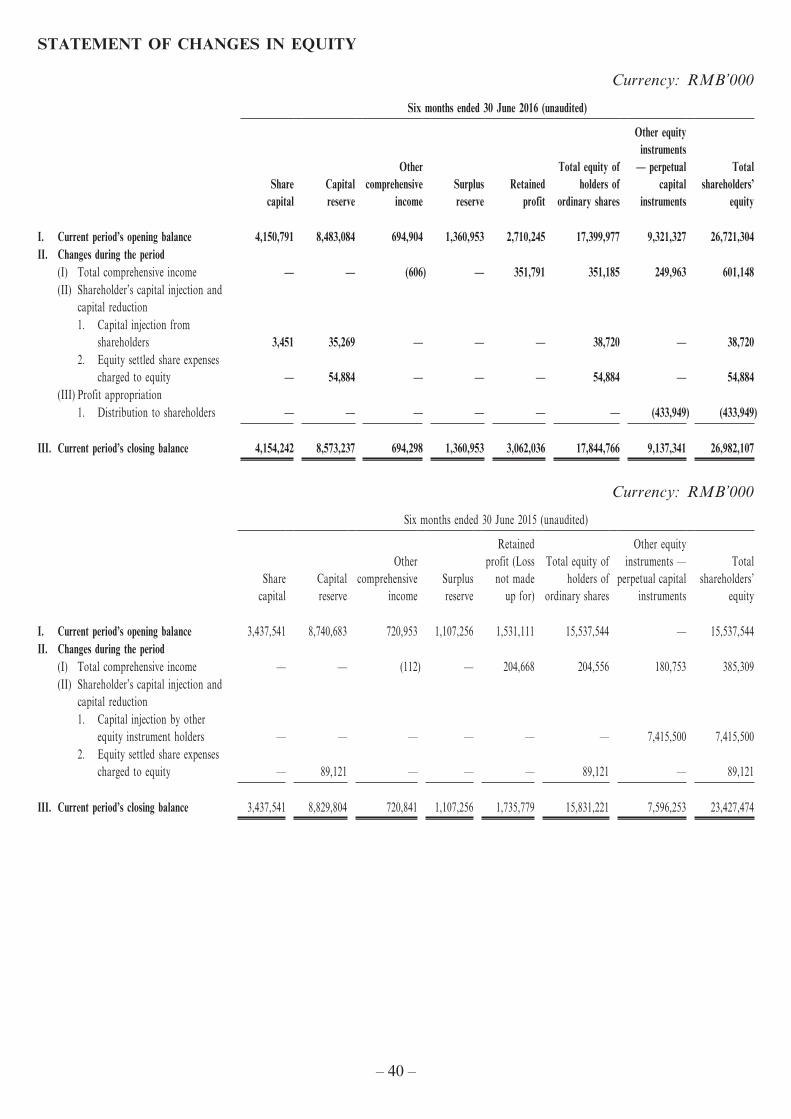
– 40 –
yiu.tsui
A161291 1st Proof Time/date: 25-08-2016_14:21:50 Cre8 (852) 3693 2600 yiu.tsui
STATEMENT OF CHANGES IN EQUITY
Currency: RMB’000
Six months ended 30 June 2016 (unaudited)
Share capital
Capital reserve
Other comprehensive
incomeSurplus reserve
Retained profit
Total equity of holders of
ordinary shares
Other equity instruments
— perpetual capital
instruments
Total shareholders’
equity
I. Current period’s opening balance 4,150,791 8,483,084 694,904 1,360,953 2,710,245 17,399,977 9,321,327 26,721,304II. Changes during the period (I) Total comprehensive income — — (606) — 351,791 351,185 249,963 601,148 (II) Shareholder’s capital injection and
capital reduction 1. Capital injection from
shareholders 3,451 35,269 — — — 38,720 — 38,720 2. Equity settled share expenses
charged to equity — 54,884 — — — 54,884 — 54,884 (III) Profit appropriation 1. Distribution to shareholders — — — — — — (433,949) (433,949)
III. Current period’s closing balance 4,154,242 8,573,237 694,298 1,360,953 3,062,036 17,844,766 9,137,341 26,982,107
Currency: RMB’000
Six months ended 30 June 2015 (unaudited)
Share capital
Capital reserve
Other comprehensive
incomeSurplus reserve
Retained profit (Loss
not made up for)
Total equity of holders of
ordinary shares
Other equity instruments —
perpetual capital instruments
Total shareholders’
equity
I. Current period’s opening balance 3,437,541 8,740,683 720,953 1,107,256 1,531,111 15,537,544 — 15,537,544II. Changes during the period (I) Total comprehensive income — — (112) — 204,668 204,556 180,753 385,309 (II) Shareholder’s capital injection and
capital reduction 1. Capital injection by other
equity instrument holders — — — — — — 7,415,500 7,415,500 2. Equity settled share expenses
charged to equity — 89,121 — — — 89,121 — 89,121
III. Current period’s closing balance 3,437,541 8,829,804 720,841 1,107,256 1,735,779 15,831,221 7,596,253 23,427,474
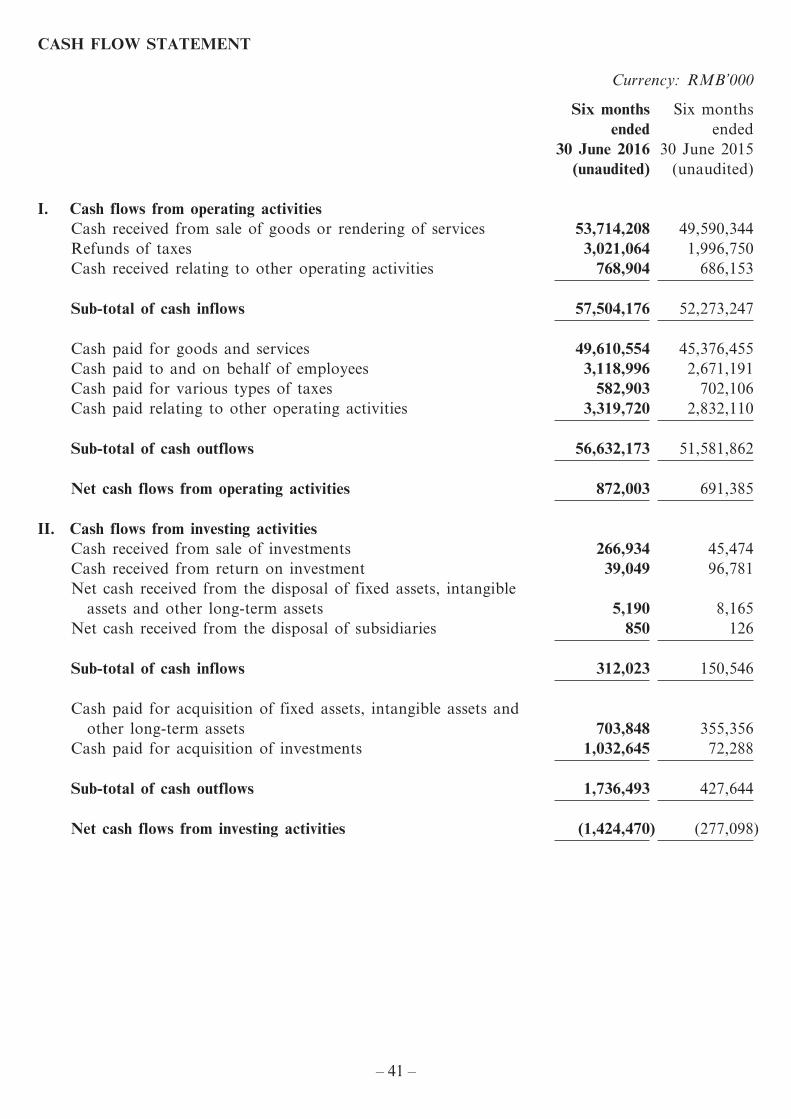
– 41 –
yiu.tsui
A161291 1st Proof Time/date: 25-08-2016_14:21:50 Cre8 (852) 3693 2600 yiu.tsui
CASH FLOW STATEMENT
Currency: RMB’000
Six months ended
30 June 2016
Six months ended
30 June 2015(unaudited) (unaudited)
I. Cash flows from operating activitiesCash received from sale of goods or rendering of services 53,714,208 49,590,344Refunds of taxes 3,021,064 1,996,750Cash received relating to other operating activities 768,904 686,153
Sub-total of cash inflows 57,504,176 52,273,247
Cash paid for goods and services 49,610,554 45,376,455Cash paid to and on behalf of employees 3,118,996 2,671,191Cash paid for various types of taxes 582,903 702,106Cash paid relating to other operating activities 3,319,720 2,832,110
Sub-total of cash outflows 56,632,173 51,581,862
Net cash flows from operating activities 872,003 691,385
II. Cash flows from investing activitiesCash received from sale of investments 266,934 45,474Cash received from return on investment 39,049 96,781Net cash received from the disposal of fixed assets, intangible
assets and other long-term assets 5,190 8,165Net cash received from the disposal of subsidiaries 850 126
Sub-total of cash inflows 312,023 150,546
Cash paid for acquisition of fixed assets, intangible assets and other long-term assets 703,848 355,356
Cash paid for acquisition of investments 1,032,645 72,288
Sub-total of cash outflows 1,736,493 427,644
Net cash flows from investing activities (1,424,470) (277,098)
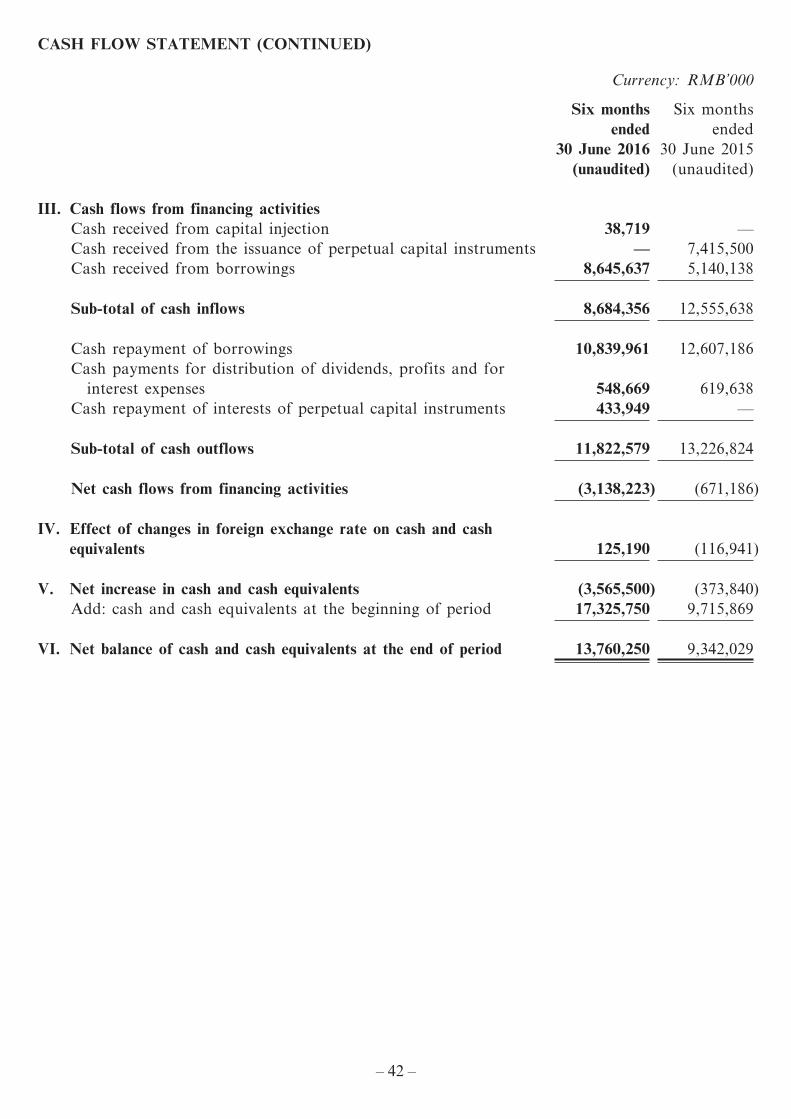
– 42 –
yiu.tsui
A161291 1st Proof Time/date: 25-08-2016_14:21:50 Cre8 (852) 3693 2600 yiu.tsui
CASH FLOW STATEMENT (CONTINUED)
Currency: RMB’000
Six months ended
30 June 2016
Six months ended
30 June 2015(unaudited) (unaudited)
III. Cash flows from financing activitiesCash received from capital injection 38,719 —Cash received from the issuance of perpetual capital instruments — 7,415,500Cash received from borrowings 8,645,637 5,140,138
Sub-total of cash inflows 8,684,356 12,555,638
Cash repayment of borrowings 10,839,961 12,607,186Cash payments for distribution of dividends, profits and for
interest expenses 548,669 619,638Cash repayment of interests of perpetual capital instruments 433,949 —
Sub-total of cash outflows 11,822,579 13,226,824
Net cash flows from financing activities (3,138,223) (671,186)
IV. Effect of changes in foreign exchange rate on cash and cash equivalents 125,190 (116,941)
V. Net increase in cash and cash equivalents (3,565,500) (373,840)Add: cash and cash equivalents at the beginning of period 17,325,750 9,715,869
VI. Net balance of cash and cash equivalents at the end of period 13,760,250 9,342,029
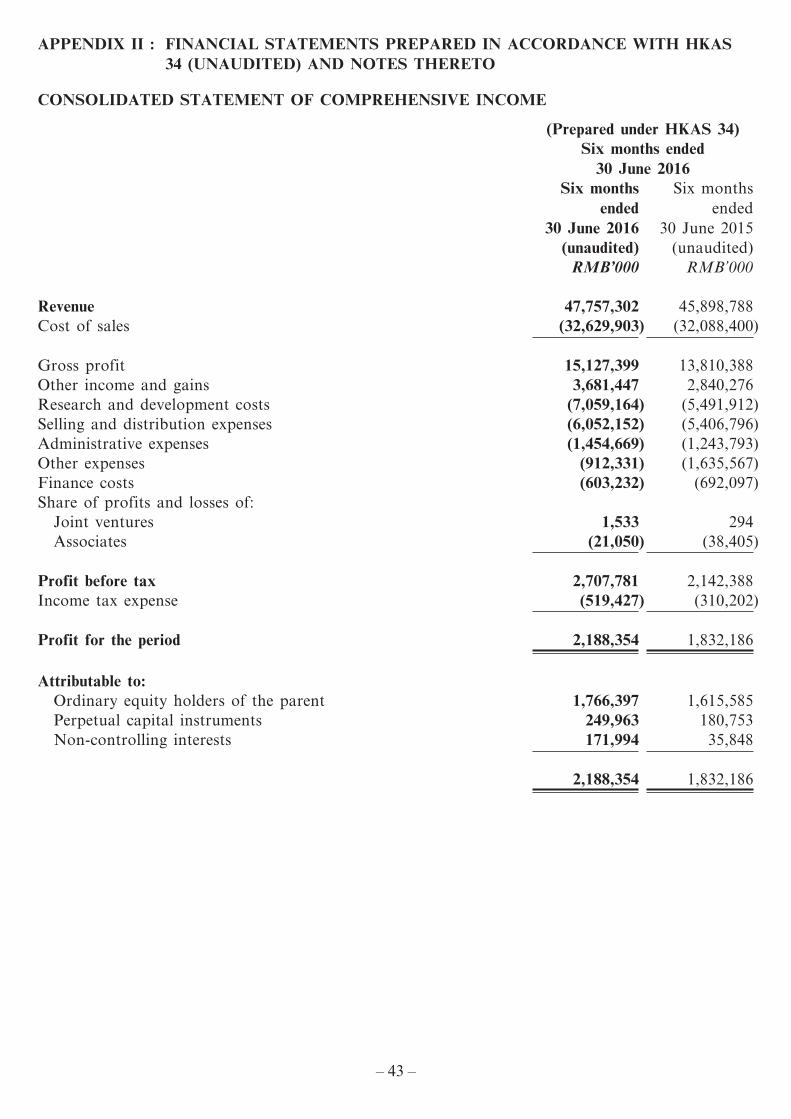
– 43 –
yiu.tsui
A161291 1st Proof Time/date: 25-08-2016_14:21:50 Cre8 (852) 3693 2600 yiu.tsui
APPENDIX II : FINANCIAL STATEMENTS PREPARED IN ACCORDANCE WITH HKAS 34 (UNAUDITED) AND NOTES THERETO
CONSOLIDATED STATEMENT OF COMPREHENSIVE INCOME
(Prepared under HKAS 34)Six months ended
30 June 2016Six months
ended 30 June 2016
Six months ended
30 June 2015(unaudited) (unaudited)
RMB’000 RMB’000
Revenue 47,757,302 45,898,788Cost of sales (32,629,903) (32,088,400)
Gross profit 15,127,399 13,810,388Other income and gains 3,681,447 2,840,276Research and development costs (7,059,164) (5,491,912)Selling and distribution expenses (6,052,152) (5,406,796)Administrative expenses (1,454,669) (1,243,793)Other expenses (912,331) (1,635,567)Finance costs (603,232) (692,097)Share of profits and losses of:
Joint ventures 1,533 294Associates (21,050) (38,405)
Profit before tax 2,707,781 2,142,388Income tax expense (519,427) (310,202)
Profit for the period 2,188,354 1,832,186
Attributable to:Ordinary equity holders of the parent 1,766,397 1,615,585Perpetual capital instruments 249,963 180,753Non-controlling interests 171,994 35,848
2,188,354 1,832,186
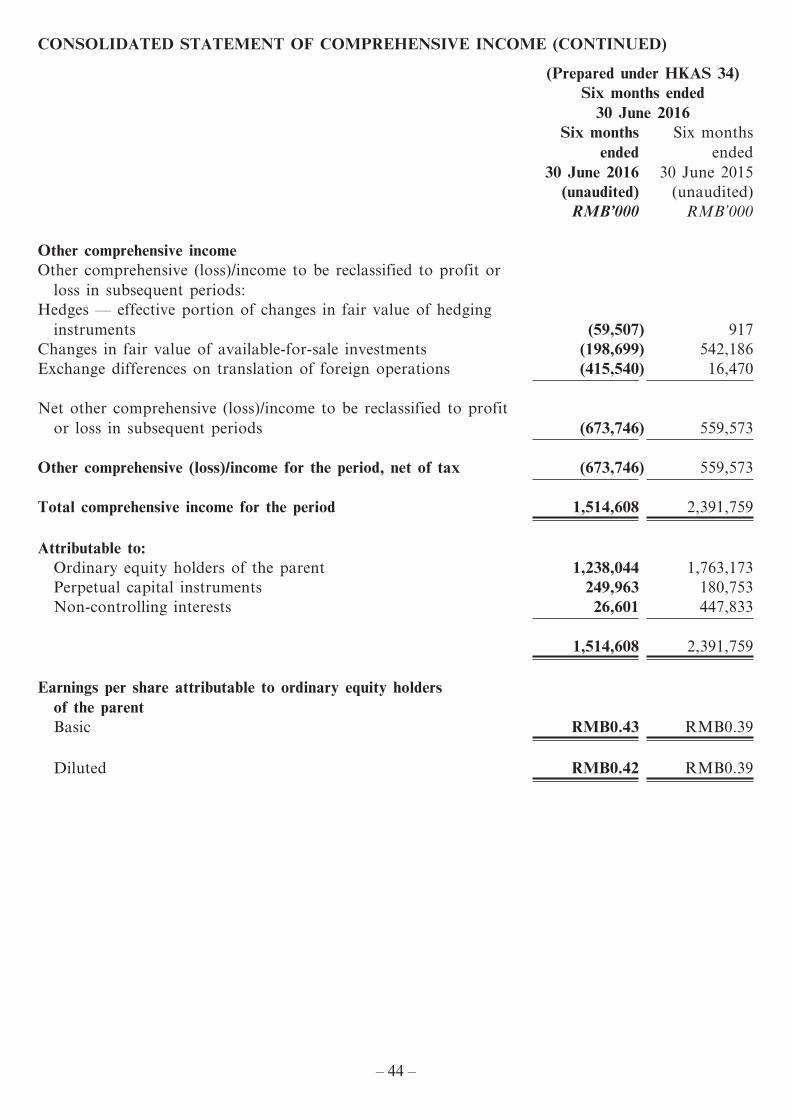
– 44 –
yiu.tsui
A161291 1st Proof Time/date: 25-08-2016_14:21:50 Cre8 (852) 3693 2600 yiu.tsui
CONSOLIDATED STATEMENT OF COMPREHENSIVE INCOME (CONTINUED)
(Prepared under HKAS 34)Six months ended
30 June 2016Six months
ended 30 June 2016
Six months ended
30 June 2015(unaudited) (unaudited)
RMB’000 RMB’000
Other comprehensive incomeOther comprehensive (loss)/income to be reclassified to profit or
loss in subsequent periods:Hedges — effective portion of changes in fair value of hedging
instruments (59,507) 917Changes in fair value of available-for-sale investments (198,699) 542,186Exchange differences on translation of foreign operations (415,540) 16,470
Net other comprehensive (loss)/income to be reclassified to profit or loss in subsequent periods (673,746) 559,573
Other comprehensive (loss)/income for the period, net of tax (673,746) 559,573
Total comprehensive income for the period 1,514,608 2,391,759
Attributable to:Ordinary equity holders of the parent 1,238,044 1,763,173Perpetual capital instruments 249,963 180,753Non-controlling interests 26,601 447,833
1,514,608 2,391,759
Earnings per share attributable to ordinary equity holders of the parentBasic RMB0.43 RMB0.39
Diluted RMB0.42 RMB0.39
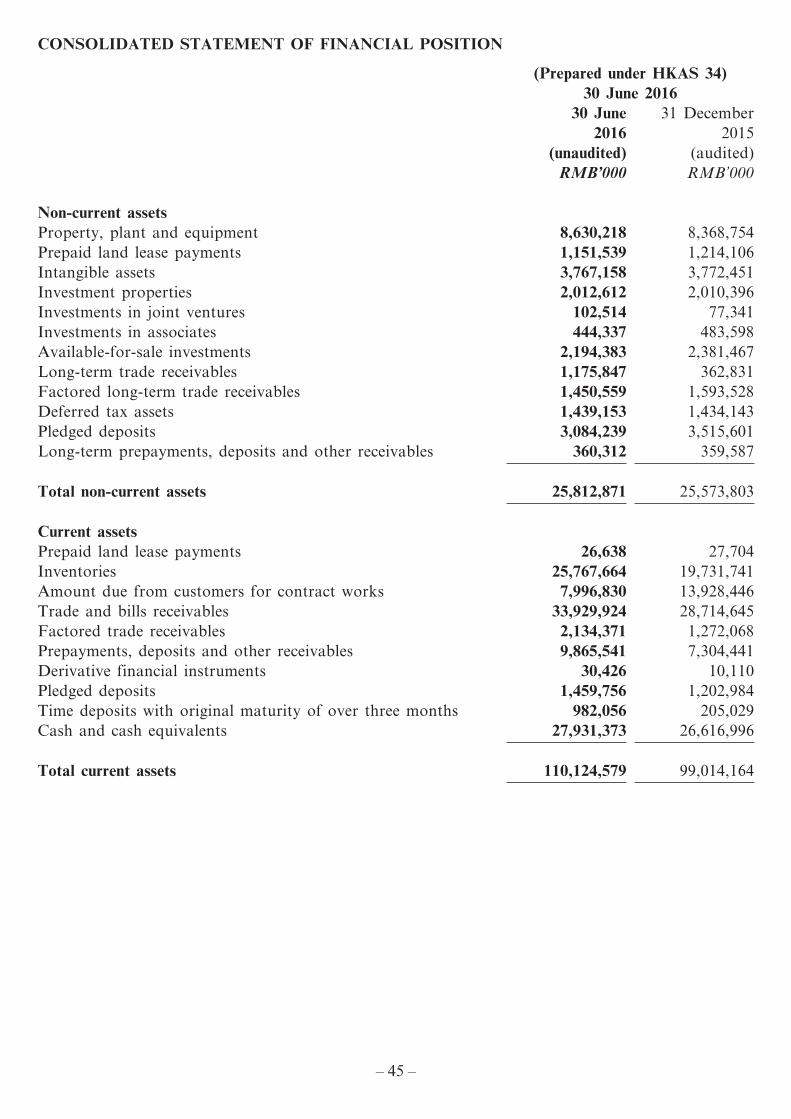
– 45 –
yiu.tsui
A161291 1st Proof Time/date: 25-08-2016_14:21:50 Cre8 (852) 3693 2600 yiu.tsui
CONSOLIDATED STATEMENT OF FINANCIAL POSITION
(Prepared under HKAS 34)30 June 2016
30 June 2016
31 December 2015
(unaudited) (audited)RMB’000 RMB’000
Non-current assetsProperty, plant and equipment 8,630,218 8,368,754Prepaid land lease payments 1,151,539 1,214,106Intangible assets 3,767,158 3,772,451Investment properties 2,012,612 2,010,396Investments in joint ventures 102,514 77,341Investments in associates 444,337 483,598Available-for-sale investments 2,194,383 2,381,467Long-term trade receivables 1,175,847 362,831Factored long-term trade receivables 1,450,559 1,593,528Deferred tax assets 1,439,153 1,434,143Pledged deposits 3,084,239 3,515,601Long-term prepayments, deposits and other receivables 360,312 359,587
Total non-current assets 25,812,871 25,573,803
Current assetsPrepaid land lease payments 26,638 27,704Inventories 25,767,664 19,731,741Amount due from customers for contract works 7,996,830 13,928,446Trade and bills receivables 33,929,924 28,714,645Factored trade receivables 2,134,371 1,272,068Prepayments, deposits and other receivables 9,865,541 7,304,441Derivative financial instruments 30,426 10,110Pledged deposits 1,459,756 1,202,984Time deposits with original maturity of over three months 982,056 205,029Cash and cash equivalents 27,931,373 26,616,996
Total current assets 110,124,579 99,014,164
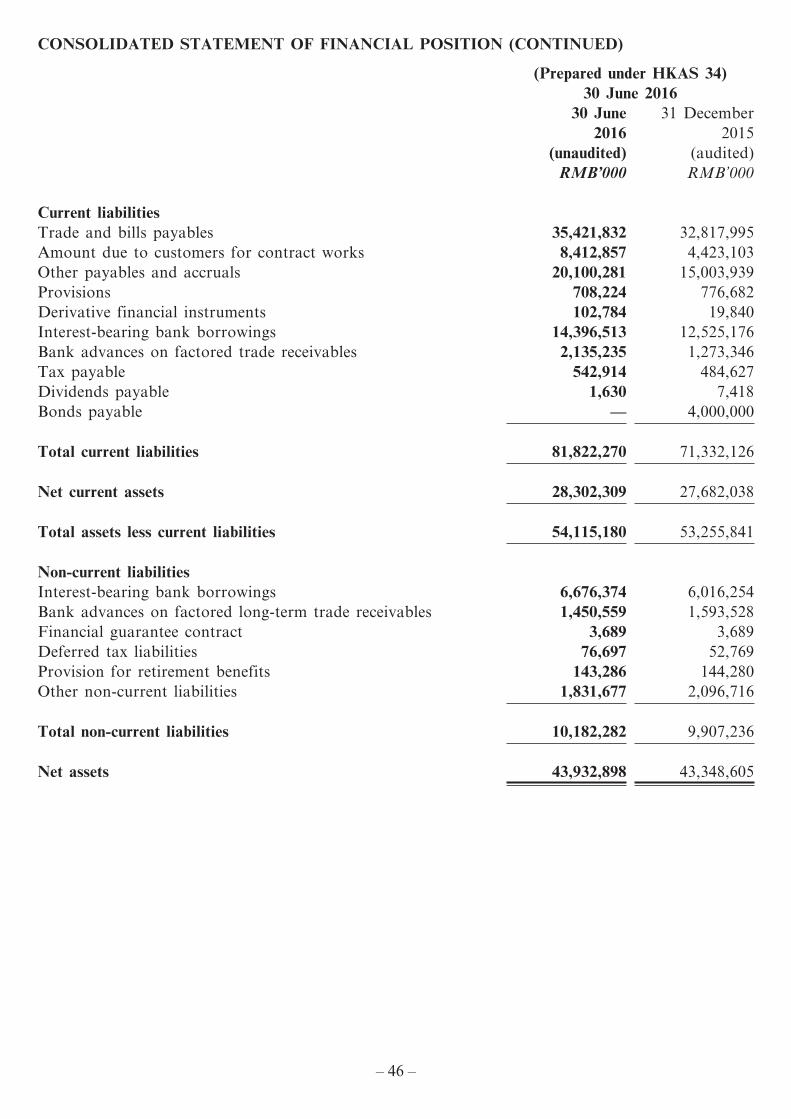
– 46 –
yiu.tsui
A161291 1st Proof Time/date: 25-08-2016_14:21:50 Cre8 (852) 3693 2600 yiu.tsui
CONSOLIDATED STATEMENT OF FINANCIAL POSITION (CONTINUED)
(Prepared under HKAS 34)30 June 2016
30 June 2016
31 December 2015
(unaudited) (audited)RMB’000 RMB’000
Current liabilitiesTrade and bills payables 35,421,832 32,817,995Amount due to customers for contract works 8,412,857 4,423,103Other payables and accruals 20,100,281 15,003,939Provisions 708,224 776,682Derivative financial instruments 102,784 19,840Interest-bearing bank borrowings 14,396,513 12,525,176Bank advances on factored trade receivables 2,135,235 1,273,346Tax payable 542,914 484,627Dividends payable 1,630 7,418Bonds payable — 4,000,000
Total current liabilities 81,822,270 71,332,126
Net current assets 28,302,309 27,682,038
Total assets less current liabilities 54,115,180 53,255,841
Non-current liabilitiesInterest-bearing bank borrowings 6,676,374 6,016,254Bank advances on factored long-term trade receivables 1,450,559 1,593,528Financial guarantee contract 3,689 3,689Deferred tax liabilities 76,697 52,769Provision for retirement benefits 143,286 144,280Other non-current liabilities 1,831,677 2,096,716
Total non-current liabilities 10,182,282 9,907,236
Net assets 43,932,898 43,348,605
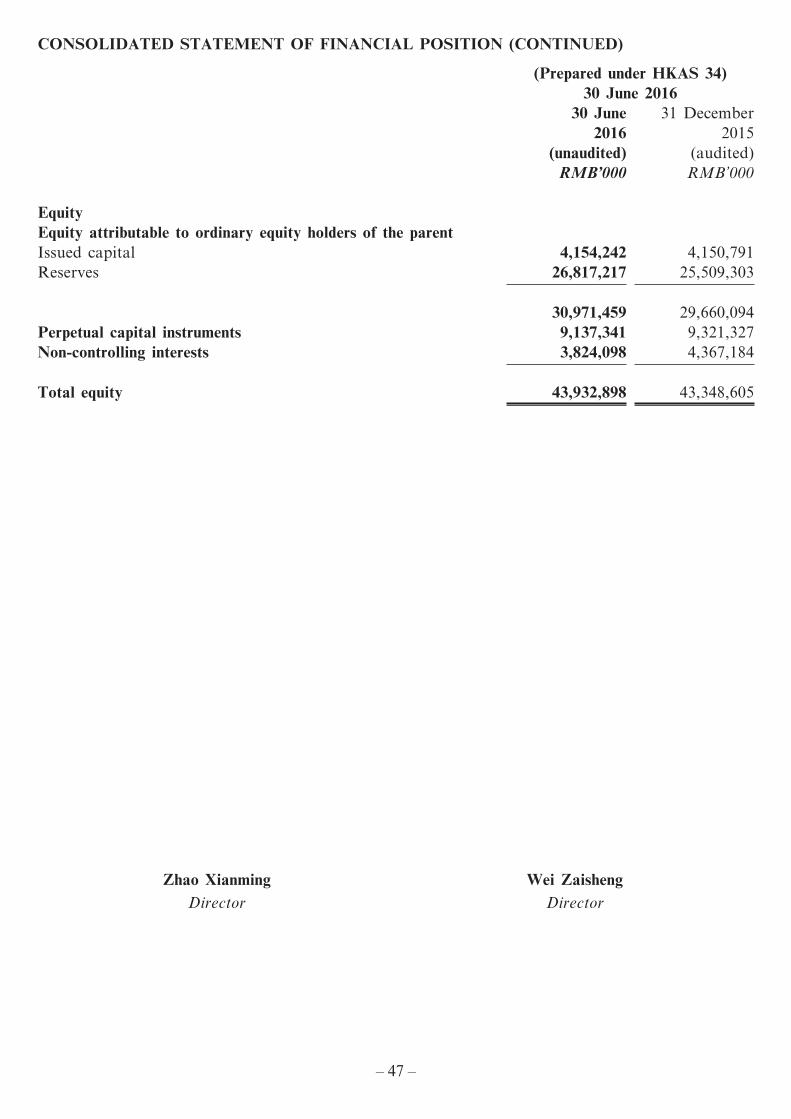
– 47 –
yiu.tsui
A161291 1st Proof Time/date: 25-08-2016_14:21:50 Cre8 (852) 3693 2600 yiu.tsui
CONSOLIDATED STATEMENT OF FINANCIAL POSITION (CONTINUED)
(Prepared under HKAS 34)30 June 2016
30 June 2016
31 December 2015
(unaudited) (audited)RMB’000 RMB’000
EquityEquity attributable to ordinary equity holders of the parentIssued capital 4,154,242 4,150,791Reserves 26,817,217 25,509,303
30,971,459 29,660,094Perpetual capital instruments 9,137,341 9,321,327Non-controlling interests 3,824,098 4,367,184
Total equity 43,932,898 43,348,605
Zhao Xianming Wei ZaishengDirector Director
– 48 –
yiu.tsui
A161291 1st Proof Time/date: 25-08-2016_14:21:50 Cre8 (852) 3693 2600 yiu.tsui
1. BASIS OF PREPARATION AND ACCOUNTING POLICIES
1.1 Basis of preparation
The interim condensed consolidated financial statements for the six months ended 30 June 2016 have been prepared in accordance with HKAS 34: Interim Financial Reporting.
The interim condensed consolidated financial statements do not include all the information and disclosures required in the annual financial statements, and should be read in conjunction with the Group’s annual financial statements as at 31 December 2015.
1.2 New and revised standards and interpretations adopted by the Group
The accounting policies adopted in the preparation of the interim condensed consolidated financial statements are consistent with those followed in the preparation of the Group’s annual consolidated financial statements for the year ended 31 December 2015, except for the adoption of new standards and interpretations effective as of 1 January 2016. The Group has not early adopted any other standard, interpretation or amendment that has been issued but is not yet effective.
The nature and the effect of these changes are disclosed below. Although these new standards and amendments apply for the first time in 2016, they do not have a material impact on the annual financial statements of the Group or the interim condensed consolidated financial statements of the Group. The nature and the impact of each new standard or amendment is described below:
Amendments to HKFRS 11
The amendments to HKFRS 11 require that an acquirer of an interest in a joint operation in which the activity of the joint operation constitutes a business must apply the relevant principles for business combinations in HKFRS 3. The amendments also clarify that a previously held interest in a joint operation is not remeasured on the acquisition of an additional interest in the same joint operation while joint control is retained. In addition, a scope exclusion has been added to HKFRS 11 to specify that the amendments do not apply when the parties sharing joint control, including the reporting entity, are under common control of the same ultimate controlling party. The amendments apply to both the acquisition of the initial interest in a joint operation and the acquisition of any additional interests in the same joint operation. The amendment has had no impact on the Group as there is no new acquisition of Interests in joint operations during the period.
– 49 –
yiu.tsui
A161291 1st Proof Time/date: 25-08-2016_14:21:50 Cre8 (852) 3693 2600 yiu.tsui
1. BASIS OF PREPARATION AND ACCOUNTING POLICIES (CONTINUED)
1.2 New and revised standards and interpretations adopted by the Group (Continued)
Amendments to HKAS 1
Amendments to HKAS 1 include narrow-focus improvements in respect of the presentation and disclosure in financial statements. The amendments clarify:
(i) the materiality requirements in HKAS 1;
(ii) that specific line items in the statement of profit or loss and other comprehensive income and the statement of financial position may be disaggregated;
(iii) that entities have flexibility as to the order in which they present the notes to financial statements; and
(iv) that the share of other comprehensive income of associates and joint ventures accounted for using the equity method must be presented in aggregate as a single line item, and classified between those items that will or will not be subsequently reclassified to profit or loss.
Furthermore, the amendments clarify the requirements that apply when additional subtotals are presented in the statement of financial position and the statement of profit or loss and other comprehensive income. The amendments has had no impact on the Group’s financial statements.
2. OPERATING SEGMENT INFORMATION
For management purposes, the Group is organised into business units based on their products and services and has three reportable operating segments as follows:
(a) The Carriers’ Networks are focused on meeting the demands of carriers by providing wireless networks, wireline networks, core networks, telecommunication software systems and services and other innovative technologies and product solutions.
(b) The Consumer Business is focused on bringing experience in smart devices to customers while also catering to the demands of industry and corporate clients through the development, production and sales of products such as smart phones, mobile broadband, family terminals, innovative fusion terminals, wearable devices, as well as the provision of related software application and value-added services.
(c) The Government and Corporate Business is focused on meeting the demands of government and corporate clients, proving top-level design and consultation services as well as implementation, operation and maintenance of integrated informatisation solutions for the government and corporate informatisation projects through the application of cloud computing, communications networks, internet of things, big data technologies and related core M-ICT products.
– 50 –
yiu.tsui
A161291 1st Proof Time/date: 25-08-2016_14:21:50 Cre8 (852) 3693 2600 yiu.tsui
2. OPERATING SEGMENT INFORMATION (CONTINUED)
Management monitors the results of the Group’s operating segments separately for the purpose of making decisions about resources allocation and performance assessment. Segment performance is evaluated based on reportable segment profit, which is a measure of adjusted profit before tax. The adjusted profit before tax is measured consistently with the Group’s profit before tax except that interest income, finance costs, research and development costs, impairment losses, dividend income, share of profits and losses of associates and joint ventures, fair value gains/(losses) from the Group’s financial instruments as well as head office and corporate expenses are excluded from such measurement.
Segment assets exclude derivative financial instruments, deferred tax assets, pledged deposits, cash and cash equivalents, investments in joint ventures and associates, other receivables, other unallocated head office and corporate assets as these assets are managed on a group basis.
Segment liabilities exclude derivative financial instruments, interest-bearing bank borrowings, other payables, bonds payable, tax payable, deferred tax liabilities, provision for retirement benefits and other unallocated head office and corporate liabilities as these liabilities are managed on a group basis.
Business segments for reporting and disclosure purposes have been reclassified for the reporting period into Carriers’ Networks (comprising mainly projects in collaboration with domestic and international telecommunications carriers), Government and Corporate Business (comprising mainly projects in collaboration with domestic and international governments and corporations) and Consumer Business (comprising mainly businesses targeted at end-consumers) according to the nature of customers from which revenue is derived. The management of the Company is of the view that the classification of business segments according to the nature of customers from which revenue is derived will give a more accurate reflection of the current operating conditions as well as market and strategic positions of the Company and align more closely with the management model of the Company’s business departments and its internal performance appraisal. The Company has classified its customers into three main categories, namely, carriers, government and corporate networks and end-consumers. Accordingly, its revenue and costs have been analysed into the aforesaid three major segments based on the source of end-users, and the corresponding figures for 2015 have been restated on the same basis.
– 51 –
yiu.tsui
A161291 1st Proof Time/date: 25-08-2016_14:21:50 Cre8 (852) 3693 2600 yiu.tsui
2. OPERATING SEGMENT INFORMATION (CONTINUED)
An analysis of the Group’s revenue and profit by operating segment is set out in the following table:
Carriers’ Networks
Consumer Business
Government and Corporate
Business TotalRMB’000 RMB’000 RMB’000 RMB’000
Six months ended 30 June 2016Segment revenue:Revenue from external customers 28,734,974 14,415,057 4,607,271 47,757,302
28,734,974 14,415,057 4,607,271 47,757,302
Segment results 8,070,444 261,906 1,250,760 9,583,110Bank and other interest income 442,372Dividend income and unallocated
gains 3,239,075Unallocated expenses (9,934,027)Finance costs (603,232)Share of profits and losses of:Joint ventures 1,533Associates (21,050)
Profit before tax 2,707,781
30 June 2016Segment assets 45,658,651 19,475,787 7,320,757 72,455,195Investment in joint ventures 102,514Investment in associates 444,337Unallocated assets 62,935,404Total assets 135,937,450
Segment liabilities 13,443,985 3,519,122 2,155,564 19,118,671Unallocated liabilities 72,885,881
Total liabilities 92,004,552
Six months ended 30 June 2016Other segment information:Impairment losses recognised in
profit or loss 632,505 317,299 101,414 1,051,218Depreciation and amortisation 766,677 384,608 122,927 1,274,212Capital expenditure 1,106,100 554,882 177,349 1,838,331
– 52 –
yiu.tsui
A161291 1st Proof Time/date: 25-08-2016_14:21:50 Cre8 (852) 3693 2600 yiu.tsui
2. OPERATING SEGMENT INFORMATION (CONTINUED)
Carriers’ Networks
Consumer Business
Government and Corporate
Business TotalRMB’000 RMB’000 RMB’000 RMB’000
Six months ended 30 June 2015Segment revenue:Revenue from external customers 27,354,512 14,047,702 4,496,574 45,898,788
27,354,512 14,047,702 4,496,574 45,898,788
Segment results 7,640,319 683,327 969,400 9,293,046Bank and other interest income 298,730Dividend income and unallocated
gains 2,541,546Unallocated expenses (9,260,726)Finance costs (692,097)Share of profits and losses of:Joint ventures 294Associates (38,405)
Profit before tax 2,142,388
31 December 2015Segment assets 40,619,357 17,396,973 7,586,929 65,603,259Investment in joint ventures 77,341Investment in associates 483,598Unallocated assets 58,423,769
Total assets 124,587,967
Segment liabilities 7,800,164 2,068,528 1,456,923 11,325,615Unallocated liabilities 69,913,747
Total liabilities 81,239,362
Six months ended 30 June 2015Other segment information:Impairment losses recognised in
profit or loss 1,121,687 576,034 184,385 1,882,106Depreciation and amortisation 579,849 297,778 95,317 972,944Capital expenditure 919,189 472,042 151,098 1,542,329
– 53 –
yiu.tsui
A161291 1st Proof Time/date: 25-08-2016_14:21:50 Cre8 (852) 3693 2600 yiu.tsui
2. OPERATING SEGMENT INFORMATION (CONTINUED)
Geographical information
(a) Revenue from external customers
Six months ended
30 June 2016
Six months ended
30 June 2015RMB’000 RMB’000
The PRC 27,803,026 24,360,835Asia (excluding the PRC) 7,234,938 7,197,236Africa 3,100,051 3,207,354Europe, Americas and Oceania 9,619,287 11,133,363
Total 47,757,302 45,898,788
The revenue information above is based on the locations of the customers.
(b) Non-current assets
Six months ended
30 June 2016
Six months ended
30 June 2015RMB’000 RMB’000
The PRC 13,229,859 12,680,987Asia (excluding the PRC) 1,111,232 1,329,223Africa 326,598 354,310Europe, Americas and Oceania 893,838 1,001,187
Total 15,561,527 15,365,707
The non-current asset information above is based on the locations of the assets and excludes financial instruments, deferred tax assets, investments in joint ventures, investments in associates and other non-current assets.
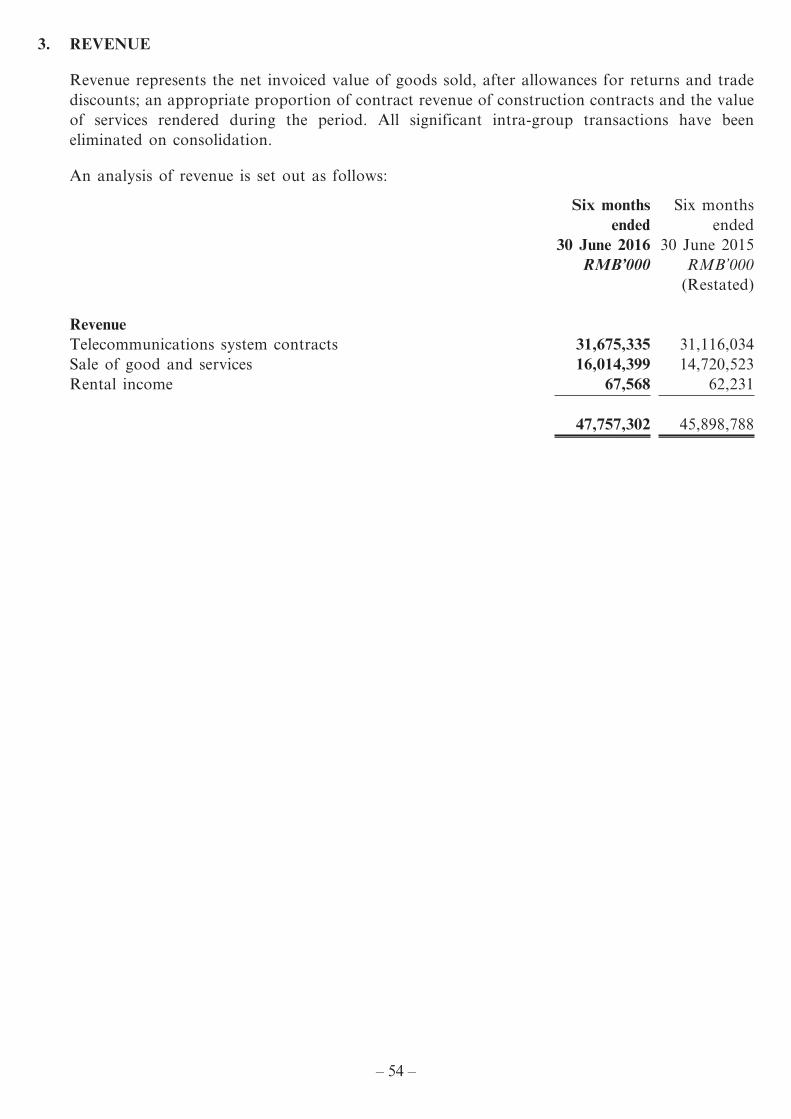
– 54 –
yiu.tsui
A161291 1st Proof Time/date: 25-08-2016_14:21:50 Cre8 (852) 3693 2600 yiu.tsui
3. REVENUE
Revenue represents the net invoiced value of goods sold, after allowances for returns and trade discounts; an appropriate proportion of contract revenue of construction contracts and the value of services rendered during the period. All significant intra-group transactions have been eliminated on consolidation.
An analysis of revenue is set out as follows:
Six months ended
30 June 2016
Six months ended
30 June 2015RMB’000 RMB’000
(Restated)
RevenueTelecommunications system contracts 31,675,335 31,116,034Sale of good and services 16,014,399 14,720,523Rental income 67,568 62,231
47,757,302 45,898,788
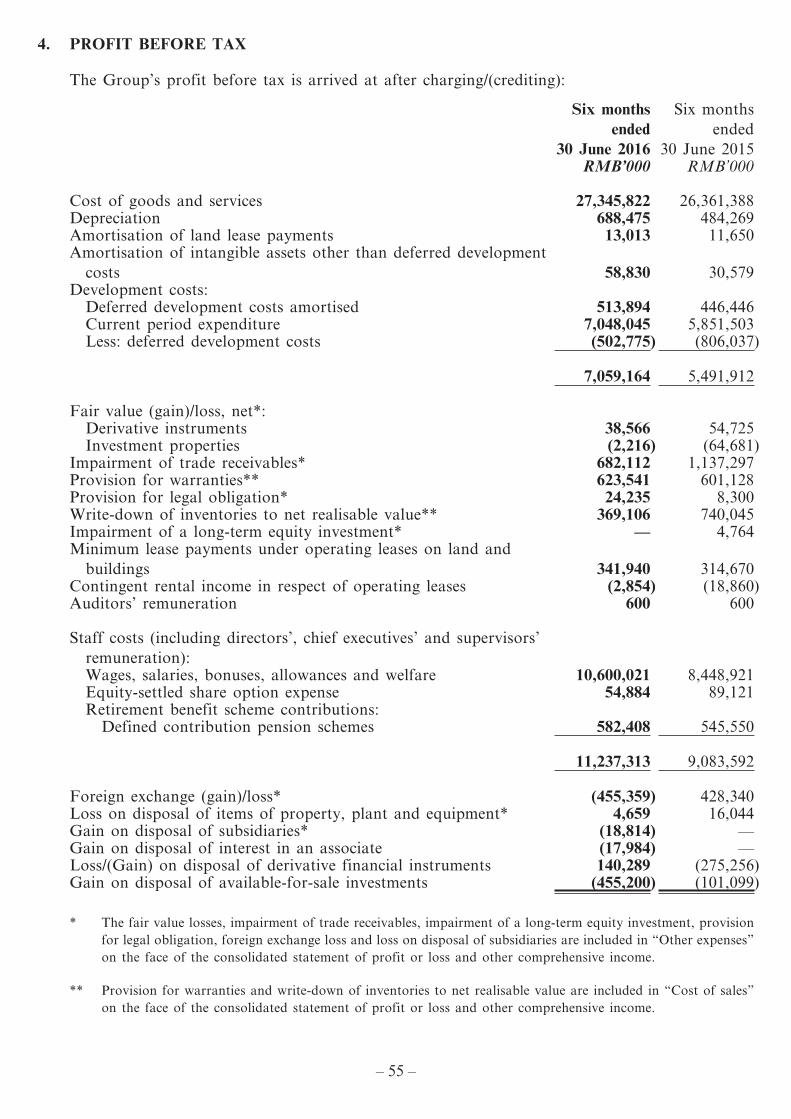
– 55 –
yiu.tsui
A161291 1st Proof Time/date: 25-08-2016_14:21:50 Cre8 (852) 3693 2600 yiu.tsui
4. PROFIT BEFORE TAX
The Group’s profit before tax is arrived at after charging/(crediting):
Six months ended
30 June 2016
Six months ended
30 June 2015RMB’000 RMB’000
Cost of goods and services 27,345,822 26,361,388Depreciation 688,475 484,269Amortisation of land lease payments 13,013 11,650Amortisation of intangible assets other than deferred development
costs 58,830 30,579Development costs:
Deferred development costs amortised 513,894 446,446Current period expenditure 7,048,045 5,851,503Less: deferred development costs (502,775) (806,037)
7,059,164 5,491,912
Fair value (gain)/loss, net*:Derivative instruments 38,566 54,725Investment properties (2,216) (64,681)
Impairment of trade receivables* 682,112 1,137,297Provision for warranties** 623,541 601,128Provision for legal obligation* 24,235 8,300Write-down of inventories to net realisable value** 369,106 740,045Impairment of a long-term equity investment* — 4,764Minimum lease payments under operating leases on land and
buildings 341,940 314,670Contingent rental income in respect of operating leases (2,854) (18,860)Auditors’ remuneration 600 600
Staff costs (including directors’, chief executives’ and supervisors’ remuneration):Wages, salaries, bonuses, allowances and welfare 10,600,021 8,448,921Equity-settled share option expense 54,884 89,121Retirement benefit scheme contributions:
Defined contribution pension schemes 582,408 545,550
11,237,313 9,083,592
Foreign exchange (gain)/loss* (455,359) 428,340Loss on disposal of items of property, plant and equipment* 4,659 16,044Gain on disposal of subsidiaries* (18,814) —Gain on disposal of interest in an associate (17,984) —Loss/(Gain) on disposal of derivative financial instruments 140,289 (275,256)Gain on disposal of available-for-sale investments (455,200) (101,099)
* The fair value losses, impairment of trade receivables, impairment of a long-term equity investment, provision for legal obligation, foreign exchange loss and loss on disposal of subsidiaries are included in “Other expenses” on the face of the consolidated statement of profit or loss and other comprehensive income.
** Provision for warranties and write-down of inventories to net realisable value are included in “Cost of sales” on the face of the consolidated statement of profit or loss and other comprehensive income.
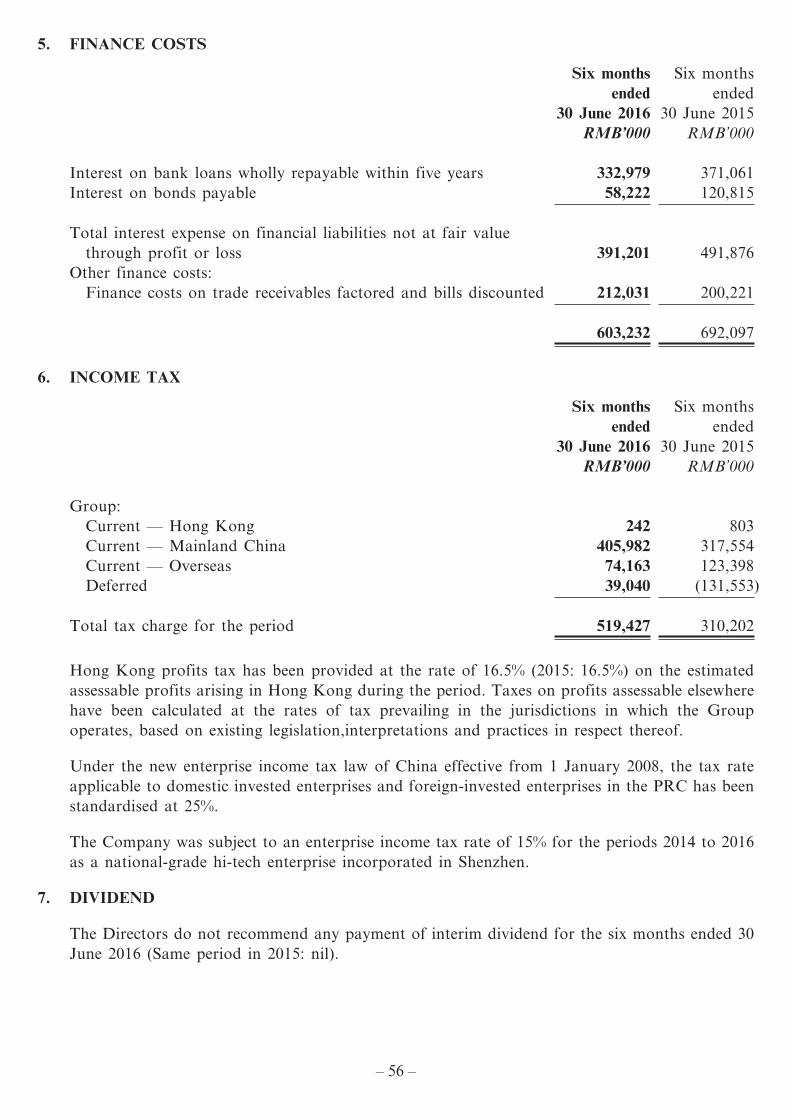
– 56 –
yiu.tsui
A161291 1st Proof Time/date: 25-08-2016_14:21:50 Cre8 (852) 3693 2600 yiu.tsui
5. FINANCE COSTS
Six months ended
30 June 2016
Six months ended
30 June 2015RMB’000 RMB’000
Interest on bank loans wholly repayable within five years 332,979 371,061Interest on bonds payable 58,222 120,815
Total interest expense on financial liabilities not at fair value through profit or loss 391,201 491,876
Other finance costs:Finance costs on trade receivables factored and bills discounted 212,031 200,221
603,232 692,097
6. INCOME TAX
Six months ended
30 June 2016
Six months ended
30 June 2015RMB’000 RMB’000
Group:Current — Hong Kong 242 803Current — Mainland China 405,982 317,554Current — Overseas 74,163 123,398Deferred 39,040 (131,553)
Total tax charge for the period 519,427 310,202
Hong Kong profits tax has been provided at the rate of 16.5% (2015: 16.5%) on the estimated assessable profits arising in Hong Kong during the period. Taxes on profits assessable elsewhere have been calculated at the rates of tax prevailing in the jurisdictions in which the Group operates, based on existing legislation,interpretations and practices in respect thereof.
Under the new enterprise income tax law of China effective from 1 January 2008, the tax rate applicable to domestic invested enterprises and foreign-invested enterprises in the PRC has been standardised at 25%.
The Company was subject to an enterprise income tax rate of 15% for the periods 2014 to 2016 as a national-grade hi-tech enterprise incorporated in Shenzhen.
7. DIVIDEND
The Directors do not recommend any payment of interim dividend for the six months ended 30 June 2016 (Same period in 2015: nil).
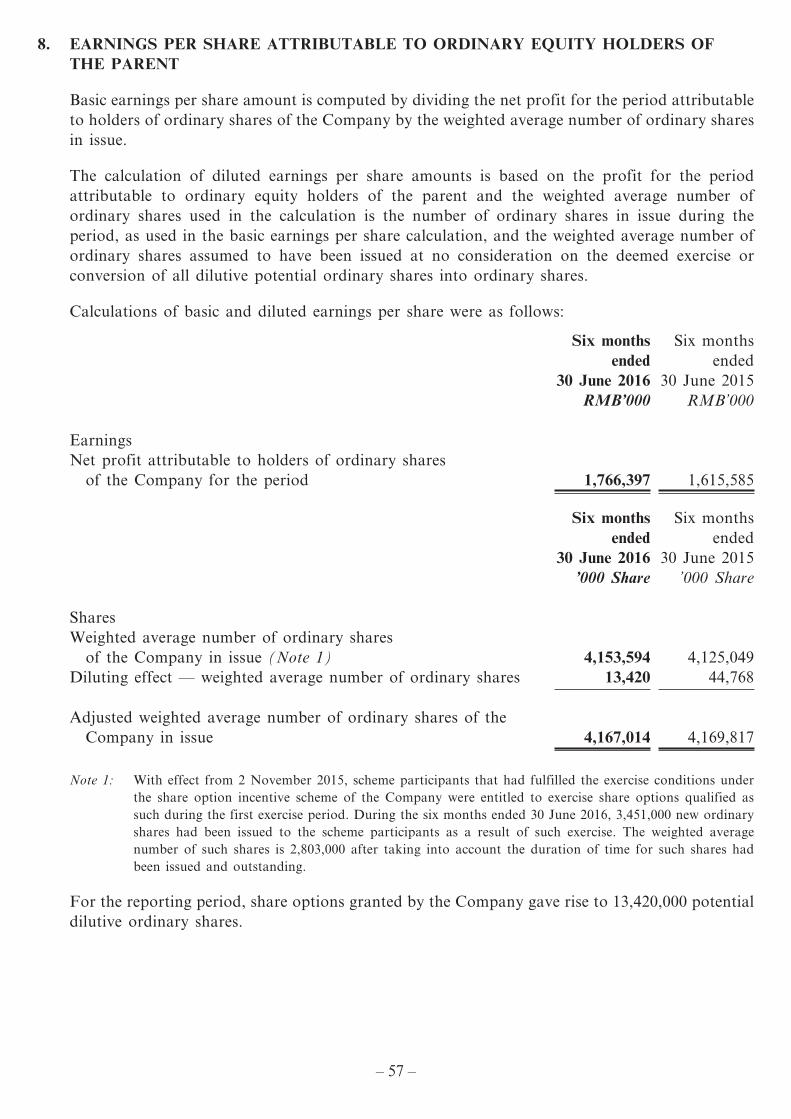
– 57 –
yiu.tsui
A161291 1st Proof Time/date: 25-08-2016_14:21:50 Cre8 (852) 3693 2600 yiu.tsui
8. EARNINGS PER SHARE ATTRIBUTABLE TO ORDINARY EQUITY HOLDERS OF THE PARENT
Basic earnings per share amount is computed by dividing the net profit for the period attributable to holders of ordinary shares of the Company by the weighted average number of ordinary shares in issue.
The calculation of diluted earnings per share amounts is based on the profit for the period attributable to ordinary equity holders of the parent and the weighted average number of ordinary shares used in the calculation is the number of ordinary shares in issue during the period, as used in the basic earnings per share calculation, and the weighted average number of ordinary shares assumed to have been issued at no consideration on the deemed exercise or conversion of all dilutive potential ordinary shares into ordinary shares.
Calculations of basic and diluted earnings per share were as follows:
Six months ended
30 June 2016
Six months ended
30 June 2015RMB’000 RMB’000
EarningsNet profit attributable to holders of ordinary shares
of the Company for the period 1,766,397 1,615,585
Six months ended
30 June 2016
Six months ended
30 June 2015’000 Share ’000 Share
SharesWeighted average number of ordinary shares
of the Company in issue (Note 1) 4,153,594 4,125,049Diluting effect — weighted average number of ordinary shares 13,420 44,768
Adjusted weighted average number of ordinary shares of the Company in issue 4,167,014 4,169,817
Note 1: With effect from 2 November 2015, scheme participants that had fulfilled the exercise conditions under the share option incentive scheme of the Company were entitled to exercise share options qualified as such during the first exercise period. During the six months ended 30 June 2016, 3,451,000 new ordinary shares had been issued to the scheme participants as a result of such exercise. The weighted average number of such shares is 2,803,000 after taking into account the duration of time for such shares had been issued and outstanding.
For the reporting period, share options granted by the Company gave rise to 13,420,000 potential dilutive ordinary shares.
– 58 –
yiu.tsui
A161291 1st Proof Time/date: 25-08-2016_14:21:50 Cre8 (852) 3693 2600 yiu.tsui
9. TRADE AND BILLS RECEIVABLES/LONG-TERM TRADE RECEIVABLES
30 June 2016
31 December 2015
RMB’000 RMB’000
Trade and bills receivables 41,405,240 34,879,664Impairment (6,299,469) (5,802,188)
35,105,771 29,077,476
Current portion (33,929,924) (28,714,645)
Long-term portion 1,175,847 362,831
Progress payment for telecommunications system contracts is normally made in accordance with the agreed payment schedule. The Group’s trading terms with its major customers are mainly on credit, except for new customers, where payment in advance is normally required. With the exception of certain overseas customers, the credit period is normally 90 days, and is extendable up to one year depending on customers’ creditworthiness. The credit terms for major customers are reviewed regularly by senior management. The Group seeks to maintain strict control over its outstanding receivables and has a credit control department to minimise credit risk. Overdue balances are reviewed regularly by senior management. In view of the aforementioned, there is no significant concentration of credit risk.
An aged analysis of the trade and bills receivables as at the end of the reporting period, based on the invoice date and net of provision, is set out as follows:
30 June 2016
31 December 2015
RMB’000 RMB’000
Within 6 months 27,648,014 24,060,6307 to 12 months 4,130,757 2,716,4721 to 2 years 2,986,241 2,106,5962 to 3 years 340,759 193,778
35,105,771 29,077,476
Less: portion classified as current assets (33,929,924) (28,714,645)
Long-term portion 1,175,847 362,831
– 59 –
yiu.tsui
A161291 1st Proof Time/date: 25-08-2016_14:21:50 Cre8 (852) 3693 2600 yiu.tsui
9. TRADE AND BILLS RECEIVABLES/LONG-TERM TRADE RECEIVABLES (CONTINUED)
The movements in the provision for impairment of trade and bills receivables are as follows:
30 June 2016
31 December 2015
RMB’000 RMB’000
Opening balance 5,802,188 4,396,591Impairment losses recognised 745,038 1,820,368Amount written off as uncollectible (184,831) (196,849)Impairment losses reversed (62,926) (217,922)
Closing balance 6,299,469 5,802,188
Included in the above provision for impairment of trade and bills receivables is a provision for individually impaired trade receivables of RMB345,001,000 (31 December 2015: RMB503,123,000) with a carrying amount before provision of RMB345,001,000 (31 December 2015: RMB503,123,000). The individually impaired trade receivables relate to customers that were in financial difficulties and are not expected to be recovered. The Group does not hold any collateral or other credit enhancements over these balances. Trade receivables are non-interest-bearing.
An aged analysis of the trade and bills receivables that are not considered to be impaired is as follows:
30 June 2016
31 December 2015
RMB’000 RMB’000
Neither past due nor impaired 4,831,436 4,228,313Less than one year past due 21,232,779 22,009,510
26,064,215 26,237,823
Receivables that were neither past due nor impaired relate to a large number of diversified customers for whom there was no recent history of default.
Receivables that were past due but not impaired relate to a number of independent customers that have a good track record with the Group. Based on past experience, the directors of the Company are of the opinion that no provision for impairment is necessary in respect of these balances as there has not been any change in credit quality and the balances are still considered fully recoverable.
– 60 –
yiu.tsui
A161291 1st Proof Time/date: 25-08-2016_14:21:50 Cre8 (852) 3693 2600 yiu.tsui
9. TRADE AND BILLS RECEIVABLES/LONG-TERM TRADE RECEIVABLES (CONTINUED)
The balances due from the controlling company, joint ventures, associates and other related companies included in the above are analysed as follows:
30 June 2016
31 December 2015
RMB’000 RMB’000
The controlling shareholder 859 1,425Joint ventures 176,457 70,990Associates 7,314 20,332Other related companies 571,419 300,287
756,049 393,034
The balances are unsecured, interest-free, repayable on demand and on credit terms similar to those offered to the major customers of the Group.
The Group has not pledged trade receivables but pledged RMB184,183,000 bills receivables (2015: none and RMB106,892,000) to secure the bank borrowings.
10. TRADE AND BILLS PAYABLES
An aged analysis of the trade and bills payable as at the balance sheet date, based on the invoice date, is set out as follows:
30 June 2016
31 December 2015
RMB’000 RMB’000
Within 6 months 34,445,360 32,391,1077 to 12 months 625,584 264,0271 to 2 years 250,736 123,0112 to 3 years 83,976 10,327Over 3 years 16,176 29,523
Total 35,421,832 32,817,995
– 61 –
yiu.tsui
A161291 1st Proof Time/date: 25-08-2016_14:21:50 Cre8 (852) 3693 2600 yiu.tsui
10. TRADE AND BILLS PAYABLES (CONTINUED)
The balances due to the controlling shareholder, joint ventures, associates and other related companies included in the above are analysed as follows:
30 June 2016
31 December 2015
RMB’000 RMB’000
The controlling shareholder 53,402 61,007Joint ventures 10,720 11,973Associates 109 1,650Other related companies 149,259 105,262
Total 213,490 179,892
The balances are unsecured, interest-free and repayable on demand.
Trade payables are non-interest-bearing and are normally settled on within 180 days.
11. EVENTS AFTER THE REPORTING PERIOD
(a) Giga Device Semiconductor (Beijing) Inc. (“Giga Device”), a company in which Shenzhen Zhonghe Chunsheng Partnership Private Equity Fund I (“Zhonghe Chunsheng Fund”), a partnership reported in the consolidated financial statements of the Company, has invested in, was listed on the Shanghai Stock Exchange on 18 August 2016 with the issue capital of 25 million shares at an issue price of RMB23.26 per share. Zhonghe Chunsheng Fund holds 3,175,400 shares in Giga Device, accounting for 3.18% of the total share capital of Giga Device after the issue.
(b) The Bureau of Industry and Security of the Department of Commerce (“BIS”) of the United States of America (“U.S.”) has added the Company, Shenzhen ZTE Kangxun Telecom Company Limited (“ZTE Kangxun”), ZTE Parsian and Beijing 8-Star International Co. to the Entity List on 7 March 2016 (the “Decision”). Pursuant to the Decision, with effect from 8 March 2016, suppliers of items subject to the Export Administration Regulations shall be required to apply for a license for the supplies of such items to the Company and the other three companies, and a license review policy of presumption of denial shall apply. On 24 March 2016, BIS amended the aforesaid Decision by creating a temporary general license with the effect that the export restrictions on the Company and ZTE Kangxun under the Decision would not apply until 30 June 2016. On 28 June 2016, BIS extended the temporary general license to 30 August 2016 (U.S. time). On 19 August 2016, BIS further extended the temporary general license to 28 November 2016 (U.S. time). The Company will continue to maintain cooperation with relevant U.S. government authorities and actively liaise with them to reach a final solution, and will strictly comply with U.S. laws and regulations relating to export restrictions.