37
Figure S1. LP MΦ express CX3CR1 CX3CR1 surface expression in LP MΦ (solid histograms) and DCs (open histograms) in the small (SI) and large (LI) intestine of CX3CR1+/+ mice, assessed by flow cytometry and gated as in Figure 1A. Data are representative of three independent experiments.
38
Figure S2. CX3CR1-/- mice have a specific reduction in LP MΦ A) Percentage of CD45+ MHC-II+ MΦ and DCs in the small (SI) and large (LI) intestine of CX3CR1-/- or CX3CR1+/+ mice. B) Total cellularity of CD45+ MHC-II+ MΦ and DCs in the small (SI) and large (LI) intestine of CX3CR1-/- or CX3CR1+/+ mice. Data are representative of more than three independent experiments. Error bars represent SEM. *, p < 0.05.
39
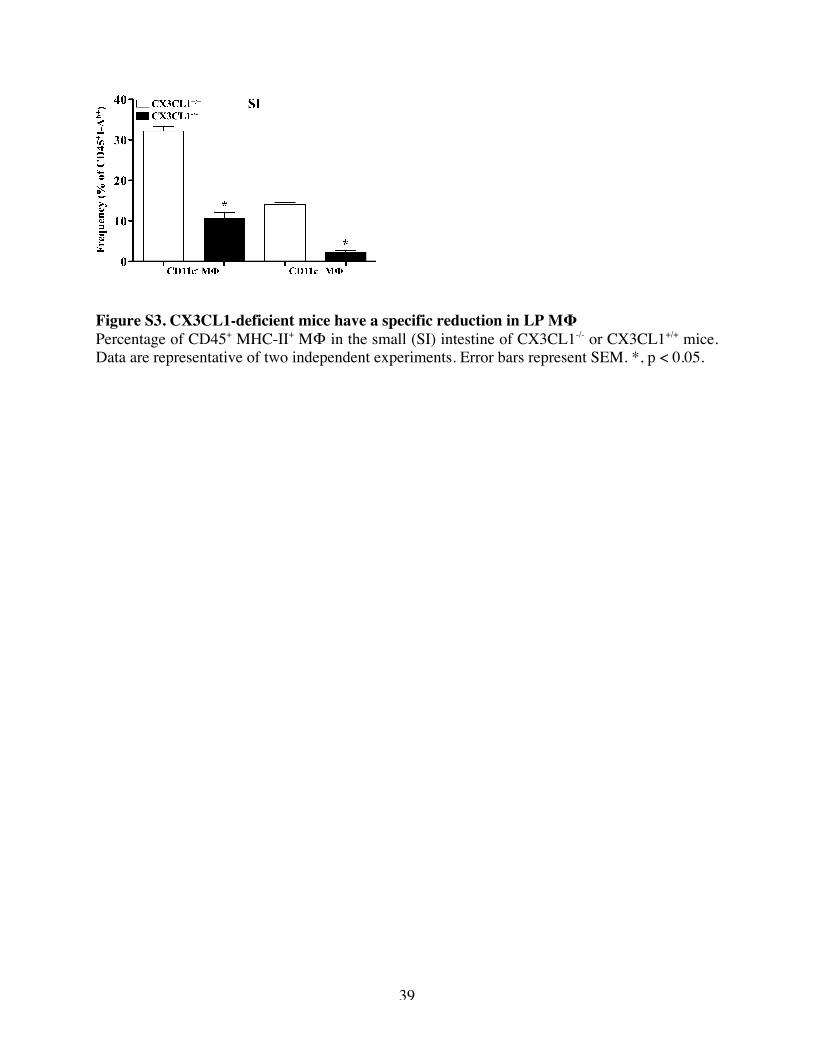
Figure S3. CX3CL1-deficient mice have a specific reduction in LP MΦ Percentage of CD45+ MHC-II+ MΦ in the small (SI) intestine of CX3CL1-/- or CX3CL1+/+ mice. Data are representative of two independent experiments. Error bars represent SEM. *, p < 0.05.
40
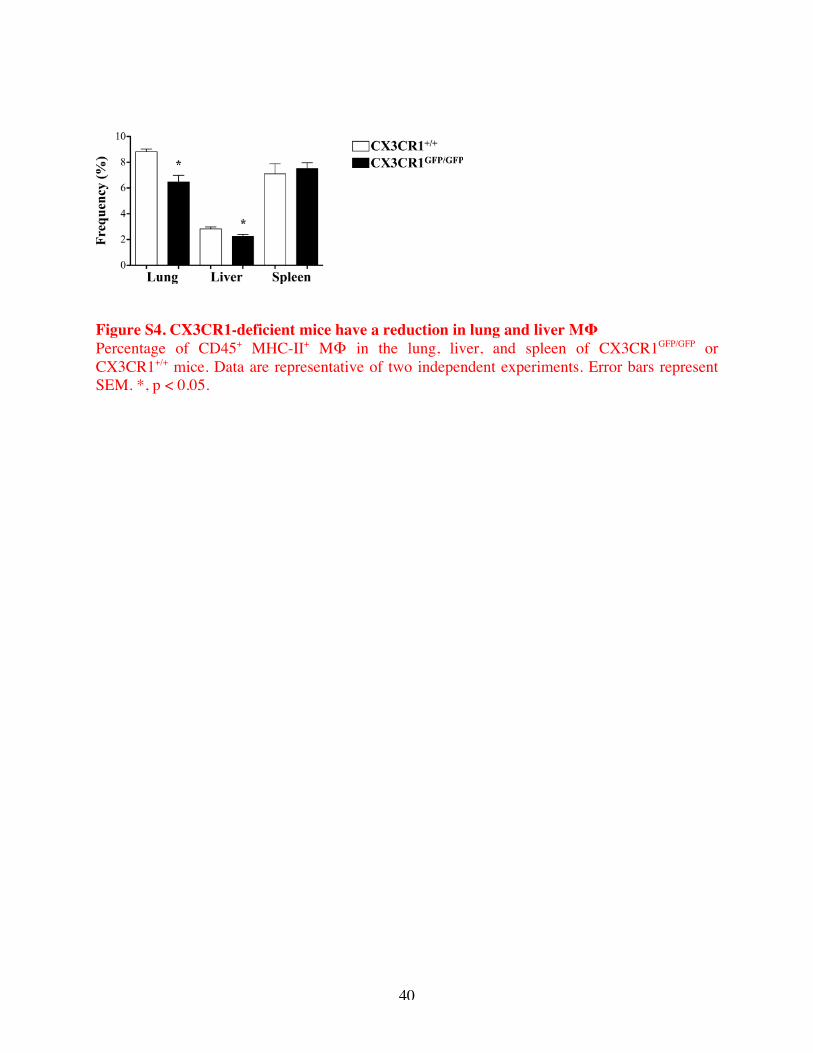
Figure S4. CX3CR1-deficient mice have a reduction in lung and liver MΦ Percentage of CD45+ MHC-II+ MΦ in the lung, liver, and spleen of CX3CR1GFP/GFP or CX3CR1+/+ mice. Data are representative of two independent experiments. Error bars represent SEM. *, p < 0.05.
41
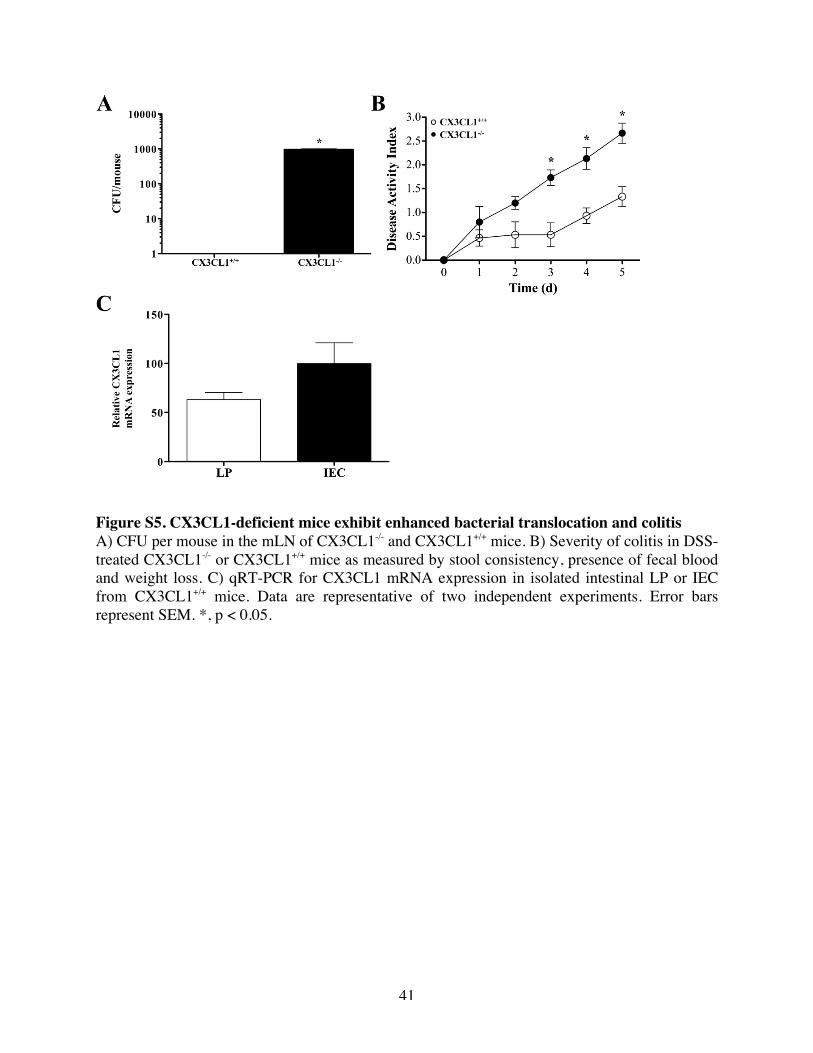
Figure S5. CX3CL1-deficient mice exhibit enhanced bacterial translocation and colitis A) CFU per mouse in the mLN of CX3CL1-/- and CX3CL1+/+ mice. B) Severity of colitis in DSS-treated CX3CL1-/- or CX3CL1+/+ mice as measured by stool consistency, presence of fecal blood and weight loss. C) qRT-PCR for CX3CL1 mRNA expression in isolated intestinal LP or IEC from CX3CL1+/+ mice. Data are representative of two independent experiments. Error bars represent SEM. *, p < 0.05.
42
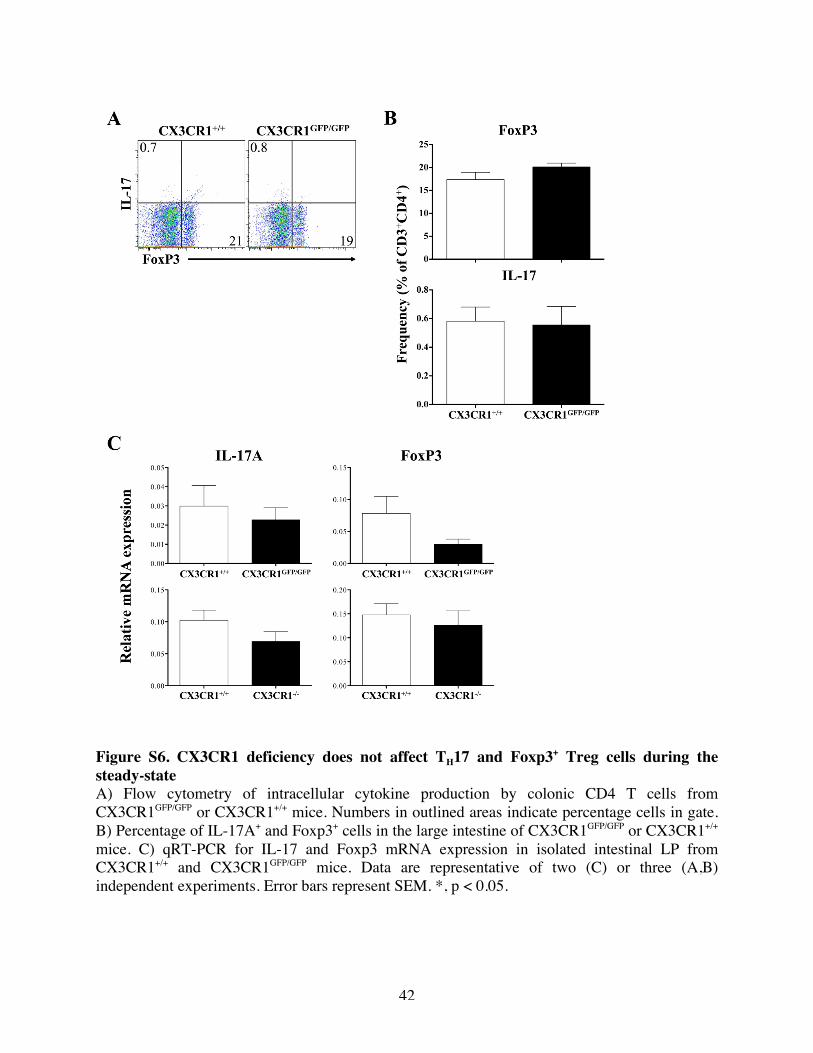
Figure S6. CX3CR1 deficiency does not affect TH17 and Foxp3+ Treg cells during the steady-state A) Flow cytometry of intracellular cytokine production by colonic CD4 T cells from CX3CR1GFP/GFP or CX3CR1+/+ mice. Numbers in outlined areas indicate percentage cells in gate. B) Percentage of IL-17A+ and Foxp3+ cells in the large intestine of CX3CR1GFP/GFP or CX3CR1+/+ mice. C) qRT-PCR for IL-17 and Foxp3 mRNA expression in isolated intestinal LP from CX3CR1+/+ and CX3CR1GFP/GFP mice. Data are representative of two (C) or three (A,B) independent experiments. Error bars represent SEM. *, p < 0.05.
43
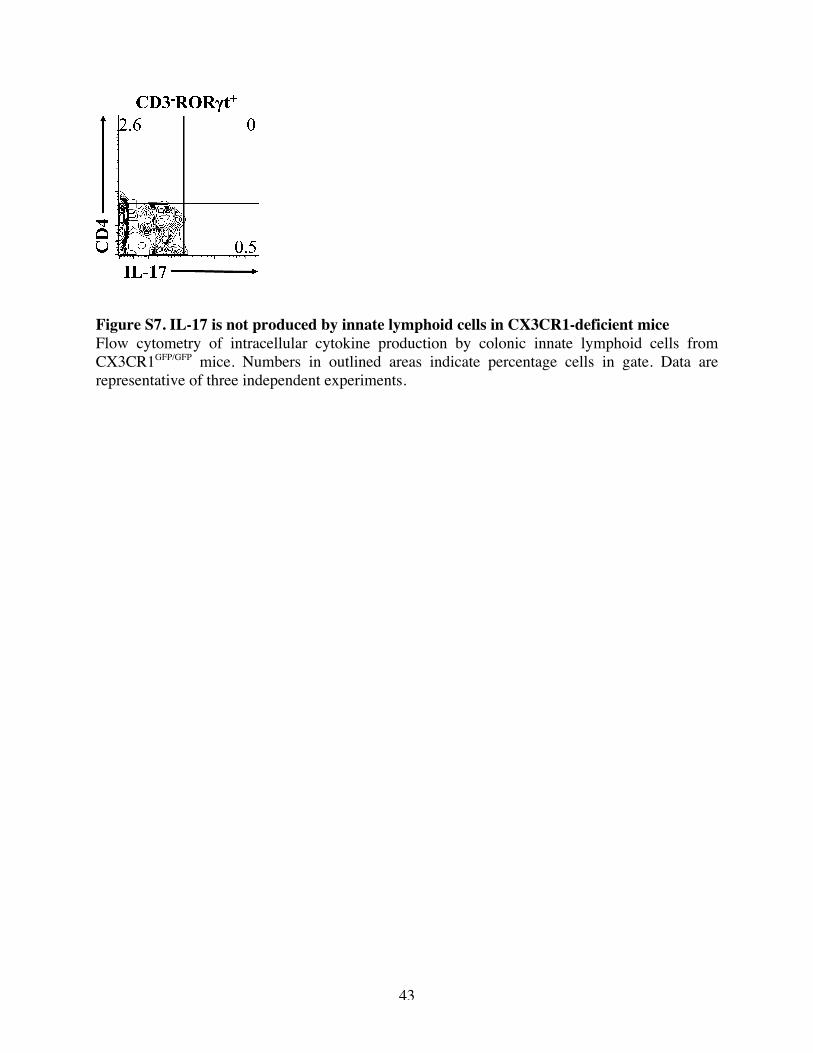
Figure S7. IL-17 is not produced by innate lymphoid cells in CX3CR1-deficient mice Flow cytometry of intracellular cytokine production by colonic innate lymphoid cells from CX3CR1GFP/GFP mice. Numbers in outlined areas indicate percentage cells in gate. Data are representative of three independent experiments.
44
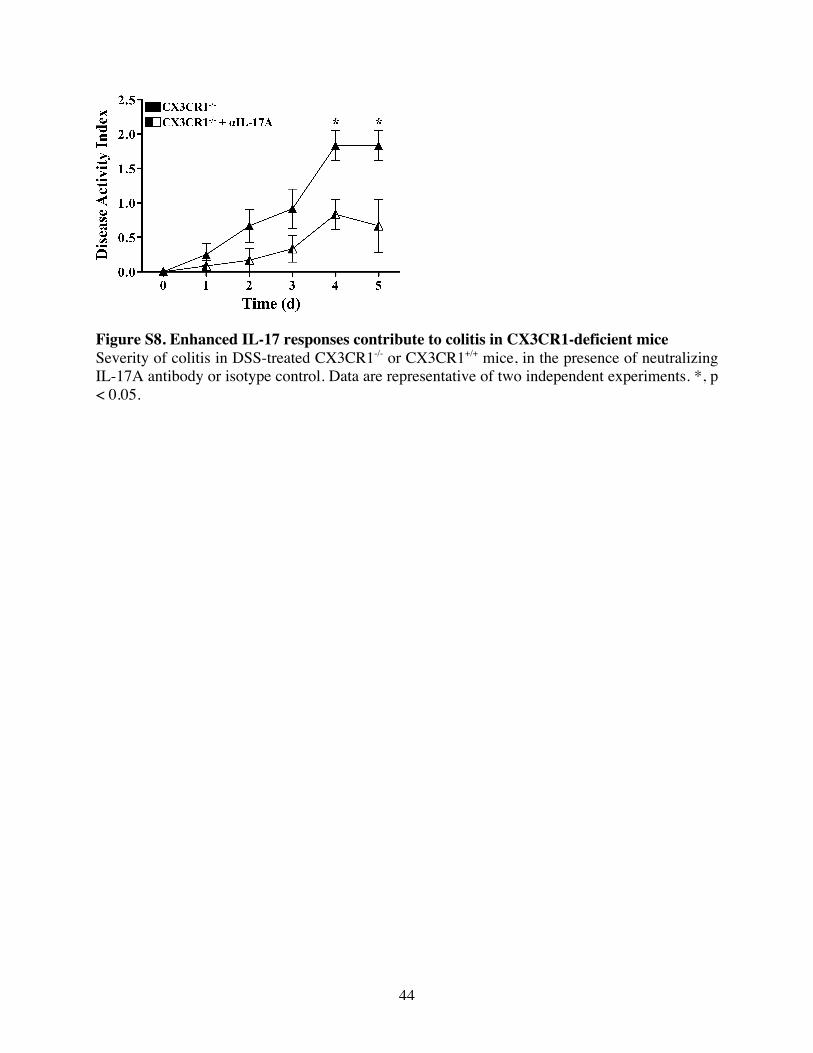
Figure S8. Enhanced IL-17 responses contribute to colitis in CX3CR1-deficient mice Severity of colitis in DSS-treated CX3CR1-/- or CX3CR1+/+ mice, in the presence of neutralizing IL-17A antibody or isotype control. Data are representative of two independent experiments. *, p < 0.05.
45
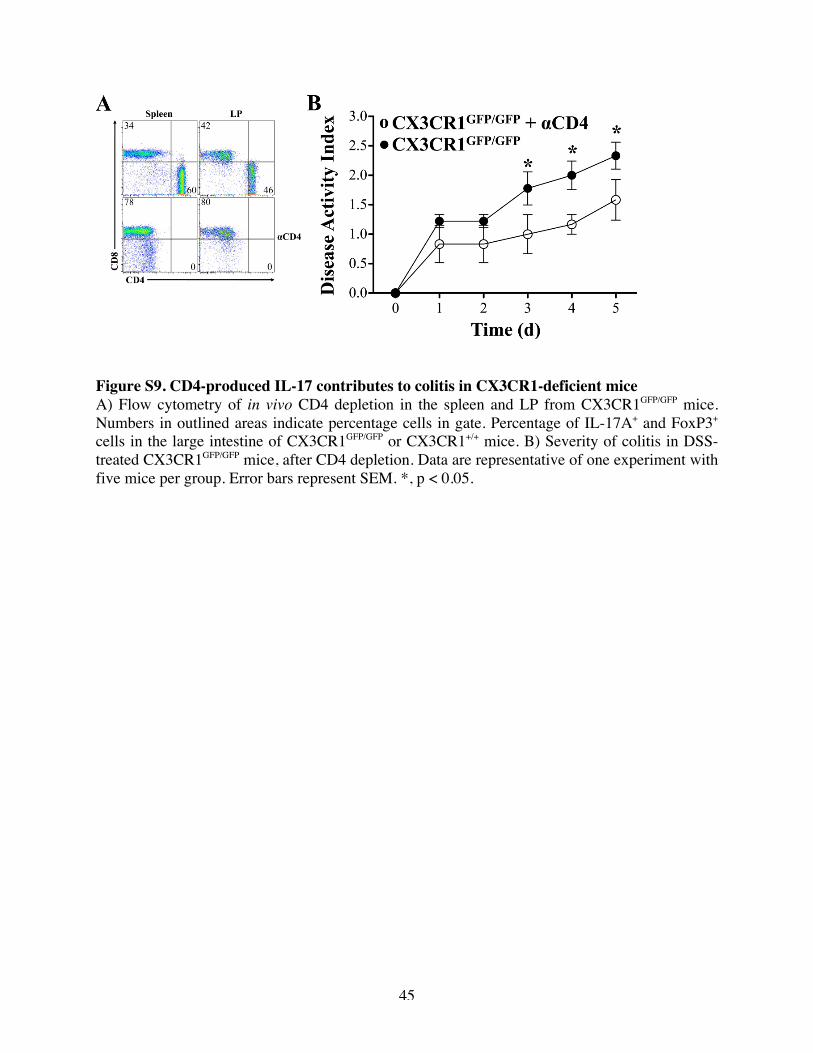
Figure S9. CD4-produced IL-17 contributes to colitis in CX3CR1-deficient mice A) Flow cytometry of in vivo CD4 depletion in the spleen and LP from CX3CR1GFP/GFP mice. Numbers in outlined areas indicate percentage cells in gate. Percentage of IL-17A+ and FoxP3+ cells in the large intestine of CX3CR1GFP/GFP or CX3CR1+/+ mice. B) Severity of colitis in DSS-treated CX3CR1GFP/GFP mice, after CD4 depletion. Data are representative of one experiment with five mice per group. Error bars represent SEM. *, p < 0.05.
46
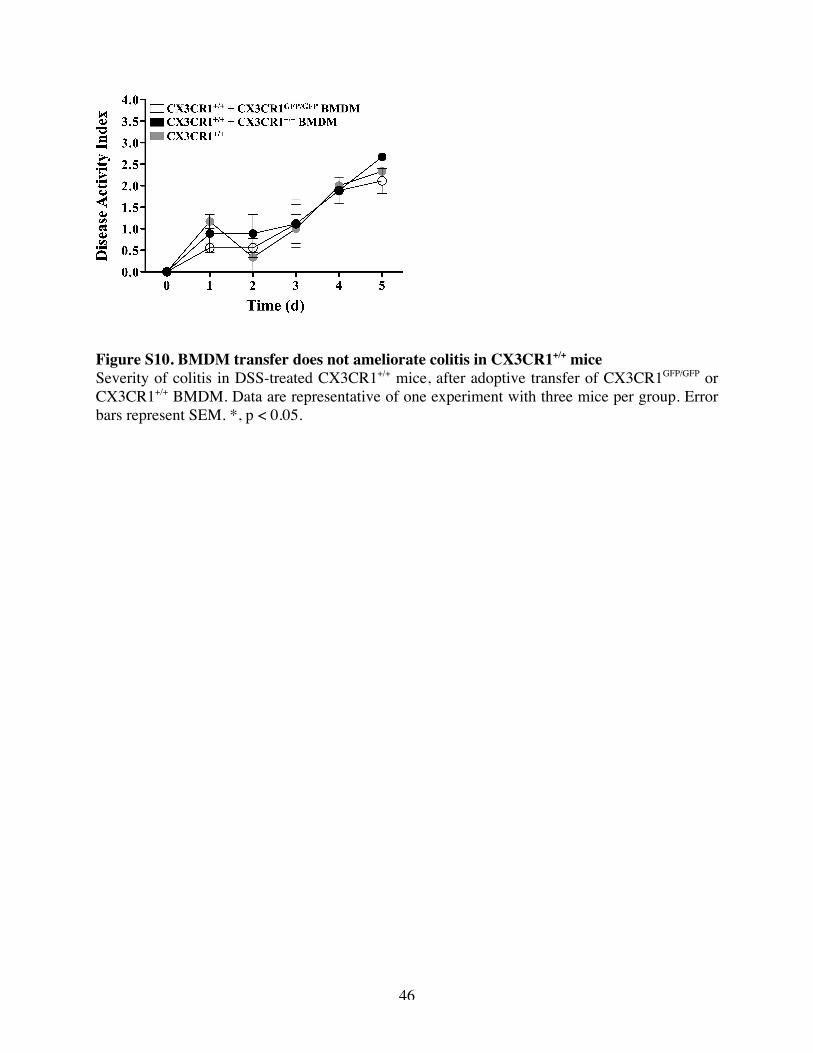
Figure S10. BMDM transfer does not ameliorate colitis in CX3CR1+/+ mice Severity of colitis in DSS-treated CX3CR1+/+ mice, after adoptive transfer of CX3CR1GFP/GFP or CX3CR1+/+ BMDM. Data are representative of one experiment with three mice per group. Error bars represent SEM. *, p < 0.05.
47
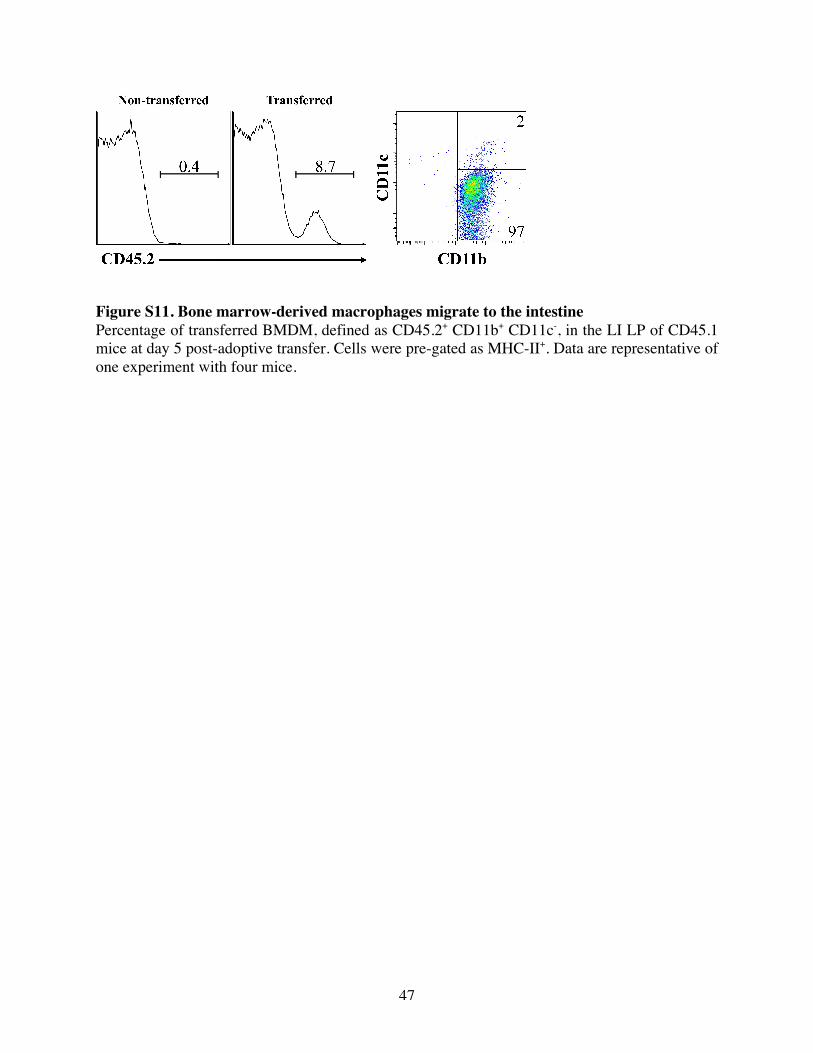
Figure S11. Bone marrow-derived macrophages migrate to the intestine Percentage of transferred BMDM, defined as CD45.2+ CD11b+ CD11c-, in the LI LP of CD45.1 mice at day 5 post-adoptive transfer. Cells were pre-gated as MHC-II+. Data are representative of one experiment with four mice.
Recommended