
11
FEDERAL UNIVERSITY OF PERNAMBUCO – UFPE FEDERAL UNIVERSITY OF PERNAMBUCO – UFPE COMPANHIA HIDRO ELÉTRICA DO SÃO FRANCISCO – COMPANHIA HIDRO ELÉTRICA DO SÃO FRANCISCO –
CHESFCHESF
““A A COMPARATIVE STUDY OF THE COMPARATIVE STUDY OF THE EFFICIENCY OF THE BRAZILIAN EFFICIENCY OF THE BRAZILIAN
HYDROELECTRIC POWER PLANTS HYDROELECTRIC POWER PLANTS USING DATA ENVELOPMENT USING DATA ENVELOPMENT
ANALYSIS – DEA”ANALYSIS – DEA”
PRESENTER: MSc. EDUARDO ARRUDA PRESENTER: MSc. EDUARDO ARRUDA CÂMARACÂMARA
Co-authorCo-author: Prof. Dr. Francisco de : Prof. Dr. Francisco de Sousa RamosSousa Ramos
22
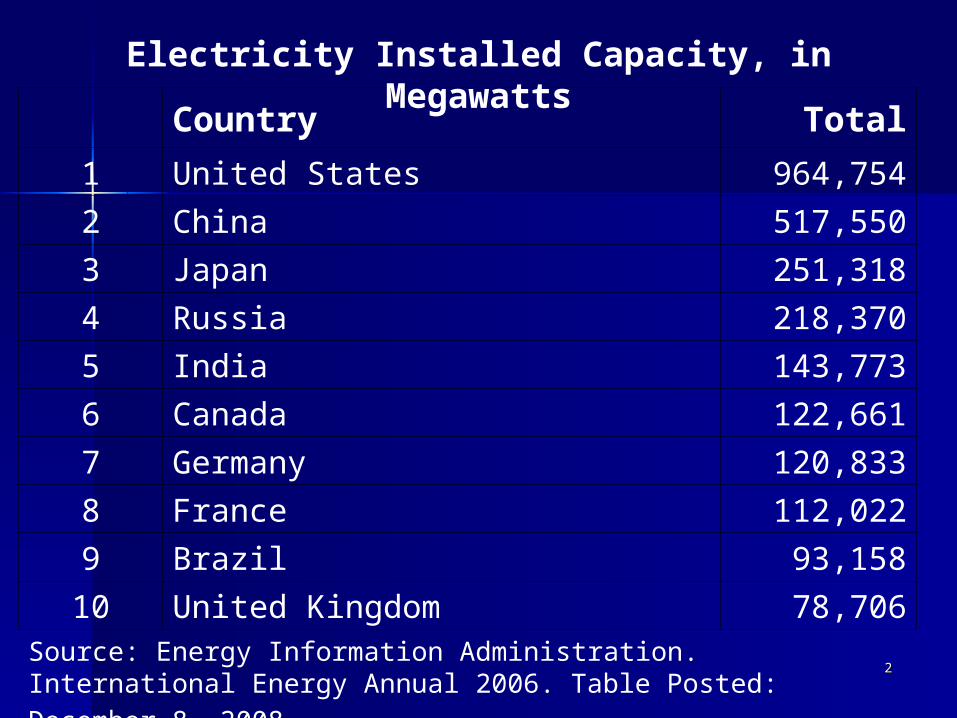
Country Total1 United States 964,754
2 China 517,550
3 Japan 251,318
4 Russia 218,370
5 India 143,773
6 Canada 122,661
7 Germany 120,833
8 France 112,022
9 Brazil 93,158
10 United Kingdom 78,706Source: Energy Information Administration. International Energy Annual 2006. Table Posted: December 8, 2008.
Electricity Installed Capacity, in Megawatts
33
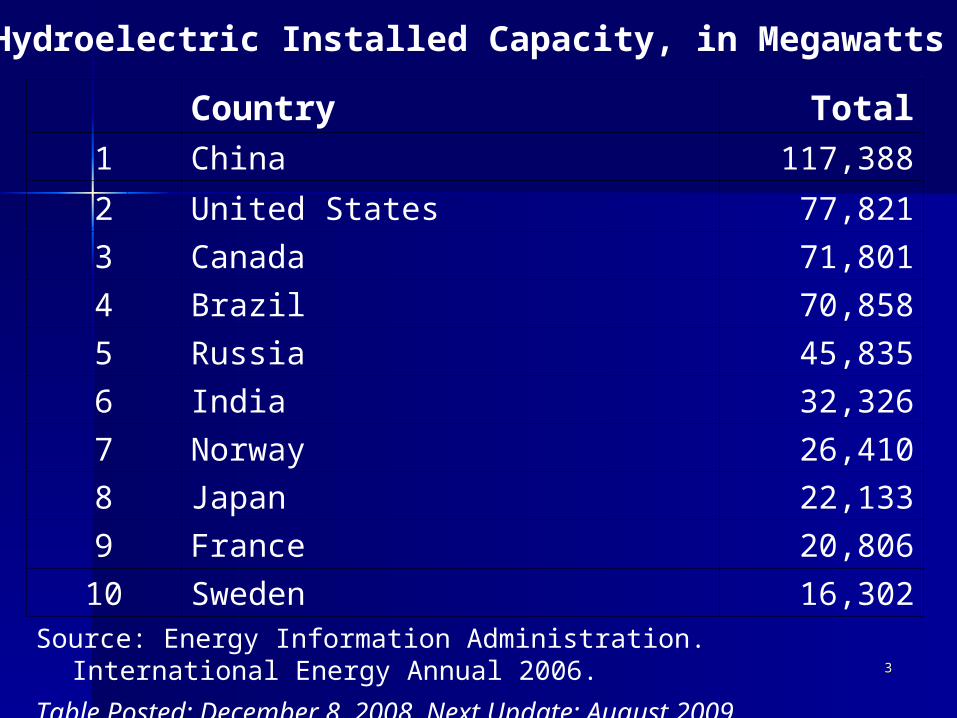
Country Total1 China 117,388
2 United States 77,821
3 Canada 71,801
4 Brazil 70,858
5 Russia 45,835
6 India 32,326
7 Norway 26,410
8 Japan 22,133
9 France 20,806
10 Sweden 16,302Source: Energy Information Administration. International
Energy Annual 2006.
Table Posted: December 8, 2008. Next Update: August 2009
Hydroelectric Installed Capacity, in Megawatts

44
USA’s Electricity Installed USA’s Electricity Installed Capacity by Type, January 1, 2006 Capacity by Type, January 1, 2006
(Megawatts)(Megawatts)
77,821
100,33424,996
761,603
ConventionalThermal
Hydroelectric
Nuclear
Geothermal, Solar,Wind,and Woodand Waste
55
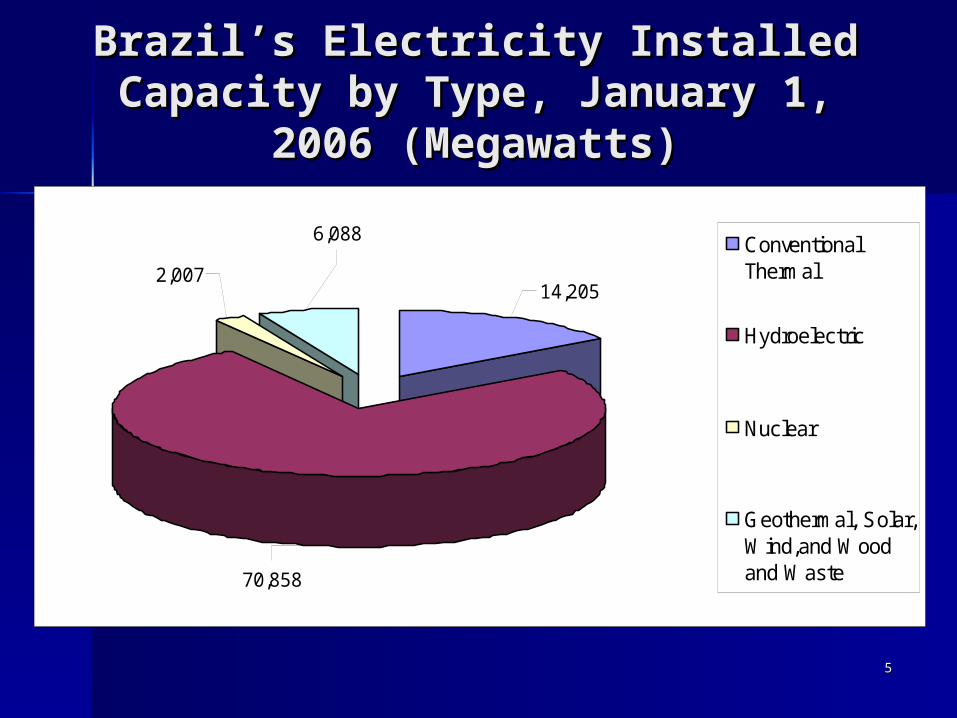
Brazil’s Electricity Installed Brazil’s Electricity Installed Capacity by Type, January 1, 2006 Capacity by Type, January 1, 2006
(Megawatts)(Megawatts)
14,205
6,088
2,007
70,858
ConventionalThermal
Hydroelectric
Nuclear
Geothermal, Solar,Wind,and Woodand Waste
66
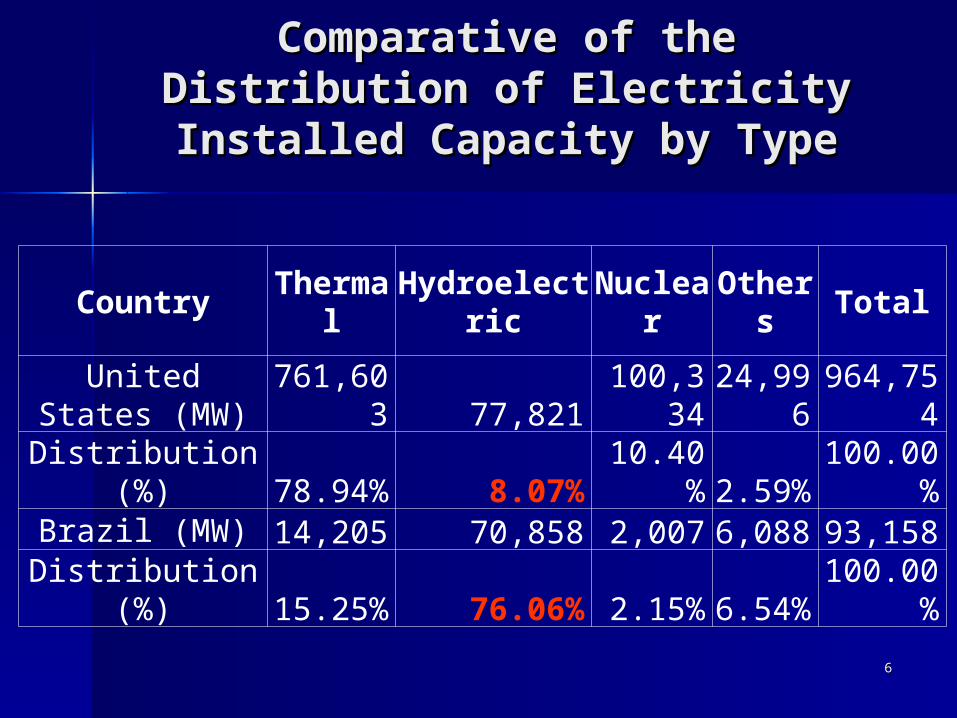
Comparative of the Distribution Comparative of the Distribution of of Electricity Installed Capacity Electricity Installed Capacity
by Typeby Type
CountryTherm
alHydroelect
ricNucle
arOther
sTotal
United States (MW)
761,603 77,821
100,334
24,996
964,754
Distribution (%)
78.94% 8.07%
10.40%
2.59%
100.00%
Brazil (MW) 14,205 70,858 2,007 6,088 93,158Distribution
(%)15.25
% 76.06% 2.15%6.54
%100.00
%

77
GENERAL OBJECTGENERAL OBJECT
This study will identify and compare This study will identify and compare the efficiency of 87 Brazilian the efficiency of 87 Brazilian hydroelectric generating plants with hydroelectric generating plants with installed capacity above 50 MW, installed capacity above 50 MW, based on the inputs and output used based on the inputs and output used as variables of the analysis.as variables of the analysis.

88
METHODOLOGYMETHODOLOGY
For the data analysis, the DEA methodology was used, under the input orientation, in the traditional models that allow constant returns of scale (CRS), also known as CCR model, and variable returns of scale (VRS) or BCC model.
99
DATA ENTRYDATA ENTRY→ → SampleSample
Due to the availability of data, related to the variables used in the study, 87 Brazilian hydroelectric generating units, from 29 different companies were chosen for analysis.

1010
In the selection of variables were used and combined three criteria: the availability of data; the research of related literature and the professional opinion of relevant individuals, concerned with the issue that the research is proposed.
DATA ENTRYDATA ENTRY→→ Output and Inputs
1111
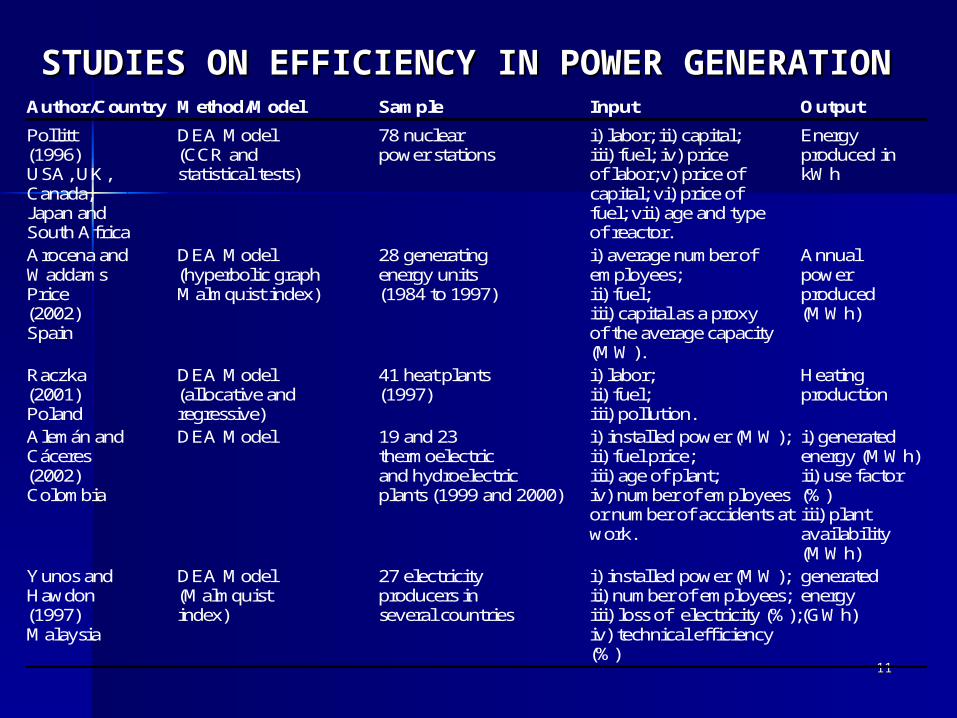
STUDIES ON EFFICIENCY IN POWER STUDIES ON EFFICIENCY IN POWER
GENERATIONGENERATION Author/Country Method/Model Sample Input Output
Pollitt DEA Model 78 nuclear i) labor; ii) capital; Energy (1996) (CCR and power stations iii) fuel; iv) price produced in USA, UK, statistical tests) of labor; v) price of kWh Canada, capital; vi) price of Japan and fuel; vii) age and type South Africa of reactor. Arocena and DEA Model 28 generating i) average number of Annual Waddams (hyperbolic graph energy units employees; power Price Malmquist index) (1984 to 1997) ii) fuel; produced (2002) iii) capital as a proxy (MWh) Spain of the average capacity (MW). Raczka DEA Model 41 heat plants i) labor; Heating (2001) (allocative and (1997) ii) fuel; production Poland regressive) iii) pollution. Alemán and DEA Model 19 and 23 i) installed power (MW); i) generated Cáceres thermoelectric ii) fuel price; energy (MWh) (2002) and hydroelectric iii) age of plant; ii) use factor Colombia plants (1999 and 2000) iv) number of employees (%) or number of accidents at iii) plant work. availability (MWh) Yunos and DEA Model 27 electricity i) installed power (MW); generated Hawdon (Malmquist producers in ii) number of employees; energy (1997) index) several countries iii) loss of electricity (%); (GWh) Malaysia iv) technical efficiency (%)
1212
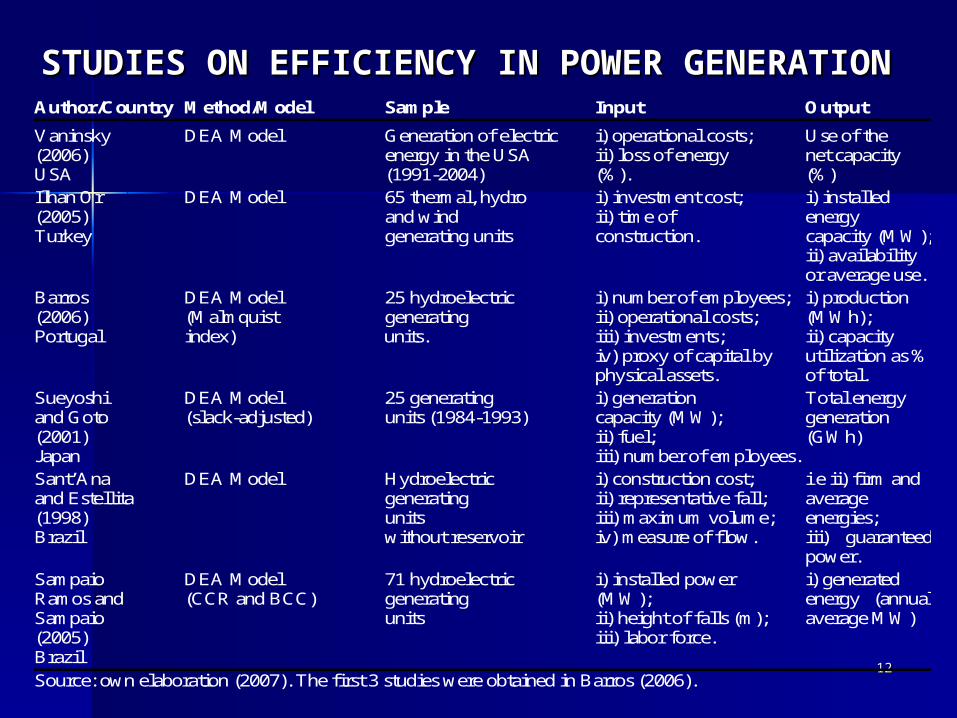
STUDIES ON EFFICIENCY IN POWER STUDIES ON EFFICIENCY IN POWER
GENERATIONGENERATION Author/Country Method/Model Sample Input Output
Vaninsky DEA Model Generation of electric i) operational costs; Use of the (2006) energy in the USA ii) loss of energy net capacity USA (1991-2004) (%). (%) Ilhan Or DEA Model 65 thermal, hydro i) investment cost; i) installed (2005) and wind ii) time of energy Turkey generating units construction. capacity (MW); ii) availability or average use. Barros DEA Model 25 hydroelectric i) number of employees; i) production (2006) (Malmquist generating ii) operational costs; (MWh); Portugal index) units. iii) investments; ii) capacity iv) proxy of capital by utilization as % physical assets. of total. Sueyoshi DEA Model 25 generating i) generation Total energy and Goto (slack-adjusted) units (1984-1993) capacity (MW); generation (2001) ii) fuel; (GWh) Japan iii) number of employees. Sant’Ana DEA Model Hydroelectric i) construction cost; i e ii) firm and and Estellita generating ii) representative fall; average (1998) units iii) maximum volume; energies; Brazil without reservoir iv) measure of flow. iii) guaranteed power. Sampaio DEA Model 71 hydroelectric i) installed power i) generated Ramos and (CCR and BCC) generating (MW); energy (annual Sampaio units ii) height of falls (m); average MW) (2005) iii) labor force. Brazil
Source: own elaboration (2007). The first 3 studies were obtained in Barros (2006).
1313
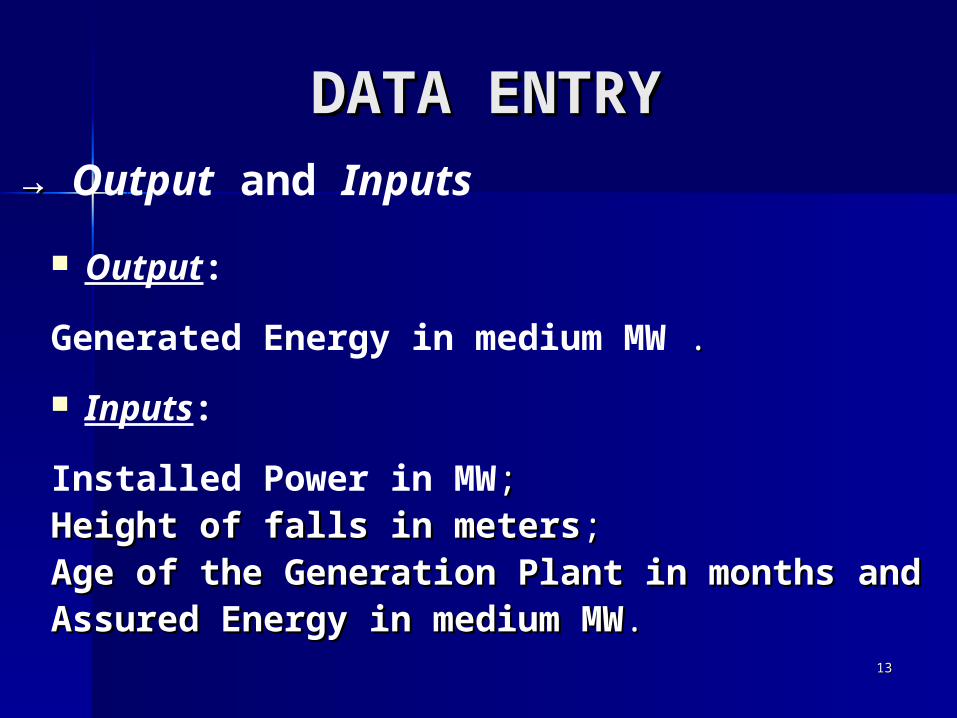
DATA ENTRYDATA ENTRY→→ Output and Inputs
Output:
Generated Energy in medium MW . .
Inputs:
Installed Power in MW;;Height of falls in metersHeight of falls in meters;;Age of the Generation Plant in monthsAge of the Generation Plant in months andandAssured Energy in medium MWAssured Energy in medium MW..

1414
OBSERVED RESULTSOBSERVED RESULTS
The indices of efficiency of the 87 HPPs in question were obtained using the EMS program, version 1.3.0, Scheel (2000), which employs the DEA methodology and its traditional DEA-CCR and DEA-BCC models.

1515
OBSERVED RESULTSOBSERVED RESULTSNumber of efficient HPPs with 5 variables selected (1 OUTPUT e 4 INPUTS) in both models:
DEA-CCR: 8 efficient HPPs (100%);DEA-BCC: 27 efficient HPPs (100%).
From the results obtained it is possible to observe that all 8 HPPs considered efficient by the DEA-CCR model were also efficient in the DEA-BCC model.
1616
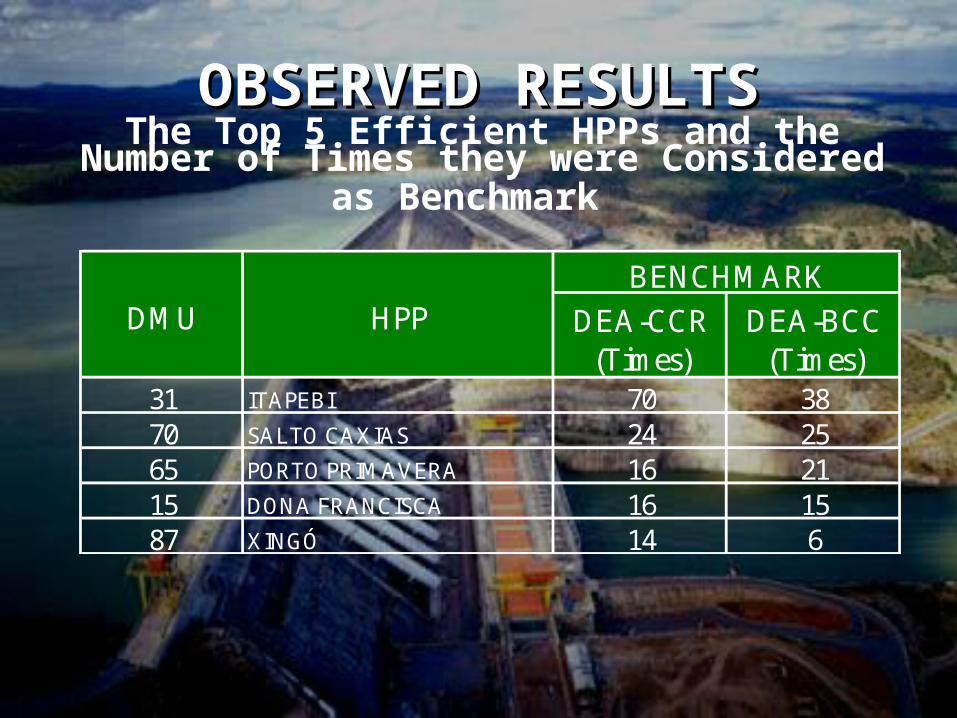
OBSERVED RESULTSOBSERVED RESULTSThe Top 5 Efficient HPPs and the
Number of Times they were Considered as Benchmark
DEA-CCR (Times)
DEA-BCC (Times)
31 ITAPEBI 70 3870 SALTO CAXIAS 24 2565 PORTO PRIMAVERA 16 2115 DONA FRANCISCA 16 1587 XINGÓ 14 6
DMU HPPBENCHMARK
1717
OBSERVED RESULTSOBSERVED RESULTS
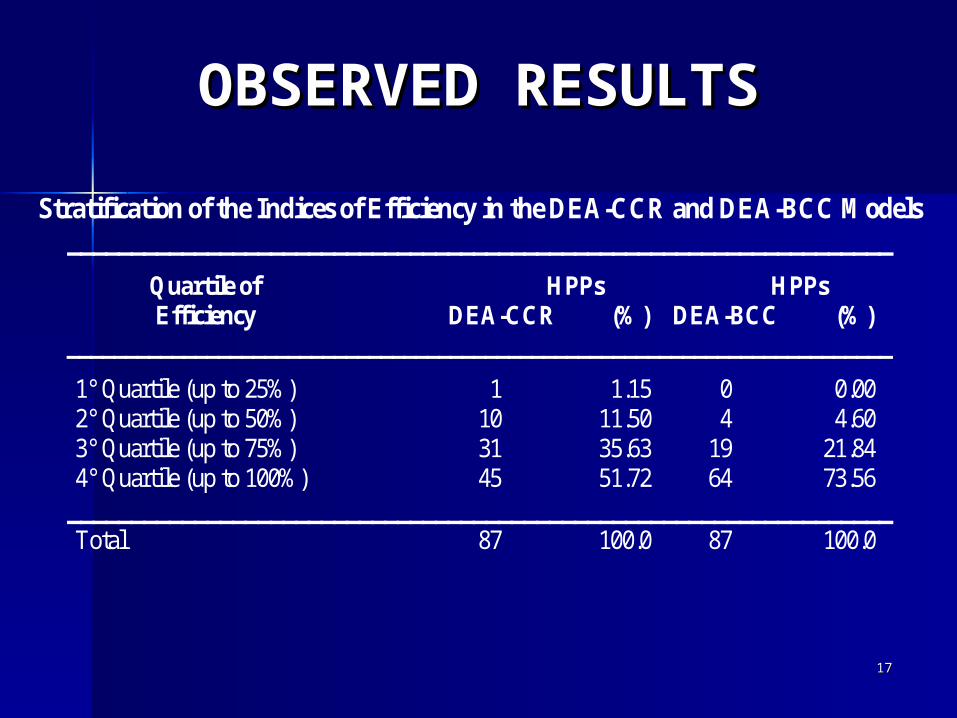
Stratification of the Indices of Efficiency in the DEA-CCR and DEA-BCC Models _________________________________________________________________
Quartile of HPPs HPPs Efficiency DEA-CCR (%) DEA-BCC (%)
_______________________________________________________________________
1° Quartile (up to 25%) 1 1.15 0 0.00 2° Quartile (up to 50%) 10 11.50 4 4.60 3° Quartile (up to 75%) 31 35.63 19 21.84 4° Quartile (up to 100%) 45 51.72 64 73.56
_________________________________________________________________ Total 87 100.0 87 100.0
1818
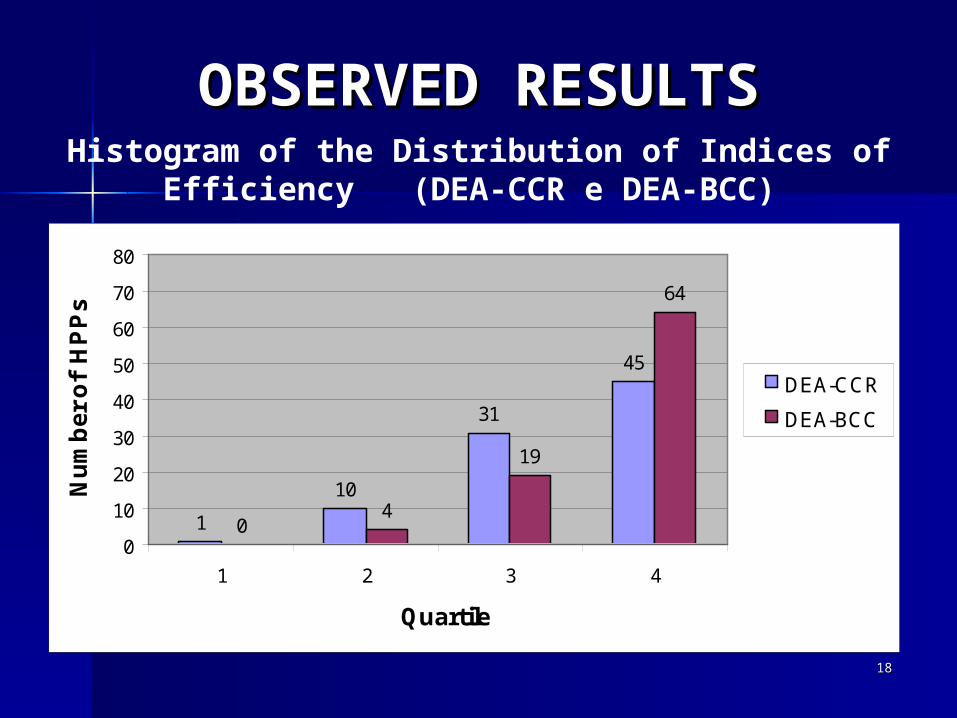
Histogram of the Distribution of Indices of Efficiency (DEA-CCR e DEA-BCC)
OBSERVED RESULTSOBSERVED RESULTS
1
10
45
04
64
31
19
0
10
20
30
40
50
60
70
80
1 2 3 4
Quartile
Nu
mb
er
of
HP
Ps
DEA-CCR
DEA-BCC

1919
OBSERVED RESULTSOBSERVED RESULTS
Statistical Summary of Indices of Efficiency in the DEA-CCR and DEA-BCC Models
Measures DEA-CCR DEA-BCC
Average 0.7398 0.8486 Minimum 0.2159 0.2699 Maximum 1.0000 1.0000 Standard Deviation 0.1816 0.1681
2020
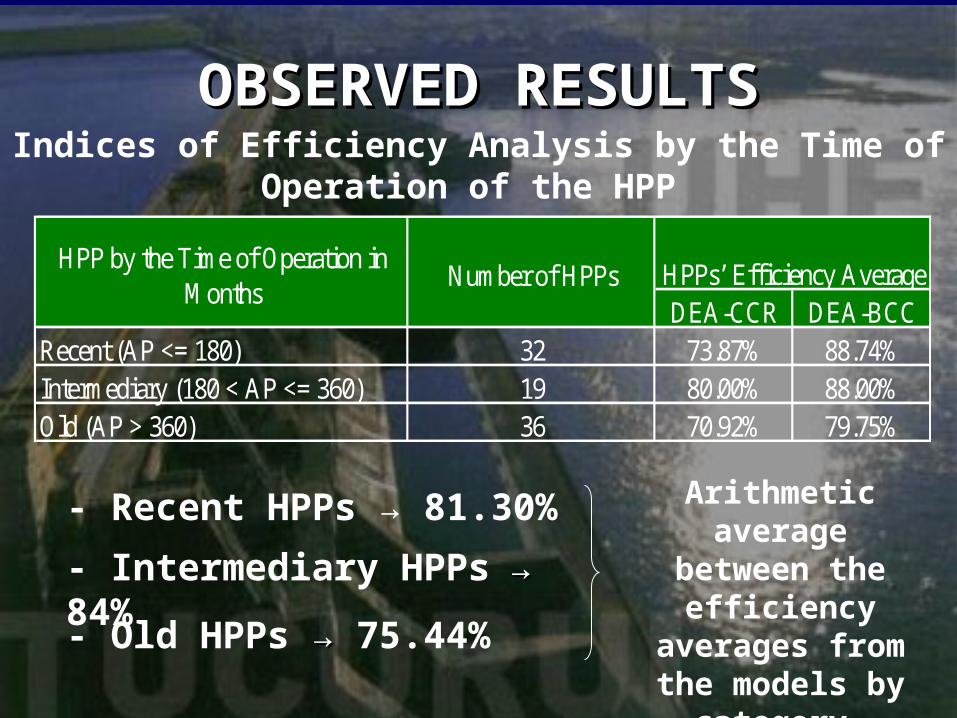
Indices of Efficiency Analysis by the Time of Operation of the HPP
- Old HPPs →→ 75.44%
Arithmetic average
between the efficiency
averages from the models by
category.
- Intermediary HPPs →→ 84%
- Recent HPPs → 81.30%
OBSERVED RESULTSOBSERVED RESULTS
DEA-CCR DEA-BCCRecent (AP <= 180) 32 73.87% 88.74%Intermediary (180 < AP <= 360) 19 80.00% 88.00%Old (AP > 360) 36 70.92% 79.75%
HPP by the Time of Operation in Months
Number of HPPs HPPs’ Efficiency Average

2121
Indices of Efficiency for Installed Power Analysis
- Small HPPs →→ 77.46%
- Medium HPPs →→ 74.71%
Arithmetic average between
the efficiency averages from the models by
category.
- Large HPPs → 87.76%
OBSERVED RESULTSOBSERVED RESULTS
DEA-CCR DEA-BCCSmall (IP <= 300 MW) 40 68.66% 86.26%Medium (300 MW < IP <= 1000 MW) 24 71.22% 78.20%Large (IP > 1000 MW) 23 86.14% 89.37%
HPP by Installed Power in MW Number of HPPs HPPs’ Efficiency Average
2222
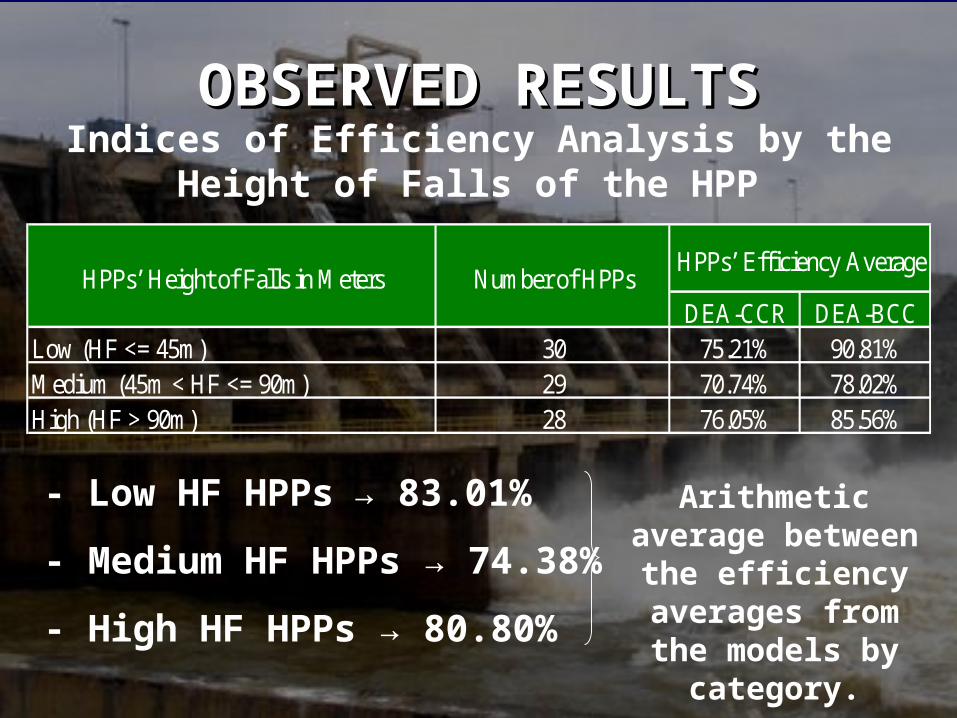
Indices of Efficiency Analysis by the Height of Falls of the HPP
- Medium HF HPPs → 74.38%
- High HF HPPs → 80.80%
Arithmetic average between
the efficiency averages from the models by
category.
- Low HF HPPs →→ 83.01%
OBSERVED RESULTSOBSERVED RESULTS
DEA-CCR DEA-BCCLow (HF <= 45m) 30 75.21% 90.81%Medium (45m < HF <= 90m) 29 70.74% 78.02%High (HF > 90m) 28 76.05% 85.56%
HPPs’ Height of Falls in Meters Number of HPPsHPPs’ Efficiency Average
2323
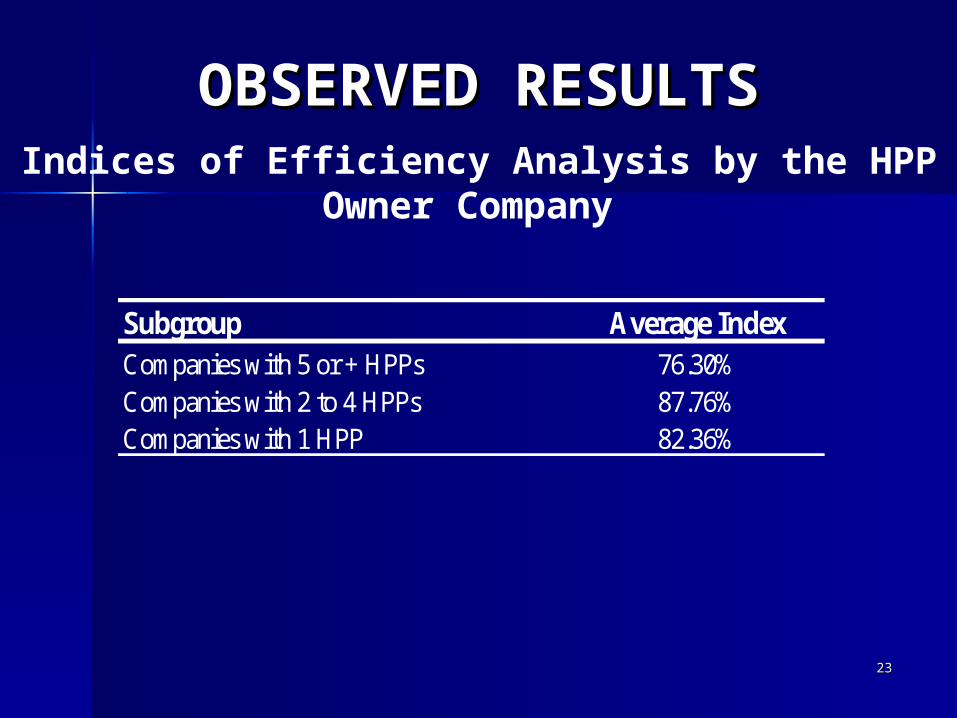
Indices of Efficiency Analysis by the HPP Owner Company
OBSERVED RESULTSOBSERVED RESULTS
Subgroup Average IndexCompanies with 5 or + HPPs 76.30%Companies with 2 to 4 HPPs 87.76%Companies with 1 HPP 82.36%
2424
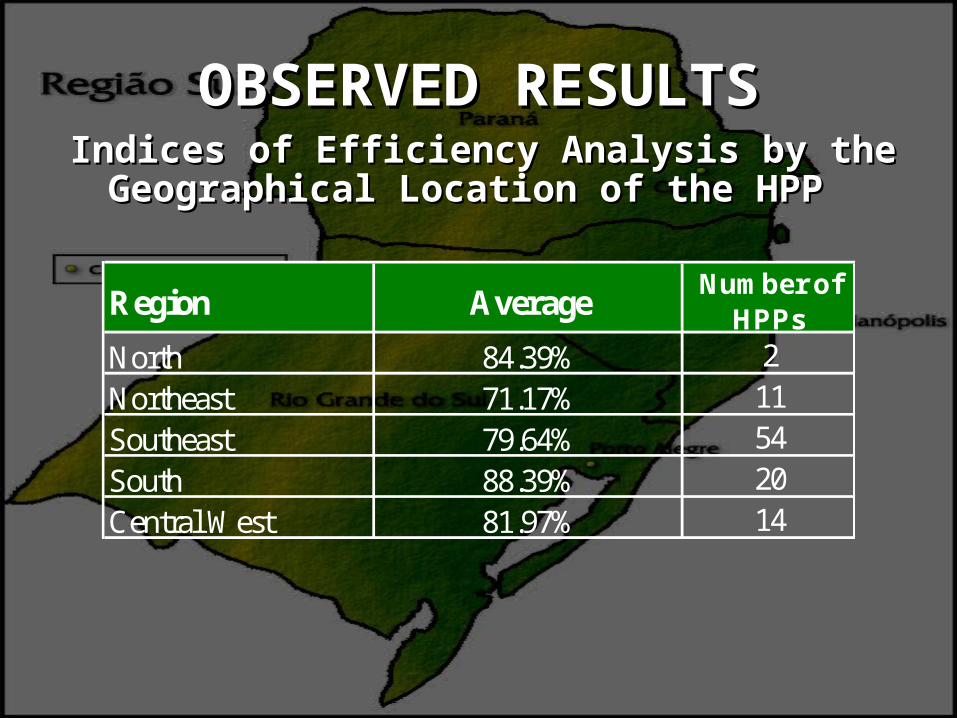
Indices of Efficiency Analysis by the Indices of Efficiency Analysis by the Geographical Location of the HPPGeographical Location of the HPP
OBSERVED RESULTSOBSERVED RESULTS
Region AverageNumber of
HPPsNorth 84.39% 2
Northeast 71.17% 11
Southeast 79.64% 54
South 88.39% 20
Central West 81.97% 14
2525
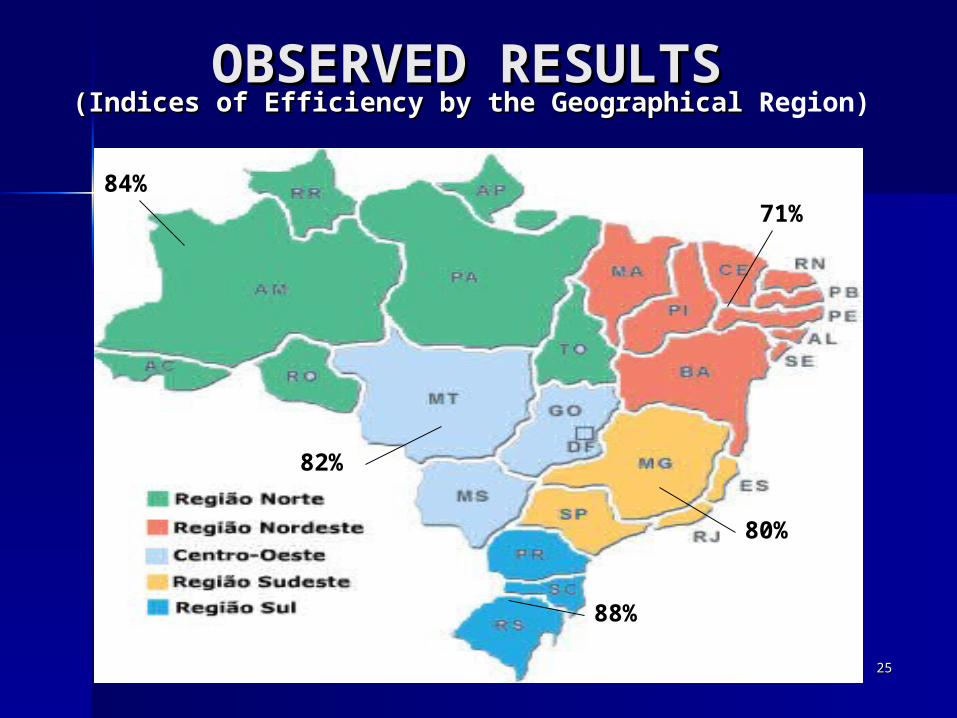
OBSERVED RESULTSOBSERVED RESULTS
88%
84%71%
80%
82%
((Indices of Efficiency by the Geographical Indices of Efficiency by the Geographical Region)
2626
CONCLUSIONCONCLUSION
- The DEA-CCR model, which admits constant returns of scale, is more restrictive in the efficiency of the units than the DEA-BCC model;
- The efficient units in the DEA-CCR model will also be efficient in the DEA-BCC model;
- The efficiency indices obtained for the units in the DEA-CCR model will always be equal to or lower than the indices for the DEA-BCC model.
2727
CONCLUSIONCONCLUSION
- This study suffers a great influence of the 87 HPPs included in the sample, of the variables used as inputs and output and of the scope period covered.
- And yet, as a suggestion to carry out further work would be to measure the efficiency of national HPPs that were privatized, showing the situation of them before and after privatization.
e-mail: [email protected]: 55-81-3229.3477/9234.9398
Recommended


![Technical and Economic Analysis of a Hydroelectric Plant new wind parks. [2] ... About 3 064 MW from the 4 117 MW to be installed in the new hydroelectric plants will be installed](https://img.pdfslide.tips/doc/110x75/5ad5553d7f8b9a571e8d62ae/technical-and-economic-analysis-of-a-hydroelectric-plant-new-wind-parks-2-.jpg)


![Las Vacas Hydroelectric PDD[1]](https://img.pdfslide.tips/doc/110x75/577d26971a28ab4e1ea1a2e1/las-vacas-hydroelectric-pdd1.jpg)