1
Corrosion behaviour of AZ31magnesium alloy with different grain sizes in
simulated biological fluids
M. Alvarez-Lopez1, M. D. Pereda2,3, J.A. del Valle1, M. Fernandez-Lorenzo2,3 ,
M.C. Garcia-Alonso1, O.A. Ruano1, M.L. Escudero1*
1 Centro Nacional de Investigaciones Metalúrgicas, CENIM. Consejo Superior de
Investigaciones Científicas, CSIC, Avda. Gregorio del Amo 8, 28040 Madrid, España
Tf: 0034 91 5538900 ext 247 Fax: 0034 91 5347425
*Corresponding autor: e-mail:[email protected] (ML Escudero)
2 Instituto de Investigaciones Fisicoquímicas Teóricas y Aplicadas (INIFTA), Facultad
de Ciencias Exactas, Universidad Nacional de La Plata – CONICET, Casilla de Correo
16, Sucursal 4, (1900) La Plata, Argentina
3 Facultad de Ingeniería, Calle 1 esq. 47, Universidad Nacional de La Plata, (1900) La
Plata, Argentina
Abstract
The comparative study of the corrosion behaviour of the AZ31 magnesium alloy with
different grain sizes immersed in simulated body fluids was made in chloride solutions
(8g/L) and Phosphate Buffer-containing Solution (PBS). The influence of the
immersion time was also analysed. Electrochemical techniques such as the open circuit
potential, polarization curves, current transients and electrochemical impedance
spectroscopy, complemented with scanning electron microscopy and energy dispersive
spectroscopy were used. Immediately after the immersion in the corrosive media the
corrosion resistance was similar for both grain sizes of the AZ31 alloy and higher in
2
NaCl solutions than in PBS. However, this corrosion behaviour was reversed after
longer periods of immersion due to the stabilizing of the corrosion products of MgO
and/or Mg(OH)2 with P-containing compounds. These P-compounds contribute to a
higher level of protection by hindering the aggressive action of chloride ions. The best
corrosion behaviour of the AZ31 alloy was obtained for the finest grain alloy associated
with the highest transfer resistance value, after long periods of immersion in PBS.
Keywords: AZ31 Mg alloy; Grain size; Biomaterial; Corrosion; Electrochemical
techniques; Aggressive ions
1. Introduction
Magnesium is present in high concentration in sea water and is the eighth most
abundant element on Earth. It has also excellent specific strength and a low density,
only 2/3 that of aluminium, so Mg and its alloys can be used in many applications
including computer parts, mobile phones, aerospace components, handheld tools and so
on [1-2]. Magnesium alloys are also potentially useful for bone implants and stent
applications due to their low density, inherent biocompatibility and adequate
mechanical properties including a fracture toughness higher than that of ceramics [3-6].
Additionally, its elastic modulus (40-45 GPa) is closer to that of human bones (10-40
GPa) than other commonly used implant materials. As a result, the stress-shielding
phenomena caused by current metallic implants made of stainless steel or titanium alloy
can be minimized [7].
Another advantage of magnesium in relation to other metallic implants is the
degradability of magnesium alloys which offers the possibility of better physiological
3
repair and better reconstruction of vascular compliance with minimum inflammatory
response. It has been shown that magnesium apatite precipitates on the surface of the
modified pure Mg [8,9] and osteoblasts respond by degrading magnesium alloys in the
guinea pig femur [10]. Magnesium alloys have also shown osteoconductive and
osteoinductive properties, thus offering a less invasive repair and temporary support
during tissue recovery. The alloys are gradually dissolved or absorbed by the body. In
this regard, they are superior to permanent implants, which may cause mismatches in
behaviour between the implant and the body as well as physical irritation and chronic
inflammatory reactions. As degradable materials, they will not remain as permanent
implants in the body nor would need a second surgical operation after the tissue is
repaired.
The major drawback of magnesium alloys is that they tend to corrode very quickly
in the physiological pH (7.4-7.6) environment thereby losing their mechanical integrity
before the end of the period necessary for bone tissue healing. Therefore, the promising
future of Mg and its alloys is dependent on the corrosion control rate in the body fluids.
Several treatments to protect magnesium against corrosion have been proposed such
as magnesium purification [11], fluoride conversion coatings [12], alloying with other
elements, anodizing, [1,11,13], etc. Several studies [14-20] have shown that the
corrosion behaviour of Mg alloys is significantly dependent on the microstructure and
particularly on the amount and distribution of the intermetallic phases and the grain
size. Attempts at improving the corrosion resistance of Mg alloys by reducing grain size
have been proposed by means of laser fusion technology. However, the results obtained
by various authors are contradictory [21, 22]. Microcrystallization has been also
proposed as a way to improve resistance in chloride media [23].
4
It can therefore be concluded that the reduction of the corrosion rate, by grain size
refinement, and the change of this rate as a function of the physiological media is not
well established in the case of Mg alloys. The aim of this work is to evaluate these two
effects in an attempt to develop a magnesium alloy with improved corrosion resistance.
2. Materials and methods
2.1. Material
The AZ31 alloy was received from Magnesium Elektron in the form of a rolled 3
mm thick sheet in the O-temper condition (annealed at 345 oC) and also in the form of
a cast ingot. The nominal composition of the AZ31 alloy is: 3 % wt. Al, 1% wt Zn, 0.2
% wt Mn and balance Mg. The alloy was solution-heat treated at 450 oC for 30 minutes
and water quenched. Rolled sheet disks of 10 mm in diameter were spark machined;
these samples were termed Type I.
Slabs, machined out from the ingot were processed by Equal Channel Angular
Extrusion (ECAE). The first pass was made at 250oC using a square die of 12x12 mm,
with an intersection angle of Φ = 90o and a plunger speed of 0.1 mm/s [24]. The die was
heated in situ during the Equal Channel Angular Pressing (ECAP) process and the
temperature of the die was maintained stable. The samples were heated successively to
300oC and rolled by applying a reduction in thickness from 12 mm to a final thickness
of 3 mm in one rolling pass. Rapid cooling (quenching) took place during rolling, since
the rolling mill was at room temperature. From the rolled slabs, disks of 10 mm in
diameter were machined out; these samples are termed Type II.
2.2 Microstructural characterization
5
The microstructures of the alloy in the different stages of processing were examined
by optical microscopy (OM). The sample preparation consisted of grinding on SiC
paper, followed by mechanical polishing with 6 and 1 μm diamond paste and short final
polishing using colloidal silica. The grain structure was revealed by subsequent etching
using a solution of ethanol (100 ml), picric acid (5 g), acetic acid (5 ml) and water (10
ml).
Additionally, microstructural and compositional characterization of the alloy surface
was carried out by scanning (SEM) and energy-dispersive X-ray spectroscopy (EDX)
microanalysis, after immersion tests in the corrosive media.
2.3 Corrosive media and electrochemical techniques
The following solutions were used as electrolytes: a) NaCl solution: 8 g/L and b)
Phosphate Buffer Solution (PBS): 0.2 g/L KCl, 0.2 g/L KH2PO4, 8 g/L NaCl and
1.150g/L Na2HPO4 (anhydrous).
A conventional three electrode electrochemical cell with a platinum wire as a
counter electrode and Ag/AgCl as a reference electrode was used. The working
electrodes were the AZ31 disks. The surface was ground with SiC abrasive paper of
increasing grain size from 600 to 1200 in water and finally polished with 1 µm diamond
suspension. Finally, AZ31 samples were rinsed ultrasonically in ethanol. Single sweep
potentiodynamic polarization curves were performed at 37ºC at 10 mV/s, between -1.9
V and different anodic limits. The passivation currents and breakdown potentials (Ebd)
were determined. At least five polarization curves were generated for each condition

6
(Types I and II in PBS and NaCl solutions). Transient currents were recorded at -1.60 V
after a potential step between -1.9 V and -1.6 V.
Electrochemical Impedance Spectroscopy (EIS) was carried out after 2 hours, 24
hours and 2, 3, 4 and 6 days testing time. Before the EIS measurements, the corrosion
potential was registered over 10 minutes until the potential was stabilised. The EIS
experiments were performed at the corrosion potential by applying a sinusoidal wave of
10 mV in amplitude in a frequency range from 2x10⁴ to 10-2 Hz spaced logarithmically
(five per decade). A 1280 Solartron frequency response analyzer was used to perform
the electrochemical tests.
The EIS results were analysed by fitting the experimental impedance data with
different equivalent circuit models. The equivalent circuit parameters were calculated
by fitting the impedance function to the measured spectra by a Non-Linear Least-
Squares program (NLLS program) for all the frequencies measured. The criteria used in
estimating the quality of the fitting were evaluated firstly with the lower chi-square
value, and secondly with the lower estimative errors (in %) for all the components.
3. Results
3.1 Microstructural characterization
The microstructure of Type I and Type II AZ31 alloy is shown in Figure 1(a) and
1(b) respectively. True grain sizes were measured by the linear intercept method using a
correction factor of 1.74. The mean grain sizes were d = 25.7 and 4.5 μm for Type I and
Type II samples respectively. In both, Type I and II samples, some particles of Mn-rich
phase (Al6Mn) still remained present in the microstructure after processing. Their
volume fraction was estimated by image analysis to be close to 3 x 10⁻³.
7
3.2 Initial stages of corrosion
Polarization curves recorded immediately after the immersion of Type I AZ31
samples in NaCl and PBS are shown in Figure 2. Higher cathodic current and slightly
higher breakdown potential is observed for the NaCl than for the PBS solutions. The
curves corresponding to Type II samples are depicted in Figure 3. The breakdown
potential measured in both solutions is similar for these samples.
The transient current recorded at a -1.60 V in NaCl for Type II AZ31 alloy is shown
in Figure 4. The figure reveals that initially the current decreases, remains stable for a
few seconds and then increases rapidly. Conversely, in the case of PBS, after the initial
decrease, the current increases immediately.
Figures 5 and 6 show the Nyquist impedance plots in NaCl and PBS, after 2 hours
of immersion, for Type I and II samples, respectively. In the impedance plot for Type I
samples (Figure 5), a depressed semicircle at high frequencies and an inductive loop at
low frequencies are observed, independently of the medium, PBS or NaCl. In the
impedance plot for Type II (Figure 6), the capacitive arc is followed by a possible
second arc that could be influenced by a diffusion process. Considering that the kinetics
information, referring to the corrosion behaviour is estimated from the capacitive arc
obtained in the high frequency (HF) and medium frequency (MF) ranges, the analysis of
the impedance data will be focused on this part of the spectra. By comparing the
diameter of the capacitive arcs, obtained in Figures 5 and 6, higher diameters for
samples immersed in NaCl than those immersed in PBS were found, thus showing a
higher corrosion resistance in NaCl medium.
8
This fact is corroborated by the examination of the surface by optical and electron
microscopy. Figure 7 shows micrographs of the formation of a pit after 1 h immersion
in PBS for Type II samples. The optical micrograph, Figure 7a, shows that the surface is
covered by a dark protective layer with white circles inside. Figure 7b shows a pit,
around which, precipitation has taken place. The mapping of the elements detected in
this area can be seen in Figures 7c-7j. The small pit is formed close to the intermetallic
AlMn deposit (Figures 7b, d, and e). High P signals around the pits are observed in
Figure 7g. However, after 1 h immersion, Type II samples did not show the formation
of pits in NaCl. This observation reveals that the phosphate included in the PBS initially
accelerates the corrosion of the AZ31 alloy.
3.3 Evolution over time of the corrosion kinetics
Figure 8 shows the impedance plots for Types I and II in PBS after 6 days
immersion. A higher diameter for Type II samples is obtained.
Analysis of experimental impedance data shows that more than one time constant is
necessary to describe the corrosion behaviour since the impedance data do not produce
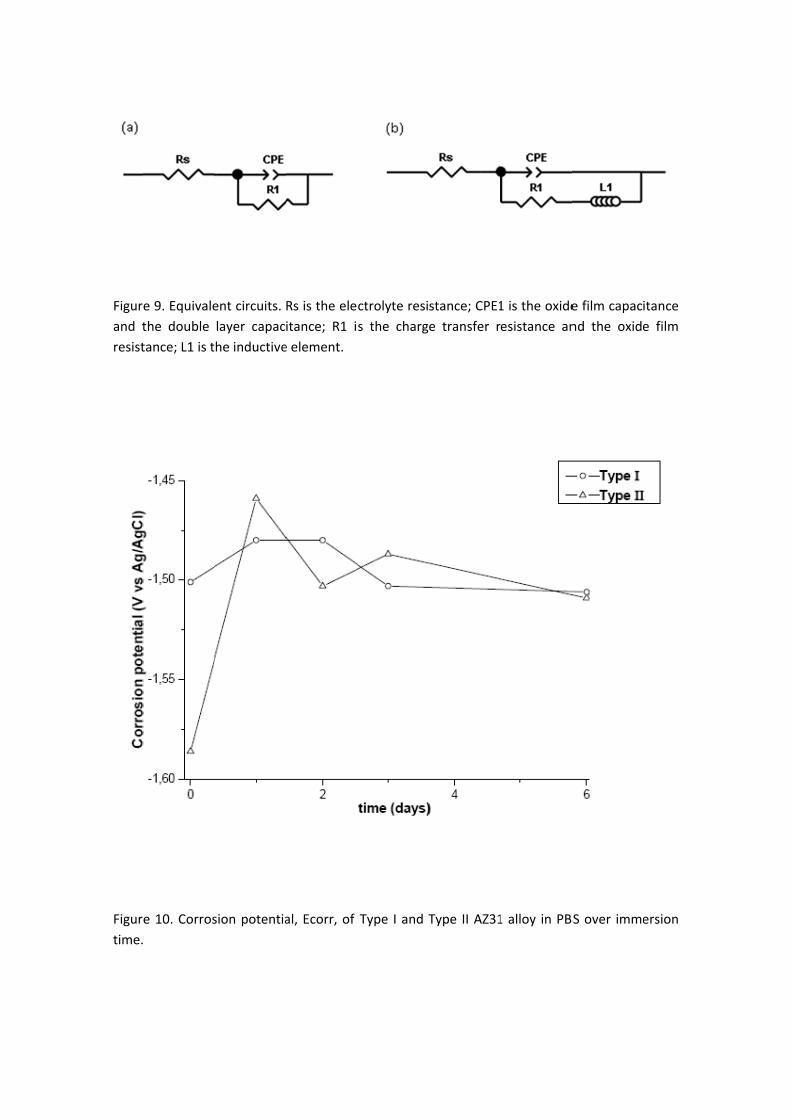
a simple semicircle in the capacitive half plane. Figure 9 shows the equivalent circuits
used to simulate the impedance data of the AZ31 alloy of both Types of samples, I and
II, immersed in NaCl or PBS solutions. The HF-MF arc was simulated by using a
simple Randles circuit (Figure 9a) consisting of the electrolyte resistance, Rs, in series
with a Constant Phase Element, CPE, simulating a non-ideal behaviour of the capacitor
due to the sum of the oxide layer capacitance and the double-layer capacitance, in
parallel with the transfer charge resistance, R1. In order to simulate the low frequency
(LF) range, a second branch is added in the Randles circuit (Figure 9b), in which an
9
inductive element L1, appears to describe the corrosion behaviour at low frequencies.
The fitting of the first arc (HF-MF range) gives valuable information about the
corrosion kinetics of the AZ31 alloy. Table 1 shows fitting values obtained with the
equivalent circuits and experimental values obtained from the impedance data. The
Table summarises the values obtained for both Types of samples, I and II, in both
corrosive media at two hours and after 6 days immersion. The increase of Rs over time
is higher in PBS than in NaCl solutions and this occurs independently of the type of
sample. In addition, an improvement in R1 over time for Type I samples immersed in
NaCl and PBS solutions is seen. The same is observed in Type II samples but the effect
is more pronounced in PBS. On the other hand, Type II samples immersed in NaCl
show that the capacitance slightly increases whereas in PBS the capacitance is nearly
constant.
4. Discussion
The application of Mg and its alloys as biomaterial for temporal implants in the
form of plates and screws would be effective when the corrosion kinetics are understood
and controlled in body fluids. A possible route to reduce the corrosion rate could be the
reduction of the grain size. With this goal in sight, the research developed in this work
consisted mainly in the evaluation of the corrosion behaviour of Type I and Type II
AZ31 magnesium alloy of different grain size in two electrolyte media. The Al present
in the AZ31 alloy, 3% in weight, increases the corrosion resistance of Mg by stabilizing
the passive layer [14, 25-26]. Larger amounts of Al are not recommended since
aluminium ions can easily combine with inorganic phosphates, leading to a lack of
phosphate in the human body and inducing dementia [11,27]. Furthermore, the
10
relatively small amount of Al ensures the presence of only one phase in the alloy thus
avoiding second phases that may be detrimental for the corrosion behaviour. The Zn
content in the alloy makes for satisfactory mechanical properties and can at the same
time be tolerated in the human body. So this Zn content increases the corrosion
resistance and retards the biodegradation of magnesium alloys [11, 14].
Type I AZ31 samples are in the O-temper condition corresponding to the annealed
and recrystallized microstructure. The processing route used to obtain Type II samples
leads to a fine grain size, 4.5 μm, which is similar to that obtained with severe plastic
deformation techniques. The processing temperature of the rolling pass, 300oC, is above
the solvus temperature for aluminum in this alloy. Therefore, the Al is in solid solution
during rolling. Due to the rapid cooling that takes place after rolling and since the
rolling mill is at room temperature, no precipitation of the beta-phase, Mg17Al12, takes
place. Compositional maps obtained by EDX show that Zn and Al are homogeneously
distributed in the Mg matrix in both Types I and II samples. After the processing route
[28], some particles of Mn-rich phase (Al6Mn) still remained present in the
microstructure as can be seen in Figure 7.
Results for the initial stages of immersion show that the corrosion behaviour of
Types I and II samples depends on the testing media, NaCl or PBS. The polarization
curves obtained in 8 g/l NaCl (Figures 2 and 3) show a pseudo-passive region followed
by a sharp current increase at the breakdown potential due to the action of chloride.
Correspondingly, the current transients for Type II (Figure 4) and Type I (not shown)
recorded at -1.60 V in NaCl show that the current decreases initially, probably due to
the formation of the pseudopassive layer of Mg(OH)2. The current remains low during
20 s for Type II in NaCl and then increases due to the localised corrosion induced by
chloride ions. Later, pitting spreads laterally. The current “plateau” is not observed in
11
PBS. In this case, the current increases immediately because the high pH needed for
Mg(OH)2 formation is not reached. In the same way, after a short immersion period (30
min) pits are only observed in PBS. These results agree with the transfer resistance, R1
values (Table 1 at 2 hours) obtained from impedance diagrams (Figures 5 and 6) which
show a higher value in NaCl than in PBS. This different behaviour is attributed to the
electrochemically dissolution of Mg in the surrounding areas (anodic zones) of the
intermetallic inclusions (cathodic areas).
The kinetics data of the corrosion behaviour of the samples are shown in Table 1
that summarises the charge transfer resistance, R1, values obtained from the HF-MF
capacitive arc at two hours testing. The diameter of the first capacitive arc at high
frequency (Figures 5 and 6) can be ascribed to the R1 value that includes the resistance
of the passive film and/or the layer of corrosion products [29]. The value of the
semicircle diameter closely corresponds to the R1 value, only if the resistance of the
passive film is much lower than the charge transfer resistance [29]. The capacitance
values obtained at the maximum of the semicircle are 7.8 and 12.6 μF/cm2 in NaCl and
PBS respectively, for the Type I samples (similar values are also obtained for Type II
samples). These values are lower than those obtained for the electrochemical double
layer which are about 20-50 μF/cm2 [29].
The best electrochemical results at the initial stages, obtained in samples immersed
in NaCl with respect to the PBS medium, can be attributed to the electrochemical
dissolution of Mg thus favouring the production of OH- ions as a result of the hydrogen
gas formation in the cathodic reaction. The presence of OH- ions causes an increase of
pH in the medium and facilitates the formation and precipitation of MgO and/or
Mg(OH)2 as corrosion products. In the case of AZ31 samples immersed in PBS, the
phosphate ions ((HPO4)2-) possibly capture the OH- that is produced by the cathodic
12
reaction and consequently the high alkaline pH (that favours the massive precipitation
of Mg hydroxide) cannot be reached. On the other hand, the phosphate precipitation
hinders the action of chloride and Mg dissolution is slower.
The change of Ecorr over time (Figure 10) is more important in Type II and is
probably related to its higher surface reactivity being more evident during the first
hours. The most marked differences between Type I and Type II samples could be
observed in the EIS measurements. After the first capacitive arc that appears in both
samples, Type I and II, (Figures 5 and 6) the shape of the impedance diagrams is
different. The Type I samples show an inductive arc in both media, NaCl and PBS
(Figure 5). The Type II samples show a possible second arc (Figure 6).
The inductive loop (Type I) is assumed to be due to the formation of the Mg(OH)2
and/or MgO, already mentioned, and to the coverage due to an adsorbed intermediate
(probably Mg(OH )+ads ) or Mg(OH)2 [14,29]. The presence of this loop has been
attributed, in the bibliography, to pitting processes [30] and also to the formation and
precipitation of a salt film [31]. In our case, a discrete thin film is formed in the air and
pitting corrosion may easily be initiated in the presence of chloride ions. It is the
dissolution of this film that yields to the formation of corrosion products on the
electrode surface. This behaviour agrees with the observation of other authors on the
same alloy, AZ31 immersed in 3.0 wt% of NaCl [1,32].
The second arc observed for Type II samples (Figure 6) in both solutions, NaCl and
PBS, could be attributed to mass transport in the solid phase due to the growth of the
corrosion product layer [14], facilitated by the finer grain size. This diffusion process
slows down the corrosion reaction, giving rise to an increase in the corrosion resistance,
i.e., to a decrease of the corrosion rate.
13
The corrosion behaviour at initial stages is reversed when immersion time is
increased and after six days the corrosion resistance is improved. R1 increases its value
for samples immersed in PBS with respect to those immersed in NaCl (Table 1). This
evolution of the corrosion behaviour with the immersion time is due to the accumulation
of corrosion products, forming a layer that promotes a diffusive control of the corrosion
process of the samples. After 6 days testing in PBS, the released PO4- coprecipitates as
Mg phosphate (Figure 7) together with the Mg oxide and hydroxide that is formed. The
presence of phosphates has been detected, by Fourier Transform Infrared FTIR
spectroscopy [33]. The increase of R1 over time could be related to the formation of a
mixed layer that is increasingly thick and more compact with time hindering the
diffusion of ions, particularly in case of Type II.
Summarizing, the best corrosion behaviour of the AZ31 is obtained for the finest grain
alloy, Type II. This good result is attributed to a more negative corrosion potential than
that of Tipe I, giving rise to a fast electrochemical reaction and the formation of a layer
of corrosion products, which protects from the diffusion of aggressive ions to the
electrode surface. Immediately after the immersion, the corrosion resistance is higher in
NaCl solution than in PBS, but this behaviour is reversed after longer periods of
immersion due to the stabilization of the layer by P-containing compounds. These
compounds contribute to a higher protection than that of the magnesium hydroxide
formed in NaCl solution because they hinder the detrimental action of chloride ions.
5. Conclusions
14
1. At initial stages, pits are associated with the presence of AlMn intermetallics. The
monophasic AZ31 alloy shows pitting corrosion that spreads laterally for both Types
of samples.
2. For short periods, the initiation of localized corrosion occurs earlier in PBS than in
NaCl. However, the precipitation of P-containing salts in PBS decreases the
corrosion rate over time for both Types of samples.
3. The best performance corresponds to the AZ31 alloy with the finest grain size in
PBS. It reveals the lower initial corrosion potential and higher charge transfer
resistance values at long immersion periods. This could be related to the presence of
a mixed compact layer of P-containing compounds, together with magnesium
hydroxide, that promote protection against the action of chloride ions.
Acknowledgements
The authors acknowledge the Ministerio de Educación y Ciencia, Spain, for
financial support by projects MAT 2006-02672 and MAT2008-06719-C03-01.
DP and MFLM acknowledge the financial support by ANPCyT (PICT 05-33225, PICT
05-32906), UNLP (11/I129), and CONICET (PIP 6075).
References
[1] Wu CS, Zhang Z, Cao FH, Zhang LJ, Zhang JQ, Cao CN. Study on the anodizing of
AZ31 magnesium alloys in alkaline borate solutions. Appl Surf Sci 2007; 253: 3893-
3898.
15
[2] Gray JE, Luan B. Protective coatings on magnesium and its alloys-a critical review.
J Alloy Compd 2002; 336: 88-113.
[3] Heublein B, Rohde R, Kaese V, Niemeyer M, Hartung W, Haverich A. Biocorrosion
of magnesium alloys: a new principle in cardiovascular implant technology. Heart
2003;89:651-656.
[4] Zartner P, Cesnjevar R, Singer H, Weyand M. First successful implantation of a
biodegradable metal stent into the left pulmonary artery of a preterm baby. Catheter
Cardio Int 2005; 66: 590-594.
[5] Staiger M, Pietak A, Huadmai J, Dias G. Magnesium and its alloys as orthopedic
biomaterials: A review. Biomaterials 2006;27:1728-1734.
[6] Mani G, Feldman MD, Patel D, Agrawal CM. Coronary stents: A materials
perspective. Biomaterials 2007; 28: 1689-1710.
[7] Xu L, Yu G, Zhang E, Pan F, Yang K. In vivo corrosion behavior of Mg-Mn-Zn
alloy for bone implant application. J Biomed Mater Res, Part A 2007; 83A: 703-711.
[8] Kuwahara H, Al-Abdullat Y, Mazaki N, Tsutsumi S, Aizawa T. Precipitation of
magnesium apatite on pure magnesium surface during immersing in Hank´s solution.
Mater Trans 2001; 42: 1317-1321.
[9] Al-Abdullat Y, Tsutsumi S, Nakajima N, Ohta M, Kuwahara H, Ikeuchi K. Surface
modification of magnesium by NaHCO3 and corrosion behaviour in Hank´s solution for
new biomaterial applications. Mater Trans 2001; 42: 1777-1780.
[10] Witte F, Kaese V, Haferkamp H, Switzer E, Meyer-Linderberg A, Wirth CJ,
Windhagen H. In vivo corrosion of four magnesium alloys and the associated bone
response. Biomaterials 2005; 26: 3557-3563.
16
[11] Song G. Control of biodegradation of biocompatable magnesium alloys. Corros Sci
2007; 49: 1696-1701.
[12] Chiu KY, Wong MH, Cheng FT, Man HC. Characterization and corrosion studies
of fluoride conversion coating on degradable Mg implants. Surf Coat Tech 2007;
202:590-598.
[13] Zhang Y, Yan C, Wang F, Li W. Electrochemical behaviour of anodized Mg alloy
AZ91D in chloride containing aqueous solution. Corros Sci 2005; 47: 2816-2831.
[14] Baril G, Blanc C, Pébère N. AC impedance spectroscopy in characterizing time-
dependent corrosion of AZ91 and AM50 magnesium alloys. J Electrochem Soc 2001;
148: B489-B496.
[15] Lunder O, Lein JE, Aune TKr, Nisancioglu K. Role of Mg17Al12 phase in the
corrosion of Mg alloy AZ91. Corrosion 1989; 45: 741-748.
[16] Nisancioglu K, Lunder O, Aune TKr, in Proceedings of the 47th Annual World
Magnesium Conference, The International Magnesium Association, 1990 p.47.
[17] Song G, Atrens A, Wu X, Zhang B. Corrosion behaviour of AZ21, AZ501 and
AZ91 in sodium chloride. Corros Sci 1998; 40: 1769-1791.
[18] Song G, Atrens A, Dargusch M. Influence of microstructure on the corrosion of
diecast AZ91D. Corros Sci 1999; 41: 249-273.
[19] Uzan P, Frumin N, Eliezer D, Aghion E, in Proceedings of the Second Israeli
International Conference on Magnesium Science and Technology, 2000. p. 385-391.
[20] Ambat R, Aung NN, Zhou W. Evaluation of microstructural effects on corrosion
behaviour of AZ91D magnesium alloy. Corros Sci 2000; 42: 1433-1455.
17
[21] Abbas G, Liu Z, Skeldon P. Corrosion behaviour of laser-melted magnesium
alloys. Appl Surf Sci 2005; 247: 347-353.
[22] Dubé D, Fiset M, Couture A, Nakatsugawa I. Characterization and performance of
laser melted AZ91D and AM60B. Mat Sci Eng A-Struct 2001; 299: 38-45.
[23] Li Y, Zhang T, Wang F. Effect of microcrystallization on corrosion resistance of
AZ91D alloy. Electrochim Acta 2006; 51: 2845-2850.
[24] del Valle JA, Carreño F, Ruano OA. Influence of texture and grain size on work
hardening and ductility in magnesium-based alloys processed by ECAP and rolling.
Acta Mater 2006;54:4247–4259.
[25] Nordlien JH, Nisancioglu K, Ono S, Masuko N. Morphology and structure of oxide
films formed on MgAl alloys by exposure to air and water. J Electrochem Soc
1996;143:2564-2572.
[26] Nordlien JH, Nisancioglu K, Ono S, Masuko N. Morphology and structure of
water-formed oxides on ternary MgAl alloys. J Electrochem Soc 1997; 144: 461-466.
[27] Lucey TD, Venugopal B, Metal Toxicity in Mammals, Plenum Press, New York
1977.
[28] Pérez-Prado MT, del Valle JA, Contreras JM, Ruano OA. Microstructural
evolution during large strain hot rolling of an AM60 Mg alloy. Scripta Mater 2004; 50:
661–665.
[29] Pebere N, Riera C, Dabosi F. Investigation of magnesium corrosion in aerated
sodium sulfate solution by electrochemical impedance spectroscopy. Electrochim Acta
1990; 35: 555-561.
18
[30] Metikoš-Huković M, Babić R, Grubač Z, Brinić S. Impedance spectroscopic study
of aluminium and Al-alloys in acid solution: inhibitory action of nitrogen containing
compounds. J Appl Electrochem 1994; 24: 772-778.
[31] Breslin CB, Rudd AL. Activation of pure Al in an indium-containing electrolyte-an
electrochemical noise and impedance study. Corros Sci 2000; 42: 1023-1039.
[32] Song G, Atrens A, John D, Wu X, Nairn J. The anodic dissolution of magnesium
in chloride and sulphate solutions. Corros Sci 1997; 39: 1981-2004.
[33] Xin Y, Huo K, Tao H, Tang G, Chu PK. Influence of aggressive ions on the
degradation behavior of biomedical magnesium alloy in physiological environment.
Acta Biomater 2008; 4: 2008-2015.
19
FIGURE CAPTIONS
Figure 1.- Microstructure of AZ31 samples: Type I (a) and Type II (b).
Figure 2.- Potentiodynamic polarization curves of Type I AZ31 alloy at 1 mV/s in NaCl
and PBS.
Figure 3.- Potentiodynamic polarization curves of Type II AZ31 alloy at 1 mV/s in
NaCl and PBS .
Figure 4.- Transient currents recorded at -1.60 V(SCE) in Type II AZ31 alloy in NaCl and
PBS.
Figure 5.- Nyquist plots of Type I AZ31 alloy in NaCl and PBS for two hours
immersion time.
Figure 6.- Nyquist plots of Type II AZ31 alloy in NaCl and PBS for two hours
immersion time.
Figure 7.- Micrographs of the formation of a small pit after 30 min of immersion for
Type II AZ31 alloy in PBS. a) optical microscopy, b) electron secondary image, c)
mapping of Mg, d) mapping of Al, e) mapping of Mn, f) mapping of Fe, g) mapping of
P, h) mapping of Cl, i) mapping of Na and j) mapping of O.
20
Figure 8.- Nyquist plots of Type I and Type II AZ31 alloys in PBS solution for six days
immersion time .
Figure 9.- Equivalent circuits. Rs is the electrolyte resistance; CPE1 is the oxide film
capacitance and the double layer capacitance; R1 is the charge transfer resistance and
the oxide film resistance; L1 is the inductive element.
Figure 10.- Corrosion potential, Ecorr, of Type I and Type II AZ31 alloy in PBS over
immersion time.
TABLE CAPTION
Table 1.- Results obtained from the impedance diagrams for the Type I and II AZ31
alloys in NaCl and PBS over immersion time and fitted data of the equivalents circuits
of Figure 9.
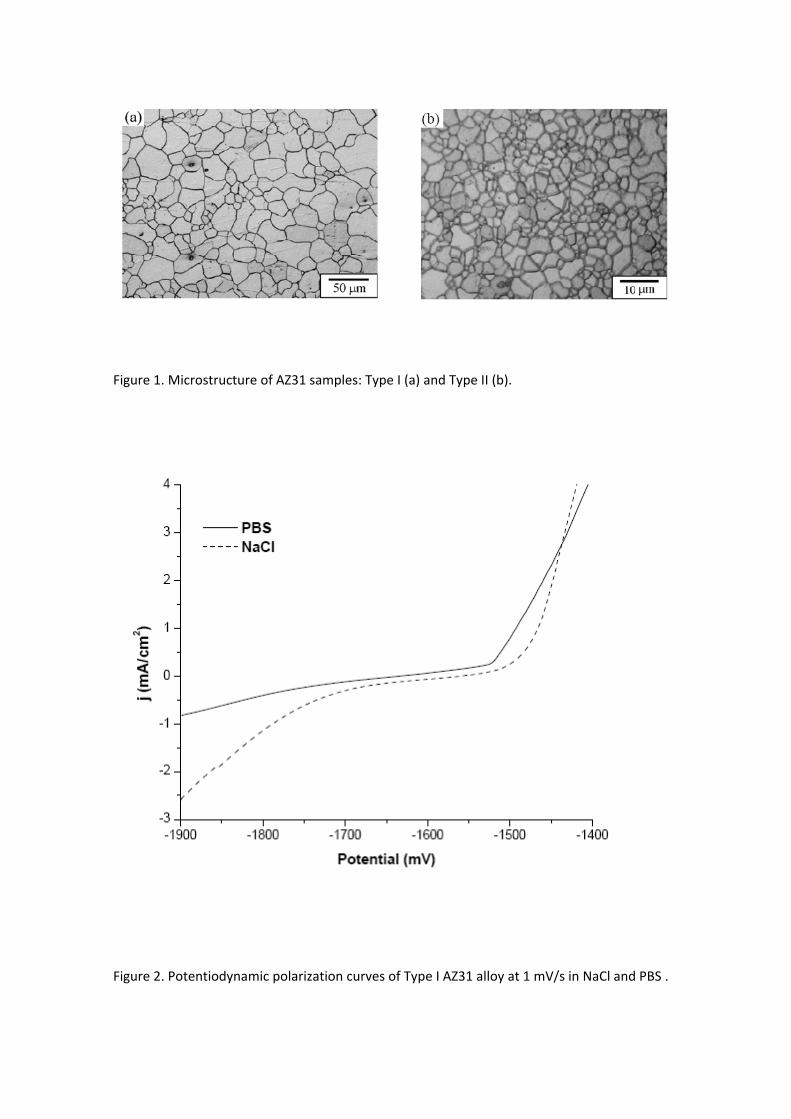
Figure 1. Microstructure of AZ31 samples: Type I (a) and Type II (b).
Figure 2. Potentiodynamic polarization curves of Type I AZ31 alloy at 1 mV/s in NaCl and PBS .
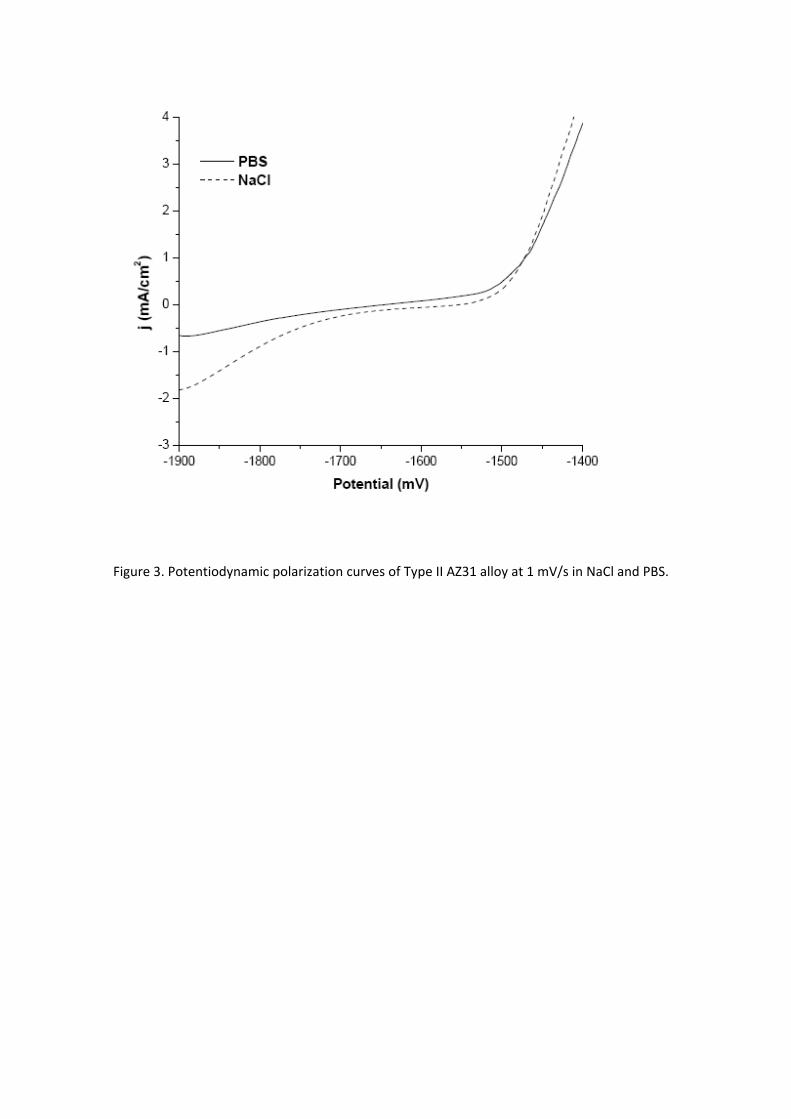
Figure 3. Potentiodynamic polarization curves of Type II AZ31 alloy at 1 mV/s in NaCl and PBS.
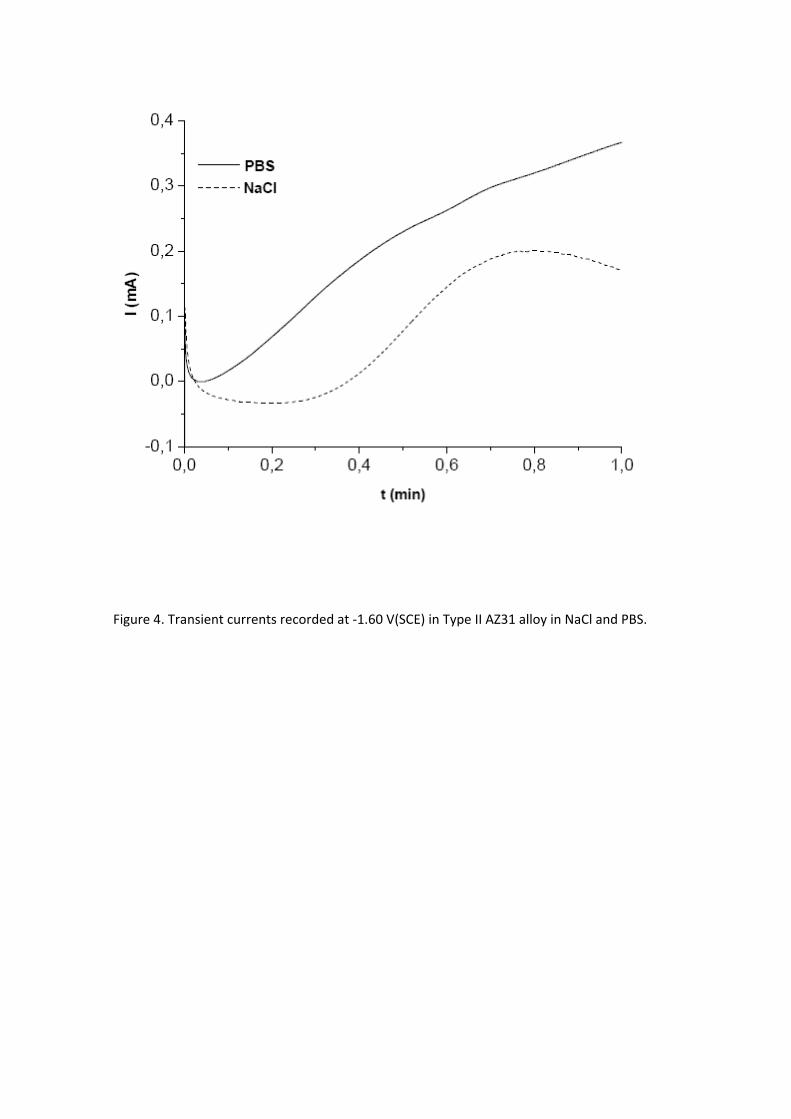
Figure 4. Transient currents recorded at ‐1.60 V(SCE) in Type II AZ31 alloy in NaCl and PBS.
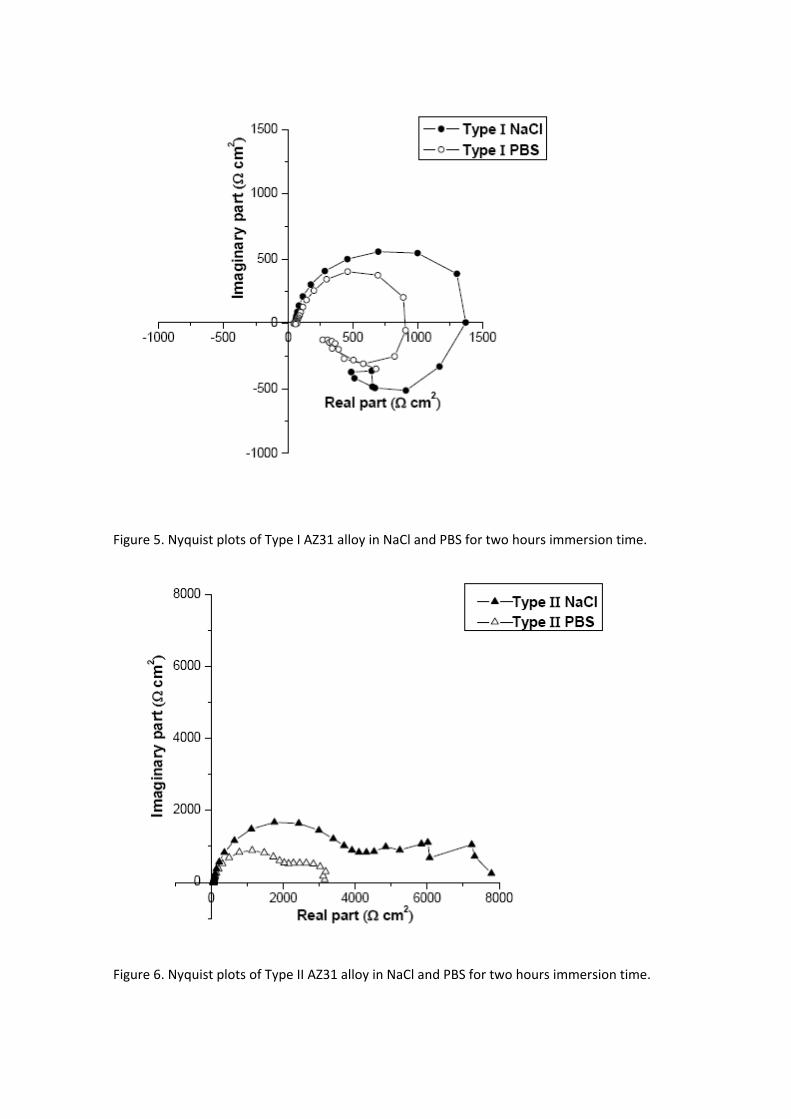
Figure 5. Nyquist plots of Type I AZ31 alloy in NaCl and PBS for two hours immersion time.
Figure 6. Nyquist plots of Type II AZ31 alloy in NaCl and PBS for two hours immersion time.
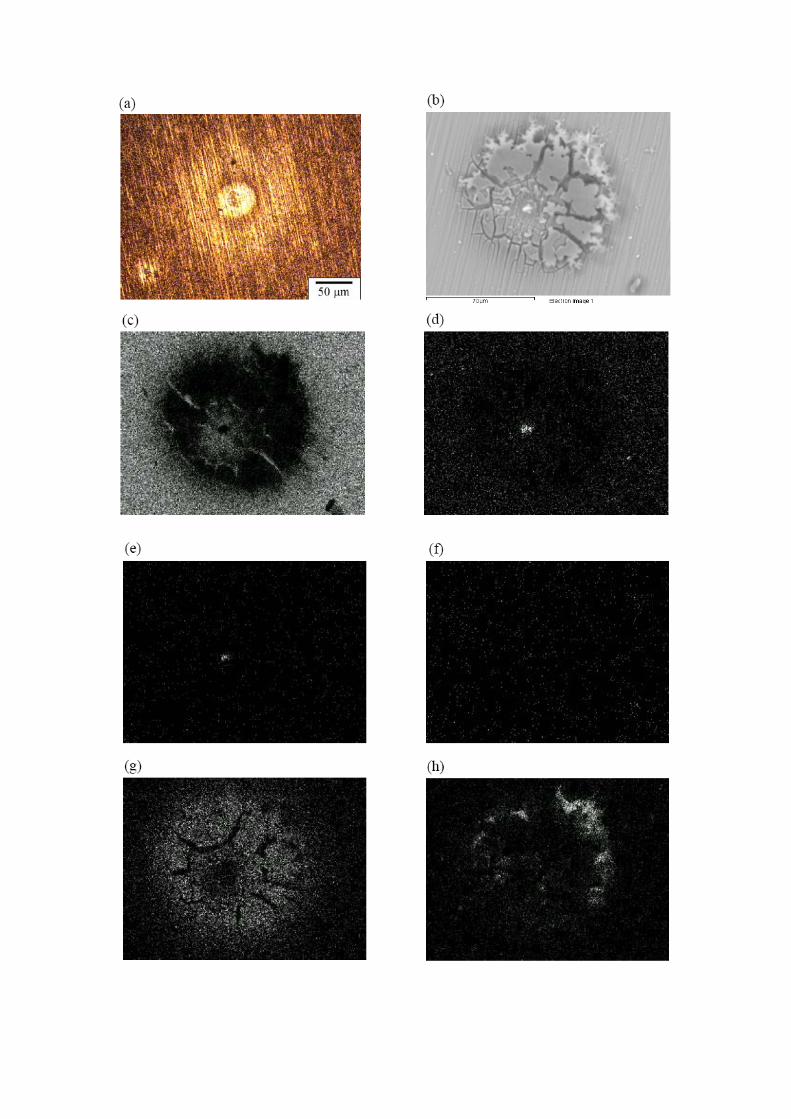
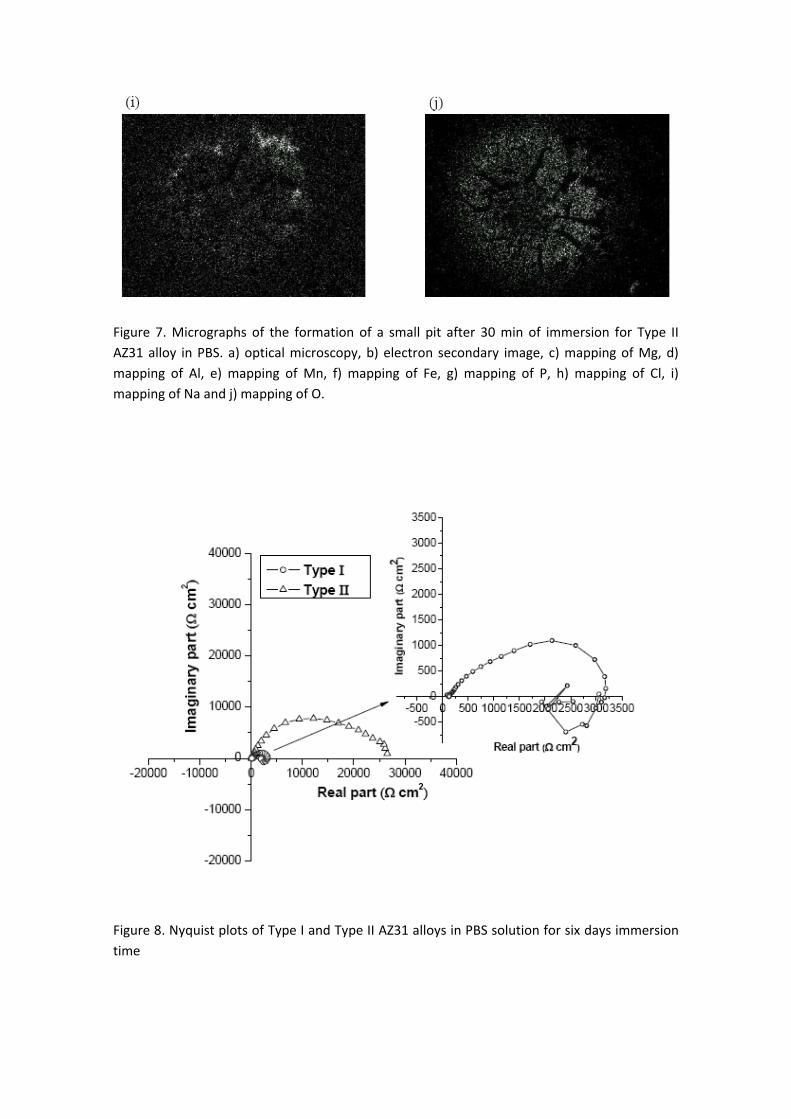
Figure 7. Micrographs of the formation of a small pit after 30 min of immersion for Type II AZ31 alloy in PBS. a) optical microscopy, b) electron secondary image, c) mapping of Mg, d) mapping of Al, e) mapping of Mn, f) mapping of Fe, g) mapping of P, h) mapping of Cl, i) mapping of Na and j) mapping of O.
Figure 8. Nyquist plots of Type I and Type II AZ31 alloys in PBS solution for six days immersion time
Figurand tresist
Figurtime.
e 9. Equivalethe double tance; L1 is t
e 10. Corros
ent circuits. layer capache inductive
sion potentia
Rs is the eleitance; R1 ie element.
al, Ecorr, of
ctrolyte resis the charg
Type I and T
stance; CPE1e transfer r
Type II AZ31
1 is the oxideesistance an
1 alloy in PB
e film capacnd the oxide
BS over imme
itance e film
ersion
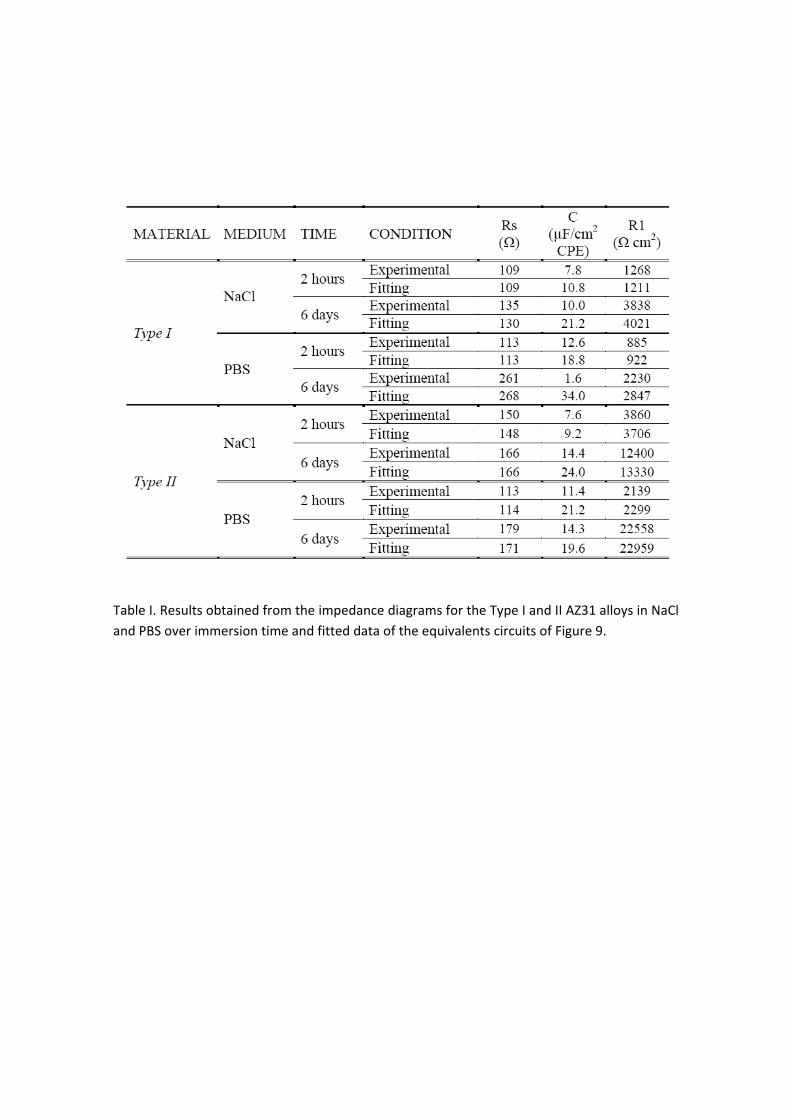
Table I. Results obtained from the impedance diagrams for the Type I and II AZ31 alloys in NaCl and PBS over immersion time and fitted data of the equivalents circuits of Figure 9.
Recommended