=
SEB Fact Book January – September 2016 N
Fact Book January – September 2016 STOCKHOLM 20 OCTOBER 2016
SEB Fact Book January – September 2016 2
Table of contents About SEB ..................................................................................................................................................................................... 4
Financial targets .......................................................................................................................................................................................................................... 4 Rating ............................................................................................................................................................................................................................................. 4
Organisation ..................................................................................................................................................................................5 Share of operating profit Full year 2015, excluding one-off effects ....................................................................................................................................... 5
Corporate Governance ................................................................................................................................................................. 6 Board .............................................................................................................................................................................................................................................. 6 Group Executive Committee ....................................................................................................................................................................................................... 6 Share and shareholders ............................................................................................................................................................................................................... 7 The SEB share Jan 2011 – 30 Sep 2016 Index .......................................................................................................................................................................... 7 SEB’s major shareholders Dividend development ................................................................................................................................................................ 7
Income statement ........................................................................................................................................................................ 8 SEB Group ...................................................................................................................................................................................................................................... 8 Income, Expenses and Operating profit ..................................................................................................................................................................................... 8 Income statement, quarters SEB Group ..................................................................................................................................................................................... 9 Share of operating profit .............................................................................................................................................................................................................. 9 Key figures – SEB Group ............................................................................................................................................................................................................ 10 Impact from exchange rate fluctuations .................................................................................................................................................................................. 10 Net interest income analysis ...................................................................................................................................................................................................... 11 Net interest margin ...................................................................................................................................................................................................................... 11 NII customer driven specification ............................................................................................................................................................................................. 12 Net fee and commission income............................................................................................................................................................................................... 12 Net financial income .................................................................................................................................................................................................................. 13 Expenses ...................................................................................................................................................................................................................................... 13
Staff costs - SEB Group ................................................................................................................................................................................................ 13 Other expenses - SEB Group ....................................................................................................................................................................................... 13
Balance sheet structure & funding ............................................................................................................................................. 14 Balance sheet structure ............................................................................................................................................................................................................. 14 Total loans and deposits ............................................................................................................................................................................................................ 15 Loan to deposit ratio excl repos and debt instruments .......................................................................................................................................................... 15 A strong balance sheet structure, 30 Sep 2016 ....................................................................................................................................................................... 15 Intangible assets ......................................................................................................................................................................................................................... 15 Long-term funding Maturity profile, 30 Sep 2016 ................................................................................................................................................................... 16
By product, SEK bn ....................................................................................................................................................................................................... 16 By currency, SEK bn, 30 Sep 2016 .............................................................................................................................................................................. 16 Long-term funding raised, SEK bn .............................................................................................................................................................................. 16
Balance Sheet Maturity Profile SEB Group ................................................................................................................................................................................ 17 Remaining Contractual Maturities ............................................................................................................................................................................... 17
SEB's Liquidity Reserve, 30 Sep 2016, SEK m .......................................................................................................................................................................... 18 Components Swedish FSA Liquidity ratio, 30 Sep 2016, SEK bn ........................................................................................................................................... 18 Asset Encumbrance for the SEB consolidated situation, 30 Sep 2016, SEK m .................................................................................................................... 18 SEB AB Mortgage cover pool and covered bonds characteristics ......................................................................................................................................... 19 Capital adequacy ........................................................................................................................................................................................................................ 20 Own funds in the SEB consolidated situation .......................................................................................................................................................................... 20 Risk exposure amounts for the SEB consolidated situation................................................................................................................................................... 21 IRB reported credit exposures (less repos and securities lending) ....................................................................................................................................... 21 Risk exposure amount development ........................................................................................................................................................................................ 21 Capital adequacy and Risk exposure amount, SEB Group – Basel III .................................................................................................................................... 22 All outstanding Subordinated Debt .......................................................................................................................................................................................... 22 Assets under management ........................................................................................................................................................................................................ 22 Mutual funds per product type .................................................................................................................................................................................................. 23
Total net inflow per quarter Assets under management, SEK bn. ........................................................................................................................ 23 Credit portfolio ........................................................................................................................................................................... 24
Credit portfolio* .......................................................................................................................................................................................................................... 24 Credit portfolio by industry and geography* ........................................................................................................................................................................... 24 Loan portfolio by industry and geography* ............................................................................................................................................................................. 25 Credit portfolio – Corporates Credit portfolio – Property Management ......................................................................................................................... 26 Credit portfolio by industry and geography* ........................................................................................................................................................................... 26
Asset quality ............................................................................................................................................................................... 27 Credit loss level ........................................................................................................................................................................................................................... 27 Development of Non-performing loans ................................................................................................................................................................................... 27 Non-performing loans & reserves............................................................................................................................................................................................. 28
SEB Group ..................................................................................................................................................................................................................... 28 Baltic geographies ........................................................................................................................................................................................................ 28
SEB Fact Book January – September 2016 3
Impaired loans by industry and geography* ............................................................................................................................................................................ 29 Non performing portfolio assessed loans* .............................................................................................................................................................................. 30 Market risk ................................................................................................................................................................................................................................... 30 Debt instruments ........................................................................................................................................................................................................................ 31
SEB Group by business segment ............................................................................................................................................... 32 Operating profit before credit loss provisions per division .................................................................................................................................................... 32 Other and eliminations, total (incl. Group-wide functions outside the divisions) ............................................................................................................... 32
Large Corporates & Financial Institutions ..................................................................................................................................33 Income, Expenses and Operating profit ................................................................................................................................................................................... 33 Lending and commitments development*, FX-adjusted ....................................................................................................................................................... 34 Markets income by main product cluster ................................................................................................................................................................................. 34 Investment banking – Corporate Finance ............................................................................................................................................................................... 35 Low risk trading orientation ...................................................................................................................................................................................................... 35
Corporate & Private Customers ................................................................................................................................................. 36 Income, Expenses and Operating profit ................................................................................................................................................................................... 36 Business volume development by area .................................................................................................................................................................................... 37
Corporate & Private Customers .................................................................................................................................................................................. 37 Cards .............................................................................................................................................................................................................................. 37
Baltic (excl. RHC) ........................................................................................................................................................................ 38 Income, Expenses and Operating profit SEK m ....................................................................................................................................................................... 38 Business volume development by area .................................................................................................................................................................................... 39 Deposit breakdown, per cent of total deposits ....................................................................................................................................................................... 39 Deposit market shares ............................................................................................................................................................................................................... 39 Baltic lending market shares ..................................................................................................................................................................................................... 40 Loan portfolio .............................................................................................................................................................................................................................. 40 Volumes ....................................................................................................................................................................................................................................... 41 Baltic real estate holding companies ........................................................................................................................................................................................ 42
Life & Investment Management ................................................................................................................................................ 43 Income, Expenses and Operating profit ................................................................................................................................................................................... 43 Embedded value, Life ................................................................................................................................................................................................................. 44 Life market shares, premium income new and existing unit-linked policies ....................................................................................................................... 44 Market share, Sweden ................................................................................................................................................................................................................ 44 Premium income and Assets under management, Life .......................................................................................................................................................... 45 Gamla Livförsäkringsaktiebolaget ............................................................................................................................................................................................ 45 Surplus values ............................................................................................................................................................................................................................. 45 Surplus value accounting, Life .................................................................................................................................................................................................. 46
Macro .......................................................................................................................................................................................... 47 Nordic countries ......................................................................................................................................................................................................................... 47 Baltic countries ........................................................................................................................................................................................................................... 48 Swedish housing market ............................................................................................................................................................................................................ 49 Macro forecasts per country ...................................................................................................................................................................................................... 50 Macroeconomic development Forecasts made by SEB’s macroeconomists ....................................................................................................................... 50
Definitions ................................................................................................................................................................................... 51 According to the EU Capital Requirements Regulation no 575/2013 (CRR) ........................................................................................................................ 52
Contacts and Calendar ............................................................................................................................................................. 53
SEB Fact Book January – September 2016 4
About SEB Our vision To deliver world-class service to our customers.
Our purpose We believe that entrepreneurial minds and innovative companies are key to creating a better world. We
are here to enable them to achieve their aspirations and succeed through good times and bad.
Our overall ambition To be the undisputed leading Nordic bank for corporations and institutions and the top universal bank in
Sweden and the Baltic countries.
Whom we serve 2,300 large corporations, 700 financial institutions, 257,000 SME and 1,3 million private full-service
customers bank with SEB. They are served mainly in eight countries around the Baltic Sea.
Our strategic priorities Leading customer experience – develop long-term relationships based on trust so that customers feel
that the services and advice offered are insightful about their needs, are convenient and accessible on
their terms and that SEB shares knowledge and acts proactively in their best interest.
Growth in areas of strength – pursue growth in three selected core areas – large corporations and
financial institutions, small and medium-sized enterprises in Sweden, and savings offering to private
individuals and corporate customers.
Resilience and flexibility – maintain resilience and flexibility in order to adapt operations to the prevailing
market conditions. Resilience is based upon cost and capital efficiency.
Values Guided by our Code of Business Conduct and our core values: customers first, commitment,
collaboration and simplicity.
People Around 15,300 highly skilled employees serving customers from locations in some 20 countries; covering
different time zones, securing reach and local market knowledge.
History 160 years of business, trust and sharing knowledge. The Bank has always acted responsibly in society
promoting entrepreneurship, international outlook and long-term relationships.
SEB history 1856- Stockholms Enskilda Bank was founded
1972- Merger with Skandinaviska Banken
1990- Swedish bank crises. Several acquisitions: Trygg Hansa (1997), Baltic banks (1998), SEB AG (1999), Ukraine (2004)
2011- A Nordic relationship bank. Divestment of German retail and Ukrainian retail
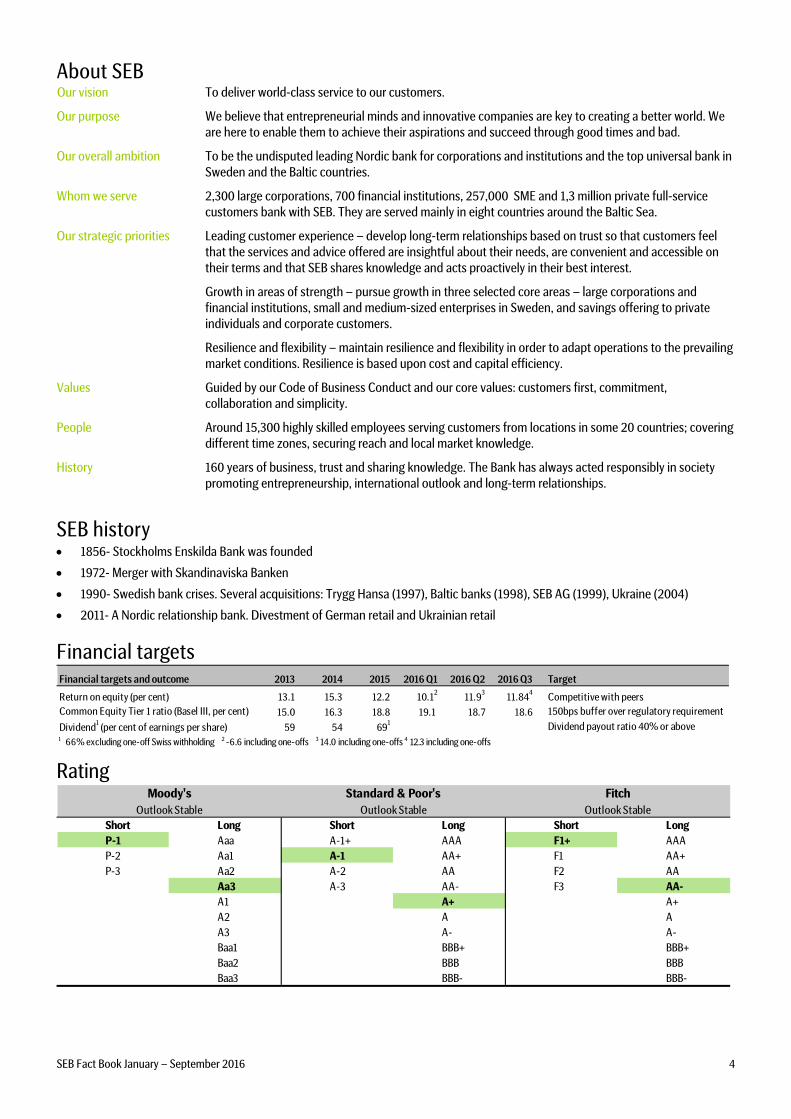
Financial targets Financial targets and outcome 2013 2014 2015 2016 Q1 2016 Q2 2016 Q3 Target
Return on equity (per cent) 13.1 15.3 12.2 10.12
11.93
11.844
Competitive with peers
Common Equity Tier 1 ratio (Basel III, per cent) 15.0 16.3 18.8 19.1 18.7 18.6 150bps buffer over regulatory requirement
Dividend1 (per cent of earnings per share) 59 54 69
1 Dividend payout ratio 40% or above1 66% excluding one-off Swiss withholding 2 -6.6 including one-offs 3 14.0 including one-offs 4 12.3 including one-offs
Rating
Short Long Short Long Short Long
P-1 Aaa A-1+ AAA F1+ AAA
P-2 Aa1 A-1 AA+ F1 AA+
P-3 Aa2 A-2 AA F2 AA
Aa3 A-3 AA- F3 AA-
A1 A+ A+
A2 A A
A3 A- A-
Baa1 BBB+ BBB+
Baa2 BBB BBB
Baa3 BBB- BBB-
Moody's
Outlook Stable
Standard & Poor's
Outlook Stable
Fitch
Outlook Stable
SEB Fact Book January – September 2016 5
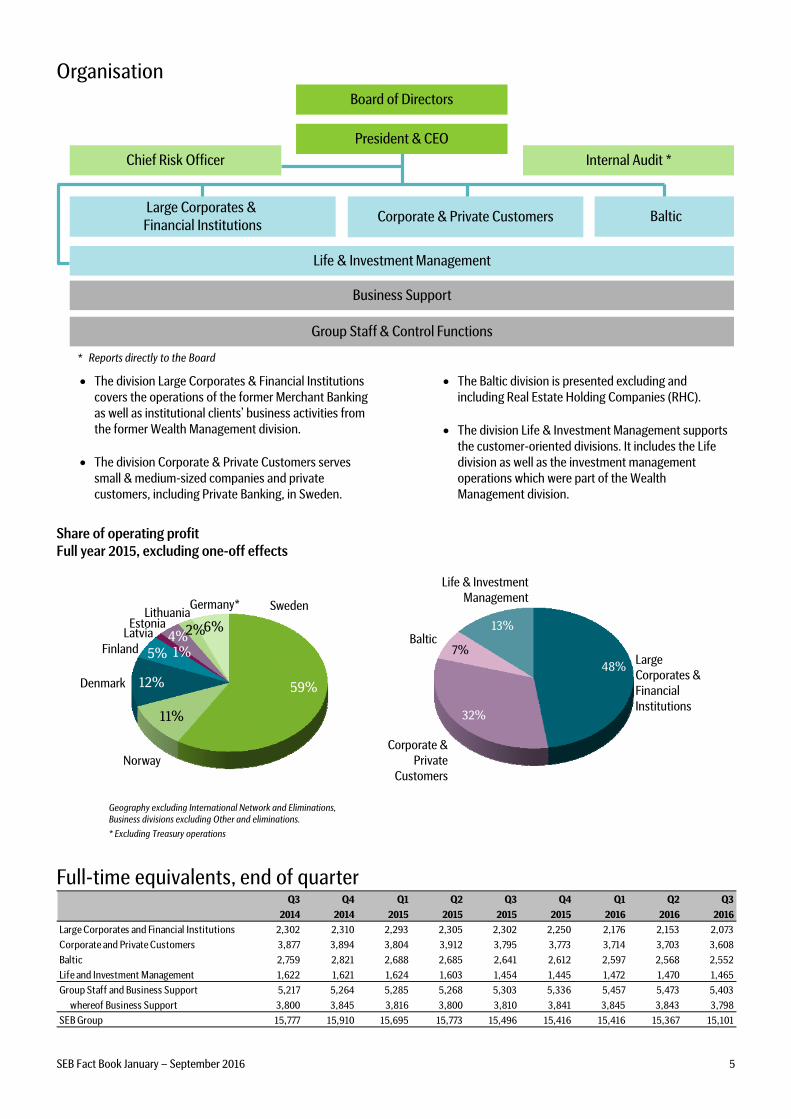
Organisation
Internal Audit *Chief Risk Officer
Large Corporates &
Financial InstitutionsCorporate & Private Customers
Business Support
Group Staff & Control Functions
Baltic
* Reports directly to the Board
Life & Investment Management
President & CEO
Board of Directors
The division Large Corporates & Financial Institutions
covers the operations of the former Merchant Banking
as well as institutional clients’ business activities from
the former Wealth Management division.
The division Corporate & Private Customers serves
small & medium-sized companies and private
customers, including Private Banking, in Sweden.
The Baltic division is presented excluding and
including Real Estate Holding Companies (RHC).
The division Life & Investment Management supports
the customer-oriented divisions. It includes the Life
division as well as the investment management
operations which were part of the Wealth
Management division.
Share of operating profit
Full year 2015, excluding one-off effects
59%
11%
12%
5% 1%4%2%6%Latvia
48%
32%
7%
13%
Corporate & Private
Customers
Life & Investment Management
Large Corporates &
Financial
Institutions
Baltic
SwedenLithuania
Estonia
Norway
Finland
Denmark
Germany*
Geography excluding International Network and Eliminations,
Business divisions excluding Other and eliminations.
* Excluding Treasury operations
Full-time equivalents, end of quarter Q3 Q4 Q1 Q2 Q3 Q4 Q1 Q2 Q3
2014 2014 2015 2015 2015 2015 2016 2016 2016
Large Corporates and Financial Institutions 2,302 2,310 2,293 2,305 2,302 2,250 2,176 2,153 2,073
Corporate and Private Customers 3,877 3,894 3,804 3,912 3,795 3,773 3,714 3,703 3,608
Baltic 2,759 2,821 2,688 2,685 2,641 2,612 2,597 2,568 2,552
Life and Investment Management 1,622 1,621 1,624 1,603 1,454 1,445 1,472 1,470 1,465
Group Staff and Business Support 5,217 5,264 5,285 5,268 5,303 5,336 5,457 5,473 5,403
whereof Business Support 3,800 3,845 3,816 3,800 3,810 3,841 3,845 3,843 3,798
SEB Group 15,777 15,910 15,695 15,773 15,496 15,416 15,416 15,367 15,101
SEB Fact Book January – September 2016 6
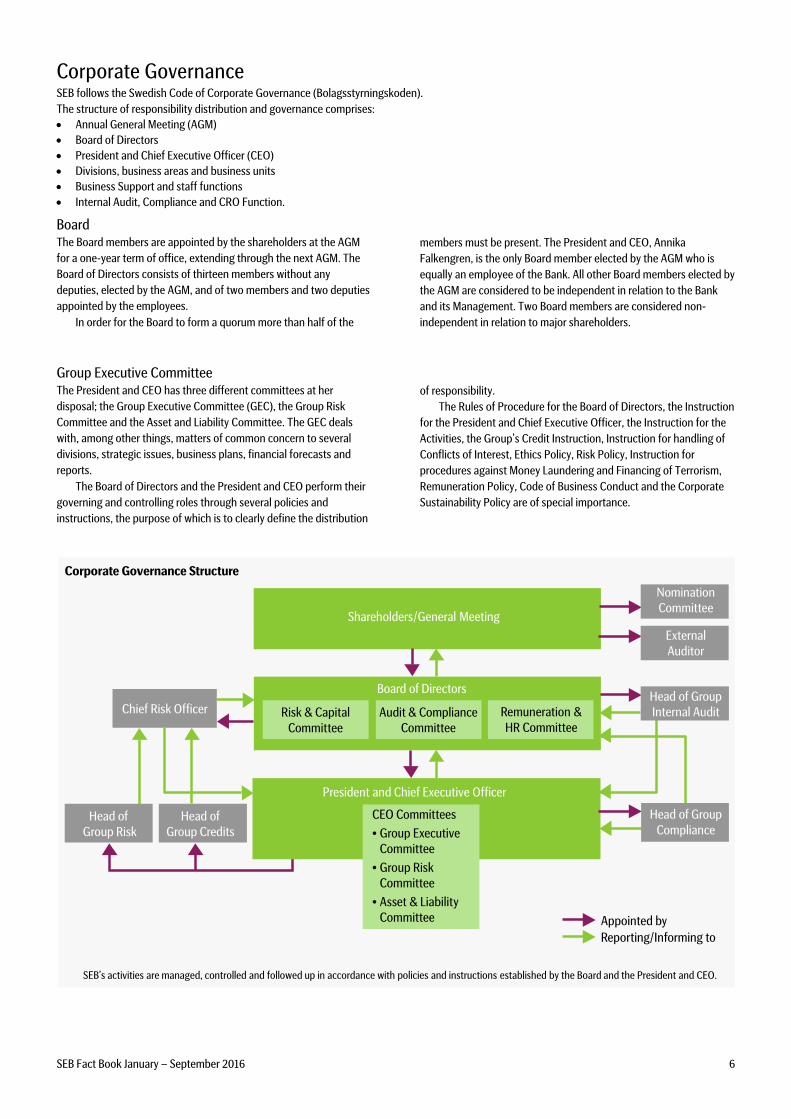
Corporate GovernanceSEB follows the Swedish Code of Corporate Governance (Bolagsstyrningskoden).
The structure of responsibility distribution and governance comprises:
Annual General Meeting (AGM)
Board of Directors
President and Chief Executive Officer (CEO)
Divisions, business areas and business units
Business Support and staff functions
Internal Audit, Compliance and CRO Function.
BoardThe Board members are appointed by the shareholders at the AGM
for a one-year term of office, extending through the next AGM. The
Board of Directors consists of thirteen members without any
deputies, elected by the AGM, and of two members and two deputies
appointed by the employees.
In order for the Board to form a quorum more than half of the
members must be present. The President and CEO, Annika
Falkengren, is the only Board member elected by the AGM who is
equally an employee of the Bank. All other Board members elected by
the AGM are considered to be independent in relation to the Bank
and its Management. Two Board members are considered non-
independent in relation to major shareholders.
Group Executive Committee The President and CEO has three different committees at her
disposal; the Group Executive Committee (GEC), the Group Risk
Committee and the Asset and Liability Committee. The GEC deals
with, among other things, matters of common concern to several
divisions, strategic issues, business plans, financial forecasts and
reports.
The Board of Directors and the President and CEO perform their
governing and controlling roles through several policies and
instructions, the purpose of which is to clearly define the distribution
of responsibility.
The Rules of Procedure for the Board of Directors, the Instruction
for the President and Chief Executive Officer, the Instruction for the
Activities, the Group’s Credit Instruction, Instruction for handling of
Conflicts of Interest, Ethics Policy, Risk Policy, Instruction for
procedures against Money Laundering and Financing of Terrorism,
Remuneration Policy, Code of Business Conduct and the Corporate
Sustainability Policy are of special importance.
Corporate Governance Structure
President and Chief Executive Officer
Risk & Capital
Committee
Audit & Compliance
Committee
Board of Directors
Appointed by
Chief Risk Officer
SEB’s activities are managed, controlled and followed up in accordance with policies and instructions established by the Board and the President and CEO.
Reporting/Informing to
Shareholders/General Meeting
CEO Committees
• Group Executive
Committee
• Group Risk
Committee
• Asset & Liability
Committee
Remuneration &
HR Committee
Nomination
Committee
External
Auditor
Head of Group
Compliance
Head of Group
Internal Audit
Head of
Group Credits
Head of
Group Risk
SEB Fact Book January – September 2016 7
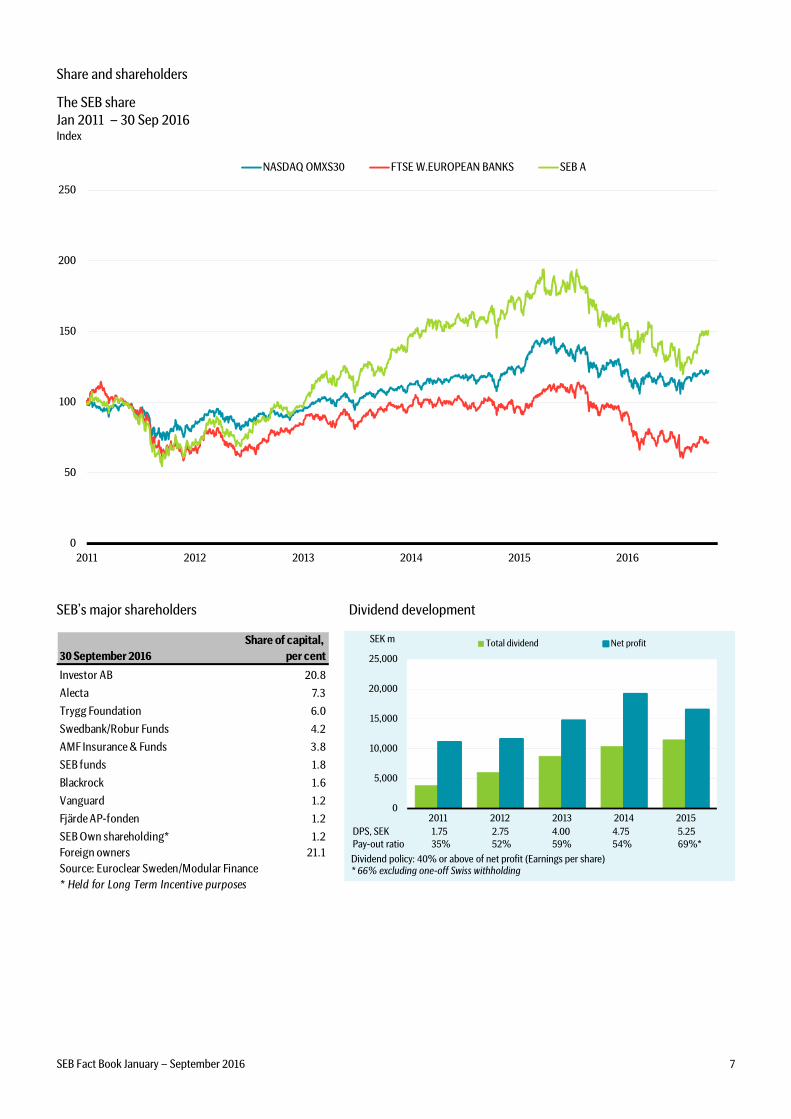
Share and shareholders
The SEB share
Jan 2011 – 30 Sep 2016 Index
0
50
100
150
200
250
2011 2012 2013 2014 2015 2016
NASDAQ OMXS30 FTSE W.EUROPEAN BANKS SEB A
SEB’s major shareholders Dividend development
Share of capital,
30 September 2016 per cent
Investor AB 20.8
Alecta 7.3
Trygg Foundation 6.0
Swedbank/Robur Funds 4.2
AMF Insurance & Funds 3.8
SEB funds 1.8
Blackrock 1.6
Vanguard 1.2
Fjärde AP-fonden 1.2
SEB Own shareholding* 1.2
Foreign owners 21.1
Source: Euroclear Sweden/Modular Finance
* Held for Long Term Incentive purposes
0
5,000
10,000
15,000
20,000
25,000
2011 2012 2013 2014 2015
Total dividend Net profit
DPS, SEK 1.75 2.75 4.00 4.75 5.25
Pay-out ratio 35% 52% 59% 54% 69%*
Dividend policy: 40% or above of net profit (Earnings per share)
SEK m
* 66% excluding one-off Swiss withholding
SEB Fact Book January – September 2016 8
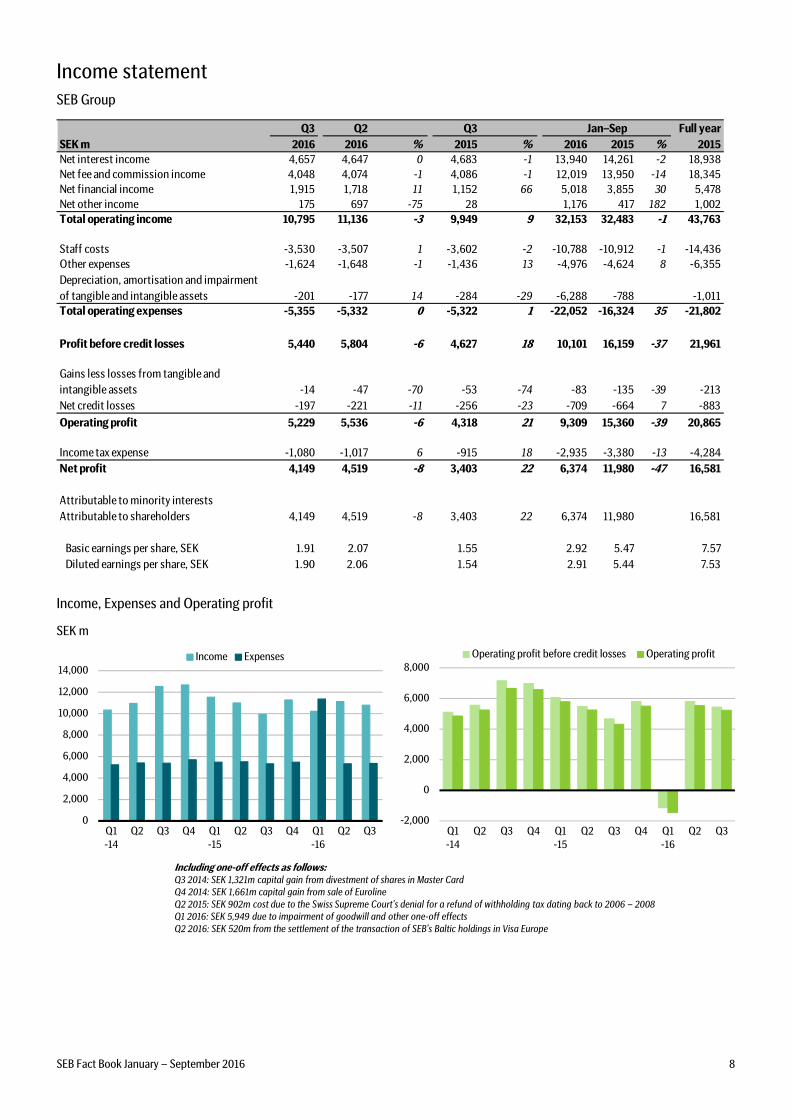
Income statement
SEB Group
Q3 Q2 Q3 Full year
SEK m 2016 2016 % 2015 % 2016 2015 % 2015
Net interest income 4,657 4,647 0 4,683 -1 13,940 14,261 -2 18,938
Net fee and commission income 4,048 4,074 -1 4,086 -1 12,019 13,950 -14 18,345
Net financial income 1,915 1,718 11 1,152 66 5,018 3,855 30 5,478
Net other income 175 697 -75 28 1,176 417 182 1,002
Total operating income 10,795 11,136 -3 9,949 9 32,153 32,483 -1 43,763
Staff costs -3,530 -3,507 1 -3,602 -2 -10,788 -10,912 -1 -14,436
Other expenses -1,624 -1,648 -1 -1,436 13 -4,976 -4,624 8 -6,355
Depreciation, amortisation and impairment
of tangible and intangible assets -201 -177 14 -284 -29 -6,288 -788 -1,011
Total operating expenses -5,355 -5,332 0 -5,322 1 -22,052 -16,324 35 -21,802
Profit before credit losses 5,440 5,804 -6 4,627 18 10,101 16,159 -37 21,961
Gains less losses from tangible and
intangible assets -14 -47 -70 -53 -74 -83 -135 -39 -213
Net credit losses -197 -221 -11 -256 -23 -709 -664 7 -883
Operating profit 5,229 5,536 -6 4,318 21 9,309 15,360 -39 20,865
Income tax expense -1,080 -1,017 6 -915 18 -2,935 -3,380 -13 -4,284
Net profit 4,149 4,519 -8 3,403 22 6,374 11,980 -47 16,581
Attributable to minority interests
Attributable to shareholders 4,149 4,519 -8 3,403 22 6,374 11,980 16,581
Basic earnings per share, SEK 1.91 2.07 1.55 2.92 5.47 7.57
Diluted earnings per share, SEK 1.90 2.06 1.54 2.91 5.44 7.53
Jan–Sep
Income, Expenses and Operating profit
SEK m
0
2,000
4,000
6,000
8,000
10,000
12,000
14,000
Q1
-14
Q2 Q3 Q4 Q1
-15
Q2 Q3 Q4 Q1
-16
Q2 Q3
Income Expenses
-2,000
0
2,000
4,000
6,000
8,000
Q1
-14
Q2 Q3 Q4 Q1
-15
Q2 Q3 Q4 Q1
-16
Q2 Q3
Operating profit before credit losses Operating profit
Including one-off effects as follows:Q3 2014: SEK 1,321m capital gain from divestment of shares in Master Card
Q4 2014: SEK 1,661m capital gain from sale of Euroline
Q2 2015: SEK 902m cost due to the Swiss Supreme Court's denial for a refund of withholding tax dating back to 2006 – 2008
Q1 2016: SEK 5,949 due to impairment of goodwill and other one-off effects
Q2 2016: SEK 520m from the settlement of the transaction of SEB’s Baltic holdings in Visa Europe
SEB Fact Book January – September 2016 9
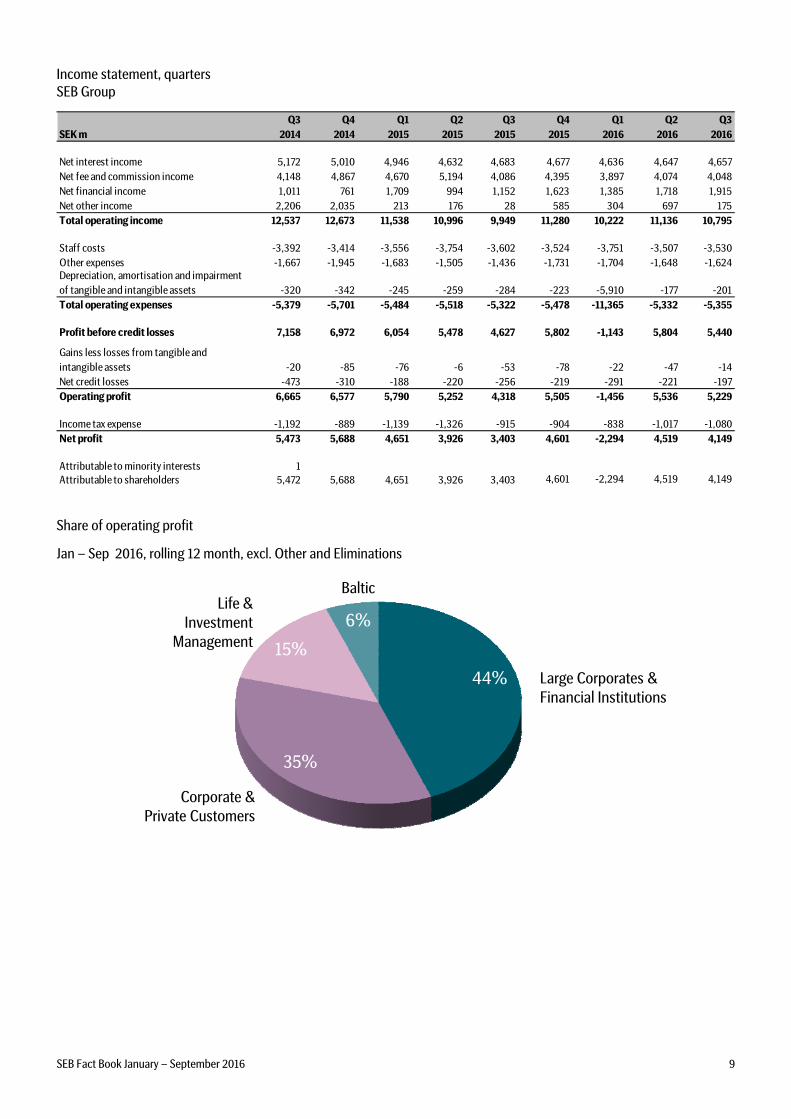
Income statement, quarters
SEB Group
SEK m
Q3
2014
Q4
2014
Q1
2015
Q2
2015
Q3
2015
Q4
2015
Q1
2016
Q2
2016
Q3
2016
Net interest income 5,172 5,010 4,946 4,632 4,683 4,677 4,636 4,647 4,657
Net fee and commission income 4,148 4,867 4,670 5,194 4,086 4,395 3,897 4,074 4,048
Net financial income 1,011 761 1,709 994 1,152 1,623 1,385 1,718 1,915
Net other income 2,206 2,035 213 176 28 585 304 697 175
Total operating income 12,537 12,673 11,538 10,996 9,949 11,280 10,222 11,136 10,795
Staff costs -3,392 -3,414 -3,556 -3,754 -3,602 -3,524 -3,751 -3,507 -3,530
Other expenses -1,667 -1,945 -1,683 -1,505 -1,436 -1,731 -1,704 -1,648 -1,624Depreciation, amortisation and impairment
of tangible and intangible assets -320 -342 -245 -259 -284 -223 -5,910 -177 -201
Total operating expenses -5,379 -5,701 -5,484 -5,518 -5,322 -5,478 -11,365 -5,332 -5,355
Profit before credit losses 7,158 6,972 6,054 5,478 4,627 5,802 -1,143 5,804 5,440
Gains less losses from tangible and
intangible assets -20 -85 -76 -6 -53 -78 -22 -47 -14
Net credit losses -473 -310 -188 -220 -256 -219 -291 -221 -197
Operating profit 6,665 6,577 5,790 5,252 4,318 5,505 -1,456 5,536 5,229
Income tax expense -1,192 -889 -1,139 -1,326 -915 -904 -838 -1,017 -1,080
Net profit 5,473 5,688 4,651 3,926 3,403 4,601 -2,294 4,519 4,149
Attributable to minority interests 1
Attributable to shareholders 5,472 5,688 4,651 3,926 3,403 4,601 -2,294 4,519 4,149
Share of operating profit
Jan – Sep 2016, rolling 12 month, excl. Other and Eliminations
44%
35%
15%
6%
Corporate &
Private Customers
Life &
Investment
Management
Large Corporates &
Financial Institutions
Baltic
SEB Fact Book January – September 2016 10
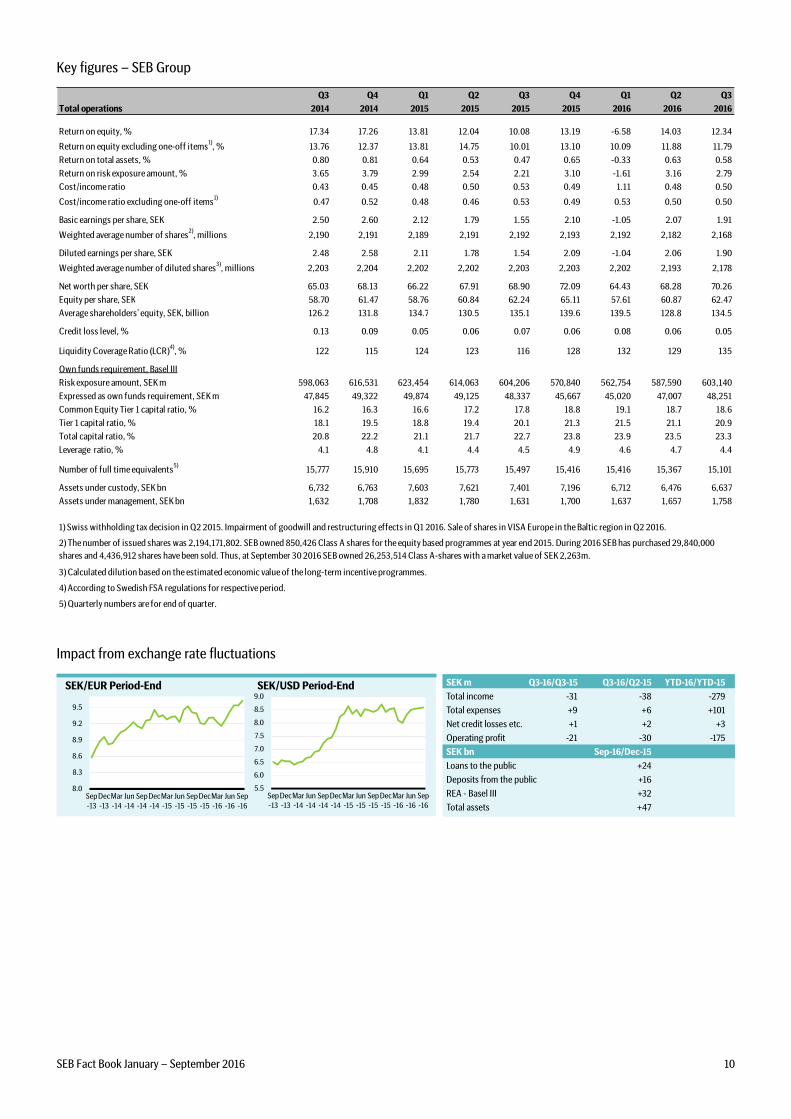
Key figures – SEB Group
Q3 Q4 Q1 Q2 Q3 Q4 Q1 Q2 Q3
Total operations 2014 2014 2015 2015 2015 2015 2016 2016 2016
Return on equity, % 17.34 17.26 13.81 12.04 10.08 13.19 -6.58 14.03 12.34
Return on equity excluding one-off items1)
, % 13.76 12.37 13.81 14.75 10.01 13.10 10.09 11.88 11.79
Return on total assets, % 0.80 0.81 0.64 0.53 0.47 0.65 -0.33 0.63 0.58
Return on risk exposure amount, % 3.65 3.79 2.99 2.54 2.21 3.10 -1.61 3.16 2.79
Cost/income ratio 0.43 0.45 0.48 0.50 0.53 0.49 1.11 0.48 0.50
Cost/income ratio excluding one-off items1)
0.47 0.52 0.48 0.46 0.53 0.49 0.53 0.50 0.50
Basic earnings per share, SEK 2.50 2.60 2.12 1.79 1.55 2.10 -1.05 2.07 1.91
Weighted average number of shares2)
, millions 2,190 2,191 2,189 2,191 2,192 2,193 2,192 2,182 2,168
Diluted earnings per share, SEK 2.48 2.58 2.11 1.78 1.54 2.09 -1.04 2.06 1.90
Weighted average number of diluted shares3)
, millions 2,203 2,204 2,202 2,202 2,203 2,203 2,202 2,193 2,178
Net worth per share, SEK 65.03 68.13 66.22 67.91 68.90 72.09 64.43 68.28 70.26
Equity per share, SEK 58.70 61.47 58.76 60.84 62.24 65.11 57.61 60.87 62.47
Average shareholders' equity, SEK, billion 126.2 131.8 134.7 130.5 135.1 139.6 139.5 128.8 134.5
Credit loss level, % 0.13 0.09 0.05 0.06 0.07 0.06 0.08 0.06 0.05
Liquidity Coverage Ratio (LCR)4)
, % 122 115 124 123 116 128 132 129 135
Own funds requirement, Basel III
Risk exposure amount, SEK m 598,063 616,531 623,454 614,063 604,206 570,840 562,754 587,590 603,140
Expressed as own funds requirement, SEK m 47,845 49,322 49,874 49,125 48,337 45,667 45,020 47,007 48,251
Common Equity Tier 1 capital ratio, % 16.2 16.3 16.6 17.2 17.8 18.8 19.1 18.7 18.6
Tier 1 capital ratio, % 18.1 19.5 18.8 19.4 20.1 21.3 21.5 21.1 20.9
Total capital ratio, % 20.8 22.2 21.1 21.7 22.7 23.8 23.9 23.5 23.3
Leverage ratio, % 4.1 4.8 4.1 4.4 4.5 4.9 4.6 4.7 4.4
Number of full time equivalents5)
15,777 15,910 15,695 15,773 15,497 15,416 15,416 15,367 15,101
Assets under custody, SEK bn 6,732 6,763 7,603 7,621 7,401 7,196 6,712 6,476 6,637
Assets under management, SEK bn 1,632 1,708 1,832 1,780 1,631 1,700 1,637 1,657 1,758
1) Swiss withholding tax decision in Q2 2015. Impairment of goodwill and restructuring effects in Q1 2016. Sale of shares in VISA Europe in the Baltic region in Q2 2016.
2) The number of issued shares was 2,194,171,802. SEB owned 850,426 Class A shares for the equity based programmes at year end 2015. During 2016 SEB has purchased 29,840,000
shares and 4,436,912 shares have been sold. Thus, at September 30 2016 SEB owned 26,253,514 Class A-shares with a market value of SEK 2,263m.
3) Calculated dilution based on the estimated economic value of the long-term incentive programmes.
4) According to Swedish FSA regulations for respective period.
5) Quarterly numbers are for end of quarter.
Impact from exchange rate fluctuations
SEK/EUR Period-End SEK/USD Period-End
5.5
6.0
6.5
7.0
7.5
8.0
8.5
9.0
Sep
-13
Dec
-13
Mar
-14
Jun
-14
Sep
-14
Dec
-14
Mar
-15
Jun
-15
Sep
-15
Dec
-15
Mar
-16
Jun
-16
Sep
-16
8.0
8.3
8.6
8.9
9.2
9.5
Sep
-13
Dec
-13
Mar
-14
Jun
-14
Sep
-14
Dec
-14
Mar
-15
Jun
-15
Sep
-15
Dec
-15
Mar
-16
Jun
-16
Sep
-16
SEK m Q3-16/Q3-15 Q3-16/Q2-15 YTD-16/YTD-15
Total income -31 -38 -279
Total expenses +9 +6 +101
Net credit losses etc. +1 +2 +3
Operating profit -21 -30 -175
SEK bn Sep-16/Dec-15
Loans to the public +24
Deposits from the public +16
REA - Basel III +32
Total assets +47
SEB Fact Book January – September 2016 11
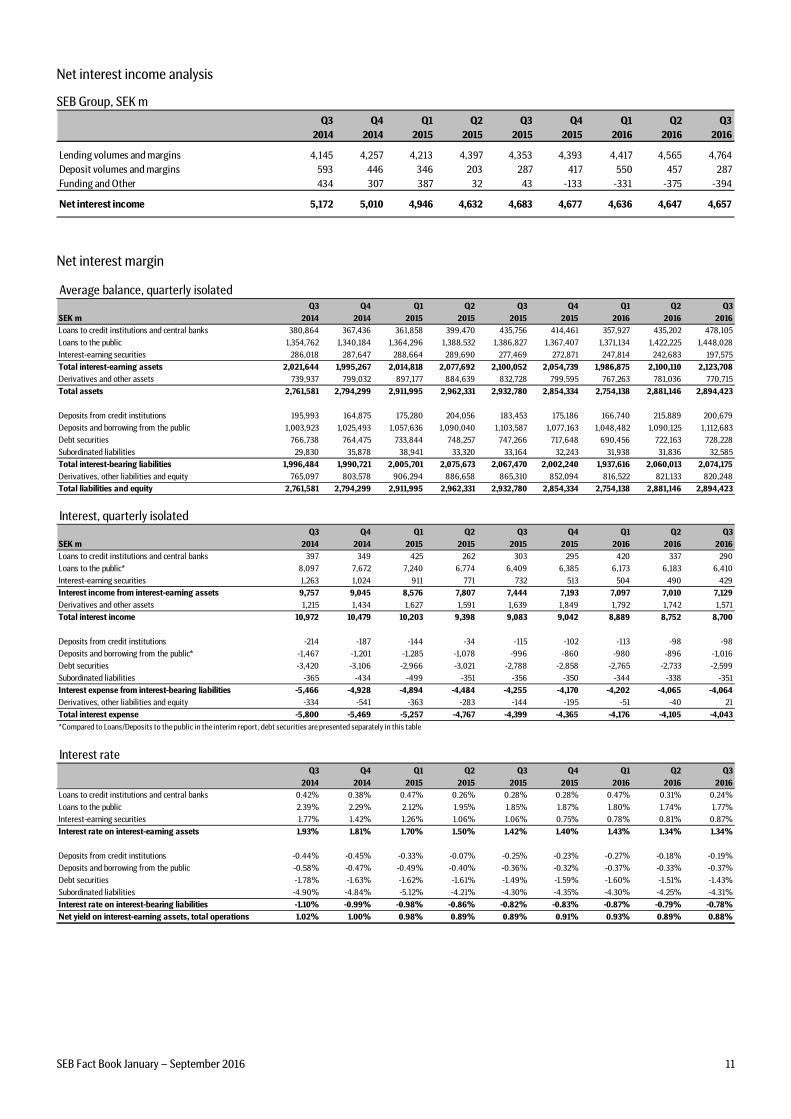
Net interest income analysis
SEB Group, SEK m
Q3
2014
Q4
2014
Q1
2015
Q2
2015
Q3
2015
Q4
2015
Q1
2016
Q2
2016
Q3
2016
Lending volumes and margins 4,145 4,257 4,213 4,397 4,353 4,393 4,417 4,565 4,764
Deposit volumes and margins 593 446 346 203 287 417 550 457 287
Funding and Other 434 307 387 32 43 -133 -331 -375 -394
Net interest income 5,172 5,010 4,946 4,632 4,683 4,677 4,636 4,647 4,657
Net interest margin
Average balance, quarterly isolatedQ3 Q4 Q1 Q2 Q3 Q4 Q1 Q2 Q3
SEK m 2014 2014 2015 2015 2015 2015 2016 2016 2016
Loans to credit institutions and central banks 380,864 367,436 361,858 399,470 435,756 414,461 357,927 435,202 478,105
Loans to the public 1,354,762 1,340,184 1,364,296 1,388,532 1,386,827 1,367,407 1,371,134 1,422,225 1,448,028
Interest-earning securities 286,018 287,647 288,664 289,690 277,469 272,871 247,814 242,683 197,575
Total interest-earning assets 2,021,644 1,995,267 2,014,818 2,077,692 2,100,052 2,054,739 1,986,875 2,100,110 2,123,708
Derivatives and other assets 739,937 799,032 897,177 884,639 832,728 799,595 767,263 781,036 770,715
Total assets 2,761,581 2,794,299 2,911,995 2,962,331 2,932,780 2,854,334 2,754,138 2,881,146 2,894,423
Deposits from credit institutions 195,993 164,875 175,280 204,056 183,453 175,186 166,740 215,889 200,679
Deposits and borrowing from the public 1,003,923 1,025,493 1,057,636 1,090,040 1,103,587 1,077,163 1,048,482 1,090,125 1,112,683
Debt securities 766,738 764,475 733,844 748,257 747,266 717,648 690,456 722,163 728,228
Subordinated liabilities 29,830 35,878 38,941 33,320 33,164 32,243 31,938 31,836 32,585
Total interest-bearing liabilities 1,996,484 1,990,721 2,005,701 2,075,673 2,067,470 2,002,240 1,937,616 2,060,013 2,074,175
Derivatives, other liabilities and equity 765,097 803,578 906,294 886,658 865,310 852,094 816,522 821,133 820,248
Total liabilities and equity 2,761,581 2,794,299 2,911,995 2,962,331 2,932,780 2,854,334 2,754,138 2,881,146 2,894,423
Interest, quarterly isolatedQ3 Q4 Q1 Q2 Q3 Q4 Q1 Q2 Q3
SEK m 2014 2014 2015 2015 2015 2015 2016 2016 2016
Loans to credit institutions and central banks 397 349 425 262 303 295 420 337 290
Loans to the public* 8,097 7,672 7,240 6,774 6,409 6,385 6,173 6,183 6,410
Interest-earning securities 1,263 1,024 911 771 732 513 504 490 429
Interest income from interest-earning assets 9,757 9,045 8,576 7,807 7,444 7,193 7,097 7,010 7,129
Derivatives and other assets 1,215 1,434 1,627 1,591 1,639 1,849 1,792 1,742 1,571
Total interest income 10,972 10,479 10,203 9,398 9,083 9,042 8,889 8,752 8,700
Deposits from credit institutions -214 -187 -144 -34 -115 -102 -113 -98 -98
Deposits and borrowing from the public* -1,467 -1,201 -1,285 -1,078 -996 -860 -980 -896 -1,016
Debt securities -3,420 -3,106 -2,966 -3,021 -2,788 -2,858 -2,765 -2,733 -2,599
Subordinated liabilities -365 -434 -499 -351 -356 -350 -344 -338 -351
Interest expense from interest-bearing liabilities -5,466 -4,928 -4,894 -4,484 -4,255 -4,170 -4,202 -4,065 -4,064
Derivatives, other liabilities and equity -334 -541 -363 -283 -144 -195 -51 -40 21
Total interest expense -5,800 -5,469 -5,257 -4,767 -4,399 -4,365 -4,176 -4,105 -4,043
*Compared to Loans/Deposits to the public in the interim report, debt securities are presented separately in this table
Interest rateQ3 Q4 Q1 Q2 Q3 Q4 Q1 Q2 Q3
2014 2014 2015 2015 2015 2015 2016 2016 2016
Loans to credit institutions and central banks 0.42% 0.38% 0.47% 0.26% 0.28% 0.28% 0.47% 0.31% 0.24%
Loans to the public 2.39% 2.29% 2.12% 1.95% 1.85% 1.87% 1.80% 1.74% 1.77%
Interest-earning securities 1.77% 1.42% 1.26% 1.06% 1.06% 0.75% 0.78% 0.81% 0.87%
Interest rate on interest-earning assets 1.93% 1.81% 1.70% 1.50% 1.42% 1.40% 1.43% 1.34% 1.34%
Deposits from credit institutions -0.44% -0.45% -0.33% -0.07% -0.25% -0.23% -0.27% -0.18% -0.19%
Deposits and borrowing from the public -0.58% -0.47% -0.49% -0.40% -0.36% -0.32% -0.37% -0.33% -0.37%
Debt securities -1.78% -1.63% -1.62% -1.61% -1.49% -1.59% -1.60% -1.51% -1.43%
Subordinated liabilities -4.90% -4.84% -5.12% -4.21% -4.30% -4.35% -4.30% -4.25% -4.31%
Interest rate on interest-bearing liabilities -1.10% -0.99% -0.98% -0.86% -0.82% -0.83% -0.87% -0.79% -0.78%
Net yield on interest-earning assets, total operations 1.02% 1.00% 0.98% 0.89% 0.89% 0.91% 0.93% 0.89% 0.88%
SEB Fact Book January – September 2016 12
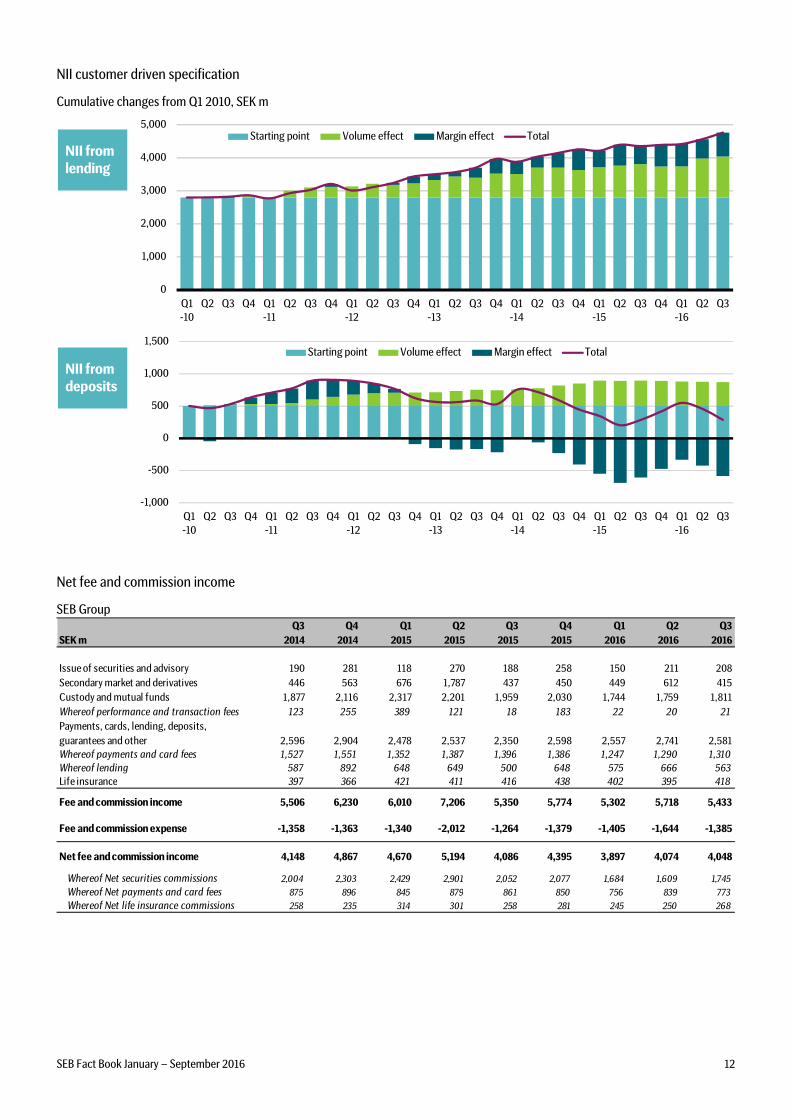
NII customer driven specification
Cumulative changes from Q1 2010, SEK m
NII from deposits
0
1,000
2,000
3,000
4,000
5,000
Q1-10
Q2 Q3 Q4 Q1-11
Q2 Q3 Q4 Q1-12
Q2 Q3 Q4 Q1-13
Q2 Q3 Q4 Q1-14
Q2 Q3 Q4 Q1-15
Q2 Q3 Q4 Q1-16
Q2 Q3
Starting point Volume effect Margin effect Total
NII from lending
-1,000
-500
0
500
1,000
1,500
Q1
-10
Q2 Q3 Q4 Q1
-11
Q2 Q3 Q4 Q1
-12
Q2 Q3 Q4 Q1
-13
Q2 Q3 Q4 Q1
-14
Q2 Q3 Q4 Q1
-15
Q2 Q3 Q4 Q1
-16
Q2 Q3
Starting point Volume effect Margin effect Total
Net fee and commission income
SEB Group
SEK m
Q3
2014
Q4
2014
Q1
2015
Q2
2015
Q3
2015
Q4
2015
Q1
2016
Q2
2016
Q3
2016
Issue of securities and advisory 190 281 118 270 188 258 150 211 208
Secondary market and derivatives 446 563 676 1,787 437 450 449 612 415
Custody and mutual funds 1,877 2,116 2,317 2,201 1,959 2,030 1,744 1,759 1,811
Whereof performance and transaction fees 123 255 389 121 18 183 22 20 21
Payments, cards, lending, deposits,
guarantees and other 2,596 2,904 2,478 2,537 2,350 2,598 2,557 2,741 2,581
Whereof payments and card fees 1,527 1,551 1,352 1,387 1,396 1,386 1,247 1,290 1,310
Whereof lending 587 892 648 649 500 648 575 666 563
Life insurance 397 366 421 411 416 438 402 395 418
Fee and commission income 5,506 6,230 6,010 7,206 5,350 5,774 5,302 5,718 5,433
Fee and commission expense -1,358 -1,363 -1,340 -2,012 -1,264 -1,379 -1,405 -1,644 -1,385
Net fee and commission income 4,148 4,867 4,670 5,194 4,086 4,395 3,897 4,074 4,048
Whereof Net securities commissions 2,004 2,303 2,429 2,901 2,052 2,077 1,684 1,609 1,745
Whereof Net payments and card fees 875 896 845 879 861 850 756 839 773
Whereof Net life insurance commissions 258 235 314 301 258 281 245 250 268
SEB Fact Book January – September 2016 13
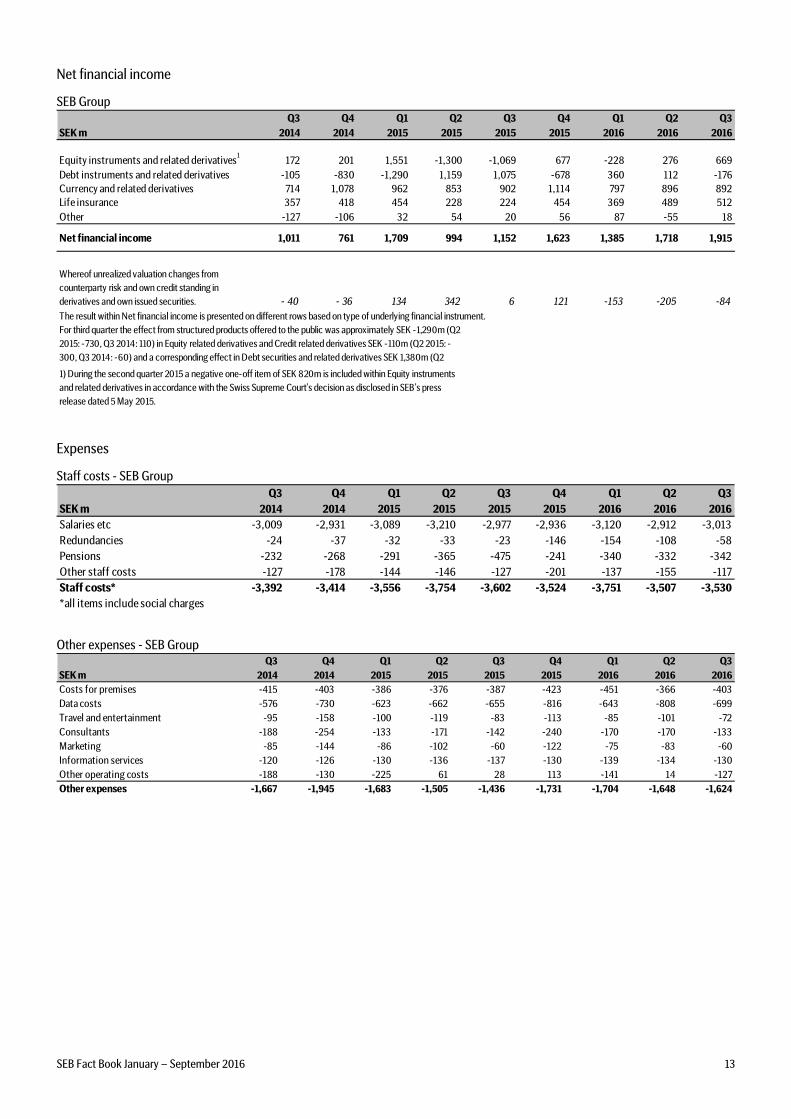
Net financial income
SEB Group
SEK m
Q3
2014
Q4
2014
Q1
2015
Q2
2015
Q3
2015
Q4
2015
Q1
2016
Q2
2016
Q3
2016
Equity instruments and related derivatives1
172 201 1,551 -1,300 -1,069 677 -228 276 669
Debt instruments and related derivatives -105 -830 -1,290 1,159 1,075 -678 360 112 -176
Currency and related derivatives 714 1,078 962 853 902 1,114 797 896 892
Life insurance 357 418 454 228 224 454 369 489 512
Other -127 -106 32 54 20 56 87 -55 18
Net financial income 1,011 761 1,709 994 1,152 1,623 1,385 1,718 1,915
Whereof unrealized valuation changes from
counterparty risk and own credit standing in
derivatives and own issued securities. - 40 - 36 134 342 6 121 -153 -205 -84
The result within Net financial income is presented on different rows based on type of underlying financial instrument.
For third quarter the effect from structured products offered to the public was approximately SEK -1,290m (Q2
2015: -730, Q3 2014: 110) in Equity related derivatives and Credit related derivatives SEK -110m (Q2 2015: -
300, Q3 2014: -60) and a corresponding effect in Debt securities and related derivatives SEK 1,380m (Q2
1) During the second quarter 2015 a negative one-off item of SEK 820m is included within Equity instruments
and related derivatives in accordance with the Swiss Supreme Court's decision as disclosed in SEB's press
release dated 5 May 2015.
Expenses
Staff costs - SEB Group
Q3 Q4 Q1 Q2 Q3 Q4 Q1 Q2 Q3
SEK m 2014 2014 2015 2015 2015 2015 2016 2016 2016
Salaries etc -3,009 -2,931 -3,089 -3,210 -2,977 -2,936 -3,120 -2,912 -3,013
Redundancies -24 -37 -32 -33 -23 -146 -154 -108 -58
Pensions -232 -268 -291 -365 -475 -241 -340 -332 -342
Other staff costs -127 -178 -144 -146 -127 -201 -137 -155 -117
Staff costs* -3,392 -3,414 -3,556 -3,754 -3,602 -3,524 -3,751 -3,507 -3,530
*all items include social charges
Other expenses - SEB Group Q3 Q4 Q1 Q2 Q3 Q4 Q1 Q2 Q3
SEK m 2014 2014 2015 2015 2015 2015 2016 2016 2016
Costs for premises -415 -403 -386 -376 -387 -423 -451 -366 -403
Data costs -576 -730 -623 -662 -655 -816 -643 -808 -699
Travel and entertainment -95 -158 -100 -119 -83 -113 -85 -101 -72
Consultants -188 -254 -133 -171 -142 -240 -170 -170 -133
Marketing -85 -144 -86 -102 -60 -122 -75 -83 -60
Information services -120 -126 -130 -136 -137 -130 -139 -134 -130
Other operating costs -188 -130 -225 61 28 113 -141 14 -127
Other expenses -1,667 -1,945 -1,683 -1,505 -1,436 -1,731 -1,704 -1,648 -1,624
SEB Fact Book January – September 2016 14
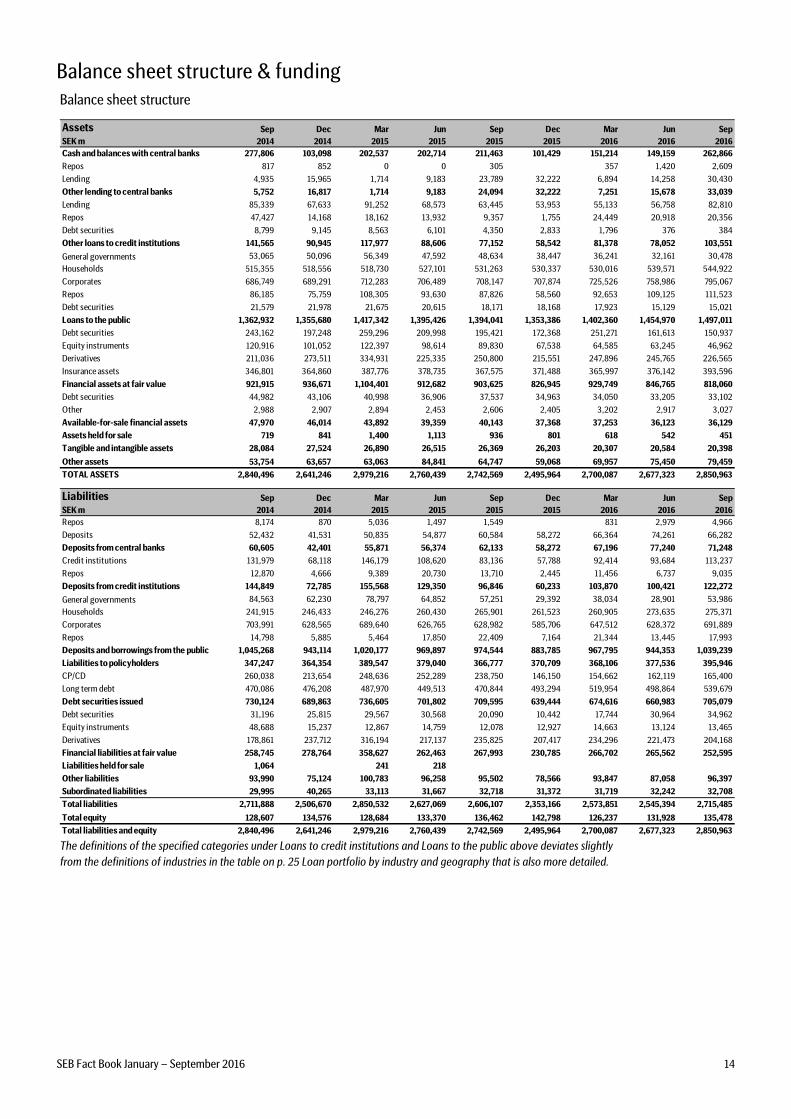
Balance sheet structure & funding
Balance sheet structure
AssetsSEK m
Sep
2014
Dec
2014
Mar
2015
Jun
2015
Sep
2015
Dec
2015
Mar
2016
Jun
2016
Sep
2016
Cash and balances with central banks 277,806 103,098 202,537 202,714 211,463 101,429 151,214 149,159 262,866
Repos 817 852 0 0 305 357 1,420 2,609
Lending 4,935 15,965 1,714 9,183 23,789 32,222 6,894 14,258 30,430
Other lending to central banks 5,752 16,817 1,714 9,183 24,094 32,222 7,251 15,678 33,039
Lending 85,339 67,633 91,252 68,573 63,445 53,953 55,133 56,758 82,810
Repos 47,427 14,168 18,162 13,932 9,357 1,755 24,449 20,918 20,356
Debt securities 8,799 9,145 8,563 6,101 4,350 2,833 1,796 376 384
Other loans to credit institutions 141,565 90,945 117,977 88,606 77,152 58,542 81,378 78,052 103,551
General governments 53,065 50,096 56,349 47,592 48,634 38,447 36,241 32,161 30,478
Households 515,355 518,556 518,730 527,101 531,263 530,337 530,016 539,571 544,922
Corporates 686,749 689,291 712,283 706,489 708,147 707,874 725,526 758,986 795,067
Repos 86,185 75,759 108,305 93,630 87,826 58,560 92,653 109,125 111,523
Debt securities 21,579 21,978 21,675 20,615 18,171 18,168 17,923 15,129 15,021
Loans to the public 1,362,932 1,355,680 1,417,342 1,395,426 1,394,041 1,353,386 1,402,360 1,454,970 1,497,011
Debt securities 243,162 197,248 259,296 209,998 195,421 172,368 251,271 161,613 150,937
Equity instruments 120,916 101,052 122,397 98,614 89,830 67,538 64,585 63,245 46,962
Derivatives 211,036 273,511 334,931 225,335 250,800 215,551 247,896 245,765 226,565
Insurance assets 346,801 364,860 387,776 378,735 367,575 371,488 365,997 376,142 393,596
Financial assets at fair value 921,915 936,671 1,104,401 912,682 903,625 826,945 929,749 846,765 818,060
Debt securities 44,982 43,106 40,998 36,906 37,537 34,963 34,050 33,205 33,102
Other 2,988 2,907 2,894 2,453 2,606 2,405 3,202 2,917 3,027
Available-for-sale financial assets 47,970 46,014 43,892 39,359 40,143 37,368 37,253 36,123 36,129
Assets held for sale 719 841 1,400 1,113 936 801 618 542 451
Tangible and intangible assets 28,084 27,524 26,890 26,515 26,369 26,203 20,307 20,584 20,398
Other assets 53,754 63,657 63,063 84,841 64,747 59,068 69,957 75,450 79,459
TOTAL ASSETS 2,840,496 2,641,246 2,979,216 2,760,439 2,742,569 2,495,964 2,700,087 2,677,323 2,850,963
LiabilitiesSEK m
Sep
2014
Dec
2014
Mar
2015
Jun
2015
Sep
2015
Dec
2015
Mar
2016
Jun
2016
Sep
2016
Repos 8,174 870 5,036 1,497 1,549 831 2,979 4,966
Deposits 52,432 41,531 50,835 54,877 60,584 58,272 66,364 74,261 66,282
Deposits from central banks 60,605 42,401 55,871 56,374 62,133 58,272 67,196 77,240 71,248
Credit institutions 131,979 68,118 146,179 108,620 83,136 57,788 92,414 93,684 113,237
Repos 12,870 4,666 9,389 20,730 13,710 2,445 11,456 6,737 9,035
Deposits from credit institutions 144,849 72,785 155,568 129,350 96,846 60,233 103,870 100,421 122,272
General governments 84,563 62,230 78,797 64,852 57,251 29,392 38,034 28,901 53,986
Households 241,915 246,433 246,276 260,430 265,901 261,523 260,905 273,635 275,371
Corporates 703,991 628,565 689,640 626,765 628,982 585,706 647,512 628,372 691,889
Repos 14,798 5,885 5,464 17,850 22,409 7,164 21,344 13,445 17,993
Deposits and borrowings from the public 1,045,268 943,114 1,020,177 969,897 974,544 883,785 967,795 944,353 1,039,239
Liabilities to policyholders 347,247 364,354 389,547 379,040 366,777 370,709 368,106 377,536 395,946
CP/CD 260,038 213,654 248,636 252,289 238,750 146,150 154,662 162,119 165,400
Long term debt 470,086 476,208 487,970 449,513 470,844 493,294 519,954 498,864 539,679
Debt securities issued 730,124 689,863 736,605 701,802 709,595 639,444 674,616 660,983 705,079
Debt securities 31,196 25,815 29,567 30,568 20,090 10,442 17,744 30,964 34,962
Equity instruments 48,688 15,237 12,867 14,759 12,078 12,927 14,663 13,124 13,465
Derivatives 178,861 237,712 316,194 217,137 235,825 207,417 234,296 221,473 204,168
Financial liabilities at fair value 258,745 278,764 358,627 262,463 267,993 230,785 266,702 265,562 252,595
Liabilities held for sale 1,064 241 218
Other liabilities 93,990 75,124 100,783 96,258 95,502 78,566 93,847 87,058 96,397
Subordinated liabilities 29,995 40,265 33,113 31,667 32,718 31,372 31,719 32,242 32,708
Total liabilities 2,711,888 2,506,670 2,850,532 2,627,069 2,606,107 2,353,166 2,573,851 2,545,394 2,715,485
Total equity 128,607 134,576 128,684 133,370 136,462 142,798 126,237 131,928 135,478
Total liabilities and equity 2,840,496 2,641,246 2,979,216 2,760,439 2,742,569 2,495,964 2,700,087 2,677,323 2,850,963 The definitions of the specified categories under Loans to credit institutions and Loans to the public above deviates slightly
from the definitions of industries in the table on p. 25 Loan portfolio by industry and geography that is also more detailed.
SEB Fact Book January – September 2016 15
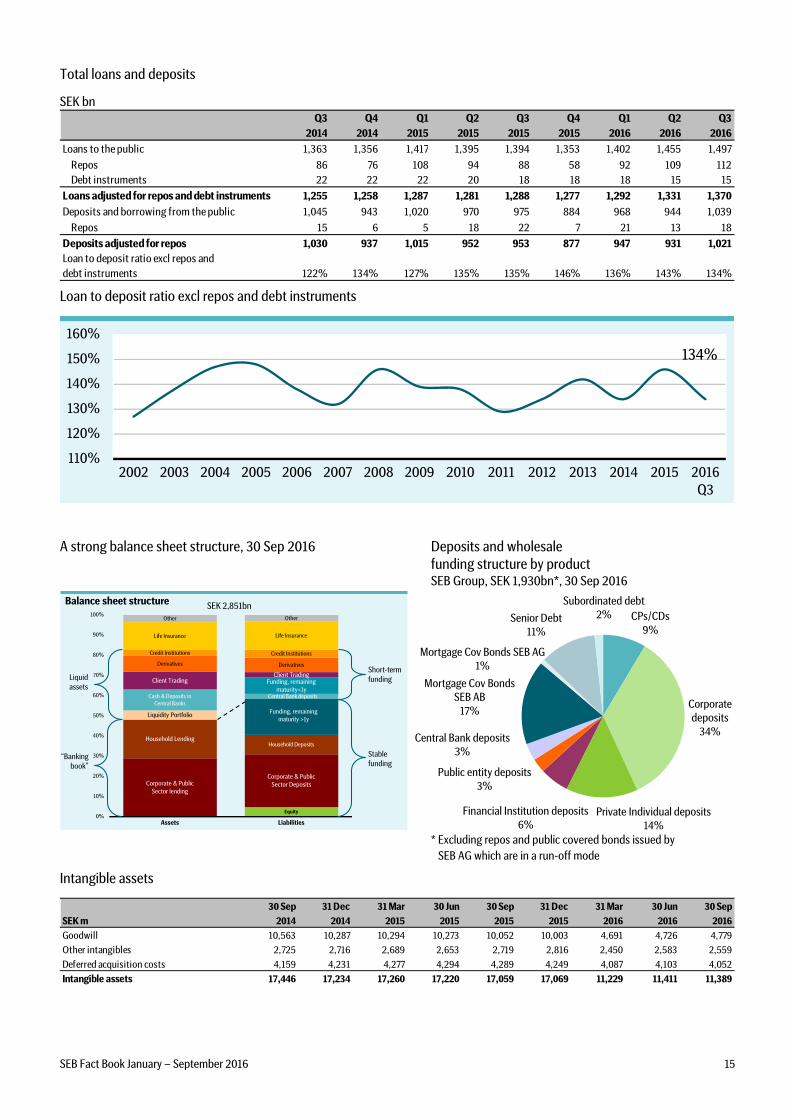
Total loans and deposits
SEK bn
Q3
2014
Q4
2014
Q1
2015
Q2
2015
Q3
2015
Q4
2015
Q1
2016
Q2
2016
Q3
2016
Loans to the public 1,363 1,356 1,417 1,395 1,394 1,353 1,402 1,455 1,497
Repos 86 76 108 94 88 58 92 109 112
Debt instruments 22 22 22 20 18 18 18 15 15
Loans adjusted for repos and debt instruments 1,255 1,258 1,287 1,281 1,288 1,277 1,292 1,331 1,370
Deposits and borrowing from the public 1,045 943 1,020 970 975 884 968 944 1,039
Repos 15 6 5 18 22 7 21 13 18
Deposits adjusted for repos 1,030 937 1,015 952 953 877 947 931 1,021
Loan to deposit ratio excl repos and
debt instruments 122% 134% 127% 135% 135% 146% 136% 143% 134%
Loan to deposit ratio excl repos and debt instruments
110%
120%
130%
140%
150%
160%
2002 2003 2004 2005 2006 2007 2008 2009 2010 2011 2012 2013 2014 2015 2016
Q3
134%
A strong balance sheet structure, 30 Sep 2016 Deposits and wholesale
funding structure by product SEB Group, SEK 1,930bn*, 30 Sep 2016
Equity
Corporate & Public
Sector lending
Corporate & Public
Sector Deposits
Household LendingHousehold Deposits
Liquidity PortfolioFunding, remaining
maturity >1y
Cash & Deposits in
Central Banks
Central Bank deposits
Funding, remaining
maturity<1y
Client Trading Client Trading
Derivatives Derivatives
Credit Institutions Credit Institutions
Life Insurance Life Insurance
Other Other
0%
10%
20%
30%
40%
50%
60%
70%
80%
90%
100%
Assets Liabilities
Balance sheet structureSEK 2,851bn
Liquid
assets
Stable
funding
Short-term
funding
“Banking
book”
CPs/CDs
9%
Corporate
deposits
34%
Private Individual deposits
14%
Financial Institution deposits
6%
Public entity deposits
3%
Central Bank deposits
3%
Mortgage Cov Bonds
SEB AB
17%
Mortgage Cov Bonds SEB AG
1%
Senior Debt
11%
Subordinated debt
2%
* Excluding repos and public covered bonds issued by
SEB AG which are in a run-off mode
Intangible assets
30 Sep 31 Dec 31 Mar 30 Jun 30 Sep 31 Dec 31 Mar 30 Jun 30 Sep
SEK m 2014 2014 2015 2015 2015 2015 2016 2016 2016
Goodwill 10,563 10,287 10,294 10,273 10,052 10,003 4,691 4,726 4,779
Other intangibles 2,725 2,716 2,689 2,653 2,719 2,816 2,450 2,583 2,559
Deferred acquisition costs 4,159 4,231 4,277 4,294 4,289 4,249 4,087 4,103 4,052
Intangible assets 17,446 17,234 17,260 17,220 17,059 17,069 11,229 11,411 11,389
SEB Fact Book January – September 2016 16
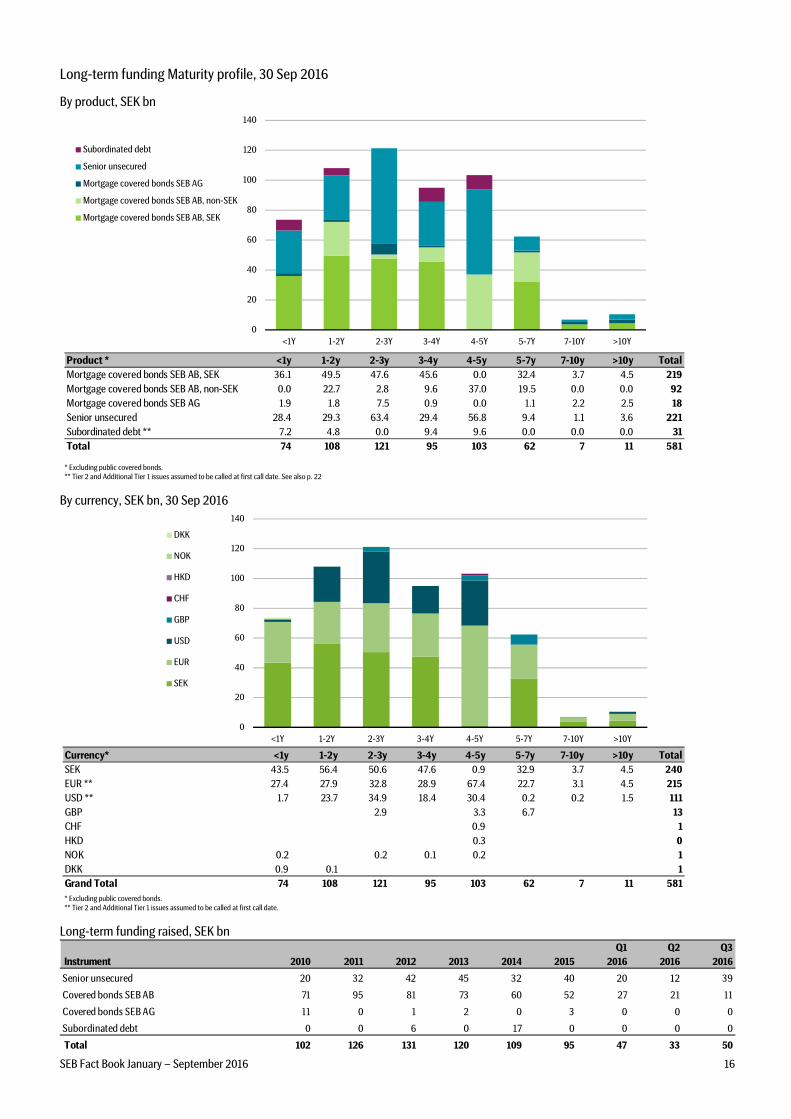
Long-term funding Maturity profile, 30 Sep 2016
By product, SEK bn
0
20
40
60
80
100
120
140
<1Y 1-2Y 2-3Y 3-4Y 4-5Y 5-7Y 7-10Y >10Y
Subordinated debt
Senior unsecured
Mortgage covered bonds SEB AG
Mortgage covered bonds SEB AB, non-SEK
Mortgage covered bonds SEB AB, SEK
* Excluding public covered bonds.
** Tier 2 and Additional Tier 1 issues assumed to be called at first call date. See also p. 22
Product * <1y 1-2y 2-3y 3-4y 4-5y 5-7y 7-10y >10y Total
Mortgage covered bonds SEB AB, SEK 36.1 49.5 47.6 45.6 0.0 32.4 3.7 4.5 219
Mortgage covered bonds SEB AB, non-SEK 0.0 22.7 2.8 9.6 37.0 19.5 0.0 0.0 92
Mortgage covered bonds SEB AG 1.9 1.8 7.5 0.9 0.0 1.1 2.2 2.5 18
Senior unsecured 28.4 29.3 63.4 29.4 56.8 9.4 1.1 3.6 221
Subordinated debt ** 7.2 4.8 0.0 9.4 9.6 0.0 0.0 0.0 31
Total 74 108 121 95 103 62 7 11 581
By currency, SEK bn, 30 Sep 2016
0
20
40
60
80
100
120
140
<1Y 1-2Y 2-3Y 3-4Y 4-5Y 5-7Y 7-10Y >10Y
DKK
NOK
HKD
CHF
GBP
USD
EUR
SEK
Currency* <1y 1-2y 2-3y 3-4y 4-5y 5-7y 7-10y >10y Total
SEK 43.5 56.4 50.6 47.6 0.9 32.9 3.7 4.5 240
EUR ** 27.4 27.9 32.8 28.9 67.4 22.7 3.1 4.5 215
USD ** 1.7 23.7 34.9 18.4 30.4 0.2 0.2 1.5 111
GBP 2.9 3.3 6.7 13
CHF 0.9 1
HKD 0.3 0
NOK 0.2 0.2 0.1 0.2 1
DKK 0.9 0.1 1
Grand Total 74 108 121 95 103 62 7 11 581
* Excluding public covered bonds.
** Tier 2 and Additional Tier 1 issues assumed to be called at first call date.
Long-term funding raised, SEK bn
Instrument 2010 2011 2012 2013 2014 2015
Q1
2016
Q2
2016
Q3
2016
Senior unsecured 20 32 42 45 32 40 20 12 39
Covered bonds SEB AB 71 95 81 73 60 52 27 21 11
Covered bonds SEB AG 11 0 1 2 0 3 0 0 0
Subordinated debt 0 0 6 0 17 0 0 0 0
Total 102 126 131 120 109 95 47 33 50
SEB Fact Book January – September 2016 17
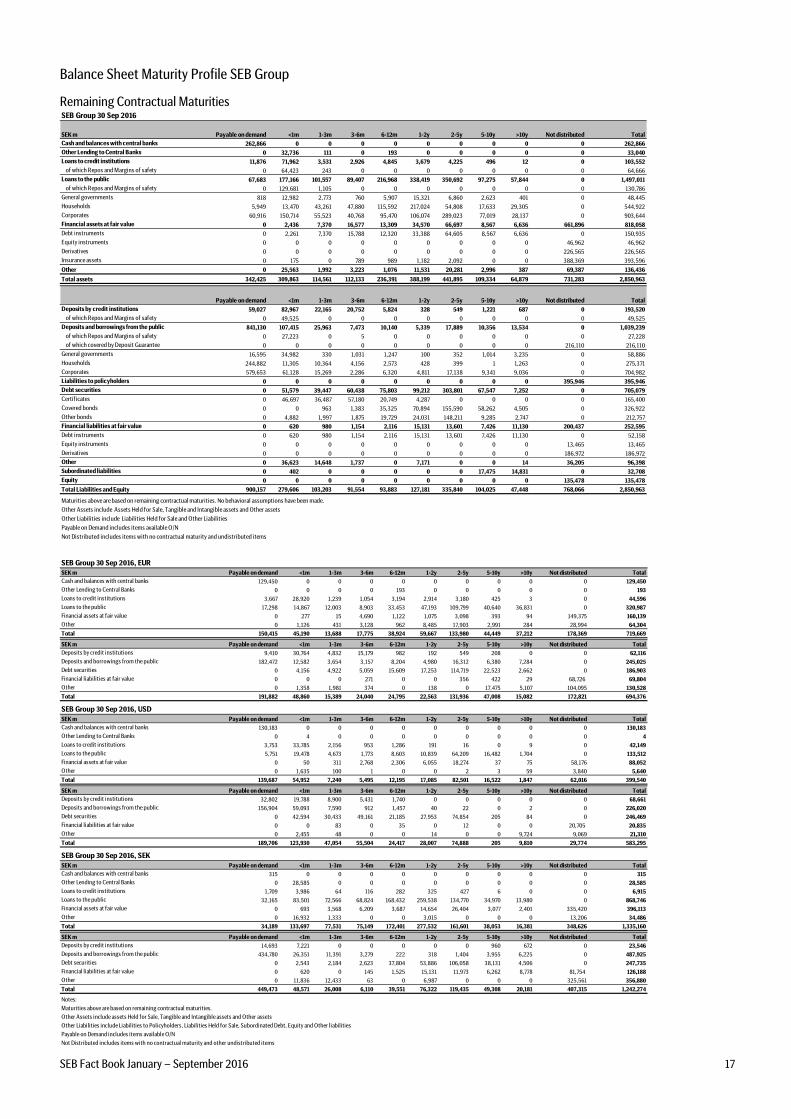
Balance Sheet Maturity Profile SEB Group
Remaining Contractual Maturities SEB Group 30 Sep 2016
SEK m Payable on demand <1m 1-3m 3-6m 6-12m 1-2y 2-5y 5-10y >10y Not distributed Total
Cash and balances with central banks 262,866 0 0 0 0 0 0 0 0 0 262,866
Other Lending to Central Banks 0 32,736 111 0 193 0 0 0 0 0 33,040
Loans to credit institutions 11,876 71,962 3,531 2,926 4,845 3,679 4,225 496 12 0 103,552
of which Repos and Margins of safety 0 64,423 243 0 0 0 0 0 0 0 64,666
Loans to the public 67,683 177,166 101,557 89,407 216,968 338,419 350,692 97,275 57,844 0 1,497,011
of which Repos and Margins of safety 0 129,681 1,105 0 0 0 0 0 0 0 130,786
General governments 818 12,982 2,773 760 5,907 15,321 6,860 2,623 401 0 48,445
Households 5,949 13,470 43,261 47,880 115,592 217,024 54,808 17,633 29,305 0 544,922
Corporates 60,916 150,714 55,523 40,768 95,470 106,074 289,023 77,019 28,137 0 903,644
Financial assets at fair value 0 2,436 7,370 16,577 13,309 34,570 66,697 8,567 6,636 661,896 818,058
Debt instruments 0 2,261 7,370 15,788 12,320 33,388 64,605 8,567 6,636 0 150,935
Equity instruments 0 0 0 0 0 0 0 0 0 46,962 46,962
Derivatives 0 0 0 0 0 0 0 0 0 226,565 226,565
Insurance assets 0 175 0 789 989 1,182 2,092 0 0 388,369 393,596
Other 0 25,563 1,992 3,223 1,076 11,531 20,281 2,996 387 69,387 136,436
Total assets 342,425 309,863 114,561 112,133 236,391 388,199 441,895 109,334 64,879 731,283 2,850,963
Payable on demand <1m 1-3m 3-6m 6-12m 1-2y 2-5y 5-10y >10y Not distributed Total
Deposits by credit institutions 59,027 82,967 22,165 20,752 5,824 328 549 1,221 687 0 193,520
of which Repos and Margins of safety 0 49,525 0 0 0 0 0 0 0 0 49,525
Deposits and borrowings from the public 841,130 107,415 25,963 7,473 10,140 5,339 17,889 10,356 13,534 0 1,039,239
of which Repos and Margins of safety 0 27,223 0 5 0 0 0 0 0 0 27,228
of which covered by Deposit Guarantee 0 0 0 0 0 0 0 0 0 216,110 216,110
General governments 16,595 34,982 330 1,031 1,247 100 352 1,014 3,235 0 58,886
Households 244,882 11,305 10,364 4,156 2,573 428 399 1 1,263 0 275,371
Corporates 579,653 61,128 15,269 2,286 6,320 4,811 17,138 9,341 9,036 0 704,982
Liabilities to policyholders 0 0 0 0 0 0 0 0 0 395,946 395,946
Debt securities 0 51,579 39,447 60,438 75,803 99,212 303,801 67,547 7,252 0 705,079
Certificates 0 46,697 36,487 57,180 20,749 4,287 0 0 0 0 165,400
Covered bonds 0 0 963 1,383 35,325 70,894 155,590 58,262 4,505 0 326,922
Other bonds 0 4,882 1,997 1,875 19,729 24,031 148,211 9,285 2,747 0 212,757
Financial liabilities at fair value 0 620 980 1,154 2,116 15,131 13,601 7,426 11,130 200,437 252,595
Debt instruments 0 620 980 1,154 2,116 15,131 13,601 7,426 11,130 0 52,158
Equity instruments 0 0 0 0 0 0 0 0 0 13,465 13,465
Derivatives 0 0 0 0 0 0 0 0 0 186,972 186,972
Other 0 36,623 14,648 1,737 0 7,171 0 0 14 36,205 96,398
Subordinated liabilities 0 402 0 0 0 0 0 17,475 14,831 0 32,708
Equity 0 0 0 0 0 0 0 0 0 135,478 135,478
Total Liabilities and Equity 900,157 279,606 103,203 91,554 93,883 127,181 335,840 104,025 47,448 768,066 2,850,963
Maturities above are based on remaining contractual maturities. No behavioral assumptions have been made.
Other Assets include Assets Held for Sale, Tangible and Intangible assets and Other assets
Other Liabilities include Liabilities Held for Sale and Other Liabilities
Payable on Demand includes items available O/N
Not Distributed includes items with no contractual maturity and undistributed items SEB Group 30 Sep 2016, EUR
SEK m Payable on demand <1m 1-3m 3-6m 6-12m 1-2y 2-5y 5-10y >10y Not distributed Total
Cash and balances with central banks 129,450 0 0 0 0 0 0 0 0 0 129,450
Other Lending to Central Banks 0 0 0 0 193 0 0 0 0 0 193
Loans to credit institutions 3,667 28,920 1,239 1,054 3,194 2,914 3,180 425 3 0 44,596
Loans to the public 17,298 14,867 12,003 8,903 33,453 47,193 109,799 40,640 36,831 0 320,987
Financial assets at fair value 0 277 15 4,690 1,122 1,075 3,098 393 94 149,375 160,139
Other 0 1,126 431 3,128 962 8,485 17,903 2,991 284 28,994 64,304
Total 150,415 45,190 13,688 17,775 38,924 59,667 133,980 44,449 37,212 178,369 719,669
SEK m Payable on demand <1m 1-3m 3-6m 6-12m 1-2y 2-5y 5-10y >10y Not distributed Total
Deposits by credit institutions 9,410 30,764 4,832 15,179 982 192 549 208 0 0 62,116
Deposits and borrowings from the public 182,472 12,582 3,654 3,157 8,204 4,980 16,312 6,380 7,284 0 245,025
Debt securities 0 4,156 4,922 5,059 15,609 17,253 114,719 22,523 2,662 0 186,903
Financial liabilities at fair value 0 0 0 271 0 0 356 422 29 68,726 69,804
Other 0 1,358 1,981 374 0 138 0 17,475 5,107 104,095 130,528
Total 191,882 48,860 15,389 24,040 24,795 22,563 131,936 47,008 15,082 172,821 694,376
SEB Group 30 Sep 2016, USD
SEK m Payable on demand <1m 1-3m 3-6m 6-12m 1-2y 2-5y 5-10y >10y Not distributed Total
Cash and balances with central banks 130,183 0 0 0 0 0 0 0 0 0 130,183
Other Lending to Central Banks 0 4 0 0 0 0 0 0 0 0 4
Loans to credit institutions 3,753 33,785 2,156 953 1,286 191 16 0 9 0 42,149
Loans to the public 5,751 19,478 4,673 1,773 8,603 10,839 64,209 16,482 1,704 0 133,512
Financial assets at fair value 0 50 311 2,768 2,306 6,055 18,274 37 75 58,176 88,052
Other 0 1,635 100 1 0 0 2 3 59 3,840 5,640
Total 139,687 54,952 7,240 5,495 12,195 17,085 82,501 16,522 1,847 62,016 399,540
SEK m Payable on demand <1m 1-3m 3-6m 6-12m 1-2y 2-5y 5-10y >10y Not distributed Total
Deposits by credit institutions 32,802 19,788 8,900 5,431 1,740 0 0 0 0 0 68,661
Deposits and borrowings from the public 156,904 59,093 7,590 912 1,457 40 22 0 2 0 226,020
Debt securities 0 42,594 30,433 49,161 21,185 27,953 74,854 205 84 0 246,469
Financial liabilities at fair value 0 0 83 0 35 0 12 0 0 20,705 20,835
Other 0 2,455 48 0 0 14 0 0 9,724 9,069 21,310
Total 189,706 123,930 47,054 55,504 24,417 28,007 74,888 205 9,810 29,774 583,295
SEB Group 30 Sep 2016, SEK
SEK m Payable on demand <1m 1-3m 3-6m 6-12m 1-2y 2-5y 5-10y >10y Not distributed Total
Cash and balances with central banks 315 0 0 0 0 0 0 0 0 0 315
Other Lending to Central Banks 0 28,585 0 0 0 0 0 0 0 0 28,585
Loans to credit institutions 1,709 3,986 64 116 282 325 427 6 0 0 6,915
Loans to the public 32,165 83,501 72,566 68,824 168,432 259,538 134,770 34,970 13,980 0 868,746
Financial assets at fair value 0 693 3,568 6,209 3,687 14,654 26,404 3,077 2,401 335,420 396,113
Other 0 16,932 1,333 0 0 3,015 0 0 0 13,206 34,486
Total 34,189 133,697 77,531 75,149 172,401 277,532 161,601 38,053 16,381 348,626 1,335,160
SEK m Payable on demand <1m 1-3m 3-6m 6-12m 1-2y 2-5y 5-10y >10y Not distributed Total
Deposits by credit institutions 14,693 7,221 0 0 0 0 0 960 672 0 23,546
Deposits and borrowings from the public 434,780 26,351 11,391 3,279 222 318 1,404 3,955 6,225 0 487,925
Debt securities 0 2,543 2,184 2,623 37,804 53,886 106,058 38,131 4,506 0 247,735
Financial liabilities at fair value 0 620 0 145 1,525 15,131 11,973 6,262 8,778 81,754 126,188
Other 0 11,836 12,433 63 0 6,987 0 0 0 325,561 356,880
Total 449,473 48,571 26,008 6,110 39,551 76,322 119,435 49,308 20,181 407,315 1,242,274
Notes:
Maturities above are based on remaining contractual maturities.
Other Assets include assets Held for Sale, Tangible and Intangible assets and Other assets
Other Liabilities include Liabilities to Policyholders, Liabilities Held for Sale, Subordinated Debt, Equity and Other liabilities
Payable on Demand includes items available O/N
Not Distributed includes items with no contractual maturity and other undistributed items
SEB Fact Book January – September 2016 18
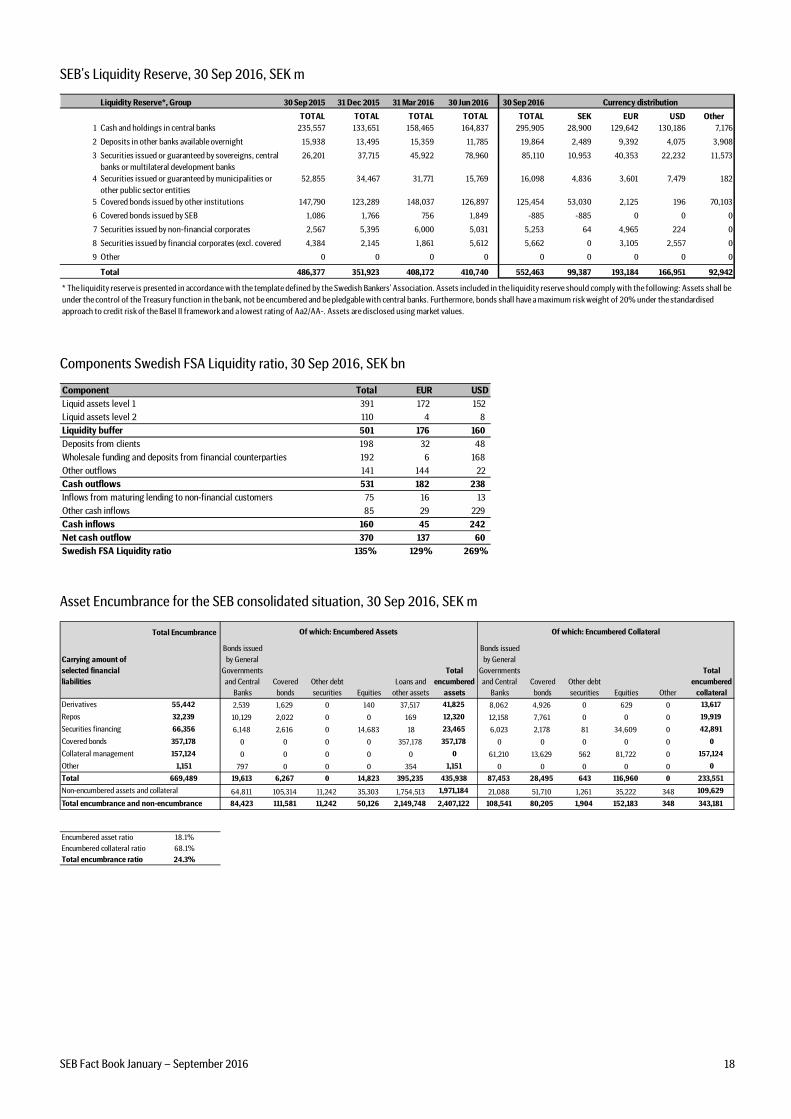
SEB's Liquidity Reserve, 30 Sep 2016, SEK m
Liquidity Reserve*, Group 30 Sep 2015 31 Dec 2015 31 Mar 2016 30 Jun 2016 30 Sep 2016
TOTAL TOTAL TOTAL TOTAL TOTAL SEK EUR USD Other
1 Cash and holdings in central banks 235,557 133,651 158,465 164,837 295,905 28,900 129,642 130,186 7,176
2 Deposits in other banks available overnight 15,938 13,495 15,359 11,785 19,864 2,489 9,392 4,075 3,908
3 Securities issued or guaranteed by sovereigns, central
banks or multilateral development banks
26,201 37,715 45,922 78,960 85,110 10,953 40,353 22,232 11,573
4 Securities issued or guaranteed by municipalities or
other public sector entities
52,855 34,467 31,771 15,769 16,098 4,836 3,601 7,479 182
5 Covered bonds issued by other institutions 147,790 123,289 148,037 126,897 125,454 53,030 2,125 196 70,103
6 Covered bonds issued by SEB 1,086 1,766 756 1,849 -885 -885 0 0 0
7 Securities issued by non-financial corporates 2,567 5,395 6,000 5,031 5,253 64 4,965 224 0
8 Securities issued by financial corporates (excl. covered 4,384 2,145 1,861 5,612 5,662 0 3,105 2,557 0
9 Other 0 0 0 0 0 0 0 0 0
Total 486,377 351,923 408,172 410,740 552,463 99,387 193,184 166,951 92,942
Currency distribution
* The liquidity reserve is presented in accordance with the template defined by the Swedish Bankers' Association. Assets included in the liquidity reserve should comply with the following: Assets shall be
under the control of the Treasury function in the bank, not be encumbered and be pledgable with central banks. Furthermore, bonds shall have a maximum risk weight of 20% under the standardised
approach to credit risk of the Basel II framework and a lowest rating of Aa2/AA-. Assets are disclosed using market values.
Components Swedish FSA Liquidity ratio, 30 Sep 2016, SEK bn
Component Total EUR USD
Liquid assets level 1 391 172 152
Liquid assets level 2 110 4 8
Liquidity buffer 501 176 160
Deposits from clients 198 32 48
Wholesale funding and deposits from financial counterparties 192 6 168
Other outflows 141 144 22
Cash outflows 531 182 238
Inflows from maturing lending to non-financial customers 75 16 13
Other cash inflows 85 29 229
Cash inflows 160 45 242
Net cash outflow 370 137 60
Swedish FSA Liquidity ratio 135% 129% 269%
Asset Encumbrance for the SEB consolidated situation, 30 Sep 2016, SEK m
Total Encumbrance
Carrying amount of
selected financial
liabilities
Bonds issued
by General
Governments
and Central
Banks
Covered
bonds
Other debt
securities Equities
Loans and
other assets
Total
encumbered
assets
Bonds issued
by General
Governments
and Central
Banks
Covered
bonds
Other debt
securities Equities Other
Total
encumbered
collateral
Derivatives 55,442 2,539 1,629 0 140 37,517 41,825 8,062 4,926 0 629 0 13,617
Repos 32,239 10,129 2,022 0 0 169 12,320 12,158 7,761 0 0 0 19,919
Securities financing 66,356 6,148 2,616 0 14,683 18 23,465 6,023 2,178 81 34,609 0 42,891
Covered bonds 357,178 0 0 0 0 357,178 357,178 0 0 0 0 0 0
Collateral management 157,124 0 0 0 0 0 0 61,210 13,629 562 81,722 0 157,124
Other 1,151 797 0 0 0 354 1,151 0 0 0 0 0 0
Total 669,489 19,613 6,267 0 14,823 395,235 435,938 87,453 28,495 643 116,960 0 233,551
Non-encumbered assets and collateral 64,811 105,314 11,242 35,303 1,754,513 1,971,184 21,088 51,710 1,261 35,222 348 109,629
Total encumbrance and non-encumbrance 84,423 111,581 11,242 50,126 2,149,748 2,407,122 108,541 80,205 1,904 152,183 348 343,181
Encumbered asset ratio 18.1%
Encumbered collateral ratio 68.1%
Total encumbrance ratio 24.3%
Of which: Encumbered Assets Of which: Encumbered Collateral
SEB Fact Book January – September 2016 19
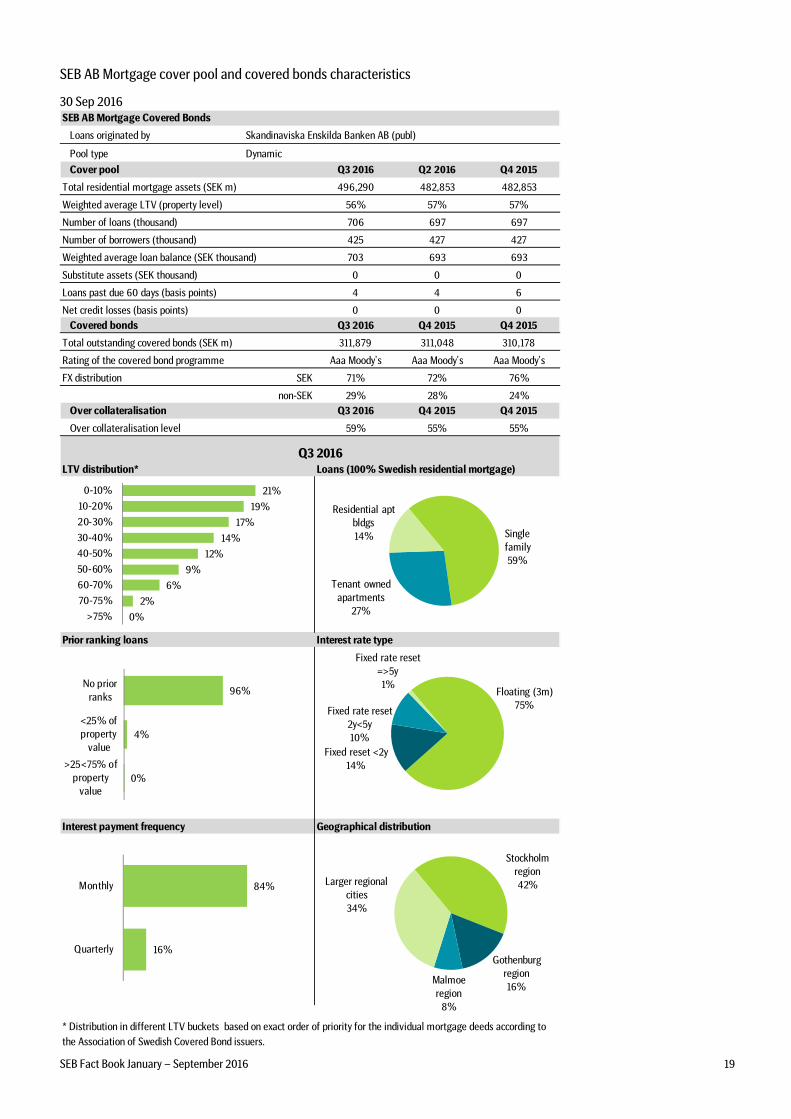
SEB AB Mortgage cover pool and covered bonds characteristics
30 Sep 2016 SEB AB Mortgage Covered Bonds
Loans originated by Skandinaviska Enskilda Banken AB (publ)
Pool type Dynamic
Cover pool Q3 2016 Q2 2016 Q4 2015
496,290 482,853 482,853
56% 57% 57%
706 697 697
425 427 427
703 693 693
0 0 0
4 4 6
0 0 0
Covered bonds Q3 2016 Q4 2015 Q4 2015
311,879 311,048 310,178
Aaa Moody's Aaa Moody's Aaa Moody's
FX distribution SEK 71% 72% 76%
non-SEK 29% 28% 24%
Over collateralisation Q3 2016 Q4 2015 Q4 2015
Over collateralisation level 59% 55% 55%
LTV distribution* Loans (100% Swedish residential mortgage)
Prior ranking loans Interest rate type
Interest payment frequency Geographical distribution
Substitute assets (SEK thousand)
Total residential mortgage assets (SEK m)
Weighted average LTV (property level)
Number of loans (thousand)
Number of borrowers (thousand)
Weighted average loan balance (SEK thousand)
Loans past due 60 days (basis points)
Net credit losses (basis points)
Total outstanding covered bonds (SEK m)
Rating of the covered bond programme
Q3 2016
* Distribution in different LTV buckets based on exact order of priority for the individual mortgage deeds according to
the Association of Swedish Covered Bond issuers.
Single
family
59%
Tenant owned
apartments
27%
Residential apt
bldgs
14%
Floating (3m)
75%
Fixed reset <2y
14%
Fixed rate reset
2y<5y
10%
Fixed rate reset
=>5y
1%
Stockholm
region
42%
Gothenburg
region
16%Malmoe
region
8%
Larger regional
cities
34%
21%
19%
17%
14%
12%
9%
6%
2%
0%
0-10%
10-20%
20-30%
30-40%
40-50%
50-60%
60-70%
70-75%
>75%
96%
4%
0%
No prior
ranks
<25% of
property
value
>25<75% of
property
value
84%
16%
Monthly
Quarterly
SEB Fact Book January – September 2016 20
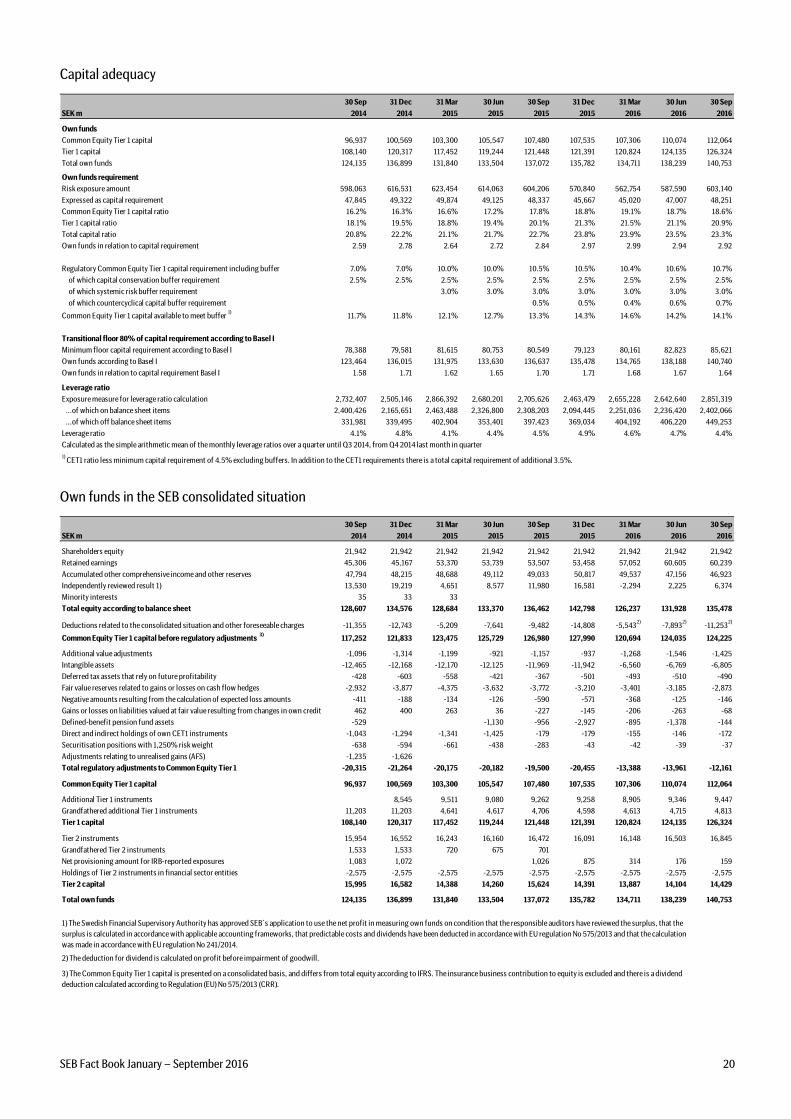
Capital adequacy
30 Sep 31 Dec 31 Mar 30 Jun 30 Sep 31 Dec 31 Mar 30 Jun 30 Sep
SEK m 2014 2014 2015 2015 2015 2015 2016 2016 2016
Own funds
Common Equity Tier 1 capital 96,937 100,569 103,300 105,547 107,480 107,535 107,306 110,074 112,064
Tier 1 capital 108,140 120,317 117,452 119,244 121,448 121,391 120,824 124,135 126,324
Total own funds 124,135 136,899 131,840 133,504 137,072 135,782 134,711 138,239 140,753
Own funds requirement
Risk exposure amount 598,063 616,531 623,454 614,063 604,206 570,840 562,754 587,590 603,140
Expressed as capital requirement 47,845 49,322 49,874 49,125 48,337 45,667 45,020 47,007 48,251
Common Equity Tier 1 capital ratio 16.2% 16.3% 16.6% 17.2% 17.8% 18.8% 19.1% 18.7% 18.6%
Tier 1 capital ratio 18.1% 19.5% 18.8% 19.4% 20.1% 21.3% 21.5% 21.1% 20.9%
Total capital ratio 20.8% 22.2% 21.1% 21.7% 22.7% 23.8% 23.9% 23.5% 23.3%
Own funds in relation to capital requirement 2.59 2.78 2.64 2.72 2.84 2.97 2.99 2.94 2.92
Regulatory Common Equity Tier 1 capital requirement including buffer 7.0% 7.0% 10.0% 10.0% 10.5% 10.5% 10.4% 10.6% 10.7%
of which capital conservation buffer requirement 2.5% 2.5% 2.5% 2.5% 2.5% 2.5% 2.5% 2.5% 2.5%
of which systemic risk buffer requirement 3.0% 3.0% 3.0% 3.0% 3.0% 3.0% 3.0%
of which countercyclical capital buffer requirement 0.5% 0.5% 0.4% 0.6% 0.7%
Common Equity Tier 1 capital available to meet buffer 1)
11.7% 11.8% 12.1% 12.7% 13.3% 14.3% 14.6% 14.2% 14.1%
Transitional floor 80% of capital requirement according to Basel I
Minimum floor capital requirement according to Basel I 78,388 79,581 81,615 80,753 80,549 79,123 80,161 82,823 85,621
Own funds according to Basel I 123,464 136,015 131,975 133,630 136,637 135,478 134,765 138,188 140,740
Own funds in relation to capital requirement Basel I 1.58 1.71 1.62 1.65 1.70 1.71 1.68 1.67 1.64
Leverage ratio
Exposure measure for leverage ratio calculation 2,732,407 2,505,146 2,866,392 2,680,201 2,705,626 2,463,479 2,655,228 2,642,640 2,851,319
...of which on balance sheet items 2,400,426 2,165,651 2,463,488 2,326,800 2,308,203 2,094,445 2,251,036 2,236,420 2,402,066
...of which off balance sheet items 331,981 339,495 402,904 353,401 397,423 369,034 404,192 406,220 449,253
Leverage ratio 4.1% 4.8% 4.1% 4.4% 4.5% 4.9% 4.6% 4.7% 4.4%
Calculated as the simple arithmetic mean of the monthly leverage ratios over a quarter until Q3 2014, from Q4 2014 last month in quarter
1) CET1 ratio less minimum capital requirement of 4.5% excluding buffers. In addition to the CET1 requirements there is a total capital requirement of additional 3.5%.
Own funds in the SEB consolidated situation
30 Sep 31 Dec 31 Mar 30 Jun 30 Sep 31 Dec 31 Mar 30 Jun 30 Sep
SEK m 2014 2014 2015 2015 2015 2015 2016 2016 2016
Shareholders equity 21,942 21,942 21,942 21,942 21,942 21,942 21,942 21,942 21,942
Retained earnings 45,306 45,167 53,370 53,739 53,507 53,458 57,052 60,605 60,239
Accumulated other comprehensive income and other reserves 47,794 48,215 48,688 49,112 49,033 50,817 49,537 47,156 46,923
Independently reviewed result 1) 13,530 19,219 4,651 8,577 11,980 16,581 -2,294 2,225 6,374
Minority interests 35 33 33
Total equity according to balance sheet 128,607 134,576 128,684 133,370 136,462 142,798 126,237 131,928 135,478
Deductions related to the consolidated situation and other foreseeable charges -11,355 -12,743 -5,209 -7,641 -9,482 -14,808 -5,5432)
-7,8932)
-11,2532)
Common Equity Tier 1 capital before regulatory adjustments 3)
117,252 121,833 123,475 125,729 126,980 127,990 120,694 124,035 124,225
Additional value adjustments -1,096 -1,314 -1,199 -921 -1,157 -937 -1,268 -1,546 -1,425
Intangible assets -12,465 -12,168 -12,170 -12,125 -11,969 -11,942 -6,560 -6,769 -6,805
Deferred tax assets that rely on future profitability -428 -603 -558 -421 -367 -501 -493 -510 -490
Fair value reserves related to gains or losses on cash flow hedges -2,932 -3,877 -4,375 -3,632 -3,772 -3,210 -3,401 -3,185 -2,873
Negative amounts resulting from the calculation of expected loss amounts -411 -188 -134 -126 -590 -571 -368 -125 -146
Gains or losses on liabilities valued at fair value resulting from changes in own credit 462 400 263 36 -227 -145 -206 -263 -68
Defined-benefit pension fund assets -529 -1,130 -956 -2,927 -895 -1,378 -144
Direct and indirect holdings of own CET1 instruments -1,043 -1,294 -1,341 -1,425 -179 -179 -155 -146 -172
Securitisation positions with 1,250% risk weight -638 -594 -661 -438 -283 -43 -42 -39 -37
Adjustments relating to unrealised gains (AFS) -1,235 -1,626
Total regulatory adjustments to Common Equity Tier 1 -20,315 -21,264 -20,175 -20,182 -19,500 -20,455 -13,388 -13,961 -12,161
Common Equity Tier 1 capital 96,937 100,569 103,300 105,547 107,480 107,535 107,306 110,074 112,064
Additional Tier 1 instruments 8,545 9,511 9,080 9,262 9,258 8,905 9,346 9,447
Grandfathered additional Tier 1 instruments 11,203 11,203 4,641 4,617 4,706 4,598 4,613 4,715 4,813
Tier 1 capital 108,140 120,317 117,452 119,244 121,448 121,391 120,824 124,135 126,324
Tier 2 instruments 15,954 16,552 16,243 16,160 16,472 16,091 16,148 16,503 16,845
Grandfathered Tier 2 instruments 1,533 1,533 720 675 701
Net provisioning amount for IRB-reported exposures 1,083 1,072 1,026 875 314 176 159
Holdings of Tier 2 instruments in financial sector entities -2,575 -2,575 -2,575 -2,575 -2,575 -2,575 -2,575 -2,575 -2,575
Tier 2 capital 15,995 16,582 14,388 14,260 15,624 14,391 13,887 14,104 14,429
Total own funds 124,135 136,899 131,840 133,504 137,072 135,782 134,711 138,239 140,753
2) The deduction for dividend is calculated on profit before impairment of goodwill.
1) The Swedish Financial Supervisory Authority has approved SEB´s application to use the net profit in measuring own funds on condition that the responsible auditors have reviewed the surplus, that the
surplus is calculated in accordance with applicable accounting frameworks, that predictable costs and dividends have been deducted in accordance with EU regulation No 575/2013 and that the calculation
was made in accordance with EU regulation No 241/2014.
3) The Common Equity Tier 1 capital is presented on a consolidated basis, and differs from total equity according to IFRS. The insurance business contribution to equity is excluded and there is a dividend
deduction calculated according to Regulation (EU) No 575/2013 (CRR).
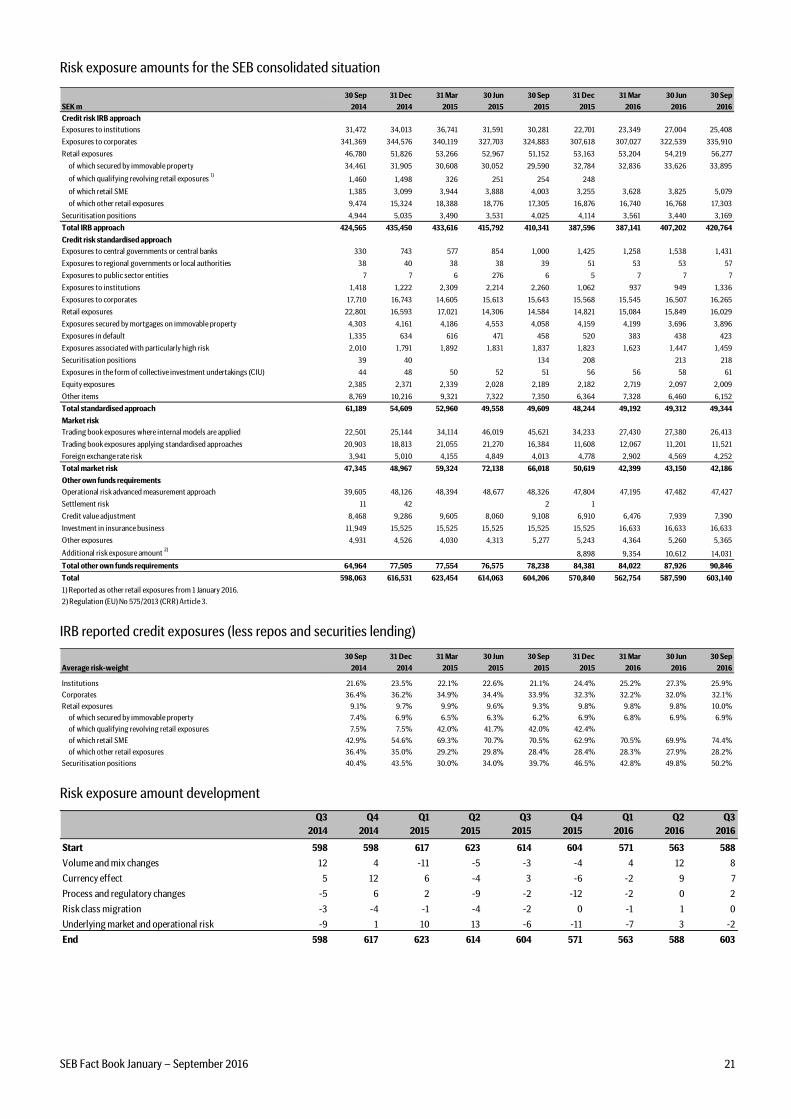
SEB Fact Book January – September 2016 21
Risk exposure amounts for the SEB consolidated situation
30 Sep 31 Dec 31 Mar 30 Jun 30 Sep 31 Dec 31 Mar 30 Jun 30 Sep
SEK m 2014 2014 2015 2015 2015 2015 2016 2016 2016
Credit risk IRB approach
Exposures to institutions 31,472 34,013 36,741 31,591 30,281 22,701 23,349 27,004 25,408
Exposures to corporates 341,369 344,576 340,119 327,703 324,883 307,618 307,027 322,539 335,910
Retail exposures 46,780 51,826 53,266 52,967 51,152 53,163 53,204 54,219 56,277
of which secured by immovable property 34,461 31,905 30,608 30,052 29,590 32,784 32,836 33,626 33,895
of which qualifying revolving retail exposures 1)
1,460 1,498 326 251 254 248
of which retail SME 1,385 3,099 3,944 3,888 4,003 3,255 3,628 3,825 5,079
of which other retail exposures 9,474 15,324 18,388 18,776 17,305 16,876 16,740 16,768 17,303
Securitisation positions 4,944 5,035 3,490 3,531 4,025 4,114 3,561 3,440 3,169
Total IRB approach 424,565 435,450 433,616 415,792 410,341 387,596 387,141 407,202 420,764
Credit risk standardised approach
Exposures to central governments or central banks 330 743 577 854 1,000 1,425 1,258 1,538 1,431
Exposures to regional governments or local authorities 38 40 38 38 39 51 53 53 57
Exposures to public sector entities 7 7 6 276 6 5 7 7 7
Exposures to institutions 1,418 1,222 2,309 2,214 2,260 1,062 937 949 1,336
Exposures to corporates 17,710 16,743 14,605 15,613 15,643 15,568 15,545 16,507 16,265
Retail exposures 22,801 16,593 17,021 14,306 14,584 14,821 15,084 15,849 16,029
Exposures secured by mortgages on immovable property 4,303 4,161 4,186 4,553 4,058 4,159 4,199 3,696 3,896
Exposures in default 1,335 634 616 471 458 520 383 438 423
Exposures associated with particularly high risk 2,010 1,791 1,892 1,831 1,837 1,823 1,623 1,447 1,459
Securitisation positions 39 40 134 208 213 218
Exposures in the form of collective investment undertakings (CIU) 44 48 50 52 51 56 56 58 61
Equity exposures 2,385 2,371 2,339 2,028 2,189 2,182 2,719 2,097 2,009
Other items 8,769 10,216 9,321 7,322 7,350 6,364 7,328 6,460 6,152
Total standardised approach 61,189 54,609 52,960 49,558 49,609 48,244 49,192 49,312 49,344
Market risk
Trading book exposures where internal models are applied 22,501 25,144 34,114 46,019 45,621 34,233 27,430 27,380 26,413
Trading book exposures applying standardised approaches 20,903 18,813 21,055 21,270 16,384 11,608 12,067 11,201 11,521
Foreign exchange rate risk 3,941 5,010 4,155 4,849 4,013 4,778 2,902 4,569 4,252
Total market risk 47,345 48,967 59,324 72,138 66,018 50,619 42,399 43,150 42,186
Other own funds requirements
Operational risk advanced measurement approach 39,605 48,126 48,394 48,677 48,326 47,804 47,195 47,482 47,427
Settlement risk 11 42 2 1
Credit value adjustment 8,468 9,286 9,605 8,060 9,108 6,910 6,476 7,939 7,390
Investment in insurance business 11,949 15,525 15,525 15,525 15,525 15,525 16,633 16,633 16,633
Other exposures 4,931 4,526 4,030 4,313 5,277 5,243 4,364 5,260 5,365
Additional risk exposure amount 2)
8,898 9,354 10,612 14,031
Total other own funds requirements 64,964 77,505 77,554 76,575 78,238 84,381 84,022 87,926 90,846
Total 598,063 616,531 623,454 614,063 604,206 570,840 562,754 587,590 603,140
1) Reported as other retail exposures from 1 January 2016.
2) Regulation (EU) No 575/2013 (CRR) Article 3.
IRB reported credit exposures (less repos and securities lending)
30 Sep 31 Dec 31 Mar 30 Jun 30 Sep 31 Dec 31 Mar 30 Jun 30 Sep
Average risk-weight 2014 2014 2015 2015 2015 2015 2016 2016 2016
Institutions 21.6% 23.5% 22.1% 22.6% 21.1% 24.4% 25.2% 27.3% 25.9%
Corporates 36.4% 36.2% 34.9% 34.4% 33.9% 32.3% 32.2% 32.0% 32.1%
Retail exposures 9.1% 9.7% 9.9% 9.6% 9.3% 9.8% 9.8% 9.8% 10.0%
of which secured by immovable property 7.4% 6.9% 6.5% 6.3% 6.2% 6.9% 6.8% 6.9% 6.9%
of which qualifying revolving retail exposures 7.5% 7.5% 42.0% 41.7% 42.0% 42.4%
of which retail SME 42.9% 54.6% 69.3% 70.7% 70.5% 62.9% 70.5% 69.9% 74.4%
of which other retail exposures 36.4% 35.0% 29.2% 29.8% 28.4% 28.4% 28.3% 27.9% 28.2%
Securitisation positions 40.4% 43.5% 30.0% 34.0% 39.7% 46.5% 42.8% 49.8% 50.2%
Risk exposure amount development
Q3
2014
Q4
2014
Q1
2015
Q2
2015
Q3
2015
Q4
2015
Q1
2016
Q2
2016
Q3
2016
Start 598 598 617 623 614 604 571 563 588
Volume and mix changes 12 4 -11 -5 -3 -4 4 12 8
Currency effect 5 12 6 -4 3 -6 -2 9 7
Process and regulatory changes -5 6 2 -9 -2 -12 -2 0 2
Risk class migration -3 -4 -1 -4 -2 0 -1 1 0
Underlying market and operational risk -9 1 10 13 -6 -11 -7 3 -2
End 598 617 623 614 604 571 563 588 603
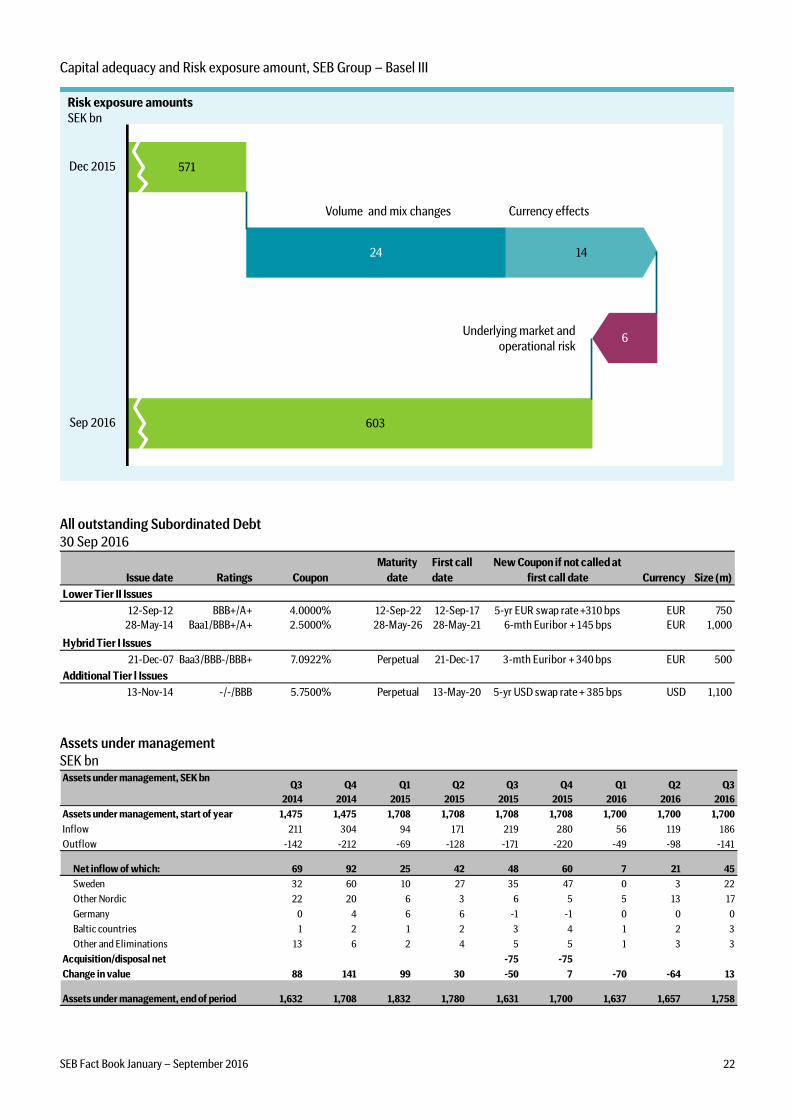
SEB Fact Book January – September 2016 22
Capital adequacy and Risk exposure amount, SEB Group – Basel III
Risk exposure amountsSEK bn
571
603
24
6
14
Dec 2015
Sep 2016
Volume and mix changes Currency effects
Underlying market and
operational risk
All outstanding Subordinated Debt
30 Sep 2016
Issue date Ratings Coupon
Maturity
date
First call
date
New Coupon if not called at
first call date Currency Size (m)
Lower Tier II Issues
12-Sep-12 BBB+/A+ 4.0000% 12-Sep-22 12-Sep-17 5-yr EUR swap rate +310 bps EUR 750
28-May-14 Baa1/BBB+/A+ 2.5000% 28-May-26 28-May-21 6-mth Euribor + 145 bps EUR 1,000
Hybrid Tier I Issues
21-Dec-07 Baa3/BBB-/BBB+ 7.0922% Perpetual 21-Dec-17 3-mth Euribor + 340 bps EUR 500
Additional Tier l Issues
13-Nov-14 -/-/BBB 5.7500% Perpetual 13-May-20 5-yr USD swap rate + 385 bps USD 1,100
Assets under management
SEK bn Assets under management, SEK bn
Q3
2014
Q4
2014
Q1
2015
Q2
2015
Q3
2015
Q4
2015
Q1
2016
Q2
2016
Q3
2016
Assets under management, start of year 1,475 1,475 1,708 1,708 1,708 1,708 1,700 1,700 1,700
Inflow 211 304 94 171 219 280 56 119 186
Outflow -142 -212 -69 -128 -171 -220 -49 -98 -141
Net inflow of which: 69 92 25 42 48 60 7 21 45
Sweden 32 60 10 27 35 47 0 3 22
Other Nordic 22 20 6 3 6 5 5 13 17
Germany 0 4 6 6 -1 -1 0 0 0
Baltic countries 1 2 1 2 3 4 1 2 3
Other and Eliminations 13 6 2 4 5 5 1 3 3
Acquisition/disposal net -75 -75
Change in value 88 141 99 30 -50 7 -70 -64 13
Assets under management, end of period 1,632 1,708 1,832 1,780 1,631 1,700 1,637 1,657 1,758
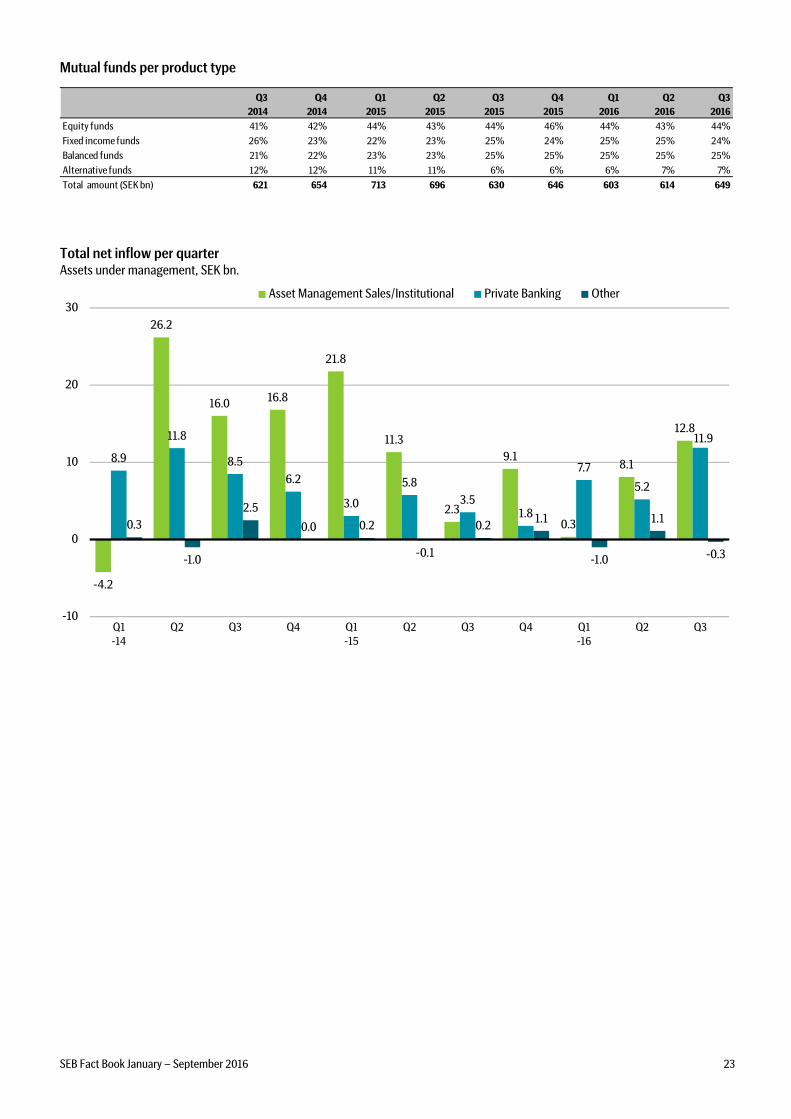
SEB Fact Book January – September 2016 23
Mutual funds per product type
Q3
2014
Q4
2014
Q1
2015
Q2
2015
Q3
2015
Q4
2015
Q1
2016
Q2
2016
Q3
2016
Equity funds 41% 42% 44% 43% 44% 46% 44% 43% 44%
Fixed income funds 26% 23% 22% 23% 25% 24% 25% 25% 24%
Balanced funds 21% 22% 23% 23% 25% 25% 25% 25% 25%
Alternative funds 12% 12% 11% 11% 6% 6% 6% 7% 7%
Total amount (SEK bn) 621 654 713 696 630 646 603 614 649
Total net inflow per quarter
Assets under management, SEK bn.
-4.2
26.2
16.0 16.8
21.8
11.3
2.3
9.1
0.3
8.1
12.8
8.9
11.8
8.5
6.2
3.0
5.8
3.51.8
7.7
5.2
11.9
0.3
-1.0
2.5
0.0 0.2
-0.1
0.21.1
-1.0
1.1
-0.3
-10
0
10
20
30
Q1-14
Q2 Q3 Q4 Q1-15
Q2 Q3 Q4 Q1-16
Q2 Q3
Asset Management Sales/Institutional Private Banking Other
=
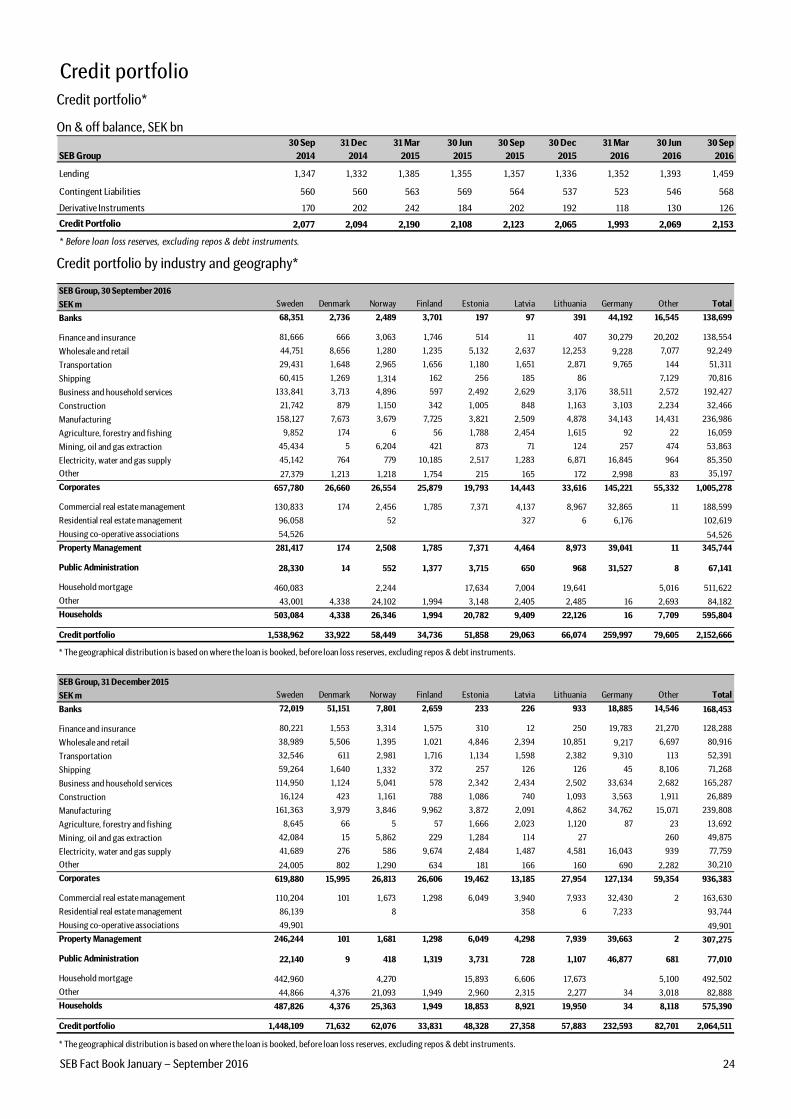
SEB Fact Book January – September 2016 24
Credit portfolio
Credit portfolio*
On & off balance, SEK bn
SEB Group
30 Sep
2014
31 Dec
2014
31 Mar
2015
30 Jun
2015
30 Sep
2015
30 Dec
2015
31 Mar
2016
30 Jun
2016
30 Sep
2016
Lending 1,347 1,332 1,385 1,355 1,357 1,336 1,352 1,393 1,459
Contingent Liabilities 560 560 563 569 564 537 523 546 568
Derivative Instruments 170 202 242 184 202 192 118 130 126
Credit Portfolio 2,077 2,094 2,190 2,108 2,123 2,065 1,993 2,069 2,153
* Before loan loss reserves, excluding repos & debt instruments.
Credit portfolio by industry and geography*
SEB Group, 30 September 2016
SEK m Sweden Denmark Norway Finland Estonia Latvia Lithuania Germany Other Total
Banks 68,351 2,736 2,489 3,701 197 97 391 44,192 16,545 138,699
Finance and insurance 81,666 666 3,063 1,746 514 11 407 30,279 20,202 138,554
Wholesale and retail 44,751 8,656 1,280 1,235 5,132 2,637 12,253 9,228 7,077 92,249
Transportation 29,431 1,648 2,965 1,656 1,180 1,651 2,871 9,765 144 51,311
Shipping 60,415 1,269 1,314 162 256 185 86 7,129 70,816
Business and household services 133,841 3,713 4,896 597 2,492 2,629 3,176 38,511 2,572 192,427
Construction 21,742 879 1,150 342 1,005 848 1,163 3,103 2,234 32,466
Manufacturing 158,127 7,673 3,679 7,725 3,821 2,509 4,878 34,143 14,431 236,986
Agriculture, forestry and fishing 9,852 174 6 56 1,788 2,454 1,615 92 22 16,059
Mining, oil and gas extraction 45,434 5 6,204 421 873 71 124 257 474 53,863
Electricity, water and gas supply 45,142 764 779 10,185 2,517 1,283 6,871 16,845 964 85,350
Other 27,379 1,213 1,218 1,754 215 165 172 2,998 83 35,197
Corporates 657,780 26,660 26,554 25,879 19,793 14,443 33,616 145,221 55,332 1,005,278
Commercial real estate management 130,833 174 2,456 1,785 7,371 4,137 8,967 32,865 11 188,599
Residential real estate management 96,058 52 327 6 6,176 102,619
Housing co-operative associations 54,526 54,526
Property Management 281,417 174 2,508 1,785 7,371 4,464 8,973 39,041 11 345,744
Public Administration 28,330 14 552 1,377 3,715 650 968 31,527 8 67,141
Household mortgage 460,083 2,244 17,634 7,004 19,641 5,016 511,622
Other 43,001 4,338 24,102 1,994 3,148 2,405 2,485 16 2,693 84,182
Households 503,084 4,338 26,346 1,994 20,782 9,409 22,126 16 7,709 595,804
Credit portfolio 1,538,962 33,922 58,449 34,736 51,858 29,063 66,074 259,997 79,605 2,152,666
* The geographical distribution is based on where the loan is booked, before loan loss reserves, excluding repos & debt instruments.
SEB Group, 31 December 2015
SEK m Sweden Denmark Norway Finland Estonia Latvia Lithuania Germany Other Total
Banks 72,019 51,151 7,801 2,659 233 226 933 18,885 14,546 168,453
Finance and insurance 80,221 1,553 3,314 1,575 310 12 250 19,783 21,270 128,288
Wholesale and retail 38,989 5,506 1,395 1,021 4,846 2,394 10,851 9,217 6,697 80,916
Transportation 32,546 611 2,981 1,716 1,134 1,598 2,382 9,310 113 52,391
Shipping 59,264 1,640 1,332 372 257 126 126 45 8,106 71,268
Business and household services 114,950 1,124 5,041 578 2,342 2,434 2,502 33,634 2,682 165,287
Construction 16,124 423 1,161 788 1,086 740 1,093 3,563 1,911 26,889
Manufacturing 161,363 3,979 3,846 9,962 3,872 2,091 4,862 34,762 15,071 239,808
Agriculture, forestry and fishing 8,645 66 5 57 1,666 2,023 1,120 87 23 13,692
Mining, oil and gas extraction 42,084 15 5,862 229 1,284 114 27 260 49,875
Electricity, water and gas supply 41,689 276 586 9,674 2,484 1,487 4,581 16,043 939 77,759
Other 24,005 802 1,290 634 181 166 160 690 2,282 30,210
Corporates 619,880 15,995 26,813 26,606 19,462 13,185 27,954 127,134 59,354 936,383
Commercial real estate management 110,204 101 1,673 1,298 6,049 3,940 7,933 32,430 2 163,630
Residential real estate management 86,139 8 358 6 7,233 93,744
Housing co-operative associations 49,901 49,901
Property Management 246,244 101 1,681 1,298 6,049 4,298 7,939 39,663 2 307,275
Public Administration 22,140 9 418 1,319 3,731 728 1,107 46,877 681 77,010
Household mortgage 442,960 4,270 15,893 6,606 17,673 5,100 492,502
Other 44,866 4,376 21,093 1,949 2,960 2,315 2,277 34 3,018 82,888
Households 487,826 4,376 25,363 1,949 18,853 8,921 19,950 34 8,118 575,390
Credit portfolio 1,448,109 71,632 62,076 33,831 48,328 27,358 57,883 232,593 82,701 2,064,511
* The geographical distribution is based on where the loan is booked, before loan loss reserves, excluding repos & debt instruments.
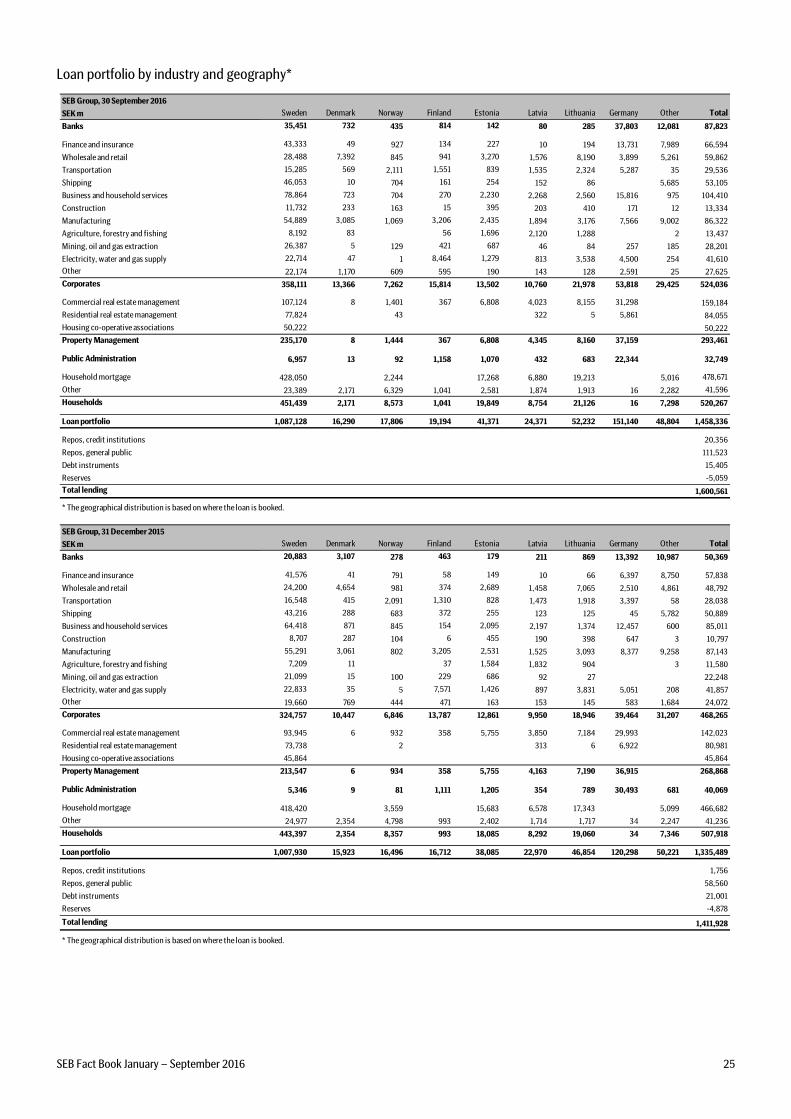
SEB Fact Book January – September 2016 25
Loan portfolio by industry and geography*
SEB Group, 30 September 2016
SEK m Sweden Denmark Norway Finland Estonia Latvia Lithuania Germany Other Total
Banks 35,451 732 435 814 142 80 285 37,803 12,081 87,823
Finance and insurance 43,333 49 927 134 227 10 194 13,731 7,989 66,594
Wholesale and retail 28,488 7,392 845 941 3,270 1,576 8,190 3,899 5,261 59,862
Transportation 15,285 569 2,111 1,551 839 1,535 2,324 5,287 35 29,536
Shipping 46,053 10 704 161 254 152 86 5,685 53,105
Business and household services 78,864 723 704 270 2,230 2,268 2,560 15,816 975 104,410
Construction 11,732 233 163 15 395 203 410 171 12 13,334
Manufacturing 54,889 3,085 1,069 3,206 2,435 1,894 3,176 7,566 9,002 86,322
Agriculture, forestry and fishing 8,192 83 56 1,696 2,120 1,288 2 13,437
Mining, oil and gas extraction 26,387 5 129 421 687 46 84 257 185 28,201
Electricity, water and gas supply 22,714 47 1 8,464 1,279 813 3,538 4,500 254 41,610
Other 22,174 1,170 609 595 190 143 128 2,591 25 27,625
Corporates 358,111 13,366 7,262 15,814 13,502 10,760 21,978 53,818 29,425 524,036
Commercial real estate management 107,124 8 1,401 367 6,808 4,023 8,155 31,298 159,184
Residential real estate management 77,824 43 322 5 5,861 84,055
Housing co-operative associations 50,222 50,222
Property Management 235,170 8 1,444 367 6,808 4,345 8,160 37,159 293,461
Public Administration 6,957 13 92 1,158 1,070 432 683 22,344 32,749
Household mortgage 428,050 2,244 17,268 6,880 19,213 5,016 478,671
Other 23,389 2,171 6,329 1,041 2,581 1,874 1,913 16 2,282 41,596
Households 451,439 2,171 8,573 1,041 19,849 8,754 21,126 16 7,298 520,267
Loan portfolio 1,087,128 16,290 17,806 19,194 41,371 24,371 52,232 151,140 48,804 1,458,336
Repos, credit institutions 20,356
Repos, general public 111,523
Debt instruments 15,405
Reserves -5,059
Total lending 1,600,561
* The geographical distribution is based on where the loan is booked.
SEB Group, 31 December 2015
SEK m Sweden Denmark Norway Finland Estonia Latvia Lithuania Germany Other Total
Banks 20,883 3,107 278 463 179 211 869 13,392 10,987 50,369
Finance and insurance 41,576 41 791 58 149 10 66 6,397 8,750 57,838
Wholesale and retail 24,200 4,654 981 374 2,689 1,458 7,065 2,510 4,861 48,792
Transportation 16,548 415 2,091 1,310 828 1,473 1,918 3,397 58 28,038
Shipping 43,216 288 683 372 255 123 125 45 5,782 50,889
Business and household services 64,418 871 845 154 2,095 2,197 1,374 12,457 600 85,011
Construction 8,707 287 104 6 455 190 398 647 3 10,797
Manufacturing 55,291 3,061 802 3,205 2,531 1,525 3,093 8,377 9,258 87,143
Agriculture, forestry and fishing 7,209 11 37 1,584 1,832 904 3 11,580
Mining, oil and gas extraction 21,099 15 100 229 686 92 27 22,248
Electricity, water and gas supply 22,833 35 5 7,571 1,426 897 3,831 5,051 208 41,857
Other 19,660 769 444 471 163 153 145 583 1,684 24,072
Corporates 324,757 10,447 6,846 13,787 12,861 9,950 18,946 39,464 31,207 468,265
Commercial real estate management 93,945 6 932 358 5,755 3,850 7,184 29,993 142,023
Residential real estate management 73,738 2 313 6 6,922 80,981
Housing co-operative associations 45,864 45,864
Property Management 213,547 6 934 358 5,755 4,163 7,190 36,915 268,868
Public Administration 5,346 9 81 1,111 1,205 354 789 30,493 681 40,069
Household mortgage 418,420 3,559 15,683 6,578 17,343 5,099 466,682
Other 24,977 2,354 4,798 993 2,402 1,714 1,717 34 2,247 41,236
Households 443,397 2,354 8,357 993 18,085 8,292 19,060 34 7,346 507,918
Loan portfolio 1,007,930 15,923 16,496 16,712 38,085 22,970 46,854 120,298 50,221 1,335,489
Repos, credit institutions 1,756
Repos, general public 58,560
Debt instruments 21,001
Reserves -4,878
Total lending 1,411,928
* The geographical distribution is based on where the loan is booked.
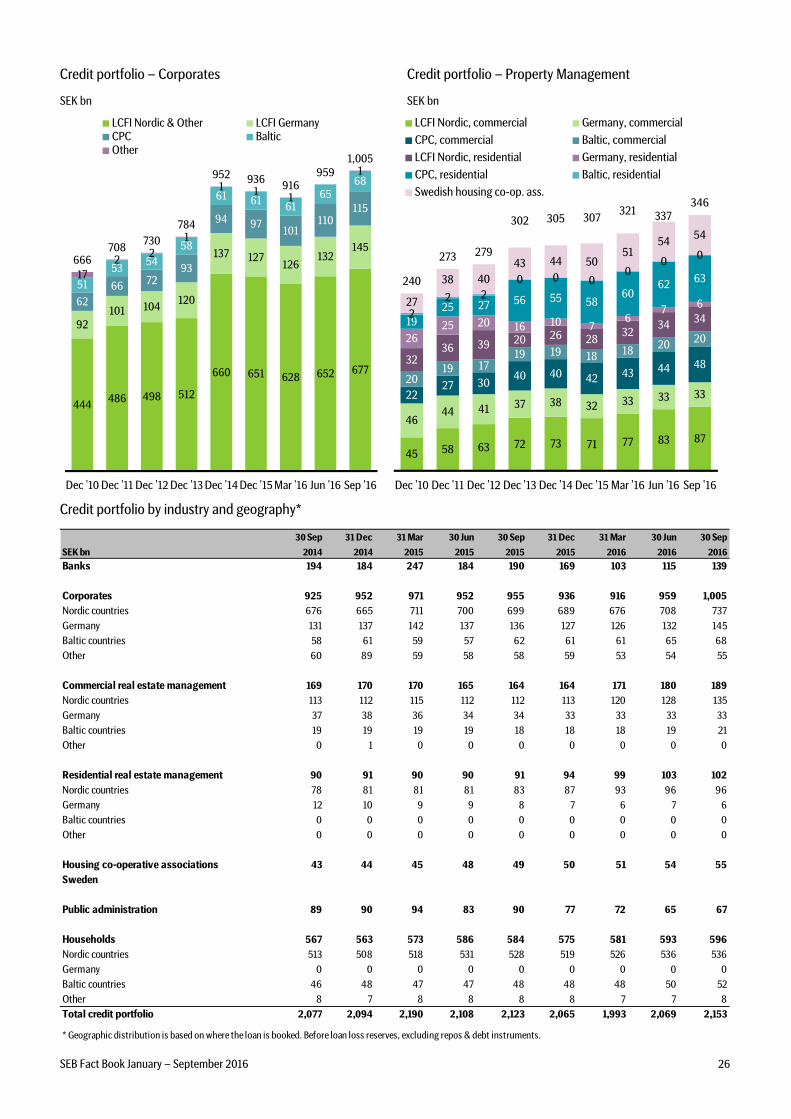
SEB Fact Book January – September 2016 26
Credit portfolio – Corporates Credit portfolio – Property Management
SEK bn SEK bn
444486 498 512
660 651 628 652 677
92101 104
120
137 127126
132145
62
66 7293
94 97101
110115
51
5354
58
61 6161
6568
17
22
1
1 11
1
666708
730
784
952 936916
9591,005
Dec '10 Dec '11 Dec '12 Dec '13 Dec '14 Dec '15 Mar '16 Jun '16 Sep '16
LCFI Nordic & Other LCFI GermanyCPC BalticOther
45 58 63 72 73 71 77 83 87
4644 41 37 38 32 33 33 332227 30
40 40 42 43 44 48
2019 17
19 19 18 1820
20
3236 39 20 26 28
3234
34
2625 20 16 10 7
67 6
1925 27 56 55 58
6062
63
2
2 2
0 0 00
00
27
38 40
43 44 5051
5454
240
273 279
302 305 307321 337
346
Dec '10 Dec '11 Dec '12 Dec '13 Dec '14 Dec '15 Mar '16 Jun '16 Sep '16
LCFI Nordic, commercial Germany, commercial
CPC, commercial Baltic, commercial
LCFI Nordic, residential Germany, residential
CPC, residential Baltic, residential
Swedish housing co-op. ass.
Credit portfolio by industry and geography*
30 Sep 31 Dec 31 Mar 30 Jun 30 Sep 31 Dec 31 Mar 30 Jun 30 Sep
SEK bn 2014 2014 2015 2015 2015 2015 2016 2016 2016
Banks 194 184 247 184 190 169 103 115 139
Corporates 925 952 971 952 955 936 916 959 1,005
Nordic countries 676 665 711 700 699 689 676 708 737
Germany 131 137 142 137 136 127 126 132 145
Baltic countries 58 61 59 57 62 61 61 65 68
Other 60 89 59 58 58 59 53 54 55
Commercial real estate management 169 170 170 165 164 164 171 180 189
Nordic countries 113 112 115 112 112 113 120 128 135
Germany 37 38 36 34 34 33 33 33 33
Baltic countries 19 19 19 19 18 18 18 19 21
Other 0 1 0 0 0 0 0 0 0
Residential real estate management 90 91 90 90 91 94 99 103 102
Nordic countries 78 81 81 81 83 87 93 96 96
Germany 12 10 9 9 8 7 6 7 6
Baltic countries 0 0 0 0 0 0 0 0 0
Other 0 0 0 0 0 0 0 0 0
Housing co-operative associations 43 44 45 48 49 50 51 54 55
Sweden
Public administration 89 90 94 83 90 77 72 65 67
Households 567 563 573 586 584 575 581 593 596
Nordic countries 513 508 518 531 528 519 526 536 536
Germany 0 0 0 0 0 0 0 0 0
Baltic countries 46 48 47 47 48 48 48 50 52
Other 8 7 8 8 8 8 7 7 8
Total credit portfolio 2,077 2,094 2,190 2,108 2,123 2,065 1,993 2,069 2,153
* Geographic distribution is based on where the loan is booked. Before loan loss reserves, excluding repos & debt instruments.
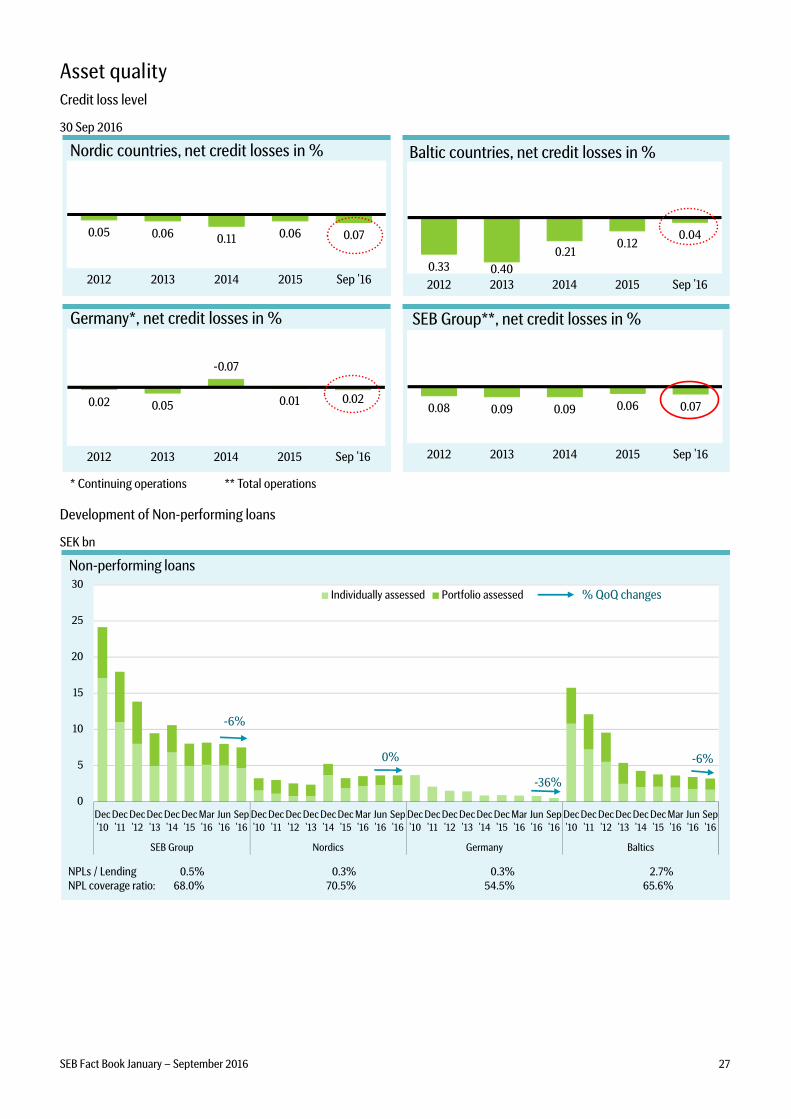
SEB Fact Book January – September 2016 27
Asset quality
Credit loss level
30 Sep 2016
0.05 0.06 0.11 0.06 0.07
2012 2013 2014 2015 Sep '16
Nordic countries, net credit losses in %
0.33 0.40
0.210.12
0.04
2012 2013 2014 2015 Sep '16
0.08 0.09 0.09 0.06 0.07
2012 2013 2014 2015 Sep '16
Baltic countries, net credit losses in %
Germany*, net credit losses in % SEB Group**, net credit losses in %
0.02 0.05
-0.07
0.01 0.02
2012 2013 2014 2015 Sep '16
* Continuing operations ** Total operations
Development of Non-performing loans
SEK bn
Non-performing loans
0
5
10
15
20
25
30
Dec
'10
Dec
'11
Dec
'12
Dec
'13
Dec
'14
Dec
'15
Mar
'16
Jun
'16
Sep
'16
Dec
'10
Dec
'11
Dec
'12
Dec
'13
Dec
'14
Dec
'15
Mar
'16
Jun
'16
Sep
'16
Dec
'10
Dec
'11
Dec
'12
Dec
'13
Dec
'14
Dec
'15
Mar
'16
Jun
'16
Sep
'16
Dec
'10
Dec
'11
Dec
'12
Dec
'13
Dec
'14
Dec
'15
Mar
'16
Jun
'16
Sep
'16
SEB Group Nordics Germany Baltics
Individually assessed Portfolio assessed
-6%
% QoQ changes
-36%
-6%0%
NPLs / Lending 0.5% 0.3% 0.3% 2.7%
NPL coverage ratio: 68.0% 70.5% 54.5% 65.6%
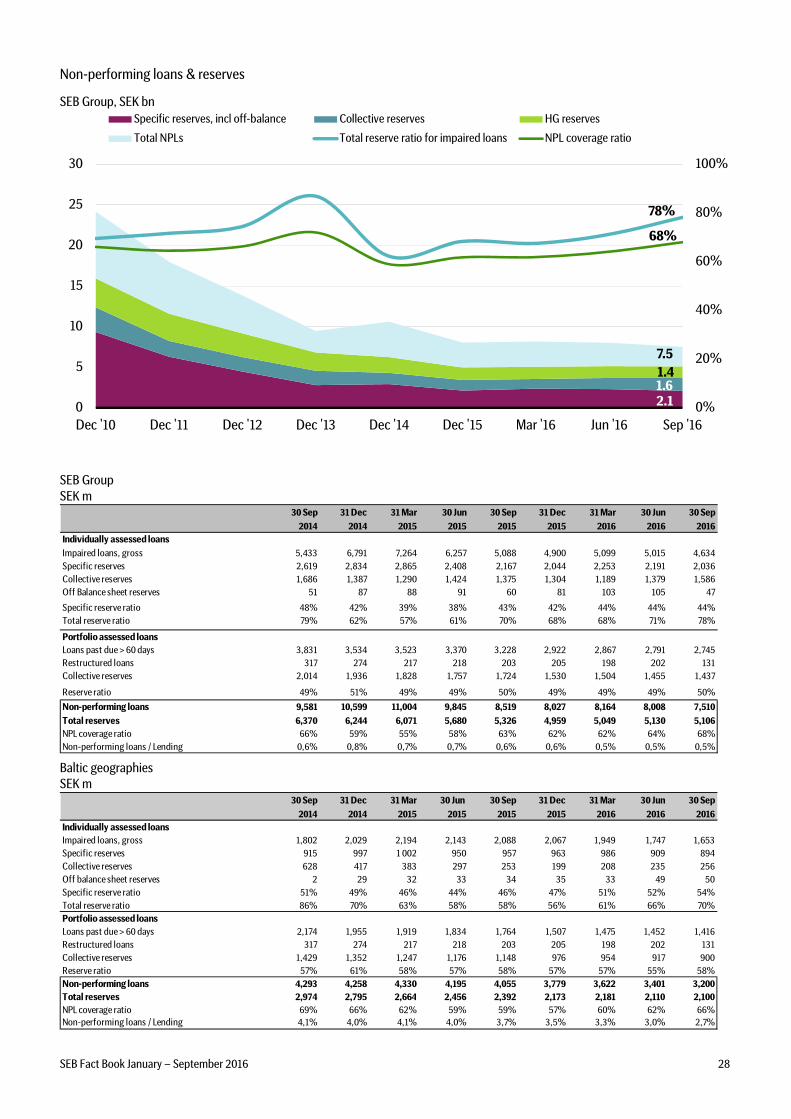
SEB Fact Book January – September 2016 28
Non-performing loans & reserves
SEB Group, SEK bn
0%
20%
40%
60%
80%
100%
0
5
10
15
20
25
30
Dec '10 Dec '11 Dec '12 Dec '13 Dec '14 Dec '15 Mar '16 Jun '16 Sep '16
Specific reserves, incl off-balance Collective reserves HG reserves
Total NPLs Total reserve ratio for impaired loans NPL coverage ratio
7.5
1.41.62.1
78%
68%
SEB Group
SEK m 30 Sep 31 Dec 31 Mar 30 Jun 30 Sep 31 Dec 31 Mar 30 Jun 30 Sep
2014 2014 2015 2015 2015 2015 2016 2016 2016
Individually assessed loans
Impaired loans, gross 5,433 6,791 7,264 6,257 5,088 4,900 5,099 5,015 4,634
Specific reserves 2,619 2,834 2,865 2,408 2,167 2,044 2,253 2,191 2,036
Collective reserves 1,686 1,387 1,290 1,424 1,375 1,304 1,189 1,379 1,586
Off Balance sheet reserves 51 87 88 91 60 81 103 105 47
Specific reserve ratio 48% 42% 39% 38% 43% 42% 44% 44% 44%
Total reserve ratio 79% 62% 57% 61% 70% 68% 68% 71% 78%
Portfolio assessed loans
Loans past due > 60 days 3,831 3,534 3,523 3,370 3,228 2,922 2,867 2,791 2,745
Restructured loans 317 274 217 218 203 205 198 202 131
Collective reserves 2,014 1,936 1,828 1,757 1,724 1,530 1,504 1,455 1,437
Reserve ratio 49% 51% 49% 49% 50% 49% 49% 49% 50%
Non-performing loans 9,581 10,599 11,004 9,845 8,519 8,027 8,164 8,008 7,510
Total reserves 6,370 6,244 6,071 5,680 5,326 4,959 5,049 5,130 5,106
NPL coverage ratio 66% 59% 55% 58% 63% 62% 62% 64% 68%
Non-performing loans / Lending 0,6% 0,8% 0,7% 0,7% 0,6% 0,6% 0,5% 0,5% 0,5%
Baltic geographies
SEK m 30 Sep 31 Dec 31 Mar 30 Jun 30 Sep 31 Dec 31 Mar 30 Jun 30 Sep
2014 2014 2015 2015 2015 2015 2016 2016 2016
Individually assessed loans
Impaired loans, gross 1,802 2,029 2,194 2,143 2,088 2,067 1,949 1,747 1,653
Specific reserves 915 997 1 002 950 957 963 986 909 894
Collective reserves 628 417 383 297 253 199 208 235 256
Off balance sheet reserves 2 29 32 33 34 35 33 49 50
Specific reserve ratio 51% 49% 46% 44% 46% 47% 51% 52% 54%
Total reserve ratio 86% 70% 63% 58% 58% 56% 61% 66% 70%
Portfolio assessed loans
Loans past due > 60 days 2,174 1,955 1,919 1,834 1,764 1,507 1,475 1,452 1,416
Restructured loans 317 274 217 218 203 205 198 202 131
Collective reserves 1,429 1,352 1,247 1,176 1,148 976 954 917 900
Reserve ratio 57% 61% 58% 57% 58% 57% 57% 55% 58%
Non-performing loans 4,293 4,258 4,330 4,195 4,055 3,779 3,622 3,401 3,200
Total reserves 2,974 2,795 2,664 2,456 2,392 2,173 2,181 2,110 2,100
NPL coverage ratio 69% 66% 62% 59% 59% 57% 60% 62% 66%
Non-performing loans / Lending 4,1% 4,0% 4,1% 4,0% 3,7% 3,5% 3,3% 3,0% 2,7%
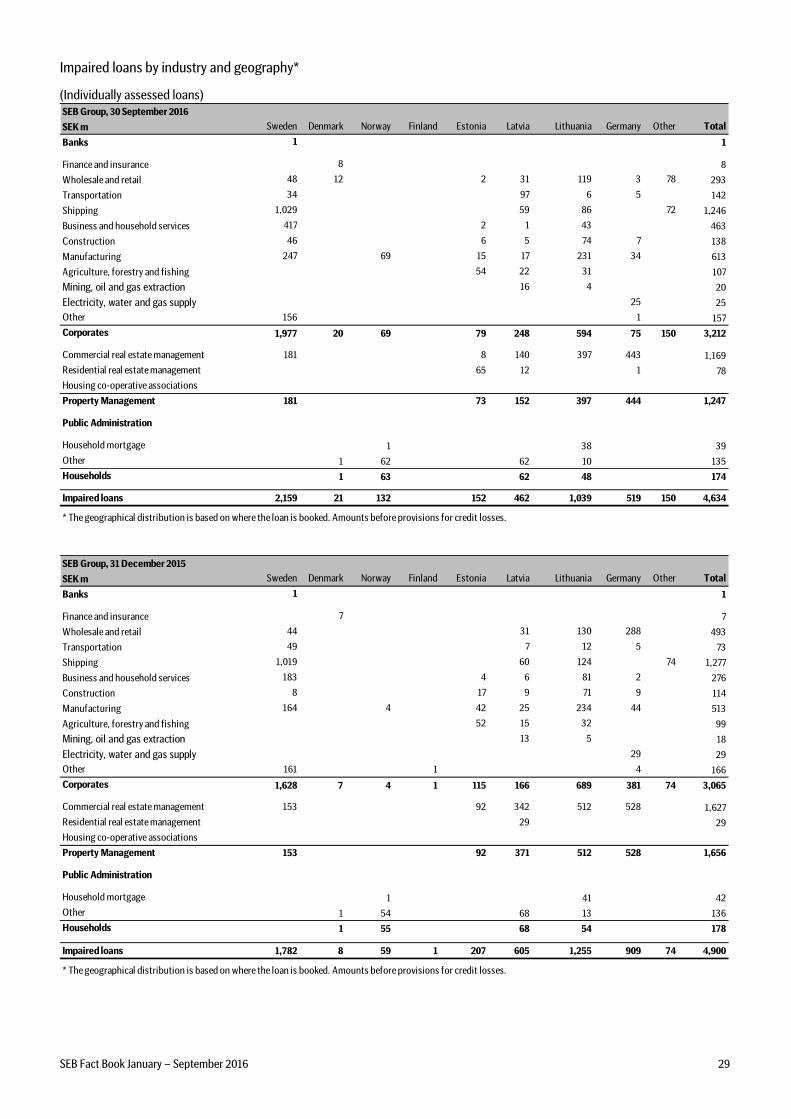
SEB Fact Book January – September 2016 29
Impaired loans by industry and geography*
(Individually assessed loans) SEB Group, 30 September 2016
SEK m Sweden Denmark Norway Finland Estonia Latvia Lithuania Germany Other Total
Banks 1 1
Finance and insurance 8 8
Wholesale and retail 48 12 2 31 119 3 78 293
Transportation 34 97 6 5 142
Shipping 1,029 59 86 72 1,246
Business and household services 417 2 1 43 463
Construction 46 6 5 74 7 138
Manufacturing 247 69 15 17 231 34 613
Agriculture, forestry and fishing 54 22 31 107
Mining, oil and gas extraction 16 4 20
Electricity, water and gas supply 25 25
Other 156 1 157
Corporates 1,977 20 69 79 248 594 75 150 3,212
Commercial real estate management 181 8 140 397 443 1,169
Residential real estate management 65 12 1 78
Housing co-operative associations
Property Management 181 73 152 397 444 1,247
Public Administration
Household mortgage 1 38 39
Other 1 62 62 10 135
Households 1 63 62 48 174
Impaired loans 2,159 21 132 152 462 1,039 519 150 4,634
* The geographical distribution is based on where the loan is booked. Amounts before provisions for credit losses.
SEB Group, 31 December 2015
SEK m Sweden Denmark Norway Finland Estonia Latvia Lithuania Germany Other Total
Banks 1 1
Finance and insurance 7 7
Wholesale and retail 44 31 130 288 493
Transportation 49 7 12 5 73
Shipping 1,019 60 124 74 1,277
Business and household services 183 4 6 81 2 276
Construction 8 17 9 71 9 114
Manufacturing 164 4 42 25 234 44 513
Agriculture, forestry and fishing 52 15 32 99
Mining, oil and gas extraction 13 5 18
Electricity, water and gas supply 29 29
Other 161 1 4 166
Corporates 1,628 7 4 1 115 166 689 381 74 3,065
Commercial real estate management 153 92 342 512 528 1,627
Residential real estate management 29 29
Housing co-operative associations
Property Management 153 92 371 512 528 1,656
Public Administration
Household mortgage 1 41 42
Other 1 54 68 13 136
Households 1 55 68 54 178
Impaired loans 1,782 8 59 1 207 605 1,255 909 74 4,900
* The geographical distribution is based on where the loan is booked. Amounts before provisions for credit losses.
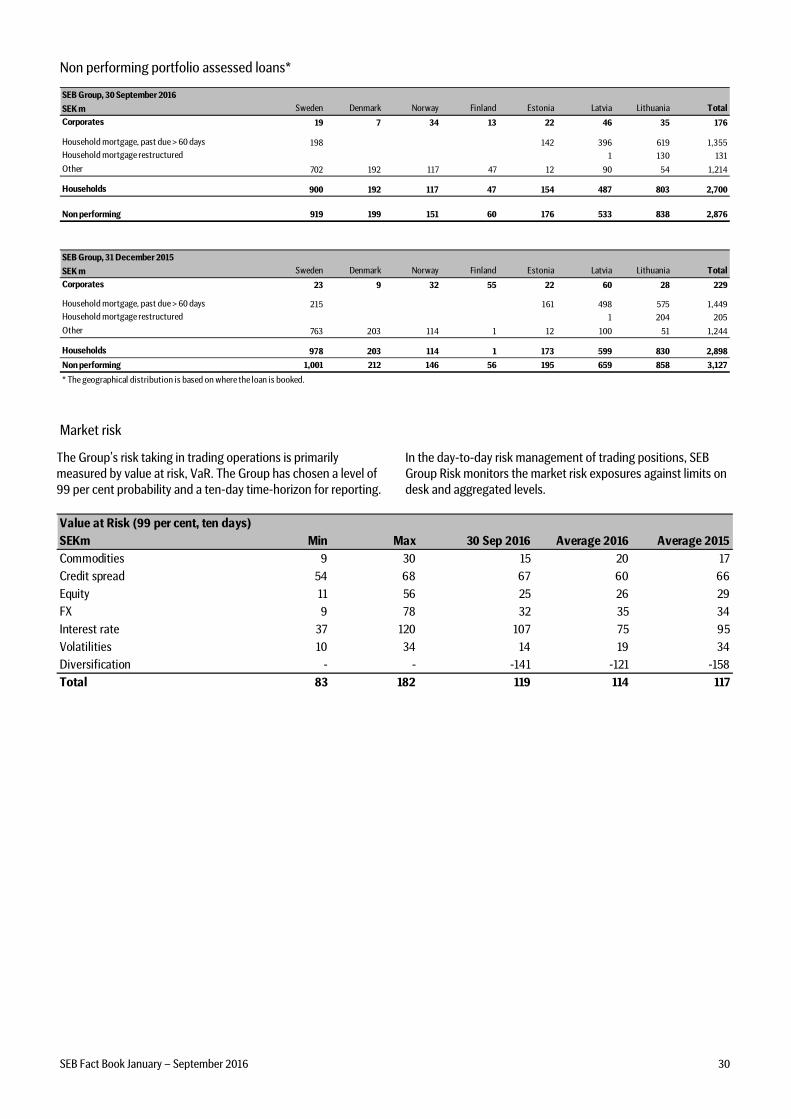
SEB Fact Book January – September 2016 30
Non performing portfolio assessed loans*
SEB Group, 30 September 2016
SEK m Sweden Denmark Norway Finland Estonia Latvia Lithuania Total
Corporates 19 7 34 13 22 46 35 176
Household mortgage, past due > 60 days 198 142 396 619 1,355
Household mortgage restructured 1 130 131
Other 702 192 117 47 12 90 54 1,214
Households 900 192 117 47 154 487 803 2,700
Non performing 919 199 151 60 176 533 838 2,876
SEB Group, 31 December 2015
SEK m Sweden Denmark Norway Finland Estonia Latvia Lithuania Total
Corporates 23 9 32 55 22 60 28 229
Household mortgage, past due > 60 days 215 161 498 575 1,449
Household mortgage restructured 1 204 205
Other 763 203 114 1 12 100 51 1,244
Households 978 203 114 1 173 599 830 2,898
Non performing 1,001 212 146 56 195 659 858 3,127
* The geographical distribution is based on where the loan is booked.
Market risk
The Group’s risk taking in trading operations is primarily
measured by value at risk, VaR. The Group has chosen a level of
99 per cent probability and a ten-day time-horizon for reporting.
In the day-to-day risk management of trading positions, SEB
Group Risk monitors the market risk exposures against limits on
desk and aggregated levels.
Value at Risk (99 per cent, ten days)
SEKm Min Max 30 Sep 2016 Average 2016 Average 2015
Commodities 9 30 15 20 17
Credit spread 54 68 67 60 66
Equity 11 56 25 26 29
FX 9 78 32 35 34
Interest rate 37 120 107 75 95
Volatilities 10 34 14 19 34
Diversification - - -141 -121 -158
Total 83 182 119 114 117
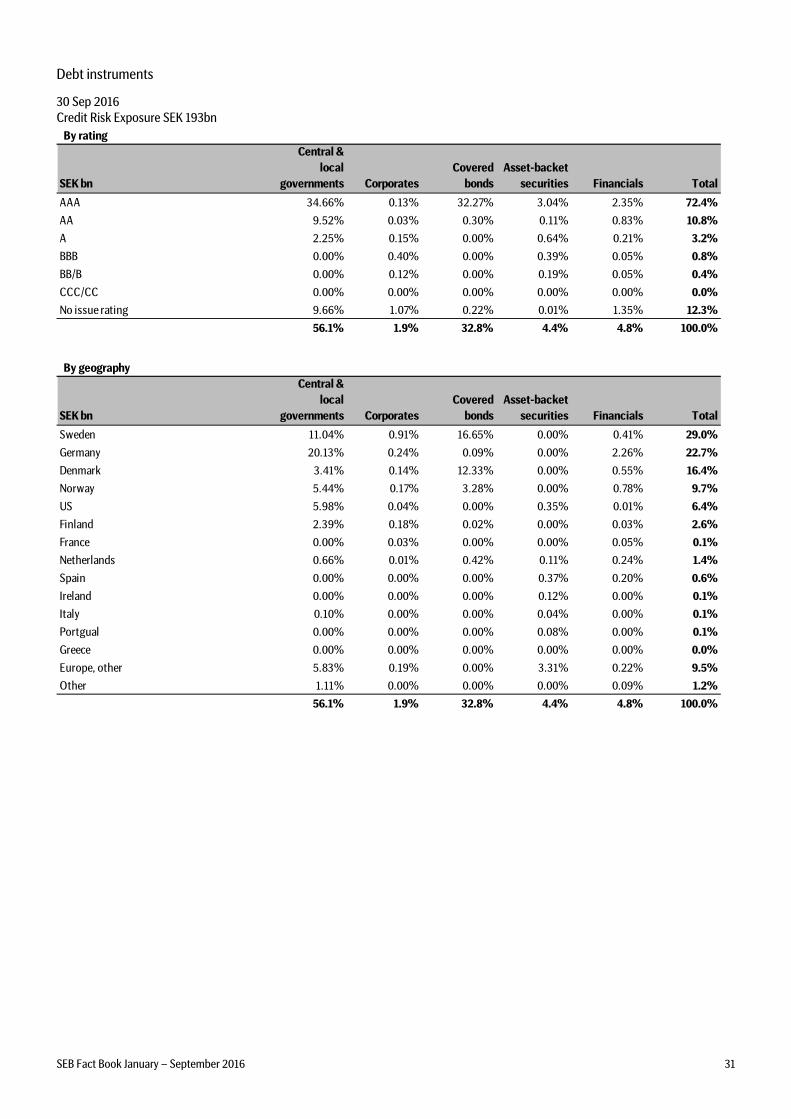
SEB Fact Book January – September 2016 31
Debt instruments
30 Sep 2016
Credit Risk Exposure SEK 193bn
By rating
SEK bn
Central &
local
governments Corporates
Covered
bonds
Asset-backet
securities Financials Total
AAA 34.66% 0.13% 32.27% 3.04% 2.35% 72.4%
AA 9.52% 0.03% 0.30% 0.11% 0.83% 10.8%
A 2.25% 0.15% 0.00% 0.64% 0.21% 3.2%
BBB 0.00% 0.40% 0.00% 0.39% 0.05% 0.8%
BB/B 0.00% 0.12% 0.00% 0.19% 0.05% 0.4%
CCC/CC 0.00% 0.00% 0.00% 0.00% 0.00% 0.0%
No issue rating 9.66% 1.07% 0.22% 0.01% 1.35% 12.3%
56.1% 1.9% 32.8% 4.4% 4.8% 100.0%
By geography
SEK bn
Central &
local
governments Corporates
Covered
bonds
Asset-backet
securities Financials Total
Sweden 11.04% 0.91% 16.65% 0.00% 0.41% 29.0%
Germany 20.13% 0.24% 0.09% 0.00% 2.26% 22.7%
Denmark 3.41% 0.14% 12.33% 0.00% 0.55% 16.4%
Norway 5.44% 0.17% 3.28% 0.00% 0.78% 9.7%
US 5.98% 0.04% 0.00% 0.35% 0.01% 6.4%
Finland 2.39% 0.18% 0.02% 0.00% 0.03% 2.6%
France 0.00% 0.03% 0.00% 0.00% 0.05% 0.1%
Netherlands 0.66% 0.01% 0.42% 0.11% 0.24% 1.4%
Spain 0.00% 0.00% 0.00% 0.37% 0.20% 0.6%
Ireland 0.00% 0.00% 0.00% 0.12% 0.00% 0.1%
Italy 0.10% 0.00% 0.00% 0.04% 0.00% 0.1%
Portgual 0.00% 0.00% 0.00% 0.08% 0.00% 0.1%
Greece 0.00% 0.00% 0.00% 0.00% 0.00% 0.0%
Europe, other 5.83% 0.19% 0.00% 3.31% 0.22% 9.5%
Other 1.11% 0.00% 0.00% 0.00% 0.09% 1.2%
56.1% 1.9% 32.8% 4.4% 4.8% 100.0%
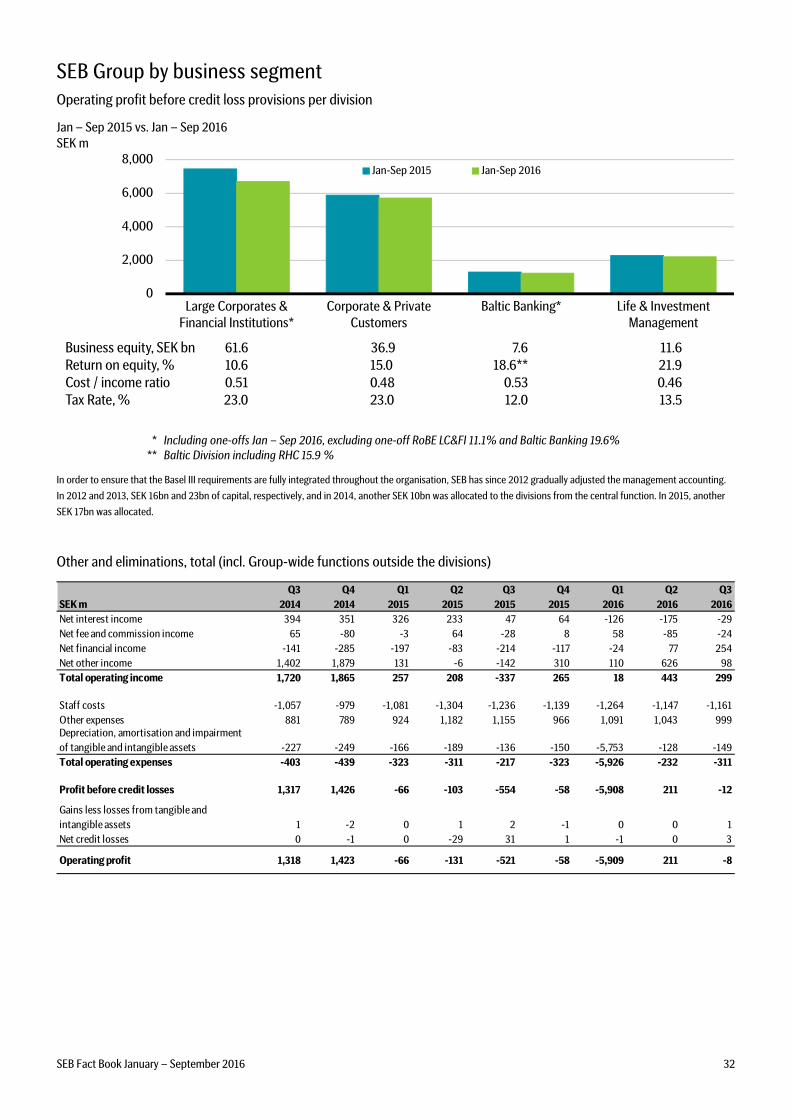
SEB Fact Book January – September 2016 32
SEB Group by business segment
Operating profit before credit loss provisions per division
Jan – Sep 2015 vs. Jan – Sep 2016
SEK m
Business equity, SEK bn 61.6 36.9 7.6 11.6
Return on equity, % 10.6 15.0 18.6** 21.9
Cost / income ratio 0.51 0.48 0.53 0.46
Tax Rate, % 23.0 23.0 12.0 13.5
0
2,000
4,000
6,000
8,000
Large Corporates &
Financial Institutions*
Corporate & Private
Customers
Baltic Banking* Life & Investment
Management
Jan-Sep 2015 Jan-Sep 2016
* Including one-offs Jan – Sep 2016, excluding one-off RoBE LC&FI 11.1% and Baltic Banking 19.6%
** Baltic Division including RHC 15.9 %
In order to ensure that the Basel III requirements are fully integrated throughout the organisation, SEB has since 2012 gradually adjusted the management accounting.
In 2012 and 2013, SEK 16bn and 23bn of capital, respectively, and in 2014, another SEK 10bn was allocated to the divisions from the central function. In 2015, another
SEK 17bn was allocated.
Other and eliminations, total (incl. Group-wide functions outside the divisions)
SEK m
Q3
2014
Q4
2014
Q1
2015
Q2
2015
Q3
2015
Q4
2015
Q1
2016
Q2
2016
Q3
2016
Net interest income 394 351 326 233 47 64 -126 -175 -29
Net fee and commission income 65 -80 -3 64 -28 8 58 -85 -24
Net financial income -141 -285 -197 -83 -214 -117 -24 77 254
Net other income 1,402 1,879 131 -6 -142 310 110 626 98
Total operating income 1,720 1,865 257 208 -337 265 18 443 299
Staff costs -1,057 -979 -1,081 -1,304 -1,236 -1,139 -1,264 -1,147 -1,161
Other expenses 881 789 924 1,182 1,155 966 1,091 1,043 999Depreciation, amortisation and impairment
of tangible and intangible assets -227 -249 -166 -189 -136 -150 -5,753 -128 -149
Total operating expenses -403 -439 -323 -311 -217 -323 -5,926 -232 -311
Profit before credit losses 1,317 1,426 -66 -103 -554 -58 -5,908 211 -12
Gains less losses from tangible and
intangible assets 1 -2 0 1 2 -1 0 0 1
Net credit losses 0 -1 0 -29 31 1 -1 0 3
Operating profit 1,318 1,423 -66 -131 -521 -58 -5,909 211 -8
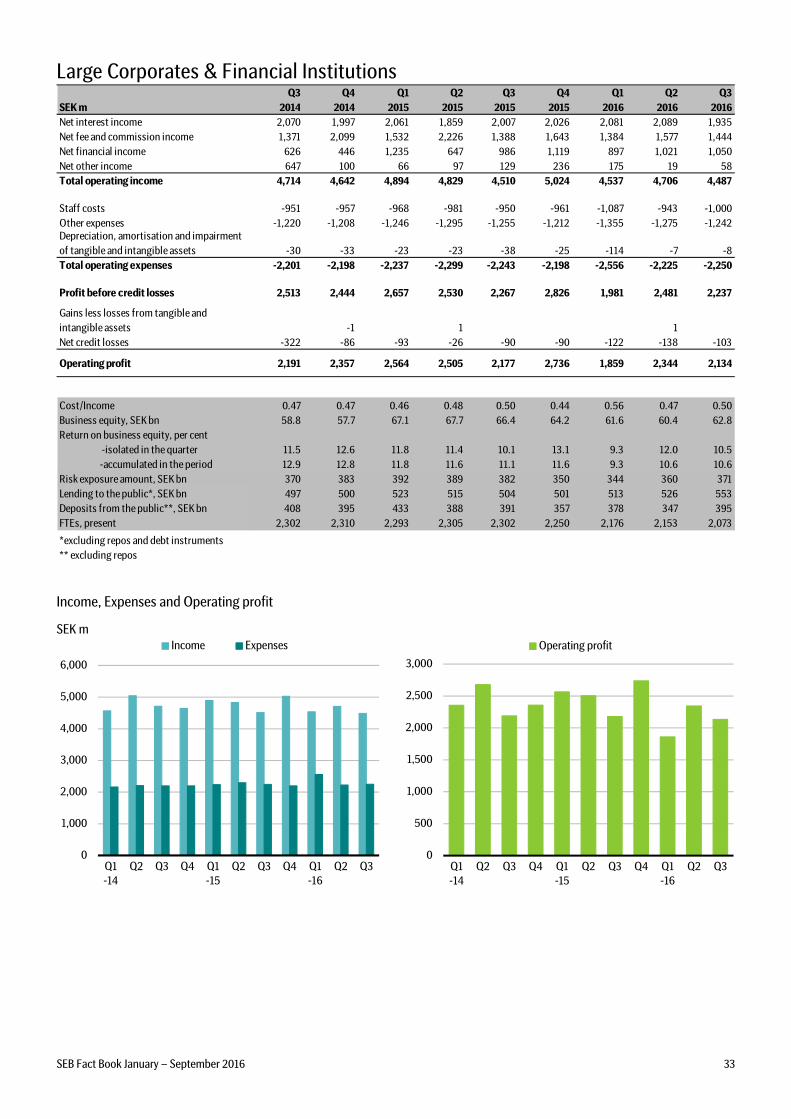
SEB Fact Book January – September 2016 33
Large Corporates & Financial Institutions
SEK m
Q3
2014
Q4
2014
Q1
2015
Q2
2015
Q3
2015
Q4
2015
Q1
2016
Q2
2016
Q3
2016
Net interest income 2,070 1,997 2,061 1,859 2,007 2,026 2,081 2,089 1,935
Net fee and commission income 1,371 2,099 1,532 2,226 1,388 1,643 1,384 1,577 1,444
Net financial income 626 446 1,235 647 986 1,119 897 1,021 1,050
Net other income 647 100 66 97 129 236 175 19 58
Total operating income 4,714 4,642 4,894 4,829 4,510 5,024 4,537 4,706 4,487
Staff costs -951 -957 -968 -981 -950 -961 -1,087 -943 -1,000
Other expenses -1,220 -1,208 -1,246 -1,295 -1,255 -1,212 -1,355 -1,275 -1,242Depreciation, amortisation and impairment
of tangible and intangible assets -30 -33 -23 -23 -38 -25 -114 -7 -8
Total operating expenses -2,201 -2,198 -2,237 -2,299 -2,243 -2,198 -2,556 -2,225 -2,250
Profit before credit losses 2,513 2,444 2,657 2,530 2,267 2,826 1,981 2,481 2,237
Gains less losses from tangible and
intangible assets -1 1 1
Net credit losses -322 -86 -93 -26 -90 -90 -122 -138 -103
Operating profit 2,191 2,357 2,564 2,505 2,177 2,736 1,859 2,344 2,134
Cost/Income 0.47 0.47 0.46 0.48 0.50 0.44 0.56 0.47 0.50
Business equity, SEK bn 58.8 57.7 67.1 67.7 66.4 64.2 61.6 60.4 62.8
Return on business equity, per cent
-isolated in the quarter 11.5 12.6 11.8 11.4 10.1 13.1 9.3 12.0 10.5
-accumulated in the period 12.9 12.8 11.8 11.6 11.1 11.6 9.3 10.6 10.6
Risk exposure amount, SEK bn 370 383 392 389 382 350 344 360 371
Lending to the public*, SEK bn 497 500 523 515 504 501 513 526 553
Deposits from the public**, SEK bn 408 395 433 388 391 357 378 347 395
FTEs, present 2,302 2,310 2,293 2,305 2,302 2,250 2,176 2,153 2,073
*excluding repos and debt instruments
** excluding repos
Income, Expenses and Operating profit
SEK m
0
500
1,000
1,500
2,000
2,500
3,000
Q1-14
Q2 Q3 Q4 Q1-15
Q2 Q3 Q4 Q1-16
Q2 Q3
Operating profit
0
1,000
2,000
3,000
4,000
5,000
6,000
Q1-14
Q2 Q3 Q4 Q1-15
Q2 Q3 Q4 Q1-16
Q2 Q3
Income Expenses
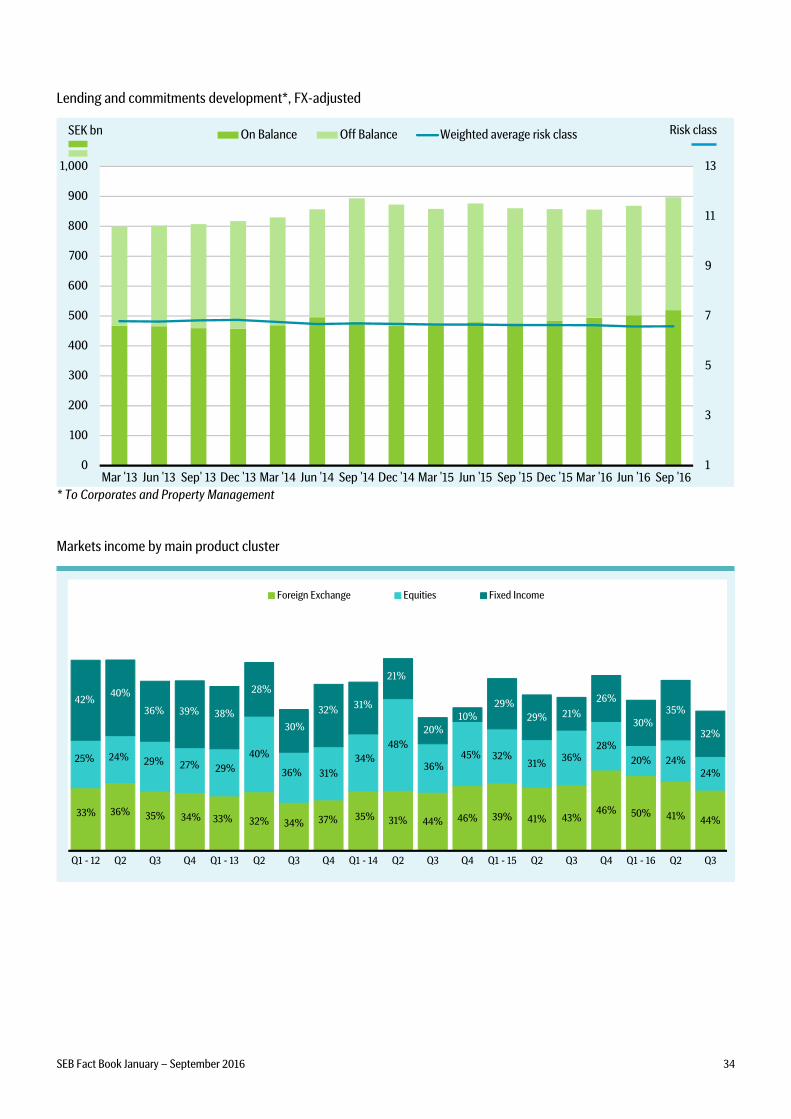
SEB Fact Book January – September 2016 34
Lending and commitments development*, FX-adjusted
1
3
5
7
9
11
13
0
100
200
300
400
500
600
700
800
900
1,000
Mar '13 Jun '13 Sep' 13 Dec '13 Mar '14 Jun '14 Sep '14 Dec '14 Mar '15 Jun '15 Sep '15 Dec '15 Mar '16 Jun '16 Sep '16
On Balance Off Balance Weighted average risk class Risk classSEK bn
* To Corporates and Property Management
Markets income by main product cluster
33% 36% 35% 34% 33% 32% 34% 37% 35% 31% 44% 46% 39% 41% 43%46% 50% 41% 44%
25% 24% 29% 27% 29%
40%
36% 31%
34%
48%45%
36%32%
31%36%
28%
20% 24%24%
42%40%
36% 39% 38%
28%
30%
32%31%
21%
20%
10%29%
29% 21%
26%
30%35%
32%
Q1 - 12 Q2 Q3 Q4 Q1 - 13 Q2 Q3 Q4 Q1 - 14 Q2 Q3 Q4 Q1 - 15 Q2 Q3 Q4 Q1 - 16 Q2 Q3
Foreign Exchange Equities Fixed Income
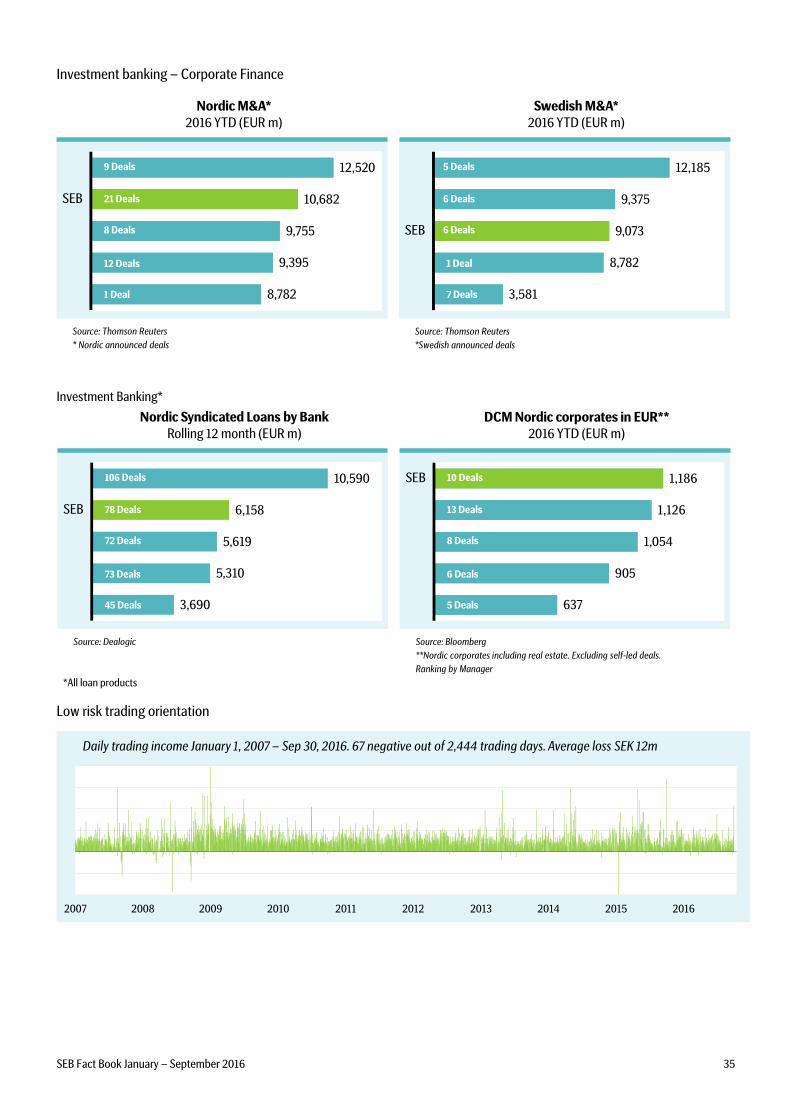
SEB Fact Book January – September 2016 35
Investment banking – Corporate Finance
3,581
8,782
9,073
9,375
12,185
SEB
8,782
9,395
9,755
10,682
12,520
SEB
9 Deals
21 Deals
8 Deals
12 Deals
1 Deal
Source: Thomson Reuters
* Nordic announced deals
Nordic M&A*2016 YTD (EUR m)
5 Deals
6 Deals
6 Deals
1 Deal
7 Deals
Source: Thomson Reuters
*Swedish announced deals
Swedish M&A*2016 YTD (EUR m)
Investment Banking*
3,690
5,310
5,619
6,158
10,590
SEB
106 Deals
78 Deals
72 Deals
73 Deals
45 Deals
Source: Dealogic
Nordic Syndicated Loans by BankRolling 12 month (EUR m)
37 Deals
30 Deals
24 Deals
16 Deals
8 Deals
*All loan products
637
905
1,054
1,126
1,186SEB 10 Deals
13 Deals
8 Deals
6 Deals
5 Deals
Source: Bloomberg
**Nordic corporates including real estate. Excluding self-led deals.
Ranking by Manager
DCM Nordic corporates in EUR**2016 YTD (EUR m)
Low risk trading orientation
2007 2008 2009 2010 2011 2012 2013 2014 2015 2016
Daily trading income January 1, 2007 – Sep 30, 2016. 67 negative out of 2,444 trading days. Average loss SEK 12m
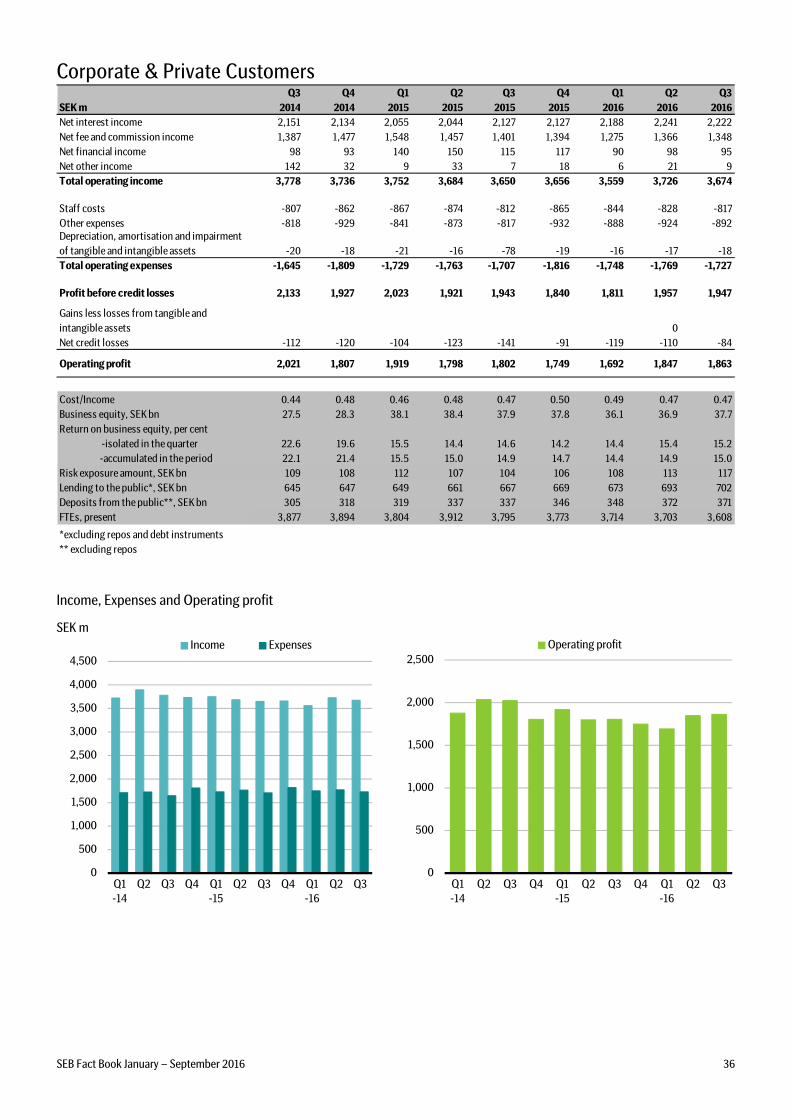
SEB Fact Book January – September 2016 36
Corporate & Private Customers
SEK m
Q3
2014
Q4
2014
Q1
2015
Q2
2015
Q3
2015
Q4
2015
Q1
2016
Q2
2016
Q3
2016
Net interest income 2,151 2,134 2,055 2,044 2,127 2,127 2,188 2,241 2,222
Net fee and commission income 1,387 1,477 1,548 1,457 1,401 1,394 1,275 1,366 1,348
Net financial income 98 93 140 150 115 117 90 98 95
Net other income 142 32 9 33 7 18 6 21 9
Total operating income 3,778 3,736 3,752 3,684 3,650 3,656 3,559 3,726 3,674
Staff costs -807 -862 -867 -874 -812 -865 -844 -828 -817
Other expenses -818 -929 -841 -873 -817 -932 -888 -924 -892Depreciation, amortisation and impairment
of tangible and intangible assets -20 -18 -21 -16 -78 -19 -16 -17 -18
Total operating expenses -1,645 -1,809 -1,729 -1,763 -1,707 -1,816 -1,748 -1,769 -1,727
Profit before credit losses 2,133 1,927 2,023 1,921 1,943 1,840 1,811 1,957 1,947
Gains less losses from tangible and
intangible assets 0
Net credit losses -112 -120 -104 -123 -141 -91 -119 -110 -84
Operating profit 2,021 1,807 1,919 1,798 1,802 1,749 1,692 1,847 1,863
Cost/Income 0.44 0.48 0.46 0.48 0.47 0.50 0.49 0.47 0.47
Business equity, SEK bn 27.5 28.3 38.1 38.4 37.9 37.8 36.1 36.9 37.7
Return on business equity, per cent
-isolated in the quarter 22.6 19.6 15.5 14.4 14.6 14.2 14.4 15.4 15.2
-accumulated in the period 22.1 21.4 15.5 15.0 14.9 14.7 14.4 14.9 15.0
Risk exposure amount, SEK bn 109 108 112 107 104 106 108 113 117
Lending to the public*, SEK bn 645 647 649 661 667 669 673 693 702
Deposits from the public**, SEK bn 305 318 319 337 337 346 348 372 371
FTEs, present 3,877 3,894 3,804 3,912 3,795 3,773 3,714 3,703 3,608
*excluding repos and debt instruments
** excluding repos
Income, Expenses and Operating profit
SEK m
0
500
1,000
1,500
2,000
2,500
Q1-14
Q2 Q3 Q4 Q1-15
Q2 Q3 Q4 Q1-16
Q2 Q3
Operating profit
0
500
1,000
1,500
2,000
2,500
3,000
3,500
4,000
4,500
Q1-14
Q2 Q3 Q4 Q1-15
Q2 Q3 Q4 Q1-16
Q2 Q3
Income Expenses
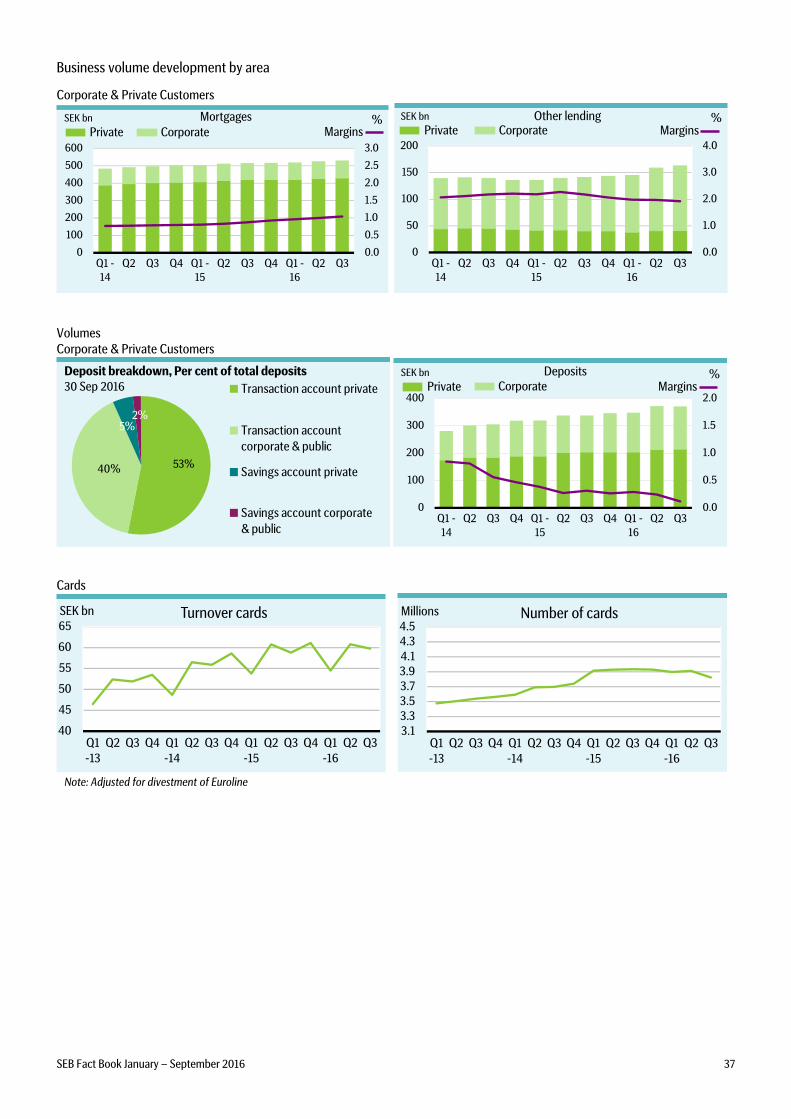
SEB Fact Book January – September 2016 37
Business volume development by area
Corporate & Private Customers
0.0
0.5
1.0
1.5
2.0
2.5
3.0
0
100
200
300
400
500
600
Q1 -
14
Q2 Q3 Q4 Q1 -
15
Q2 Q3 Q4 Q1 -
16
Q2 Q3
Mortgages
Private Margins%
CorporateSEK bn
0.0
1.0
2.0
3.0
4.0
0
50
100
150
200
Q1 -14
Q2 Q3 Q4 Q1 -15
Q2 Q3 Q4 Q1 -16
Q2 Q3
Other lendingPrivate Margins
%SEK bn
Corporate
Volumes
Corporate & Private Customers
5%
53%40%
2%
Transaction account private
Transaction account
corporate & public
Savings account private
Savings account corporate
& public
Deposit breakdown, Per cent of total deposits30 Sep 2016
0.0
0.5
1.0
1.5
2.0
0
100
200
300
400
Q1 -
14
Q2 Q3 Q4 Q1 -
15
Q2 Q3 Q4 Q1 -
16
Q2 Q3
Deposits
Private Margins%SEK bn
Corporate
Cards
40
45
50
55
60
65
Q1
-13
Q2 Q3 Q4 Q1
-14
Q2 Q3 Q4 Q1
-15
Q2 Q3 Q4 Q1
-16
Q2 Q3
SEK bn Turnover cards
3.13.33.53.73.94.14.34.5
Q1
-13
Q2 Q3 Q4 Q1
-14
Q2 Q3 Q4 Q1
-15
Q2 Q3 Q4 Q1
-16
Q2 Q3
Millions Number of cards
Note: Adjusted for divestment of Euroline
=
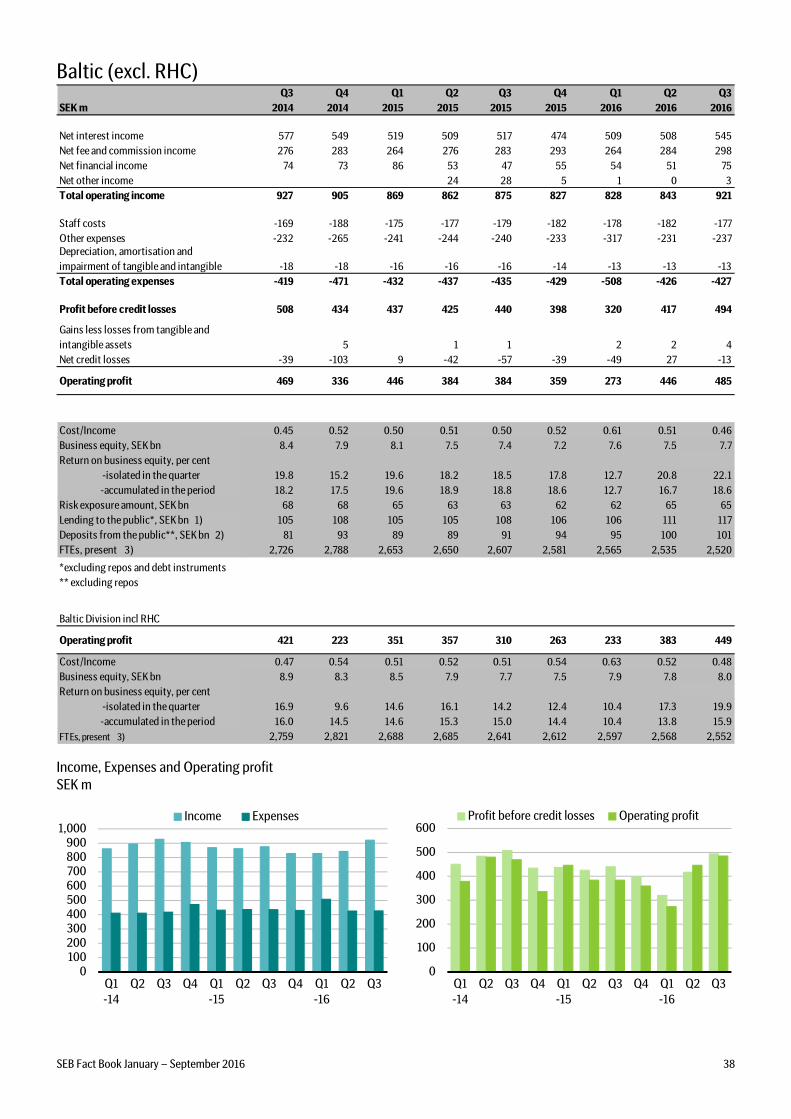
SEB Fact Book January – September 2016 38
Baltic (excl. RHC)
SEK m
Q3
2014
Q4
2014
Q1
2015
Q2
2015
Q3
2015
Q4
2015
Q1
2016
Q2
2016
Q3
2016
Net interest income 577 549 519 509 517 474 509 508 545
Net fee and commission income 276 283 264 276 283 293 264 284 298
Net financial income 74 73 86 53 47 55 54 51 75
Net other income 24 28 5 1 0 3
Total operating income 927 905 869 862 875 827 828 843 921
Staff costs -169 -188 -175 -177 -179 -182 -178 -182 -177
Other expenses -232 -265 -241 -244 -240 -233 -317 -231 -237Depreciation, amortisation and
impairment of tangible and intangible -18 -18 -16 -16 -16 -14 -13 -13 -13
Total operating expenses -419 -471 -432 -437 -435 -429 -508 -426 -427
Profit before credit losses 508 434 437 425 440 398 320 417 494
Gains less losses from tangible and
intangible assets 5 1 1 2 2 4
Net credit losses -39 -103 9 -42 -57 -39 -49 27 -13
Operating profit 469 336 446 384 384 359 273 446 485
Cost/Income 0.45 0.52 0.50 0.51 0.50 0.52 0.61 0.51 0.46
Business equity, SEK bn 8.4 7.9 8.1 7.5 7.4 7.2 7.6 7.5 7.7
Return on business equity, per cent
-isolated in the quarter 19.8 15.2 19.6 18.2 18.5 17.8 12.7 20.8 22.1
-accumulated in the period 18.2 17.5 19.6 18.9 18.8 18.6 12.7 16.7 18.6
Risk exposure amount, SEK bn 68 68 65 63 63 62 62 65 65
Lending to the public*, SEK bn 1) 105 108 105 105 108 106 106 111 117
Deposits from the public**, SEK bn 2) 81 93 89 89 91 94 95 100 101
FTEs, present 3) 2,726 2,788 2,653 2,650 2,607 2,581 2,565 2,535 2,520
*excluding repos and debt instruments
** excluding repos
Baltic Division incl RHC
Operating profit 421 223 351 357 310 263 233 383 449
Cost/Income 0.47 0.54 0.51 0.52 0.51 0.54 0.63 0.52 0.48
Business equity, SEK bn 8.9 8.3 8.5 7.9 7.7 7.5 7.9 7.8 8.0
Return on business equity, per cent
-isolated in the quarter 16.9 9.6 14.6 16.1 14.2 12.4 10.4 17.3 19.9
-accumulated in the period 16.0 14.5 14.6 15.3 15.0 14.4 10.4 13.8 15.9
FTEs, present 3) 2,759 2,821 2,688 2,685 2,641 2,612 2,597 2,568 2,552
Income, Expenses and Operating profit
SEK m
0
100
200
300
400
500
600
Q1
-14
Q2 Q3 Q4 Q1
-15
Q2 Q3 Q4 Q1
-16
Q2 Q3
Profit before credit losses Operating profit
0100200300400500600700800900
1,000
Q1
-14
Q2 Q3 Q4 Q1
-15
Q2 Q3 Q4 Q1
-16
Q2 Q3
Income Expenses
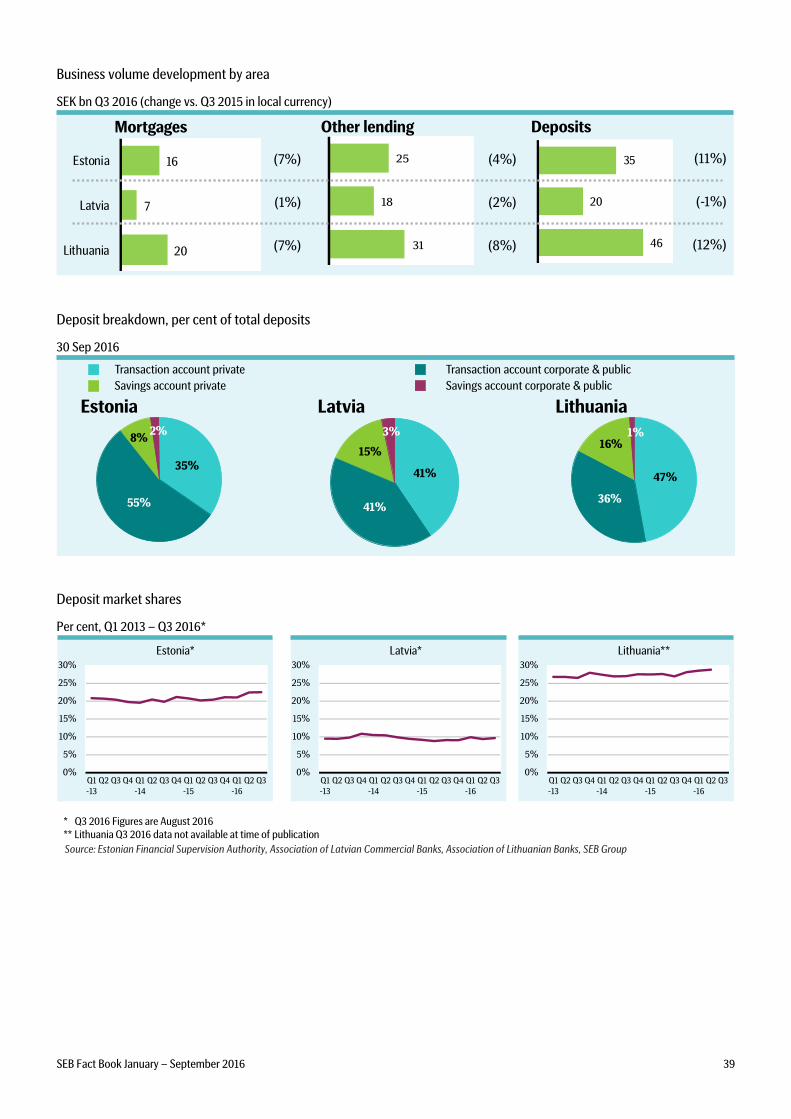
SEB Fact Book January – September 2016 39
Business volume development by area
SEK bn Q3 2016 (change vs. Q3 2015 in local currency)
31
18
25
20
7
16
Lithuania
Latvia
Estonia
Mortgages Other lending
46
20
35
Deposits
(7%)
(1%)
(7%)
(4%)
(2%)
(8%)
(11%)
(-1%)
(12%)
Deposit breakdown, per cent of total deposits
30 Sep 2016
Transaction account private Transaction account corporate & public
Savings account private Savings account corporate & public
Estonia Latvia Lithuania
55%
2%
35%
8%3%
41%
41%
15%
36%
1%16%
47%
Deposit market shares
Per cent, Q1 2013 – Q3 2016*
Source: Estonian Financial Supervision Authority, Association of Latvian Commercial Banks, Association of Lithuanian Banks, SEB Group
0%
5%
10%
15%
20%
25%
30%
Q1
-13
Q2 Q3 Q4 Q1
-14
Q2 Q3 Q4 Q1
-15
Q2 Q3 Q4 Q1
-16
Q2 Q3
Latvia*
0%
5%
10%
15%
20%
25%
30%
Q1
-13
Q2 Q3 Q4 Q1
-14
Q2 Q3 Q4 Q1
-15
Q2 Q3 Q4 Q1
-16
Q2 Q3
Lithuania**
0%
5%
10%
15%
20%
25%
30%
Q1
-13
Q2 Q3 Q4 Q1
-14
Q2 Q3 Q4 Q1
-15
Q2 Q3 Q4 Q1
-16
Q2 Q3
Estonia*
* Q3 2016 Figures are August 2016
** Lithuania Q3 2016 data not available at time of publication
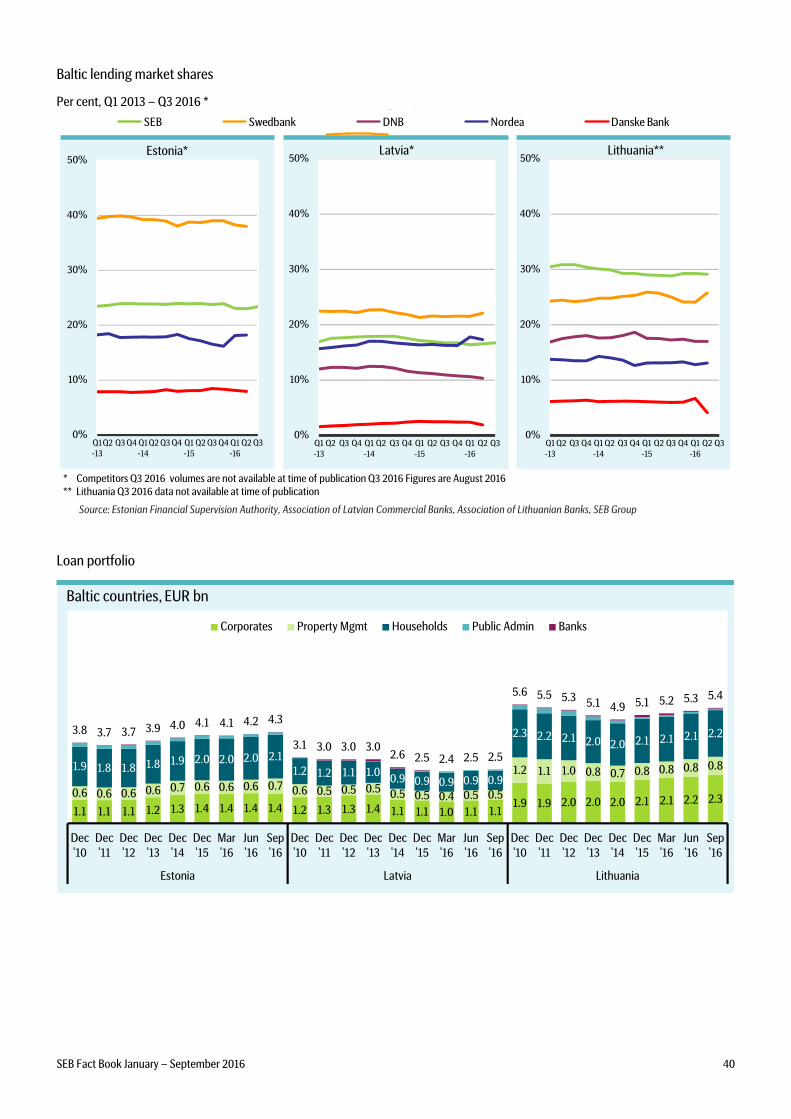
SEB Fact Book January – September 2016 40
Baltic lending market shares
Per cent, Q1 2013 – Q3 2016 * Estonia
SEB Swedbank DNB Nordea Danske Bank
Source: Estonian Financial Supervision Authority, Association of Latvian Commercial Banks, Association of Lithuanian Banks, SEB Group
0%
10%
20%
30%
40%
50%
Q1
-13
Q2 Q3 Q4 Q1
-14
Q2 Q3 Q4 Q1
-15
Q2 Q3 Q4 Q1
-16
Q2 Q3
Estonia*
0%
10%
20%
30%
40%
50%
Q1
-13
Q2 Q3 Q4 Q1
-14
Q2 Q3 Q4 Q1
-15
Q2 Q3 Q4 Q1
-16
Q2 Q3
Latvia*
0%
10%
20%
30%
40%
50%
Q1
-13
Q2 Q3 Q4 Q1
-14
Q2 Q3 Q4 Q1
-15
Q2 Q3 Q4 Q1
-16
Q2 Q3
Lithuania**
* Competitors Q3 2016 volumes are not available at time of publication Q3 2016 Figures are August 2016
** Lithuania Q3 2016 data not available at time of publication
Loan portfolio
Baltic countries, EUR bn
1.1 1.1 1.1 1.2 1.3 1.4 1.4 1.4 1.4 1.2 1.3 1.3 1.4 1.1 1.1 1.0 1.1 1.11.9 1.9 2.0 2.0 2.0 2.1 2.1 2.2 2.3
0.6 0.6 0.6 0.6 0.7 0.6 0.6 0.6 0.7 0.6 0.5 0.5 0.5 0.5 0.5 0.4 0.5 0.5
1.2 1.1 1.0 0.8 0.7 0.8 0.8 0.8 0.81.9 1.8 1.8 1.8 1.9 2.0 2.0 2.0 2.11.2 1.2 1.1 1.0
0.9 0.9 0.9 0.9 0.9
2.3 2.2 2.1 2.0 2.0 2.1 2.1 2.1 2.23.8 3.7 3.7 3.9 4.0 4.1 4.1 4.2 4.3
3.1 3.0 3.0 3.02.6 2.5 2.4 2.5 2.5
5.6 5.5 5.3 5.1 4.9 5.1 5.2 5.3 5.4
Dec
'10
Dec
'11
Dec
'12
Dec
'13
Dec
'14
Dec
'15
Mar
'16
Jun
'16
Sep
'16
Dec
'10
Dec
'11
Dec
'12
Dec
'13
Dec
'14
Dec
'15
Mar
'16
Jun
'16
Sep
'16
Dec
'10
Dec
'11
Dec
'12
Dec
'13
Dec
'14
Dec
'15
Mar
'16
Jun
'16
Sep
'16
Estonia Latvia Lithuania
Corporates Property Mgmt Households Public Admin Banks
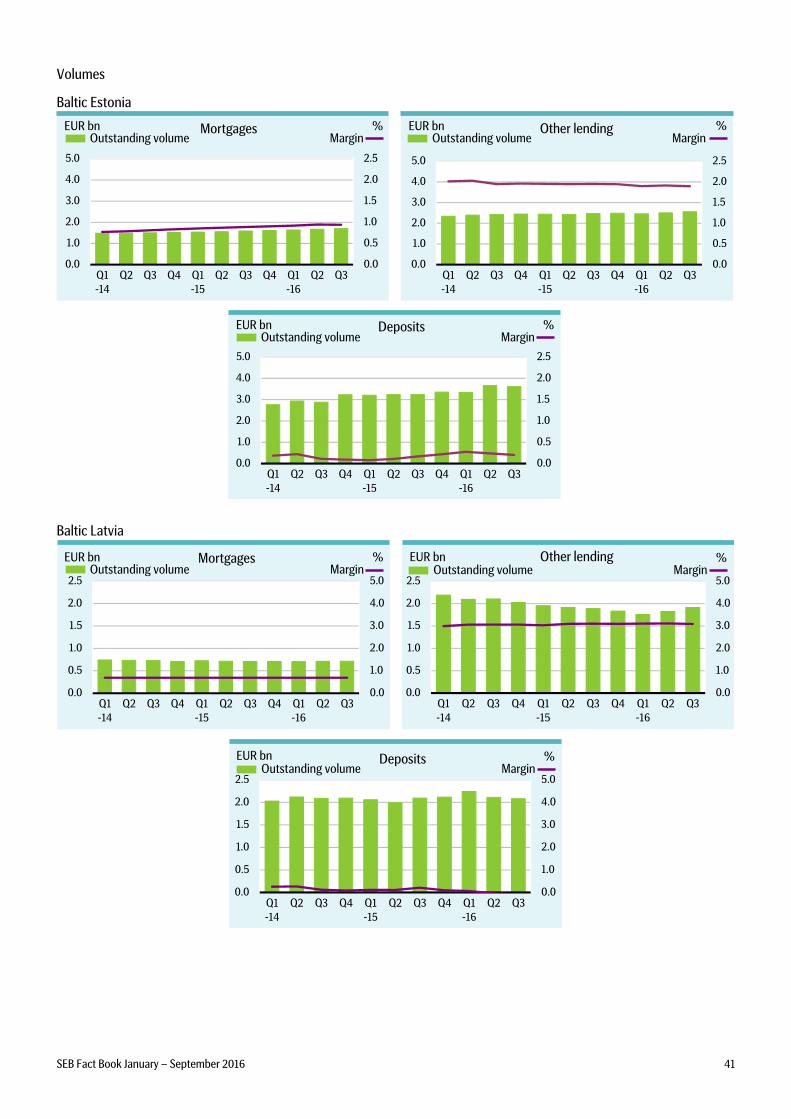
SEB Fact Book January – September 2016 41
Volumes
Baltic Estonia
0.0
0.5
1.0
1.5
2.0
2.5
0.0
1.0
2.0
3.0
4.0
5.0
Q1
-14
Q2 Q3 Q4 Q1
-15
Q2 Q3 Q4 Q1
-16
Q2 Q3
MortgagesOutstanding volume Margin
%Outstanding volume Margin
EUR bn EUR bn
0.0
0.5
1.0
1.5
2.0
2.5
0.0
1.0
2.0
3.0
4.0
5.0
Q1
-14
Q2 Q3 Q4 Q1
-15
Q2 Q3 Q4 Q1
-16
Q2 Q3
Deposits
%
Outstanding volume Margin%EUR bn
0.0
0.5
1.0
1.5
2.0
2.5
0.0
1.0
2.0
3.0
4.0
5.0
Q1
-14
Q2 Q3 Q4 Q1
-15
Q2 Q3 Q4 Q1
-16
Q2 Q3
Other lending
Baltic Latvia
0.0
1.0
2.0
3.0
4.0
5.0
0.0
0.5
1.0
1.5
2.0
2.5
Q1
-14
Q2 Q3 Q4 Q1
-15
Q2 Q3 Q4 Q1
-16
Q2 Q3
Mortgages
0.0
1.0
2.0
3.0
4.0
5.0
0.0
0.5
1.0
1.5
2.0
2.5
Q1
-14
Q2 Q3 Q4 Q1
-15
Q2 Q3 Q4 Q1
-16
Q2 Q3
Other lendingOutstanding volume Margin
%Outstanding volume Margin
%EUR bn EUR bn
0.0
1.0
2.0
3.0
4.0
5.0
0.0
0.5
1.0
1.5
2.0
2.5
Q1
-14
Q2 Q3 Q4 Q1
-15
Q2 Q3 Q4 Q1
-16
Q2 Q3
DepositsOutstanding volume Margin
%EUR bn
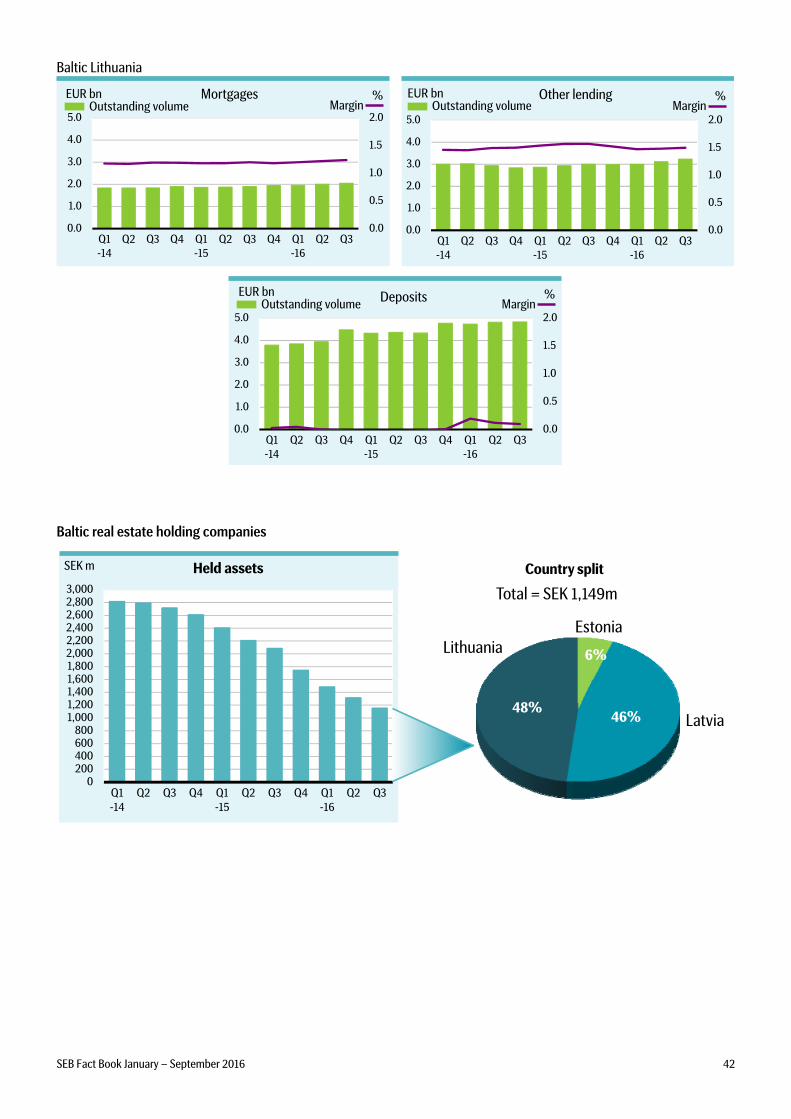
SEB Fact Book January – September 2016 42
Baltic Lithuania
0.0
0.5
1.0
1.5
2.0
0.0
1.0
2.0
3.0
4.0
5.0
Q1-14
Q2 Q3 Q4 Q1-15
Q2 Q3 Q4 Q1-16
Q2 Q3
Mortgages
0.0
0.5
1.0
1.5
2.0
0.0
1.0
2.0
3.0
4.0
5.0
Q1-14
Q2 Q3 Q4 Q1-15
Q2 Q3 Q4 Q1-16
Q2 Q3
Other lending
0.0
0.5
1.0
1.5
2.0
0.0
1.0
2.0
3.0
4.0
5.0
Q1
-14
Q2 Q3 Q4 Q1
-15
Q2 Q3 Q4 Q1
-16
Q2 Q3
Deposits
Outstanding volume Margin%
Outstanding volume Margin%EUR bn EUR bn
Outstanding volume Margin%EUR bn
Baltic real estate holding companies
0200400600800
1,0001,2001,4001,6001,8002,0002,2002,4002,6002,8003,000
Q1-14
Q2 Q3 Q4 Q1-15
Q2 Q3 Q4 Q1-16
Q2 Q3
Held assetsSEK m
6%
46%48%
Latvia
Estonia
Lithuania
Country split
Total = SEK 1,149m
=
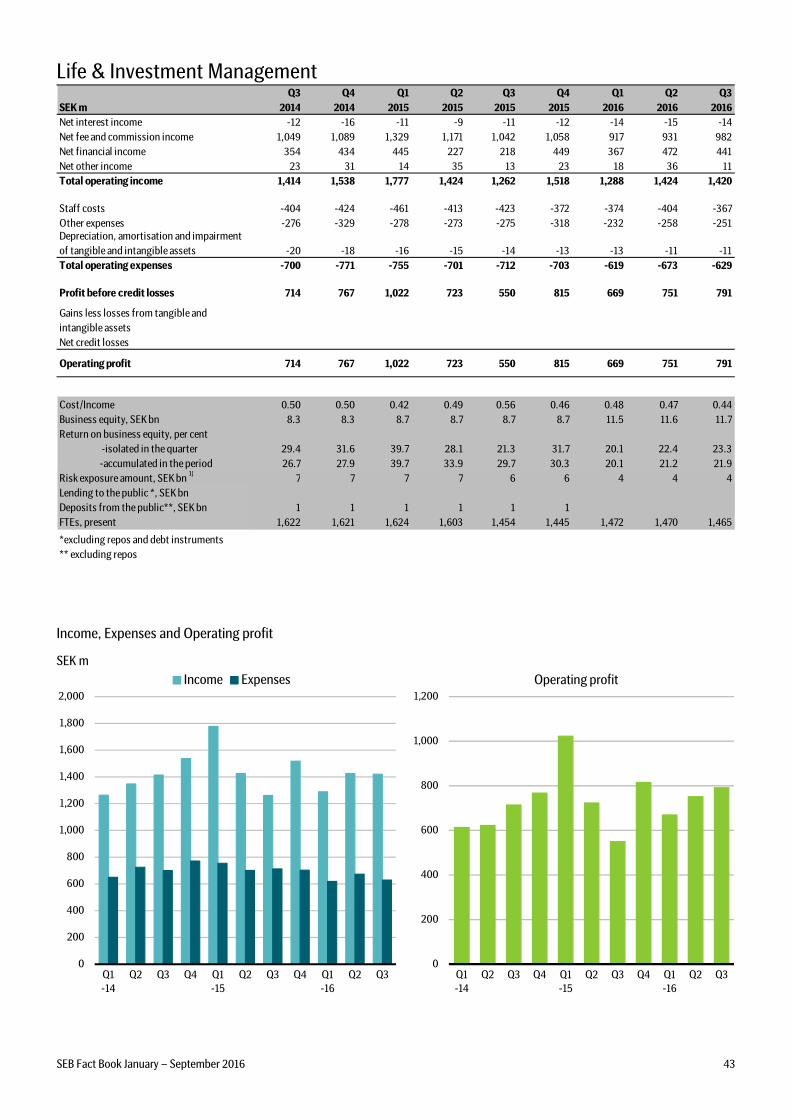
SEB Fact Book January – September 2016 43
Life & Investment Management
SEK m
Q3
2014
Q4
2014
Q1
2015
Q2
2015
Q3
2015
Q4
2015
Q1
2016
Q2
2016
Q3
2016
Net interest income -12 -16 -11 -9 -11 -12 -14 -15 -14
Net fee and commission income 1,049 1,089 1,329 1,171 1,042 1,058 917 931 982
Net financial income 354 434 445 227 218 449 367 472 441
Net other income 23 31 14 35 13 23 18 36 11
Total operating income 1,414 1,538 1,777 1,424 1,262 1,518 1,288 1,424 1,420
Staff costs -404 -424 -461 -413 -423 -372 -374 -404 -367
Other expenses -276 -329 -278 -273 -275 -318 -232 -258 -251Depreciation, amortisation and impairment
of tangible and intangible assets -20 -18 -16 -15 -14 -13 -13 -11 -11
Total operating expenses -700 -771 -755 -701 -712 -703 -619 -673 -629
Profit before credit losses 714 767 1,022 723 550 815 669 751 791
Gains less losses from tangible and
intangible assets
Net credit losses
Operating profit 714 767 1,022 723 550 815 669 751 791
Cost/Income 0.50 0.50 0.42 0.49 0.56 0.46 0.48 0.47 0.44
Business equity, SEK bn 8.3 8.3 8.7 8.7 8.7 8.7 11.5 11.6 11.7
Return on business equity, per cent
-isolated in the quarter 29.4 31.6 39.7 28.1 21.3 31.7 20.1 22.4 23.3
-accumulated in the period 26.7 27.9 39.7 33.9 29.7 30.3 20.1 21.2 21.9
Risk exposure amount, SEK bn 1)
7 7 7 7 6 6 4 4 4
Lending to the public *, SEK bn
Deposits from the public**, SEK bn 1 1 1 1 1 1
FTEs, present 1,622 1,621 1,624 1,603 1,454 1,445 1,472 1,470 1,465
*excluding repos and debt instruments
** excluding repos
Income, Expenses and Operating profit
SEK m
0
200
400
600
800
1,000
1,200
1,400
1,600
1,800
2,000
Q1
-14
Q2 Q3 Q4 Q1
-15
Q2 Q3 Q4 Q1
-16
Q2 Q3
Income Expenses
0
200
400
600
800
1,000
1,200
Q1
-14
Q2 Q3 Q4 Q1
-15
Q2 Q3 Q4 Q1
-16
Q2 Q3
Operating profit
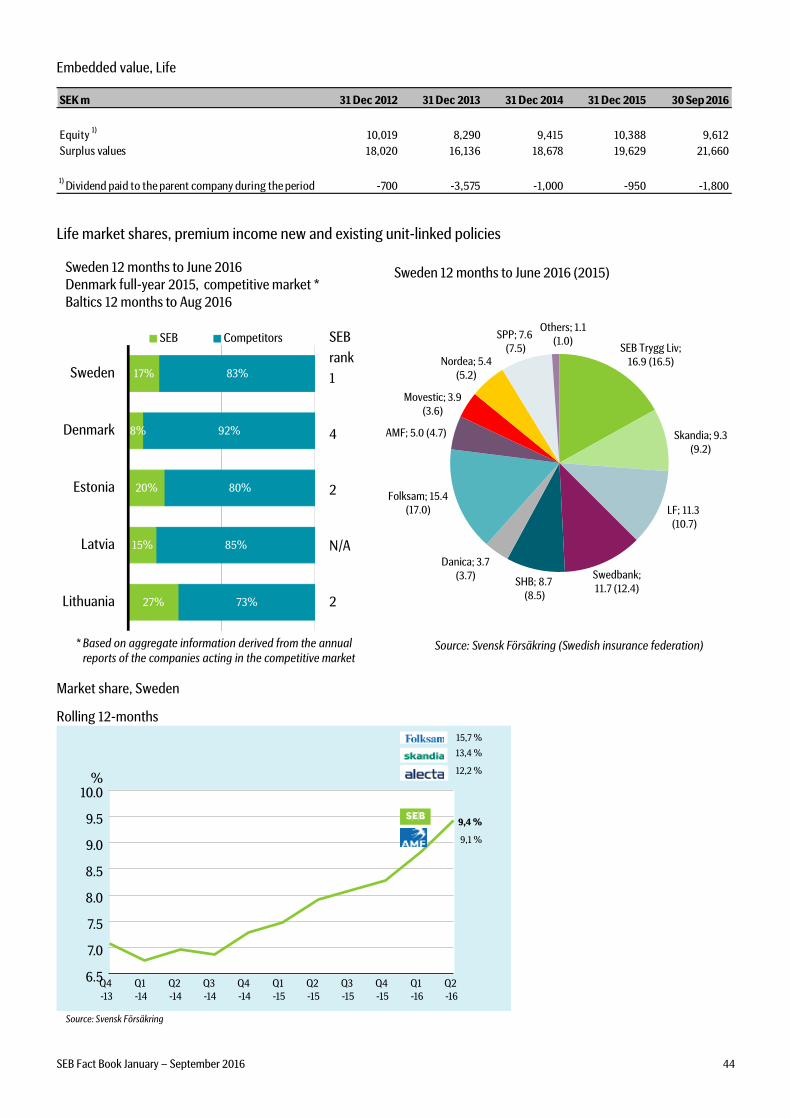
SEB Fact Book January – September 2016 44
Embedded value, Life
SEK m 31 Dec 2012 31 Dec 2013 31 Dec 2014 31 Dec 2015 30 Sep 2016
Equity 1)
10,019 8,290 9,415 10,388 9,612
Surplus values 18,020 16,136 18,678 19,629 21,660
1) Dividend paid to the parent company during the period -700 -3,575 -1,000 -950 -1,800
Life market shares, premium income new and existing unit-linked policies
Sweden 12 months to June 2016 (2015)
SEB
rank
1
4
2
N/A
227%
15%
20%
8%
17%
73%
85%
80%
92%
83%
Lithuania
Latvia
Estonia
Denmark
Sweden
SEB Competitors
Source: Svensk Försäkring (Swedish insurance federation)
Sweden 12 months to June 2016Denmark full-year 2015, competitive market *
Baltics 12 months to Aug 2016
SEB Trygg Liv;
16.9 (16.5)
Skandia; 9.3
(9.2)
LF; 11.3
(10.7)
Swedbank;
11.7 (12.4)SHB; 8.7
(8.5)
Danica; 3.7
(3.7)
Folksam; 15.4 (17.0)
AMF; 5.0 (4.7)
Movestic; 3.9
(3.6)
Nordea; 5.4
(5.2)
SPP; 7.6(7.5)
Others; 1.1 (1.0)
* Based on aggregate information derived from the annual
reports of the companies acting in the competitive market
Market share, Sweden
Rolling 12-months
10.0
6.5
7.0
7.5
8.0
8.5
9.0
9.5
%12,2 %
13,4 %
15,7 %
9,1 %
9,4 %
Q4
-13
Q1
-14
Q2
-14
Q3
-14
Q4
-14
Q1
-15
Q2
-15
Q3
-15
Q4
-15
Q1
-16
Q2
-16
Source: Svensk Försäkring
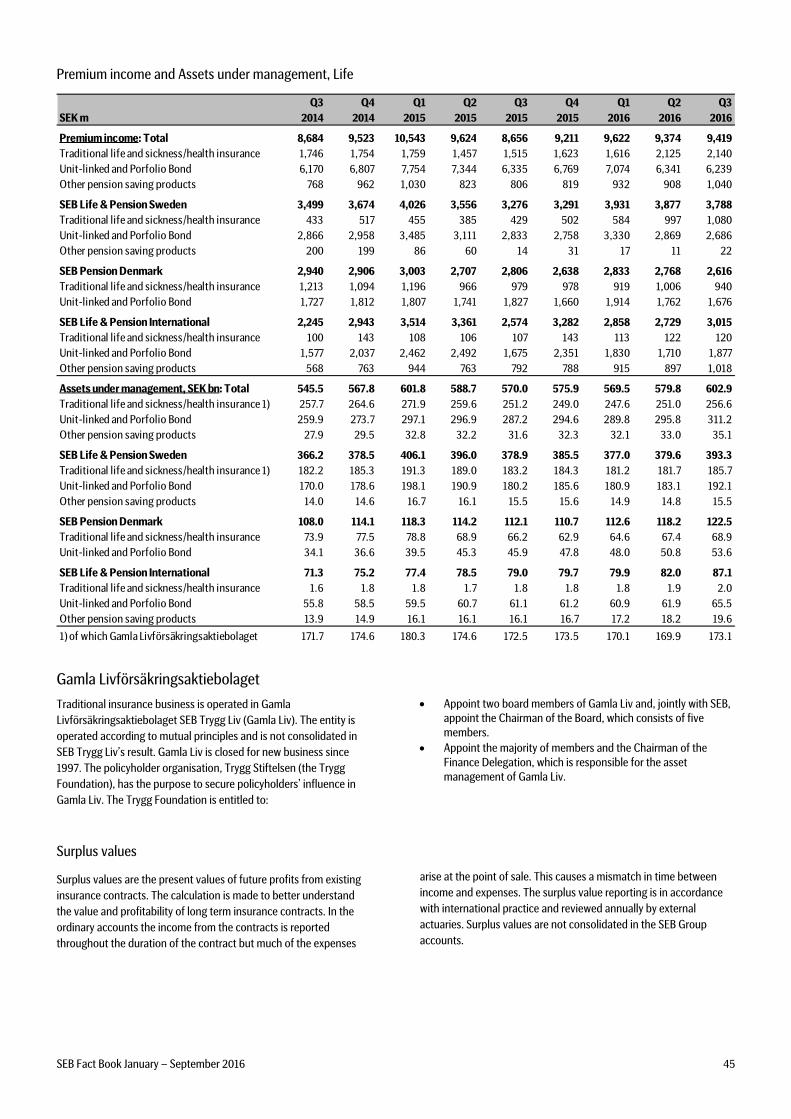
SEB Fact Book January – September 2016 45
Premium income and Assets under management, Life
Q3 Q4 Q1 Q2 Q3 Q4 Q1 Q2 Q3
SEK m 2014 2014 2015 2015 2015 2015 2016 2016 2016
Premium income: Total 8,684 9,523 10,543 9,624 8,656 9,211 9,622 9,374 9,419
Traditional life and sickness/health insurance 1,746 1,754 1,759 1,457 1,515 1,623 1,616 2,125 2,140
Unit-linked and Porfolio Bond 6,170 6,807 7,754 7,344 6,335 6,769 7,074 6,341 6,239
Other pension saving products 768 962 1,030 823 806 819 932 908 1,040
SEB Life & Pension Sweden 3,499 3,674 4,026 3,556 3,276 3,291 3,931 3,877 3,788
Traditional life and sickness/health insurance 433 517 455 385 429 502 584 997 1,080
Unit-linked and Porfolio Bond 2,866 2,958 3,485 3,111 2,833 2,758 3,330 2,869 2,686
Other pension saving products 200 199 86 60 14 31 17 11 22
SEB Pension Denmark 2,940 2,906 3,003 2,707 2,806 2,638 2,833 2,768 2,616
Traditional life and sickness/health insurance 1,213 1,094 1,196 966 979 978 919 1,006 940
Unit-linked and Porfolio Bond 1,727 1,812 1,807 1,741 1,827 1,660 1,914 1,762 1,676
SEB Life & Pension International 2,245 2,943 3,514 3,361 2,574 3,282 2,858 2,729 3,015
Traditional life and sickness/health insurance 100 143 108 106 107 143 113 122 120
Unit-linked and Porfolio Bond 1,577 2,037 2,462 2,492 1,675 2,351 1,830 1,710 1,877
Other pension saving products 568 763 944 763 792 788 915 897 1,018
Assets under management, SEK bn: Total 545.5 567.8 601.8 588.7 570.0 575.9 569.5 579.8 602.9
Traditional life and sickness/health insurance 1) 257.7 264.6 271.9 259.6 251.2 249.0 247.6 251.0 256.6
Unit-linked and Porfolio Bond 259.9 273.7 297.1 296.9 287.2 294.6 289.8 295.8 311.2
Other pension saving products 27.9 29.5 32.8 32.2 31.6 32.3 32.1 33.0 35.1
SEB Life & Pension Sweden 366.2 378.5 406.1 396.0 378.9 385.5 377.0 379.6 393.3
Traditional life and sickness/health insurance 1) 182.2 185.3 191.3 189.0 183.2 184.3 181.2 181.7 185.7
Unit-linked and Porfolio Bond 170.0 178.6 198.1 190.9 180.2 185.6 180.9 183.1 192.1
Other pension saving products 14.0 14.6 16.7 16.1 15.5 15.6 14.9 14.8 15.5
SEB Pension Denmark 108.0 114.1 118.3 114.2 112.1 110.7 112.6 118.2 122.5
Traditional life and sickness/health insurance 73.9 77.5 78.8 68.9 66.2 62.9 64.6 67.4 68.9
Unit-linked and Porfolio Bond 34.1 36.6 39.5 45.3 45.9 47.8 48.0 50.8 53.6
SEB Life & Pension International 71.3 75.2 77.4 78.5 79.0 79.7 79.9 82.0 87.1
Traditional life and sickness/health insurance 1.6 1.8 1.8 1.7 1.8 1.8 1.8 1.9 2.0
Unit-linked and Porfolio Bond 55.8 58.5 59.5 60.7 61.1 61.2 60.9 61.9 65.5
Other pension saving products 13.9 14.9 16.1 16.1 16.1 16.7 17.2 18.2 19.6
1) of which Gamla Livförsäkringsaktiebolaget 171.7 174.6 180.3 174.6 172.5 173.5 170.1 169.9 173.1
Gamla Livförsäkringsaktiebolaget
Traditional insurance business is operated in Gamla
Livförsäkringsaktiebolaget SEB Trygg Liv (Gamla Liv). The entity is
operated according to mutual principles and is not consolidated in
SEB Trygg Liv’s result. Gamla Liv is closed for new business since
1997. The policyholder organisation, Trygg Stiftelsen (the Trygg
Foundation), has the purpose to secure policyholders’ influence in
Gamla Liv. The Trygg Foundation is entitled to:
Appoint two board members of Gamla Liv and, jointly with SEB,
appoint the Chairman of the Board, which consists of five
members.
Appoint the majority of members and the Chairman of the
Finance Delegation, which is responsible for the asset
management of Gamla Liv.
Surplus values
Surplus values are the present values of future profits from existing
insurance contracts. The calculation is made to better understand
the value and profitability of long term insurance contracts. In the
ordinary accounts the income from the contracts is reported
throughout the duration of the contract but much of the expenses
arise at the point of sale. This causes a mismatch in time between
income and expenses. The surplus value reporting is in accordance
with international practice and reviewed annually by external
actuaries. Surplus values are not consolidated in the SEB Group
accounts.
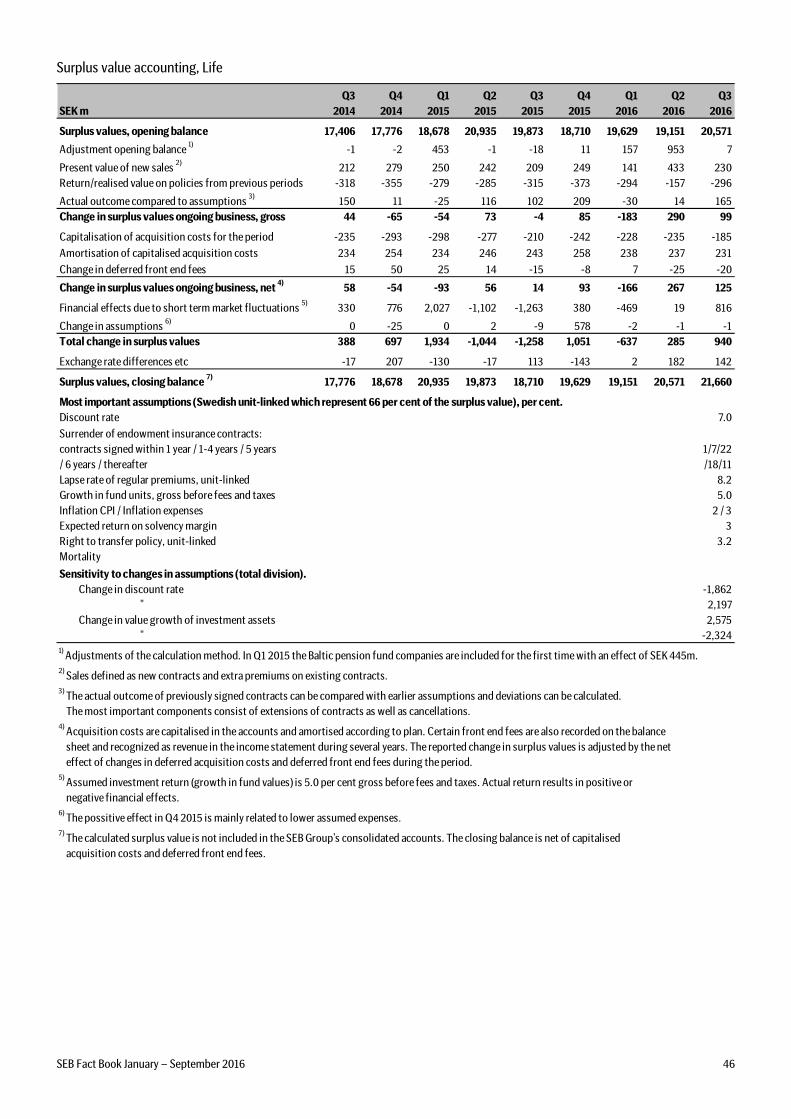
SEB Fact Book January – September 2016 46
Surplus value accounting, Life
Q3 Q4 Q1 Q2 Q3 Q4 Q1 Q2 Q3
SEK m 2014 2014 2015 2015 2015 2015 2016 2016 2016
Surplus values, opening balance 17,406 17,776 18,678 20,935 19,873 18,710 19,629 19,151 20,571
Adjustment opening balance 1)
-1 -2 453 -1 -18 11 157 953 7
Present value of new sales 2)
212 279 250 242 209 249 141 433 230
Return/realised value on policies from previous periods -318 -355 -279 -285 -315 -373 -294 -157 -296
Actual outcome compared to assumptions 3)
150 11 -25 116 102 209 -30 14 165
Change in surplus values ongoing business, gross 44 -65 -54 73 -4 85 -183 290 99
Capitalisation of acquisition costs for the period -235 -293 -298 -277 -210 -242 -228 -235 -185
Amortisation of capitalised acquisition costs 234 254 234 246 243 258 238 237 231
Change in deferred front end fees 15 50 25 14 -15 -8 7 -25 -20
Change in surplus values ongoing business, net 4)
58 -54 -93 56 14 93 -166 267 125
Financial effects due to short term market fluctuations 5)
330 776 2,027 -1,102 -1,263 380 -469 19 816
Change in assumptions 6)
0 -25 0 2 -9 578 -2 -1 -1
Total change in surplus values 388 697 1,934 -1,044 -1,258 1,051 -637 285 940
Exchange rate differences etc -17 207 -130 -17 113 -143 2 182 142
Surplus values, closing balance 7)
17,776 18,678 20,935 19,873 18,710 19,629 19,151 20,571 21,660
Most important assumptions (Swedish unit-linked which represent 66 per cent of the surplus value), per cent.
Discount rate 7.0
Surrender of endowment insurance contracts:
contracts signed within 1 year / 1-4 years / 5 years
/ 6 years / thereafter
1/7/22
/18/11
Lapse rate of regular premiums, unit-linked 8.2
Growth in fund units, gross before fees and taxes 5.0
Inflation CPI / Inflation expenses 2 / 3
Expected return on solvency margin 3
Right to transfer policy, unit-linked 3.2
Mortality
Sensitivity to changes in assumptions (total division).
Change in discount rate -1,862
" 2,197
Change in value growth of investment assets 2,575
" -2,324
5) Assumed investment return (growth in fund values) is 5.0 per cent gross before fees and taxes. Actual return results in positive or
negative financial effects.
6) The possitive effect in Q4 2015 is mainly related to lower assumed expenses.
7) The calculated surplus value is not included in the SEB Group's consolidated accounts. The closing balance is net of capitalised
acquisition costs and deferred front end fees.
1) Adjustments of the calculation method. In Q1 2015 the Baltic pension fund companies are included for the first time with an effect of SEK 445m.
2) Sales defined as new contracts and extra premiums on existing contracts.
3) The actual outcome of previously signed contracts can be compared with earlier assumptions and deviations can be calculated.
The most important components consist of extensions of contracts as well as cancellations.
4) Acquisition costs are capitalised in the accounts and amortised according to plan. Certain front end fees are also recorded on the balance
sheet and recognized as revenue in the income statement during several years. The reported change in surplus values is adjusted by the net
effect of changes in deferred acquisition costs and deferred front end fees during the period.
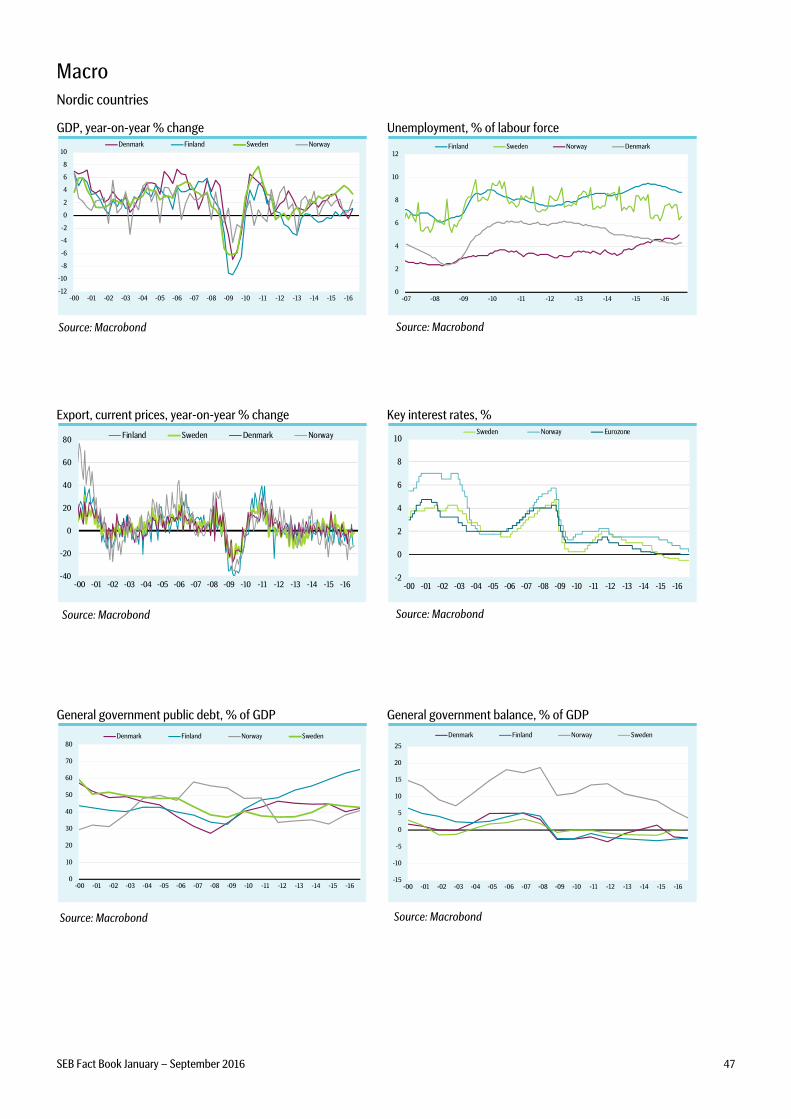
SEB Fact Book January – September 2016 47
Macro
Nordic countries
GDP, year-on-year % change
Unemployment, % of labour force
Export, current prices, year-on-year % change
Key interest rates, %
General government public debt, % of GDP General government balance, % of GDP
Source: Macrobond Source: Macrobond
Source: Macrobond Source: Macrobond
Source: Macrobond Source: Macrobond
-12
-10
-8
-6
-4
-2
0
2
4
6
8
10
-00 -01 -02 -03 -04 -05 -06 -07 -08 -09 -10 -11 -12 -13 -14 -15 -16
Denmark Finland Sweden Norway
0
2
4
6
8
10
12
-07 -08 -09 -10 -11 -12 -13 -14 -15 -16
Finland Sweden Norway Denmark
-40
-20
0
20
40
60
80
-00 -01 -02 -03 -04 -05 -06 -07 -08 -09 -10 -11 -12 -13 -14 -15 -16
Finland Sweden Denmark Norway
-2
0
2
4
6
8
10
-00 -01 -02 -03 -04 -05 -06 -07 -08 -09 -10 -11 -12 -13 -14 -15 -16
Sweden Norway Eurozone
0
10
20
30
40
50
60
70
80
-00 -01 -02 -03 -04 -05 -06 -07 -08 -09 -10 -11 -12 -13 -14 -15 -16
Denmark Finland Norway Sweden
-15
-10
-5
0
5
10
15
20
25
-00 -01 -02 -03 -04 -05 -06 -07 -08 -09 -10 -11 -12 -13 -14 -15 -16
Denmark Finland Norway Sweden
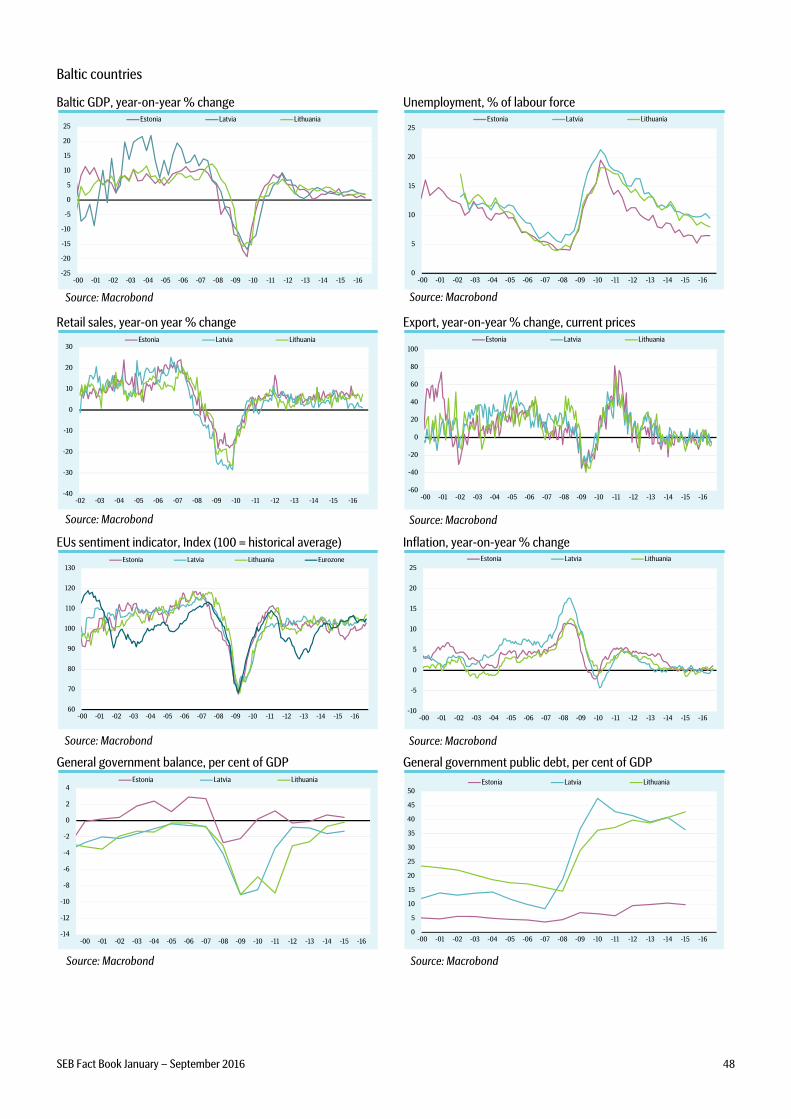
SEB Fact Book January – September 2016 48
Baltic countries
Baltic GDP, year-on-year % change
Unemployment, % of labour force
Retail sales, year-on year % change
Export, year-on-year % change, current prices
EUs sentiment indicator, Index (100 = historical average)
Inflation, year-on-year % change
General government balance, per cent of GDP
General government public debt, per cent of GDP
Source: Macrobond Source: Macrobond
Source: Macrobond Source: Macrobond
Source: Macrobond Source: Macrobond
Source: Macrobond Source: Macrobond
-25
-20
-15
-10
-5
0
5
10
15
20
25
-00 -01 -02 -03 -04 -05 -06 -07 -08 -09 -10 -11 -12 -13 -14 -15 -16
Estonia Latvia Lithuania
0
5
10
15
20
25
-00 -01 -02 -03 -04 -05 -06 -07 -08 -09 -10 -11 -12 -13 -14 -15 -16
Estonia Latvia Lithuania
-40
-30
-20
-10
0
10
20
30
-02 -03 -04 -05 -06 -07 -08 -09 -10 -11 -12 -13 -14 -15 -16
Estonia Latvia Lithuania
-60
-40
-20
0
20
40
60
80
100
-00 -01 -02 -03 -04 -05 -06 -07 -08 -09 -10 -11 -12 -13 -14 -15 -16
Estonia Latvia Lithuania
60
70
80
90
100
110
120
130
-00 -01 -02 -03 -04 -05 -06 -07 -08 -09 -10 -11 -12 -13 -14 -15 -16
Estonia Latvia Lithuania Eurozone
-10
-5
0
5
10
15
20
25
-00 -01 -02 -03 -04 -05 -06 -07 -08 -09 -10 -11 -12 -13 -14 -15 -16
Estonia Latvia Lithuania
-14
-12
-10
-8
-6
-4
-2
0
2
4
-00 -01 -02 -03 -04 -05 -06 -07 -08 -09 -10 -11 -12 -13 -14 -15 -16
Estonia Latvia Lithuania
0
5
10
15
20
25
30
35
40
45
50
-00 -01 -02 -03 -04 -05 -06 -07 -08 -09 -10 -11 -12 -13 -14 -15 -16
Estonia Latvia Lithuania
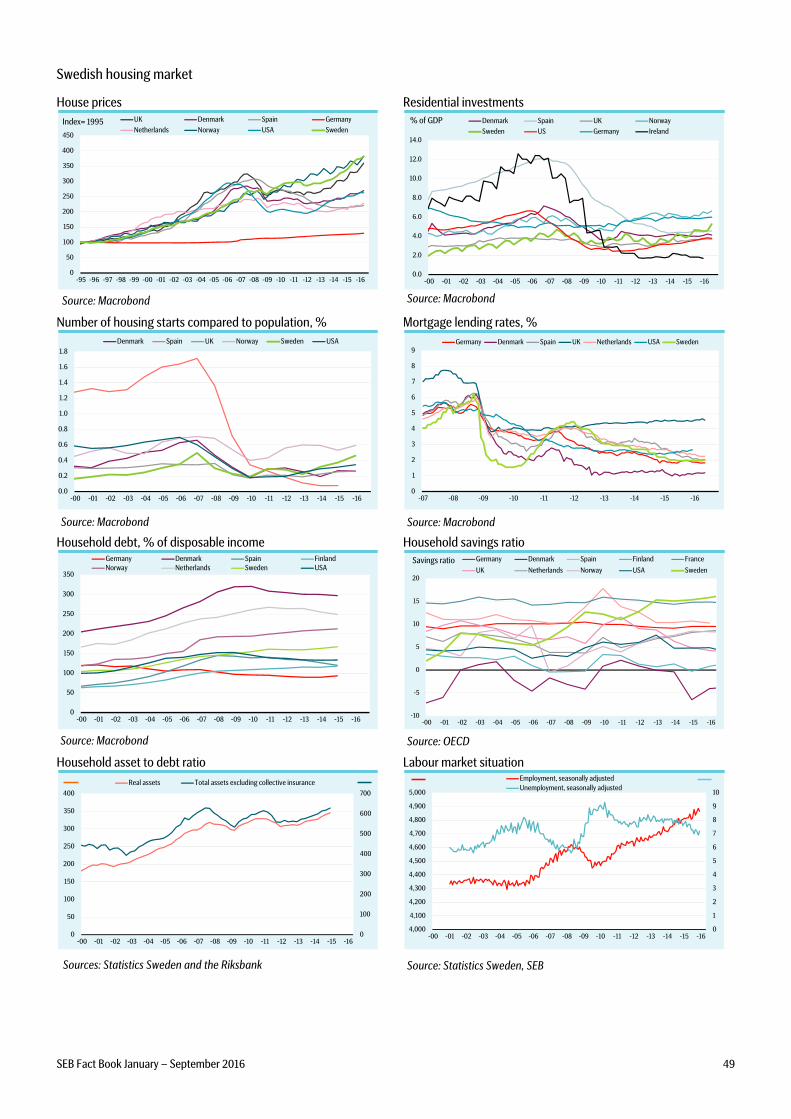
SEB Fact Book January – September 2016 49
Swedish housing market
House prices
Residential investments
Number of housing starts compared to population, %
Mortgage lending rates, %
Household debt, % of disposable income
Household savings ratio
Household asset to debt ratio
Labour market situation
Source: OECD
Sources: Statistics Sweden and the Riksbank Source: Statistics Sweden, SEB
Source: Macrobond Source: Macrobond
Source: Macrobond Source: Macrobond
Source: Macrobond
-10
-5
0
5
10
15
20
-00 -01 -02 -03 -04 -05 -06 -07 -08 -09 -10 -11 -12 -13 -14 -15 -16
Germany Denmark Spain Finland France
UK Netherlands Norway USA Sweden
Savings ratio
0
1
2
3
4
5
6
7
8
9
10
4,000
4,100
4,200
4,300
4,400
4,500
4,600
4,700
4,800
4,900
5,000
-00 -01 -02 -03 -04 -05 -06 -07 -08 -09 -10 -11 -12 -13 -14 -15 -16
Employment, seasonally adjusted
Unemployment, seasonally adjusted
0
100
200
300
400
500
600
700
0
50
100
150
200
250
300
350
400
-00 -01 -02 -03 -04 -05 -06 -07 -08 -09 -10 -11 -12 -13 -14 -15 -16
Real assets Total assets excluding collective insurance
0
50
100
150
200
250
300
350
400
450
-95 -96 -97 -98 -99 -00 -01 -02 -03 -04 -05 -06 -07 -08 -09 -10 -11 -12 -13 -14 -15 -16
UK Denmark Spain Germany
Netherlands Norway USA SwedenIndex= 1995
0.0
2.0
4.0
6.0
8.0
10.0
12.0
14.0
-00 -01 -02 -03 -04 -05 -06 -07 -08 -09 -10 -11 -12 -13 -14 -15 -16
Denmark Spain UK Norway
Sweden US Germany Ireland
% of GDP
0.0
0.2
0.4
0.6
0.8
1.0
1.2
1.4
1.6
1.8
-00 -01 -02 -03 -04 -05 -06 -07 -08 -09 -10 -11 -12 -13 -14 -15 -16
Denmark Spain UK Norway Sweden USA
0
1
2
3
4
5
6
7
8
9
-07 -08 -09 -10 -11 -12 -13 -14 -15 -16
Germany Denmark Spain UK Netherlands USA Sweden
0
50
100
150
200
250
300
350
-00 -01 -02 -03 -04 -05 -06 -07 -08 -09 -10 -11 -12 -13 -14 -15 -16
Germany Denmark Spain Finland
Norway Netherlands Sweden USA
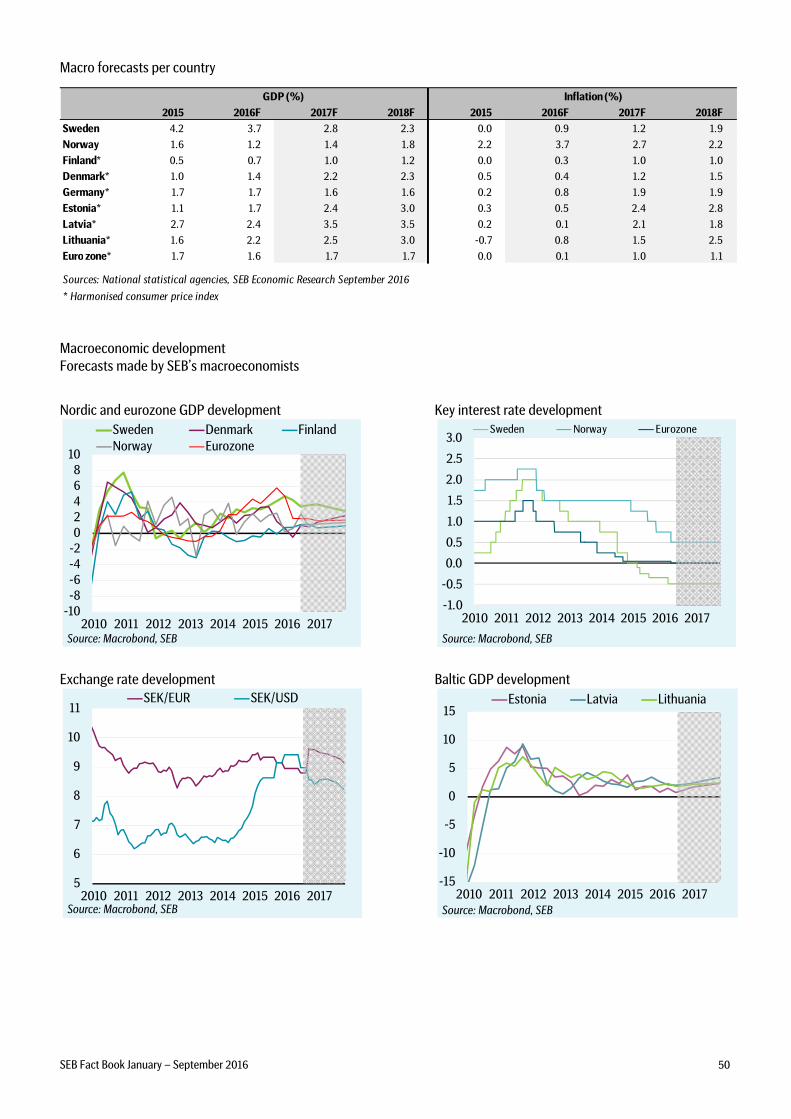
SEB Fact Book January – September 2016 50
Macro forecasts per country
2015 2016F 2017F 2018F 2015 2016F 2017F 2018F
Sweden 4.2 3.7 2.8 2.3 0.0 0.9 1.2 1.9
Norway 1.6 1.2 1.4 1.8 2.2 3.7 2.7 2.2
Finland* 0.5 0.7 1.0 1.2 0.0 0.3 1.0 1.0
Denmark* 1.0 1.4 2.2 2.3 0.5 0.4 1.2 1.5
Germany* 1.7 1.7 1.6 1.6 0.2 0.8 1.9 1.9
Estonia* 1.1 1.7 2.4 3.0 0.3 0.5 2.4 2.8
Latvia* 2.7 2.4 3.5 3.5 0.2 0.1 2.1 1.8
Lithuania* 1.6 2.2 2.5 3.0 -0.7 0.8 1.5 2.5
Euro zone* 1.7 1.6 1.7 1.7 0.0 0.1 1.0 1.1
Sources: National statistical agencies, SEB Economic Research September 2016
* Harmonised consumer price index
GDP (%) Inflation (%)
Macroeconomic development
Forecasts made by SEB’s macroeconomists
Nordic and eurozone GDP development
-10-8-6-4-202468
10
2010 2011 2012 2013 2014 2015 2016 2017
Sweden Denmark Finland
Norway Eurozone
Source: Macrobond, SEB
Key interest rate development
-1.0
-0.5
0.0
0.5
1.0
1.5
2.0
2.5
3.0
2010 2011 2012 2013 2014 2015 2016 2017
Sweden Norway Eurozone
Source: Macrobond, SEB
Exchange rate development
5
6
7
8
9
10
11
2010 2011 2012 2013 2014 2015 2016 2017
SEK/EUR SEK/USD
Source: Macrobond, SEB
Baltic GDP development
-15
-10
-5
0
5
10
15
2010 2011 2012 2013 2014 2015 2016 2017
Estonia Latvia Lithuania
Source: Macrobond, SEB
SEB Fact Book January – September 2016 51
Definitions
Return on equity Net profit attributable to shareholders in relation to average
1
shareholders’ equity.
Return on equity excluding one-off items Net profit excluding one-off items and their related tax effect in
relation to average1 shareholders’ equity.
Return on business equity Operating profit by division, reduced by a standard tax rate, in
relation to the divisions’ average1 business equity.
Return on total assets Net profit attributable to shareholders, in relation to average
1 total
assets.
Return on risk exposure amount Net profit attributable to shareholders in relation to average
1 risk
exposure amount.
Cost/income ratio Total operating expenses in relation to total operating income.
Cost/income ratio excluding one-off items Total operating expenses excluding one-off items in relation to total
operating income excluding one-off items.
Basic earnings per share Net profit attributable to shareholders in relation to the weighted
average2 number of shares outstanding.
Diluted earnings per share Net profit attributable to shareholders in relation to the weighted
average2
average diluted number of shares. The calculated dilution
is based on the estimated economic value of the long-term incentive
programmes.
Net worth per share Shareholders’ equity plus the equity portion of any surplus values in
the holdings of interest-bearing securities and surplus value in life
insurance operations in relation to the number of shares
outstanding.
Equity per share Shareholders’ equity in relation to the number of shares
outstanding.
Credit loss level Net credit losses as a percentage of the opening balance of loans to
the public, loans to credit institutions and loan guarantees less
specific, collective and off balance sheet reserves.
Gross level of impaired loans Individually assessed impaired loans, gross, as a percentage of loans
to the public and loans to credit institutions before reduction of
reserves.
Net level of impaired loans Individually assessed impaired loans, net (less specific reserves) as a
percentage of net loans to the public and loans to credit institutions
less specific reserves and collective reserves.
Specific reserve ratio for individually assessed impaired loans Specific reserves as a percentage of individually assessed impaired
loans.
Total reserve ratio for individually assessed impaired loans Total reserves (specific reserves and collective reserves for
individually assessed loans) as a percentage of individually assessed
impaired loans.
Reserve ratio for portfolio assessed loans Collective reserves for portfolio assessed loans as a percentage of
portfolio assessed loans past due more than 60 days or
restructured.
Non-performing loans SEB’s term for loans that are either impaired or not performing
according to the loan contract. Includes individually assessed
impaired loans, portfolio assessed loans, past due > 60 days and
restructured portfolio assessed loans (based on IFRS concessions).
NPL coverage ratio Total reserves (specific, collective and off balance sheet reserves) as
a percentage of non-performing loans.
NPL per cent of lending Non-performing loans as a percentage of loans to the public and
loans to credit institutions before reduction of reserves.
One-off items To facilitate the comparison of SEB’s underlying operating profit
between periods, items that management consider as one-offs are
identified and separately described. Affected key figures are
presented excluding one-off items.
These non-GAAP financial measures are used by SEB when relevant to assess
and describe the performance of SEB and to provide additionally useful
information to users’ of the financial reports. They are Alternative
Performance Measures, APMs, financial measures of historical or future
financial performance, financial position, or cash flows, other than those
defined in the applicable financial reporting framework (IFRS) or in the EU
Capital Requirements Regulation and Directive CRR/CRD IV. Measures with
the same or similar names used by other companies may not have the same
definition.
1 Average year-to-date, calculated on month-end figures.
2 Average, calculated on a daily basis.
SEB Fact Book January – September 2016 52
Definitions - continued
According to the EU Capital Requirements Regulation no 575/2013 (CRR)
Risk exposure amount Total assets and off balance sheet items, weighted in accordance
with capital adequacy regulation for credit risk and market risk. The
operational risks are measured and added as risk exposure amount.
Risk exposure amounts are only defined for the consolidated
situation, excluding insurance entities and items deducted from own
funds.
Common Equity Tier 1 capital Shareholders’ equity excluding proposed dividend, deferred tax
assets, intangible assets and certain other regulatory adjustments
defined in EU Regulation no 575/2013 (CRR).
Tier 1 capital Common Equity Tier 1 capital plus qualifying forms of subordinated
loans.
Tier 2 capital Mainly subordinated loans not qualifying as Tier 1 capital
contribution.
Own funds The sum of Tier 1 and Tier 2 capital.
Common Equity Tier 1 capital ratio Common Equity Tier 1 capital as a percentage of risk exposure
amount.
Tier 1 capital ratio Tier 1 capital as a percentage of risk exposure amount.
Total capital ratio Total own funds as a percentage of risk exposure amount.
Leverage ratio Tier 1 capital as a percentage of total assets including off balance
sheet items with conversion factors according to the standardized
approach.
Liquidity Coverage Ratio (LCR) High-quality liquid assets in relation to the estimated net cash
outflows over the next 30 calendar days
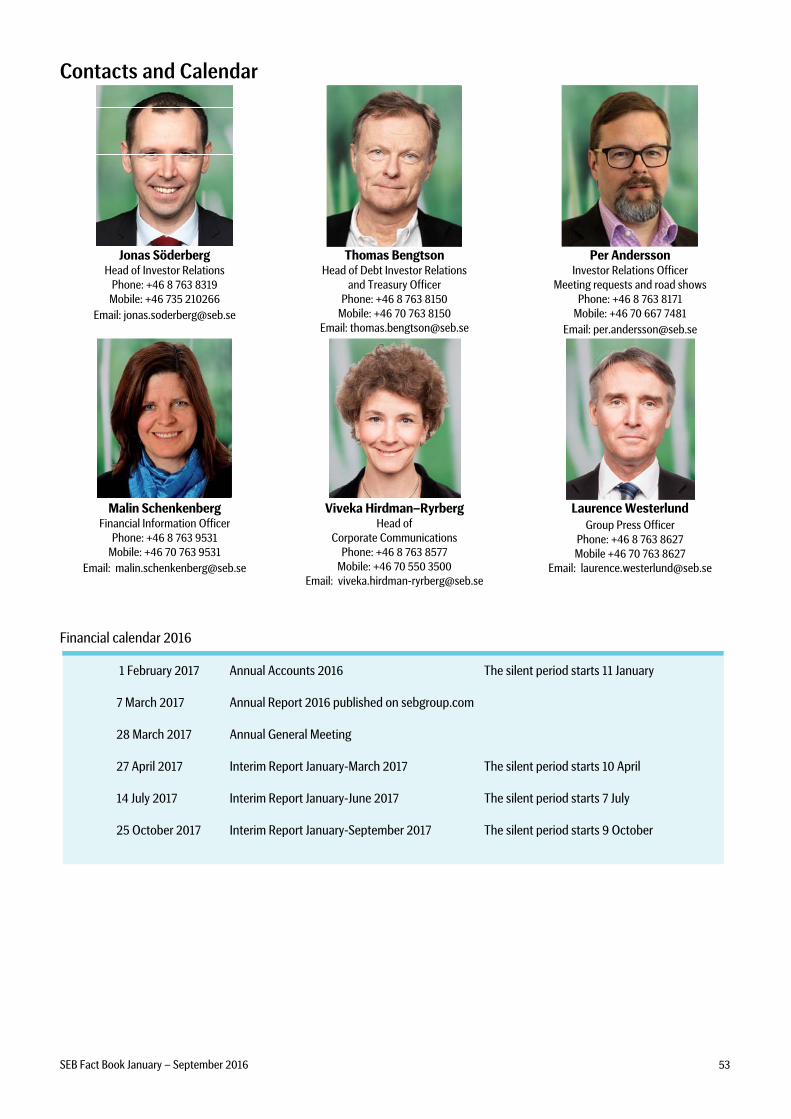
SEB Fact Book January – September 2016 53
Contacts and Calendar
Jonas Söderberg Head of Investor Relations
Phone: +46 8 763 8319
Mobile: +46 735 210266
Email: [email protected]
Thomas Bengtson Head of Debt Investor Relations
and Treasury Officer
Phone: +46 8 763 8150
Mobile: +46 70 763 8150
Email: [email protected]
Per Andersson Investor Relations Officer
Meeting requests and road shows Phone: +46 8 763 8171
Mobile: +46 70 667 7481
Email: [email protected]
Malin Schenkenberg
Financial Information Officer
Phone: +46 8 763 9531
Mobile: +46 70 763 9531
Email: [email protected]
Viveka Hirdman–Ryrberg Head of
Corporate Communications
Phone: +46 8 763 8577
Mobile: +46 70 550 3500
Email: [email protected]
Laurence Westerlund
Group Press Officer
Phone: +46 8 763 8627
Mobile +46 70 763 8627
Email: [email protected]
Financial calendar 2016
1 February 2017 Annual Accounts 2016 The silent period starts 11 January
7 March 2017 Annual Report 2016 published on sebgroup.com
28 March 2017 Annual General Meeting
27 April 2017 Interim Report January-March 2017 The silent period starts 10 April
14 July 2017 Interim Report January-June 2017 The silent period starts 7 July
25 October 2017 Interim Report January-September 2017 The silent period starts 9 October
Recommended