Life Sciences, Vol . 21, pp . 441-450, 1977Printed In The U.S .A .
A COMPARISON OF THE DISPOSITION OFlaC-A9-TETRAHYDROCANNABINOL AND 3H-~9 -TETRAHYDROCANNABINOL
Gordon T . Pryor*, Syed Husaint, and Albert J . Siemens**
* Stanford Research Instltute, Menlo Park, California 94025, and** Research Institute on Alcoholism, Buffalo, New York 14203
(Received in final form July 5, 1977)
Summary
t University of North Dakota, Grand Forks, North Dakota 58202
441
Pergamon Presa
Preliminary experiments suggested that total levels ofradioactivity disappeared from the blood of male, Fischer ratsmuch morn rapidly following intragastric administration of14C-09 -tetrahydrocannabinoi ( 14C-THC) than 3H-THC . Collaborativeexperiments at the Stanford Research Instltute (SRI) and theResearch Institute on Alcoholism (RIA) verified and characterizedthe Initial observations . In rats that had food availablethroughout the experiments, the concentrations of total 3 H and14C in fresh plasma reached a maximum at 2 - 4 hours after treatmentwith 3H-THC plus 1`'C-THC . Thereafter, 14 C levels fell while 3Hlevels decreased very slowly or not at all . In fasted rats, peakplasma concentrations of both isotopes were not attained untilabout 8 hours following drug administration . The concentrationsof 14C then decreased more rapidly than 3F1 . The differencesbetween the plasma disappearance curves for 14C and 3H were notdependent upon the method of blood collection or the techniquesof isotope counting . However, when plasma or whole blood sampleswere dried before radioisotope analysis, the difference between1 `'C and ~I concentrations was virtually abolished to fed and fastedrats . Experiments suggest that tritiated water, produced duringthe metabolism of 3H-THC, may be responsible for the prolongedmaintenance of high 3H levels to the blood .
Studies of the disposition of ~9 -tetrahydrocannabinoi (THC), the maJorpsychoactive component in cannabis, have been carried out to animals and manwith either 3H-THC or 14C-THC [see Bursteln (1) for review] . In many of theexperiments, body tissues and fluids were assayed for the unchanged drug aswell as for specific THC metabolites by various techniques of chromatography,mass spectrometry and liquid scintillation spectrometry . In addition, totallevels of 3F1 (2-8f or 1 `'C (9-15) were determined in numerous instances,providing Information on total drug equivalents . Evidently, these investiga-tors did not direct attention to the possibility that the two, differentlyradiolabelled THC molecules might not yield the same metabolic results .
During studies of metabolic Interactions between THC and other psycho-active drugs at the Stanford Research Institute (SRI), tt was noted that thetotal concentration of Eli in the plasma of rats following 3H-THC administrationwas apparently greater than that of 14C following an equivalent dose of
442
Diaposition of 14C-A9-THC and ~-e9-THC
vol . 21, No. 3, 1977
14C-11îC . A review of the results of experiments carried out with 3H-THC and1~C-THC at the Research Institute on Alcoholism (RIA) provided a similarobservation . It was considered important to investigate this observationmore fully because previously reported studies had apparently assumed that3F1- or 14C-THC would provide equivalent pharmacokinetic information . Further-more, other studies of THC/drug interactions at SRI and RIA required thisinformation to permit proper Interpretation of experimental results .
THC Purity
Unlabelled THC, 1`'C-THC* and 3H-THCt were provided by the NationalInstitute on Drug Abuse . Radiochemical purity of both labelled compounds wasgreater than 97$ as determined by thin-layer chromatography followed by radiochromatographlc scanning and liquid scintillation spectrometry (15) . Gaschromatography/mass spectrometry (Flnnigan, Model 1015D) using a 3$ OV17 Gas-Chrom Q 80/100 column demonstrated that the chemical purity of each compoundwas greater than 97$.
Animals and Drug Administration
Methods
Male Fischer rats (Simonsen Laboratories, Inc., G11roy, California),50 - 55 days of age at the time of the experiments and weighing 130-150 g,were used in all the experiments reported here. The animals were housedsingly in hanging stainless steal cages with food and tap water availablead libitum on a 12-12 hour light dark cycle for at least one week before eachexperiment . Food, but not water, was removed from half of the animals at1600 hours the night before the drug admlnistratlon and was withheld through-out the remainder of the experiment . The rest of the animals had free accessto food and water throughout the experimental period .
The two radiolabelled compounds, 14C-THC and 3F1-THC, ware dissolved insesame oil together with unlabelled THC, resulting in a final total THCconcentration of 5 mg/ml with 20 uCi of 14C-THC/ml and 60 uCi of Eli-THC/ml .The drug solution was administered orally by gavage between 0800 and 0900hours to provide a total THC dose of 10 mg/kg . In some experiments, the ratswere irtmedlately placed into stainless steel metabolism cages to permitsequential urine collection .
Assay of Radlolabelled THÇ Equivalents
Blood samples (70 ul) were taken with heparlniznd micropipettes from theorbital sinus at both SRI and RIA at 1, 2, 4, 8, 12 and 24 hours after drugtreatment . In addition, blood was collected from the tall tip In another twogroups of fed and fasted rats at RIA at the same time points. Plasma (30 ul)from one sample was assayed directly in Oxifluor, New England Nuclear (SRI) orScintiverse, Fisher (RIA) by dual label counting (Beckman L5250 at SRI ;Packard 3385 at RIA) . Plasma from the other sample was combusted in aPackard 305 (SRI) or Packard 306 (RIA) Trlcarb Sample Oxidizer followed byliquid scintillation counting . Aliquots of urine samples ware also analyzedby combustion and liquid scintillation counting .
* 14C was located at the 11-methyl position of the THC molecule .
t 3H was located at the a and ß carbons of the pentyl side chain.

yol, 21, No . 3, 1977
Diaposition of 14C-d9-THC and 3H-A9-THC
443
All count data were corrected for quench and the concentrations of 3 F1-and 14C-THC equivalents were calculated based on the specific activities ofthe doses administered .
Data obtained at RIA were computed and analyzed onthe PROPHET System, a unique computer resource of the National Institute ofHealth .
Results
In a series of preliminary experiments conducted at SRI, the oraladministration of either 1`'C-THC or 3H-THC resulted in maximum blood levelsof both isotopes at about 2 - 4 hours after treatment . Although 14 Cconcentrations declined thereafter, 3H levels continued to rise slightly upto 24 hours .
Unlike the results obtained at SRI, two experiments at RIA felled to showany marked differences In the concentrations of 3H and 1 `'C in the blood ofrats over a 24-hr period following oral administration of 3H-THC or 1`'C-THC .Also, maximum levels of both Eli and 14C did not occur until about 8 to 12 hrafter drug treatment in the experiments at RIA, in contrast to the 2 - 4 hourpeak found at SRI .
Discussion revealed that several differences existed In the protocolsused at SRI and RIA . At SRI the animals were allowed free access to foodthroughout the experiment and radioactivity was determined in whole blood orplasma samples suspended to liquid scintlllatton counting solution . At RIAthe animals were fasted overnight before the experiment and throughout thenext 24 hr and radioactivity was assayed after combustion of the bloodsamples (see "Methods" section) . In addition, blood had been collected fromthe orbital sinus at SRI and from the tall vein at RIA. In order to resolvethe discrepancies in the results and to sort out the relevant parameters,Independent experiments at SRI and RIA ware conducted using the same protocolsas described in the "Methods" section .
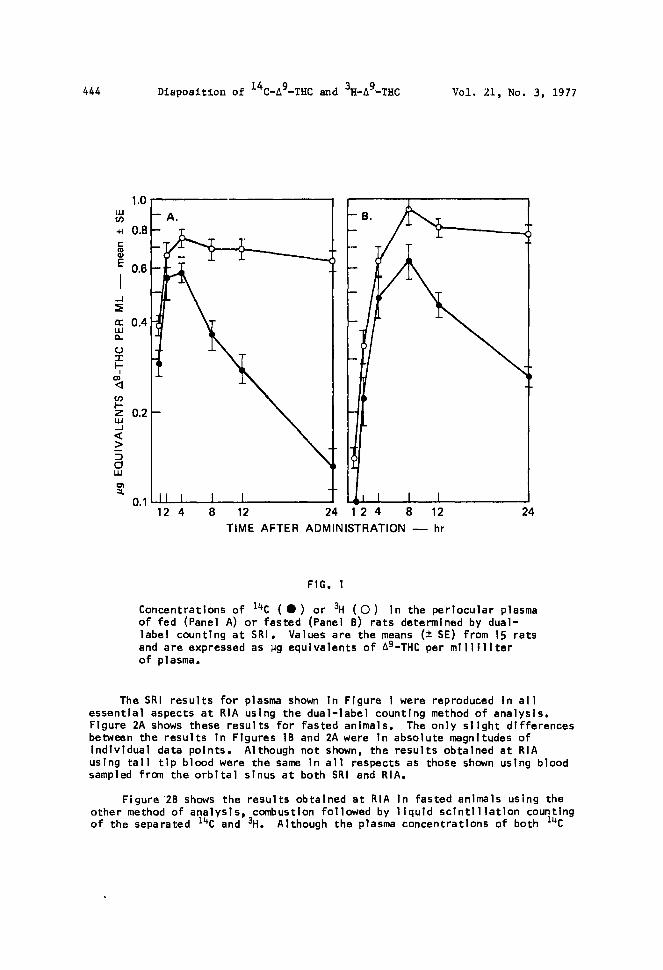
Figure lA shows the results obtained at SRI by dual-label countingprocedures to nondeprived animals and demonstrates the basic differences inlaC and 3H concentrations over time that were observed initially in thepreliminary experiments . Concentrations of 14C rose rapidly to reach a clearmaximum after 2 - 4 hr and declined thereafter . Concentrations of 3H rose toa maximum after about the same time but fatted to decline significantlyup to 24 hr,
Figure 18 shows the corresponding results in fasted animals and revealsone source of the difference between the results obtained at SRI and RIA notedabove. Instead of reaching maximum concentrations 2 - 4 hr after administration as in nondeprived animals, these maxima were not attained until about8 hr for both isotopes in the fasted animals . However, even though the maximawere delayed by 4 - 6 hr In the fasted animals the concentrations of 14Cdeclined thereafter, whereas the concentrations of 3H remained elevated overthe remainder of the 24-hr interval .
444
Diaposition of 14C-d9-THC and 3H-A9'-THC
Vol. 21, No . 3, 1977
IL
+~cdE
wo_USF-rn4
HzwQ_i
aw
1.0
0.8
0 .
0 .4
0.2
FIG . 1
> I
I
I
t12 4
8
12
24 1 2 4
8
12
24TIME AFTER ADMINISTRATION - hr
Concentrations of 1 `'C ( " ) or 3 H (O) in the pertocular plasmaof fed (Panel A) or fasted (Panel B) rats determined by dual-label counting at SRI, Values are the means (t SE) from 15 ratsand are expressed as ug equivalents of D9-THC per milliliterof plasma.
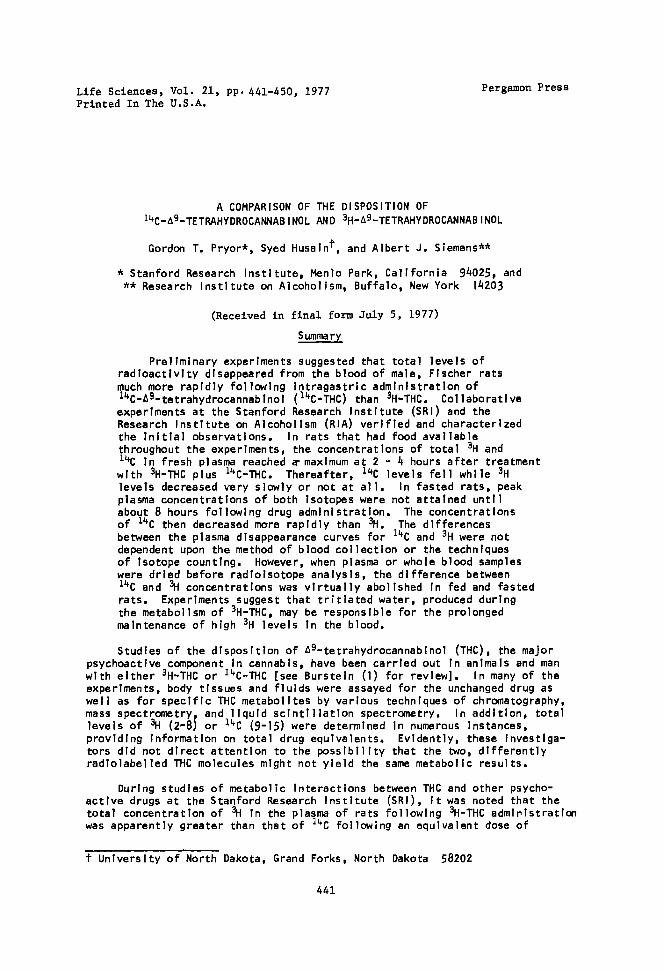
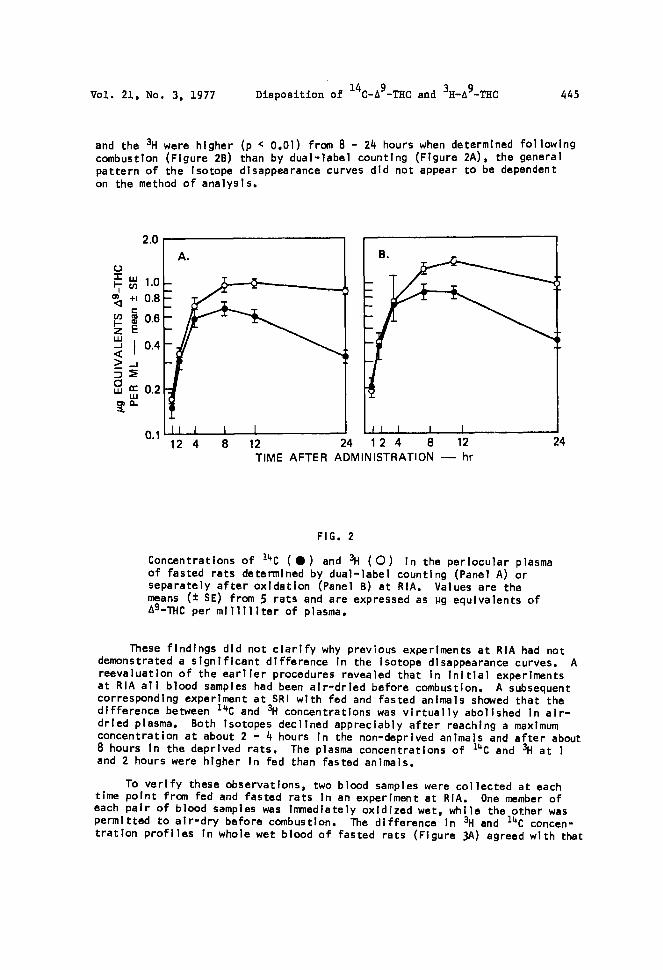
The SRI results for plasma shown to Figure 1 were reproduced in allessential aspects at RIA using the dual-label counting method of analysis,Figure 2A shows these results for fasted animals . The only slight differencesbetween the results in Figures 1B and 2A were in absolute magnitudes ofindividual data points . Although not shown, the results obtained at RIAusing tall tip blood were the same in all respects as those shown using bloodsampled from the orbital sinus at both SRI and RIA.
Figure 2B shows the results obtained at RIA in fasted animals using theother method of analysis, combustion followed by liquid scintillation countingof the separated 1 `'C and 3H . Although the plasma concentrations of both 14C
Vol . 21, No . 3, 1977
and the 3H were higher (p < 0.01) from 8 - 24 hours when determined followingcombustion (Figure 28) than by dual-label counting (Figure 2A), the generalpattern of the Isotope disappearance curves did not appear to be dependenton the method of analysis .
U
H4h
zwQ
dW
1 .0+~ 0 .8c
0.6E
0:Wa
2.0
0.4
0 .2
Diaposition of 14C-D9-THC and 3H-A9-THC
4k5
FIG . 2
12 4
8
12
24
1 2 4
8
12
24TIME AFTER ADMINISTRATIQN - hr
Concentrations of 1 `'C ( " ) and 3H (O) in the periocular plasmaof fasted rats determined by dual-label counting (Panel A) orseparately after oxidation (Panel B) at RIA . Values are themeans (t SE) from 5 rats and are expressed as ug equivalents ofA9 -THC per milliliter of plasma .
These findings did not clar(fy why previous experiments at RIA had notdemonstrated a significant difference in the isotope disappearance curves . Areevaluation of the earlier procedures revealed that In initial experimentsat RIA all blood samples had been air-dried before combustion. A subsequentcorresponding experiment at SRI with fed and fasted animals showed that thedifference between 1 `'C and 3H concentrations was virtually abolished in air-drled plasma. Both isotopes declined appreciably after reaching a maximumconcentration at about 2 - 4 hours In the non-deprived animals and after about8 hours in the deprived rats . The plasma concentrations of 1°C and 3H at 1and 2 hours were higher In fed than fasted animals .
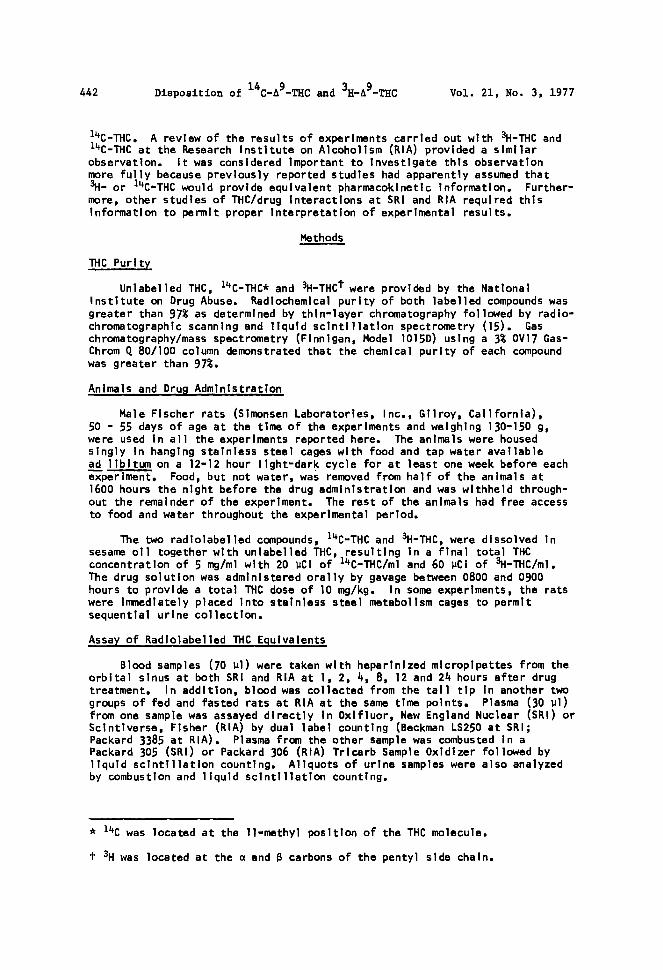
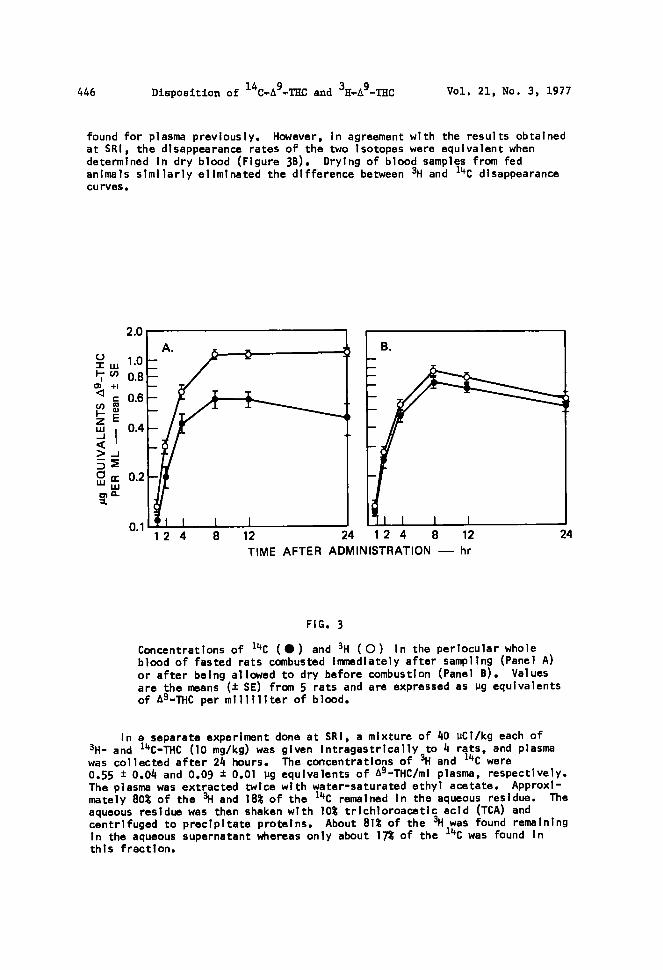
To verify these observations, two blood samples were collected at eachtime point fran fed and fasted rats in an experiment at RIA . One member ofeach pair of blood samples was immediately oxidized wet, while the other waspermitted to air-dry before combustion . The difference In 3 H end 14C concen-tration profiles in whole wet blood of fasted rats (Figure 3A) agreed with that
446
Diaposition of 14C~A9~THC and 3HQ9-THC
Vol, 21, No . 3, 1977
found for plasma previously. However, in agreement with the results obtainedat SRI, the disappearance rates of the two Isotopes were equivalent whendetermined in dry blood (Figure 3B) . Drying of blood samples from fedanimals similarly eliminated the difference between 3H and 14C disappearancecurves .
2 .0
=w 1 .0I~ cn 0.8W +vd c 0.6
~ EzwQi J
0.4
B .
I
I
I
I1 2 4
8
12
24
1 2 4
8
12TIME AFTER ADMINISTRATION - hr
FIG . 3
Concentrations of 1 `'C ( " ) and 3H (O) in the perlocular wholeblood of fasted rats combusted Immediately after sampling (Panel A)or after being allowed to dry before combustion (Panel B) . Valuesare the means (t SE) from 5 rats and aro expressed as ug equivalentsof A9-THC per milliliter of blood .
24
In a separate experiment done at SRI, a mixture of 40 uCl/kg each of3H- and 14C-THC (10 mg/kg) was given Intragastrically to 4 rats, and plasmawas collected after 24 hours . The corscentratlons of 3H and 14C were0.55 t 0 .04 and 0.09 t 0.01 Ug equivalents of 09 -THC/ml plasma, respectively .The plasma was extracted twice with water-saturated ethyl acetate. Approxi-mately 80$ of the Eli and 18$ of the 14C remained in the aqueous residue . Theaqueous residue was then shaken with 10$ trichloroacetic acid (TCA) andcentrifuged to precipitate proteins . About 81$ of the 3 F1 was found remainingIn the aqueous supernatant whereas only about 17$ of the 14 C was found Inthis fraction .
Vol . 21, No . 3, 1977
Diaposition of 14C-D9-THC and 3H-A9-THC
447
Experiments at RIA also determined the concentrations of 3 H and 1`'C intwo consecutive twelve-hour urine samples . The concentrations of 14C and 3t1
in the first twelve-hour urine from fed rats ware 7.98 t 1 .78 (S .E.) and7.74 t 1 .71 ug of THC equivalents/ml, respectively . The 0-12-hour urine offasted animals contained 5 .81 t 0 .79 or 5.88 f 0.76 ug of THC equivalents/mlbased on 14 C and 3 F1, respectively . Furthermore, the isotope concentrations tothe 0-12 and 12-24-hour urine samples did not differ in fed or fasted rats .Drying of urine before analysis did not significantly change the Isotopeconcentrations .
Discussion
Two laboratories have confirmed that the characteristics of thedisappearance of 14C and 3H from the blood of male, Fischer rats are not thesame following equivalent intragastric doses of 14C-THC and 3H-THC . Theconcentrations of s li in fresh plasma or whole blood decreased much more slowlythan 14C levels .
The observations that the plasma concentrations of both Isotopes at 1 and2 hours following drug administration were lower In fasted than fed rats, andthat peak concentrations were reached 4 - 6 hours later in fasted than fedanimals suggest that the THC absorption rate was slower in fasted rats . Thisobservation has been confirmed and Investigated more thoroughly at SRI (16) .However, the dietary state of the animals clearly was not the primary factorgoverning the difference In rates of isotope disappearance since the pheno-menon occurred in both fed and fasted animals . Furthermore, neither themethod of blood collection nor the technique of isotope counting was respon-sible . Possibly the plasma concentrations of 14C and 3H were slightly lowerwhen determined by direct dual^label counting as opposed to oxidation followedby single isotope analysts because of relatively poor homogeneity of plasma inthe scintillation fluid .
Drying of plasma or whole blood samples resulted in highly similardisappearance curves for 14C and s li . Accordingly, the component contributingto the high Eli concentrations in the blood up to 24 hours was volatile . Thelarge portion of 3H relative to 14C in aqueous plasma which could neither beextracted with ethylacetate nor precipitated with TCA was obviously polar incha rac to r .
It is possible that tritlated water was the maJor contributing componentto the high 3H concentrations In blood. Other investigators (17-19) havereported that some THC metabolites are hydroxylated on the pentyl side chain.Since the 3F1-THC used in these studies was specifically labelled at the a andß positions on the side chain, the possibility exists that some 3H atomsbecame incorporated into water during oxidation reactions catalyzed by thehepatic mixed function oxidase system (15, 20) . The explanation of 3Hexchange, whereby the Eli on the THC side chain would simply exchange to theabsence of a catalyst with hydrogen In aqueous media,ts not tenable . Atmost 3 - 4$ of this type of exchange was found in an experiment designed totest this hypothesis at SRI (C. Mitoma, unpublished observation) .
Moreover, Eli exchange did not occur In excreted urine since drying ofurine samples before analysis did not result In the loss of sli . If trtttatedwater was being produced during THC metabolism this labelled water shouldeventually be excreted in part via the urine . However, body water turnover inthe rat is approximately 116 - 160 ml/kg/day (21) or 7 - 10 ml/125 g/12 hours .This represents only 7 - 10$ of the total body water . Therefore, It Is notsurprising that radioactive water could not be detected in the two 12-hour
448
Disposition of 14C-A9-THC and 3H-G9-THC
Vol . 21, No . 3, 1977
urine samples . The appearance of tritiated water to urine during the first12 hours also could have been limited because of slow drug absorption,particularly in fasted rats . Furthermore, the urine samples were cumulativeover 12-hour periods, and, therefore, an increase in the amount of tritiatedwater being excreted in the later part of a collection interval, particularlyin the 12 - 24-hour samples, could have been masked by dilution with urinecollected earlier .
The results of these experiments suggest that caution should be exercisedin the interpretation of drug concentrations in the rat based on total levelsof 3H following administration of THC labelled with Eli on the pentyl sidechain . It is possible that tritiated water may have contributed to the totalradioactivity in blood or tissues of mice in studies by Ryrfeldt et al . (6)and Gill and Jones (3) .
Similarly, depending upon the position ofthe 3Hatoms on the THC molecule, the apparent relative increase in the amount ofnonextractable, polar radioactivity observed by Magour et al . (7) in ratbrains up to 12 hours following Eli-THC treatment, may havebeen due to 3H-labelled water . McMillan et al . (5) also found that 3H levels in the freshplasma of pigeons decreasedslowly over two weeks following tntramuscularinjection of 3H-THC. Tritlated water may also have contributed to concen-trations of total radioactivity in the blood of human (22), dog (8), andmonkey (4) after 3H-THC administration .
The present experiment did not eliminate the possibilities that thedifferences observed between 14 C and 3 H disappearance were peculiar to theFischer strain of rats, and that they were simply a function of the route ofTHC administration. These and related questions became the subject of otherstudies to be published elsewhere .
Acknowledgements
The authors gratefully acknowledge the excellent technical assistance ofOlivia Doyle and Judith E . McConnell of RIA and Barbara Lewin, Janet Frazier,and Tom Steeger of SRI .
Gas chromatography/mass spectrometry was kindly carried out at RIA byDr . Hebe B . Greizerstein .
These studies were supported in part by the NIDA contract HSM-42-72-182and Grant RO1-DA-01136 .
References
1 . S .H . BURSTEIN, Marihuana : Chemistry , Pharmacolo , Metabolism andClinical Effects , R . Mechoulam, Ed . (pp . 1 7-190 Academic Press, N .Y .1973 .
2 . S . AGURELL, I .M . NILSSON, A. OHLSSON, and F. SANDBERG, Biochem . Pharmacol .18, 1195-1201 (1969) .
3 . É.W. GILL and G. JONES, Biochem . Pharmacol . 21, 2237-2248 (1972) .4 . B .T . H0, V. ESTEVEZ, L .F. ENGLERT, and W.M . McISAAC, _J . Pharm . Pharmac .
24, 414-416 (1972) .5 . D.E . McMILLAN, W.L . DEWEY, R .F . TURK, L .S . HARRIS, and J .H . McNEIL, Jr .,
Biochem. Pharmacol . 22, 383- 397 (1973) .6 . ~RYRFEL ,~C.H.RAMSAY, I .M . NILSSON, M. WIDMAN, and S. AGURELL, Acta
Pharm. Suecica 10, 13-28 1973) .7 . S . MAGOUR, H . CO'PER, C . F~HNDRICH, and R . HILL, Llfe Scl . 18, 575-584
(1976) .
Vol . 21, No . 3, 1977
Disposition of 14CtA9~T1iC and 3g-D9-THC
449
8 . B .R . MARTIN, W .L. DEWEY, L .S . HARRIS, and J .S . BECKNER, _J . Pharmacol . Eue .The r . 1~6, 128-144 (1976) .
9 . H .A . KLAUSNER and J .V . DINGELL, Life Sci . 10 (1), 49-59 (1971) .10 . L . LEMBERGER, S .D . SILBERSTEIN, J . AXELROD,and I .J . KOPIN, Science 170,
1320-1322 (1970) .il . R .I . FREUNDENTHAL, J . MARTIN, and M .E . WALL, Brit . J . Pharmacol . 44,
244-249 (1972) .
_
-
12 . D .S. KREUZ and J . AXELROD, Science 17~, 391 -393 (1973) .13 . E .G . LEIGHTY, Biochem . Pharmacol . 22, 1613-1621 (1973) .14 . M .D. WILLINSKY, H. KALANT, 0 . MERES2, L. ENDRENYI, and N . W00, _Eur . _J .
Pharmacol . ~, 106-119 (1974) .15 . A.J. SIEMENS and H . KALANT, Biochem . Pharmacol . _24, 755-762 (1975) "16 . G .T. PRYOR, S . HUSAIN, and C . MITOMA, Pharmacol . Biochem . Beh ., in press
(1977) .
-
17. D.E. MAYNARD, 0 . GURNY, R .G . PITCHER, and R.W . KIERSTEAD, Experientia 27,1154-1155 (1971) .
18 . S . BURSTEIN, J . ROSENFELD, and T . WITTSTRUCK, Science 176, 422-423 (1972) .19 . L . LEMBERGER, R . Mr14AHON, and R. ARCHER, The Pharmacology of Marihuana,
M.C. Braude and S. Szara, Eds . (pp . 125-13~ Raven Press, N.Y .
19720 . W .D .M . PATON and R.G . PERTWEE, Marihuana : Chemist , Pharmacolo ,
Metabolism and Clinical Effects, R . Mechoulam, Ed. pp . 191-2 5Academic Press, N .Y . 1973j-
21 . Biolo ical Handbooks , Metabolism , P.L . Altman and D.S. Dittmer, Eds .p . 5
Federation of American Societies for Experimental Biology,Bethesda, Md . (1968) .
22.
M.E . WALL, D.R . BRINE, and M . PEREZ-REYES, The Pharmacology _of Marihuana,M.C . Braude and S . Szara, Eds . (pp. 93-113)Raven Press, N .Y
(197 j.-
Recommended