A Data Scientist Exploration in the World of Heterogeneous Open Geospatial Data
Gloria Re Calegari and Irene Celino
CEFRIEL – Politecnico di Milano
Como, July 17th 2015
Free and Open Source Software for Geospatial - FOSS4G Europe 2015
Digital information about cities• Open data (large number of data sources available on the web):
• Urban planning (land cover, public registers)• Demographics and statistics about municipality
• Closed data sources produced and maintained by enterprises:• Phone activity data but sometimes made open!
• User generated information:• Volunteered geographic information and crowdsourcing information (Open Street
Map)• Location based social network (Foursquare check-ins and geo located information)
• Real-time and streaming information• Sensors (e.g. Temperature, energy consumption, ..)
2Free and Open Source Software for Geospatial - FOSS4G Europe 2015
Data exploration process and case study
A lot of data could describe the urban environment from different perspectives -> great wealth for data scientist.
Managing, processing and comparing those data can be cumbersome -> smarter solutions are required.
Data exploration of hetherogeneous urban information sources related to the city of Milano in Italy:
• Possible issues• Best practices• Data exploration through correlation analysis
(understand if diverse information sources mirror the same picture of a city)
Free and Open Source Software for Geospatial - FOSS4G Europe 2015 3
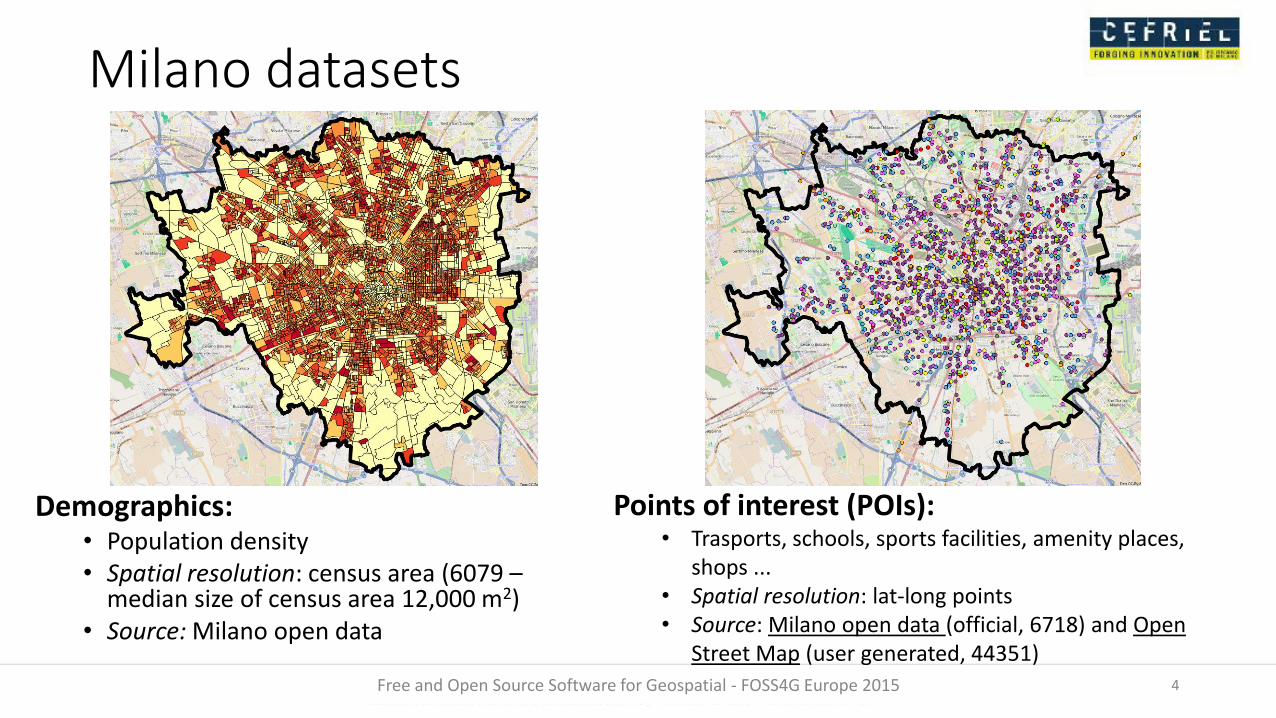
Milano datasets
Demographics: • Population density• Spatial resolution: census area (6079 –
median size of census area 12,000 m2) • Source: Milano open data
Points of interest (POIs): • Trasports, schools, sports facilities, amenity places,
shops ...• Spatial resolution: lat-long points • Source: Milano open data (official, 6718) and Open
Street Map (user generated, 44351)4Free and Open Source Software for Geospatial - FOSS4G Europe 2015
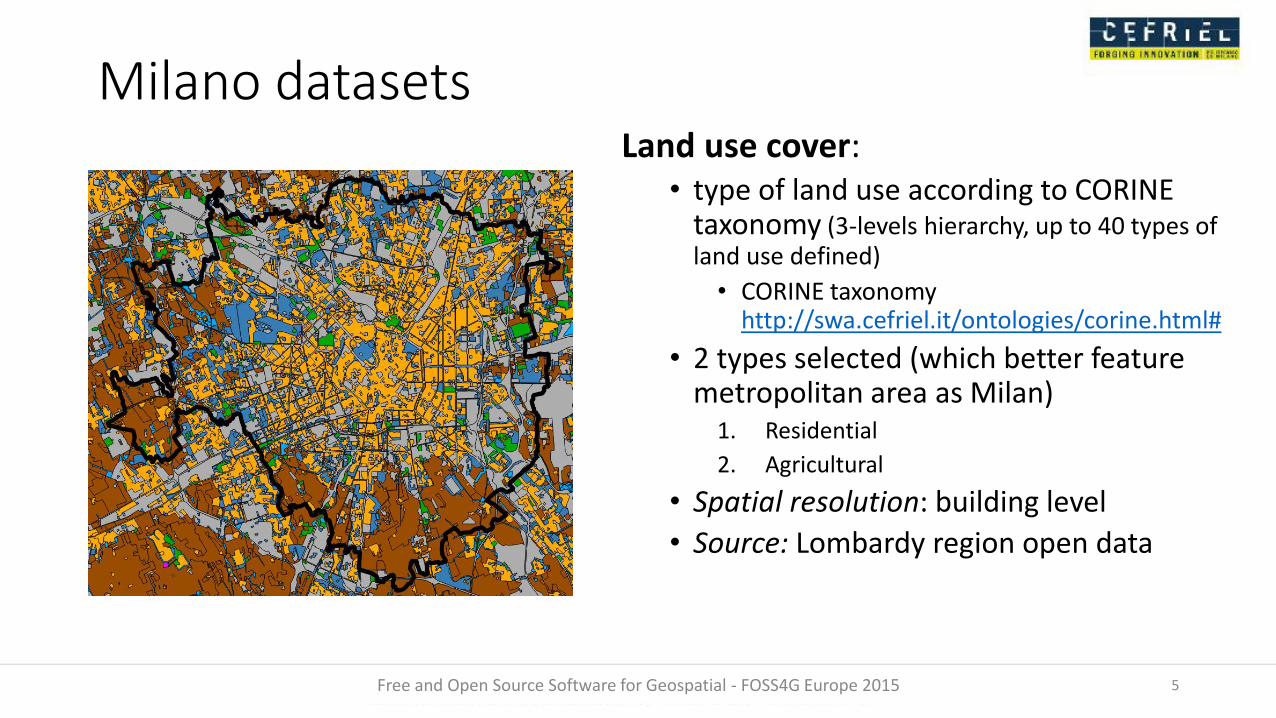
Milano datasetsLand use cover:
• type of land use according to CORINE taxonomy (3-levels hierarchy, up to 40 types of land use defined)
• CORINE taxonomy http://swa.cefriel.it/ontologies/corine.html#
• 2 types selected (which better feature metropolitan area as Milan)
1. Residential
2. Agricultural
• Spatial resolution: building level
• Source: Lombardy region open data
5Free and Open Source Software for Geospatial - FOSS4G Europe 2015
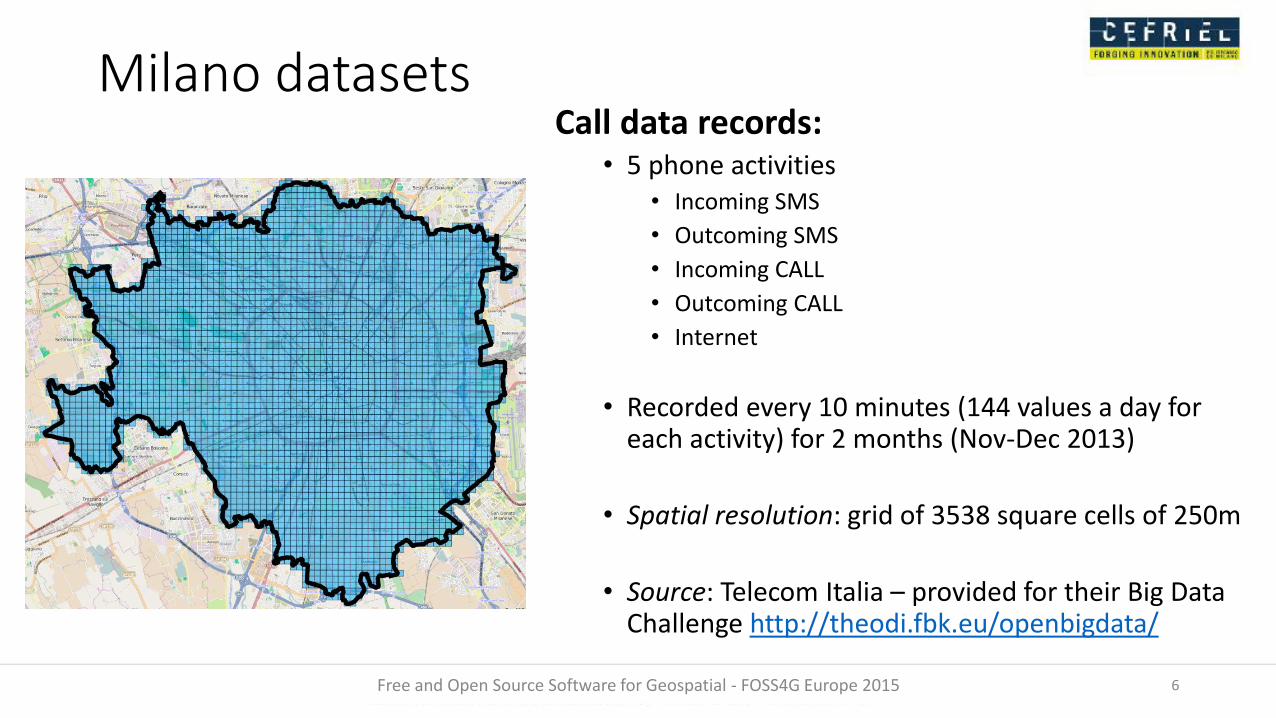
Milano datasetsCall data records:
• 5 phone activities • Incoming SMS
• Outcoming SMS
• Incoming CALL
• Outcoming CALL
• Internet
• Recorded every 10 minutes (144 values a day for each activity) for 2 months (Nov-Dec 2013)
• Spatial resolution: grid of 3538 square cells of 250m
• Source: Telecom Italia – provided for their Big Data Challenge http://theodi.fbk.eu/openbigdata/
6Free and Open Source Software for Geospatial - FOSS4G Europe 2015
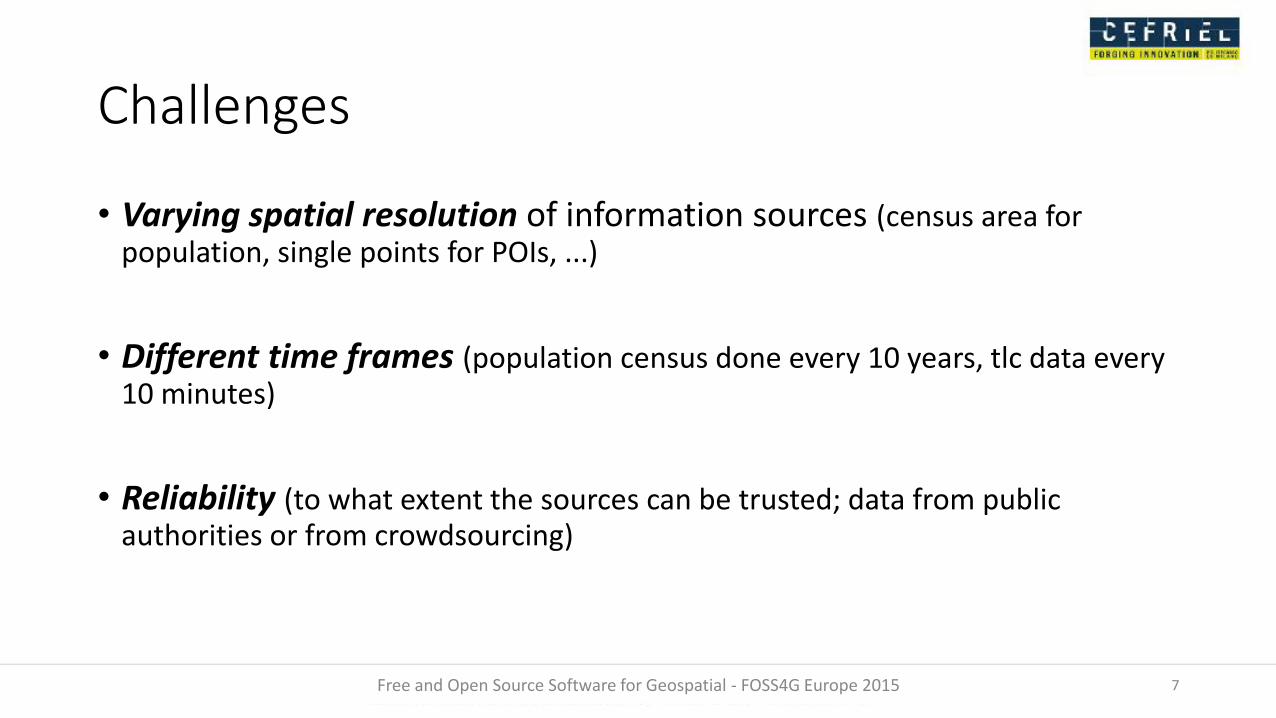
Challenges
• Varying spatial resolution of information sources (census area for population, single points for POIs, ...)
• Different time frames (population census done every 10 years, tlc data every 10 minutes)
• Reliability (to what extent the sources can be trusted; data from public authorities or from crowdsourcing)
Free and Open Source Software for Geospatial - FOSS4G Europe 2015 7
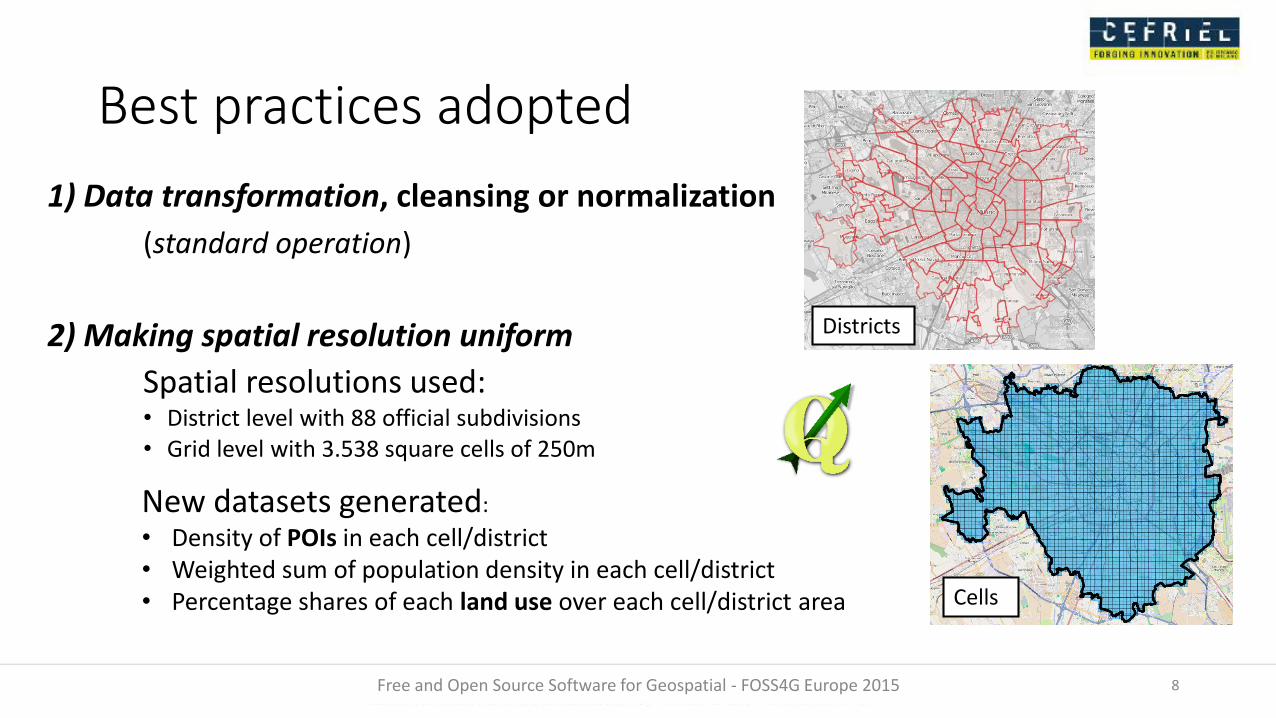
Best practices adopted
1) Data transformation, cleansing or normalization
(standard operation)
2) Making spatial resolution uniform
Spatial resolutions used: • District level with 88 official subdivisions• Grid level with 3.538 square cells of 250m
Free and Open Source Software for Geospatial - FOSS4G Europe 2015 8
Cells
Districts
New datasets generated:
• Density of POIs in each cell/district• Weighted sum of population density in each cell/district• Percentage shares of each land use over each cell/district area
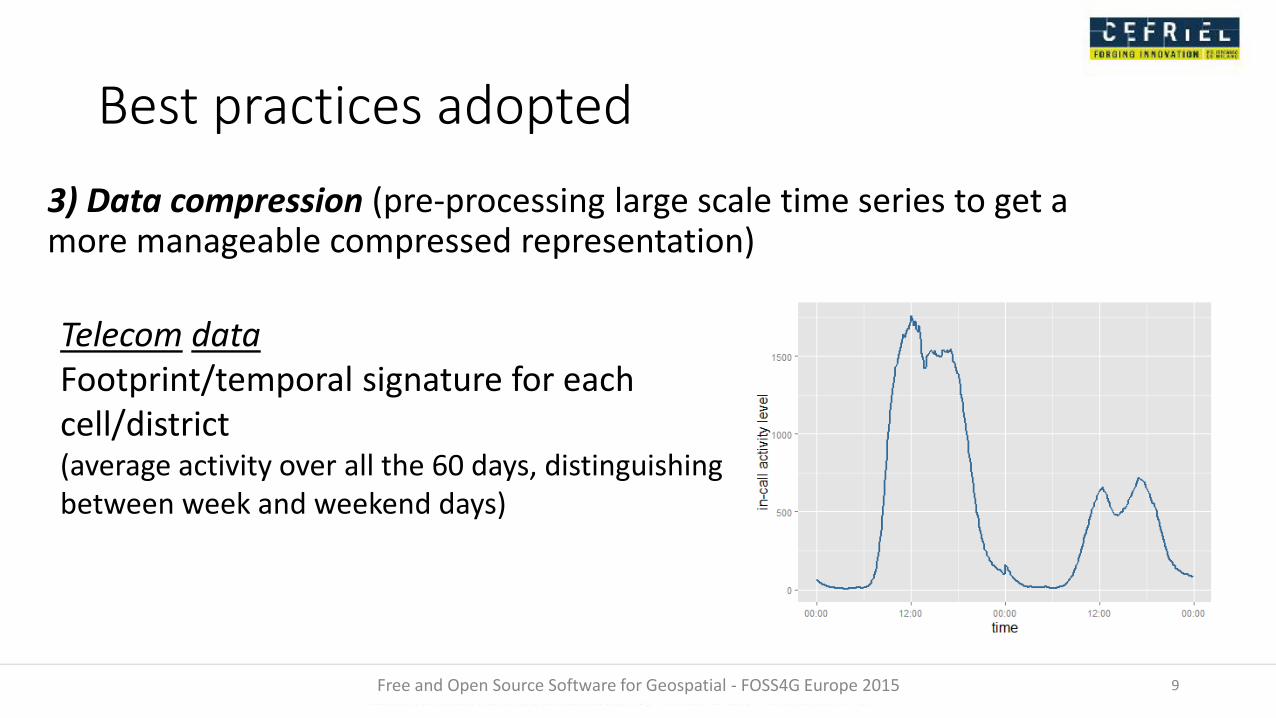
Best practices adopted
3) Data compression (pre-processing large scale time series to get a more manageable compressed representation)
Free and Open Source Software for Geospatial - FOSS4G Europe 2015 9
Telecom dataFootprint/temporal signature for each cell/district(average activity over all the 60 days, distinguishing between week and weekend days)
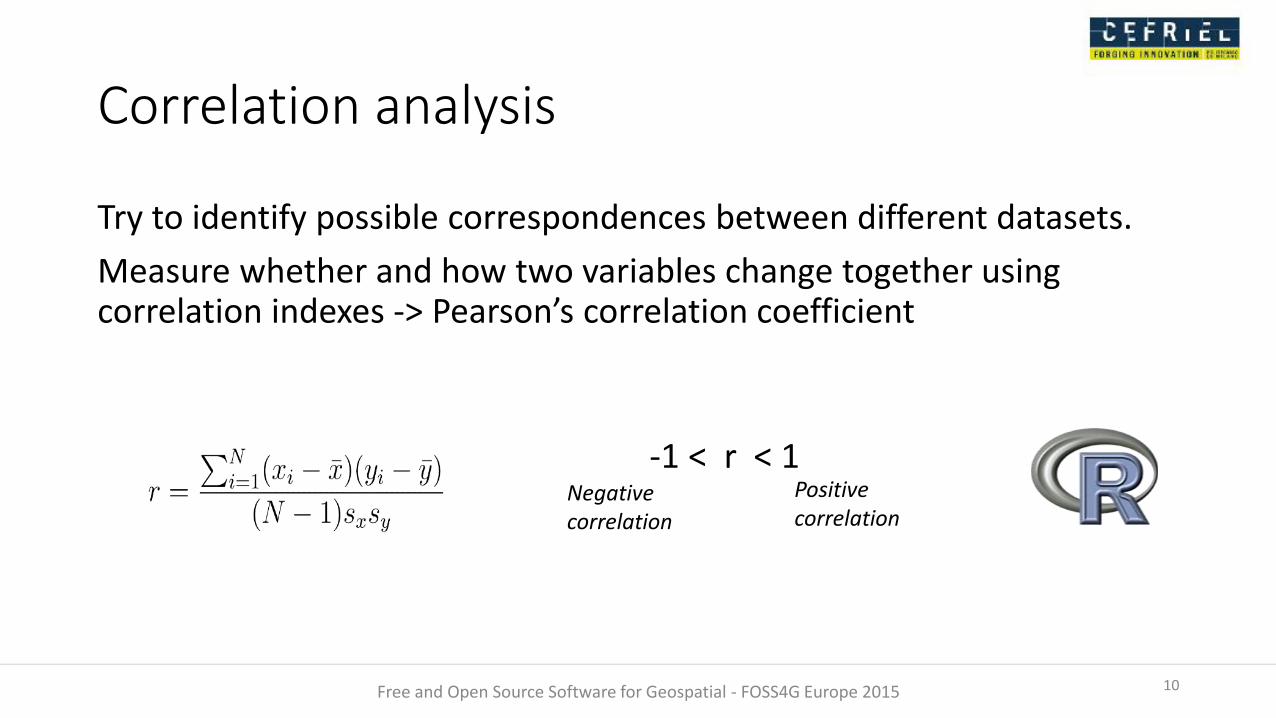
Correlation analysis
Try to identify possible correspondences between different datasets.
Measure whether and how two variables change together using correlation indexes -> Pearson’s correlation coefficient
Free and Open Source Software for Geospatial - FOSS4G Europe 2015 10
-1 < r < 1Positive correlation
Negative correlation
Correlation analysis - datasets
Pairwise comparisons between 1-dimensional vectors:
• POIs municipality: density
• POIs OSM: density
• Population: density
• Telecom: first Principal Component with 90% of explained variability
• Land use data: residential and agricultural used separately, in term of belonging percentages to district/cell
Free and Open Source Software for Geospatial - FOSS4G Europe 2015 11
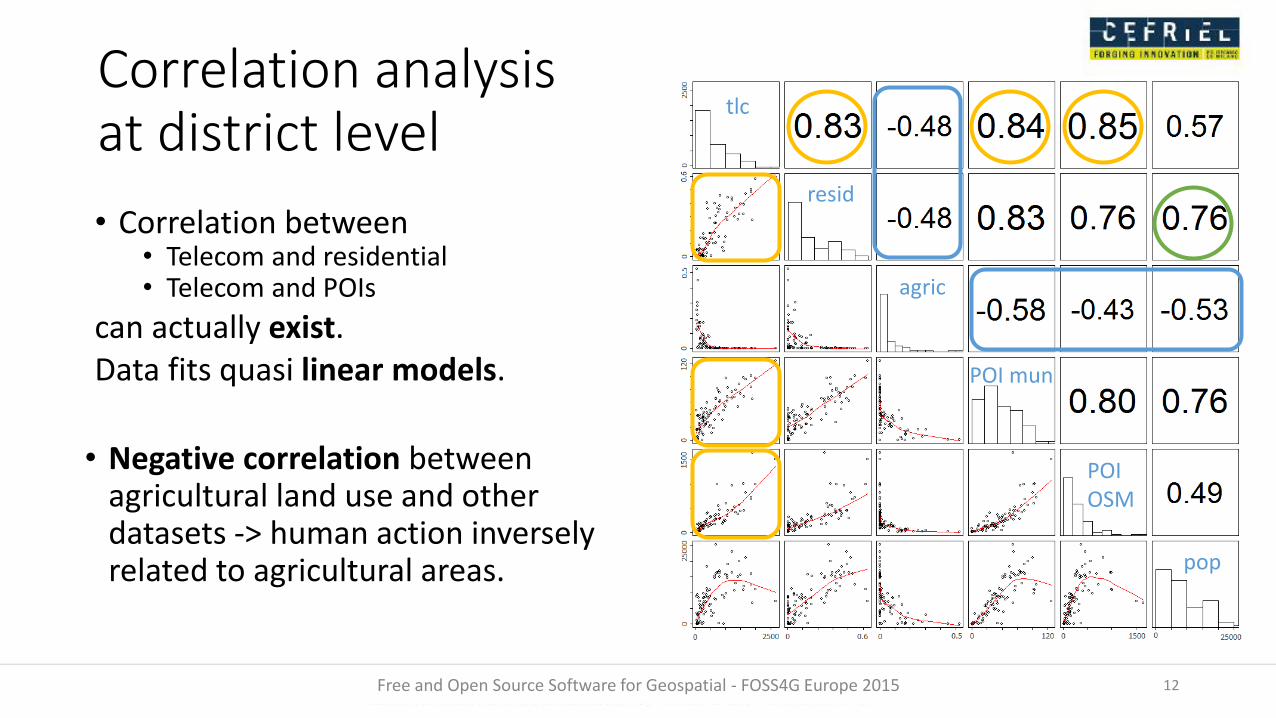
Correlation analysisat district level
Free and Open Source Software for Geospatial - FOSS4G Europe 2015 12
• Correlation between • Telecom and residential• Telecom and POIs
can actually exist. Data fits quasi linear models.
tlc
resid
agric
POI mun
POI OSM
pop
• Negative correlation between agricultural land use and other datasets -> human action inversely related to agricultural areas.
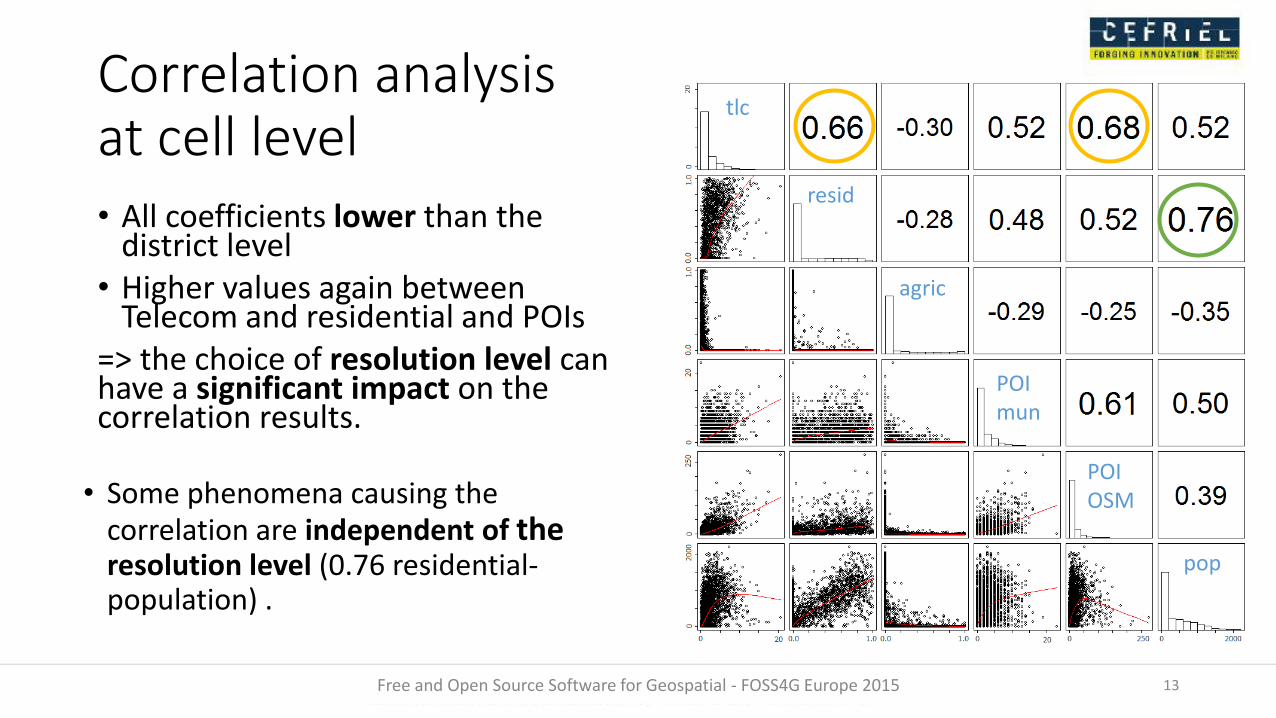
Correlation analysisat cell level• All coefficients lower than the
district level• Higher values again between
Telecom and residential and POIs=> the choice of resolution level can have a significant impact on the correlation results.
Free and Open Source Software for Geospatial - FOSS4G Europe 2015 13
tlc
resid
agric
POI mun
POI OSM
pop
• Some phenomena causing the correlation are independent of theresolution level (0.76 residential-population) .
Correlation analysis: phone calls and population
Free and Open Source Software for Geospatial - FOSS4G Europe 2015 14
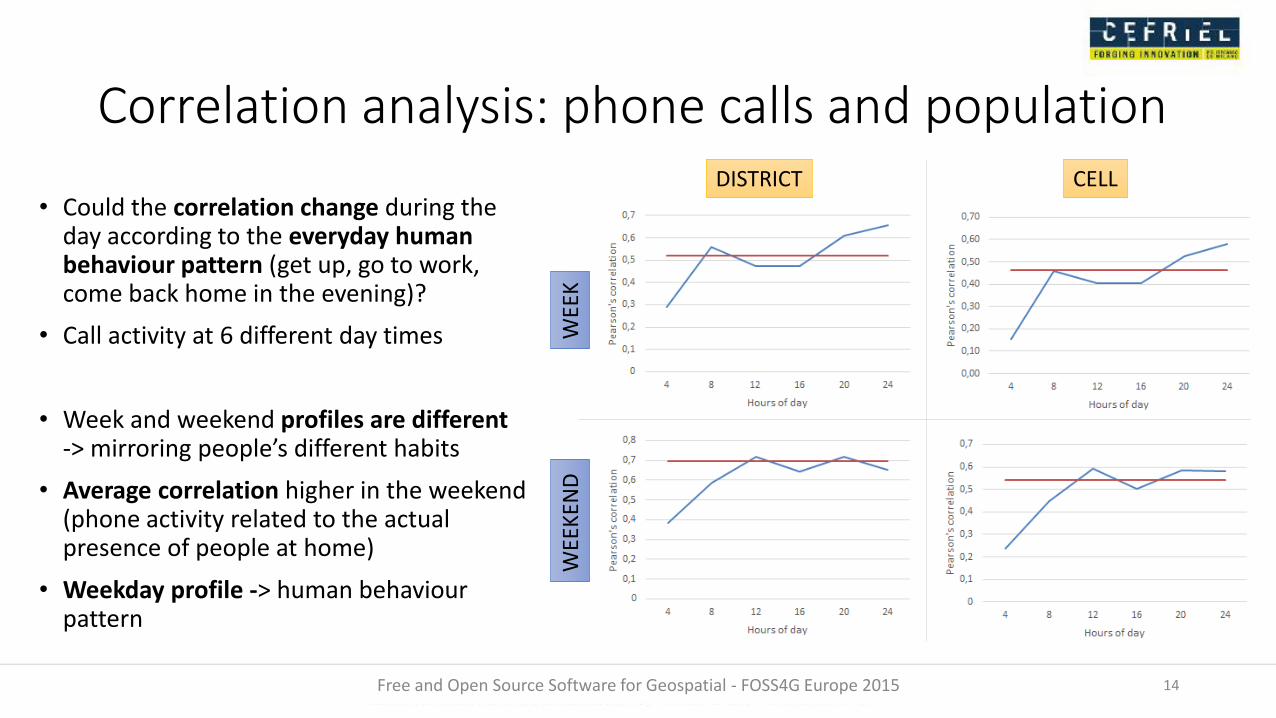
• Could the correlation change during the day according to the everyday human behaviour pattern (get up, go to work, come back home in the evening)?
• Call activity at 6 different day times
• Week and weekend profiles are different -> mirroring people’s different habits
• Average correlation higher in the weekend (phone activity related to the actual presence of people at home)
• Weekday profile -> human behaviour pattern
DISTRICT CELL
WEE
KW
EEK
END
Conclusions and future worksTo sum up...
• Presentation of the best practices for data exploration process applied on urban dataset of Milano
• Approach presented in a urban environment but can be applied also in different environment
• Correlation between different sources exists and it is strongly related to the resolution level adopted
What is coming next?
• Extending our investigation toward a predicting approach
• Would it be possible to use one or more ‘cheap’ datasets (like open data) as a proxy for more ‘expensive’ data sources?
• Explorative analysis => statistical and machine learning techniques.
15Free and Open Source Software for Geospatial - FOSS4G Europe 2015
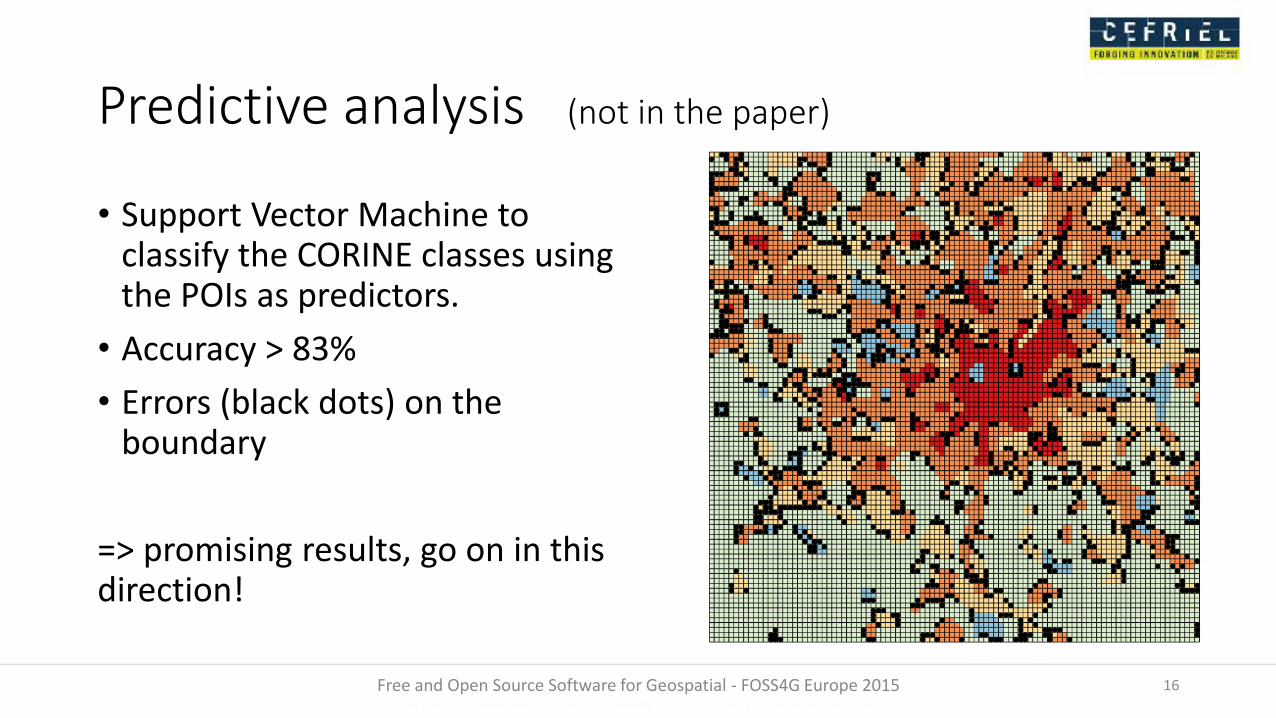
Predictive analysis (not in the paper)
• Support Vector Machine to classify the CORINE classes using the POIs as predictors.
• Accuracy > 83%
• Errors (black dots) on the boundary
=> promising results, go on in this direction!
Free and Open Source Software for Geospatial - FOSS4G Europe 2015 16
Thank you! Any question?
A Data Scientist Exploration in the World of Heterogeneous Open Geospatial Data
Gloria Re Calegari and Irene Celino
CEFRIEL – Politecnico di Milano
Free and Open Source Software for Geospatial - FOSS4G Europe 2015
Recommended