Author’s personal copy
Analysis of Bayesian Classification based Approaches for Android
Malware Detection
Suleiman Y. Yerima, Sakir Sezer, Gavin McWilliams
Postprint
Full article information:
S. Y. Yerima, S. Sezer, G. McWilliams. “Analysis of Bayesian Classification Based Approaches for Android
Malware Detection” IET Information Security, Volume 8, Issue 1, January 2014, p. 25 – 36, Print ISSN 1751-8709,
Online ISSN 1751-8717. DOI: 10.1049/iet-ifs.2013.0095
Author’s personal copy
Analysis of Bayesian Classification based Approaches for
Android Malware Detection
Suleiman Y. Yerima, Sakir Sezer, Gavin McWilliams
Centre for Secure Information Technologies (CSIT)
Queen’s University, Belfast,
Northern Ireland
Email: [email protected]
Abstract— Mobile malware has been growing in scale and
complexity spurred by the unabated uptake of smartphones
worldwide. Android is fast becoming the most popular mobile
platform resulting in sharp increase in malware targeting the
platform. Additionally, Android malware is evolving rapidly to
evade detection by traditional signature-based scanning. Despite
current detection measures in place, timely discovery of new
malware is still a critical issue. This calls for novel approaches to
mitigate the growing threat of zero-day Android malware.
Hence, in this paper we develop and analyze proactive Machine
Learning approaches based on Bayesian classification aimed at
uncovering unknown Android malware via static analysis. The
study, which is based on a large malware sample set of majority
of the existing families, demonstrates detection capabilities with
high accuracy. Empirical results and comparative analysis are
presented offering useful insight towards development of
effective static-analytic Bayesian classification based solutions
for detecting unknown Android malware.
Keywords- mobile security, Android, malware detection,
data mining, Bayesian classification, static analysis, machine
learning.
1. INTRODUCTION
The Android mobile platform is increasing in popularity
surpassing rivals like iOS, Blackberry, Symbian and Windows
mobile. The apps available on the Google Play Android
market alone are well over 675,000, with an estimated 25
billion downloads (as at October 2012) [1]. At the same time,
malware targeting the Android platform has risen sharply over
the last two years. According to a report from Fortinet
(November 2011), approximately 2000 Android malware
samples belonging to 80 different families had been
discovered [2]. Since the discovery of the first Android
malware in August 2010, more sophisticated families capable
of evading traditional signature-based detection are emerging
[3].
In February 2012, Google introduced Bouncer to its
official app marketplace to screen submitted apps for
malicious behavior. No doubt a welcome development
towards curbing malware, this has not completely eliminated
the problem. Bouncer is based on run-time dynamic
behavioral analysis; and possible means of circumventing its
analysis process have been demonstrated by Oberheide and
Miller [4]. Moreover, other than Google Play, users
commonly download apps from third party sources not
protected by Bouncer.
According to security experts, the difficulties in spotting
malicious mobile apps results in most Android malware
remaining unnoticed for up to 3 months before being
discovered [2]. Furthermore, Oberheide et al. [5] observed that
it took on average 48 days for a signature-based antivirus
engine to become capable of detecting new threats.
Clearly, there is a need for improved detection capabilities
to overcome the aforementioned challenges and mitigate the
impact of evolving Android malware. Hence, in this paper we
present Bayesian classification based machine learning
approaches that utilize static analysis to enable proactive
Android malware detection. The methods are effective in
detecting known families as well as unknown malware with
reasonably high accuracy. Thus, it is definitely useful in
overcoming the limitations of traditional signature-based
scanning as well as viable for filtering apps for further
analysis by complementary methods or manual reverse
engineering analysis by security analysts, thus reducing the
costs and effort involved in uncovering new malware samples.
In this paper, three Bayesian classification based
approaches for detecting Android malware are presented and
analyzed. These are developed from application characteristics
obtained through automated static analysis using a large scale
malware sample library of 49 known Android families and a
wide variety of benign apps. We discuss three viable Bayesian
classification models that can be built from statically mining a
large collection of apps, and provide empirical results that
offer useful insight towards development of effective
automated static analysis based solutions for detecting
unknown Android malware.
The rest of the paper is organized as follows: related work
is discussed followed by the automated reverse engineering
and static analysis that underpins the proposed Bayesian
approaches. Next, the Bayesian models’ formulation is
presented. Experiments, results and analyses follow; the paper
is then concluded further work outlined.
2. RELATED WORK
In the current literature, related work on behavioral based
mobile malware detection such as [7], [8] or on-device
anomaly detection [9] can be found. Different from the
aforementioned, this paper proposes and analyzes off-device,
data mining approaches that employ static analysis of Android
application packages, whilst avoiding performance bottleneck
Author’s personal copy
issues of on-device approaches. Static analysis has the
advantage of being undetectable, as obviously malware cannot
modify its behavior during analysis [2]. Thus, it has been
applied to Android vulnerability assessment, profiling, threat
detection etc. For example, ComDroid [10] is a static analysis
tool for detecting application communication vulnerabilities.
DroidChecker [11] is a tool for detecting capability leakage in
Android applications. ProfileDroid [12] is a monitoring and
profiling system for characterizing Android app behaviors at
multiple layers: static, user, OS and network. RiskRanker [6]
provides not only profiling but also automated risk assessment
to police Android markets and aid zero-day malware
detection. RiskRanker employs a two-order risk analysis
system and classifies apps as high, medium or low risk.
Profiling and reporting function for Android applications
based on static analysis is also presented in [13]. Though the
method used in [13] is designed to identify security and
privacy threats, unlike the study in this paper, it is not based
on data mining or machine learning.
Other existing works that employ static analysis for
detection of malicious activities like SCANDAL [14],
AndroidLeaks [15], and the framework presented in [16],
focus on privacy information leakage. Whereas, the malicious
activities targeted by our work extends beyond privacy
information loss.
In [17] Blasing et al. presented an Android Application
Sandbox (AAS) that uses both static and dynamic analyses on
Android applications to automatically detect suspicious
applications. For the static analysis part, the code is
decompiled and 5 different types of patterns are matched
namely: JNI usage, reflection, spawning child processes,
services and IPC usage, and runtime requested permissions.
Compared to AAS, our methods cover a much wider range of
pattern attributes extracted not only from the application code
logic but also scrutiny of resources, assets, and executable
libraries where malicious payload could be lurking.
Additionally, these attributes contribute to ranked feature sets
which drive our Bayesian classification models.
In [2] Apvrille and Strazzere employ a heuristics approach
based on static analysis for Android malware detection. Their
heuristic engine uses 39 different flags weighted based on
statistics computed from techniques commonly employed by
malware authors in their code. The engine then outputs a risk
score to highlight the most likely malicious sample. Our
approach shares similarity in the reverse engineering
technique, but differs by utilizing Bayesian classification
methods that are more flexible and easier to maintain. For
example, models can be re-trained as new malware samples
are discovered, while features sets can be automatically
updated.
In [18], Schmidt et al. employ static analysis on
executables to extract their function calls using the readelf
command. They then compare these function call lists with
those from Linux malware executables in order to classify the
executables using learning algorithms. In contrast, our static
analysis approach is based on automated analyses of Android
packages. Moreover, Android malware samples across a wide
range of existing families are employed in our work rather
than Linux malware executables.
Other earlier non-Android based papers have explored data
mining and machine learning techniques for malware
identification including for example [19], [20] and [28]. The
authors of [19] apply machine learning methods on a data set
of malicious executables where a set of Windows and MS-
DOS format executables are utilized while comparing three
learning algorithms with signature based detection. While [20]
is based on application of data mining methods and SVM to
distinguish between benign executables and virus by statically
extracting dynamic link libraries and application programming
interfaces.
For the Android platform, a paper by Sahs and Khan [21]
presented a machine learning approach for Android malware
detection based on SVM. A single-class SVM model derived
from benign samples alone is used. Contrary to their approach,
our classification models are trained with both a wide variety
of benign apps and a range of samples from across 49
malware families discovered in the wild. Also, in [22],
PUMA (Permission usage to detect malware in Android)
detects malicious Android applications through machine-
learning techniques by analyzing the extracted permissions
from the application itself. Our work leverages not only
permissions, but also other code-based properties through
automated reverse engineering to investigate our data-mining
approach for malware detection. Moreover, our study was
undertaken with a larger malware sample set. Different from
[22], this paper also provides insight into permissions usage
from a different perspective; i.e. in-depth comparative analysis
with the use of other viable application properties to underpin
the machine learning detection approach.
In summary, the main contributions of this paper different
from existing related works in the literature are as follows:
• Novel approaches that apply automated static
analysis based Bayesian classification for proactive Android
malware detection.
• Extensive empirical evaluation and comparative
analysis of the Bayesian classification methods with a large
malware sample set from across 49 malware families in the
wild.
Our approach for discovery of unknown malicious
applications is motivated by the need to bolster existing
methods given their limitations. We also note that the
significant delay between malware release and eventual
discovery is still a critical.
3. ANDROID APP REVERSE ENGINEERING
Android applications are written in Java and compiled by
the Android SDK tools —along with any data and resource
files—into an Android package (APK), an archive file with an
.apk suffix. All the code in a single .apk file is considered to
be one application and it is this file that Android-powered
devices use to install the application. The applications are
distributed as self-contained packages that are compressed
(ZIP) bundle of files typically consisting of:
AndroidManifest.xml (Manifest file), classes.dex (A single
file which holds the complete bytecode to be interpreted by
Author’s personal copy
Dalvik VM). Other binary or XML-based resources required
by the application to run may be held in res/ and assets/
folders.
Decompress .apk files into folders
Convert Manifest.xml binary to readable manifest.xml.clean
Disassemble each classe.dex file to constituent .smali
Mine .smali files to extract code-based features
Permissions-based feature vectors
Mine manifest.xml.clean files to extract Permissions
Code-based feature vectors
Mixed Permissions and Code-based feature vectors
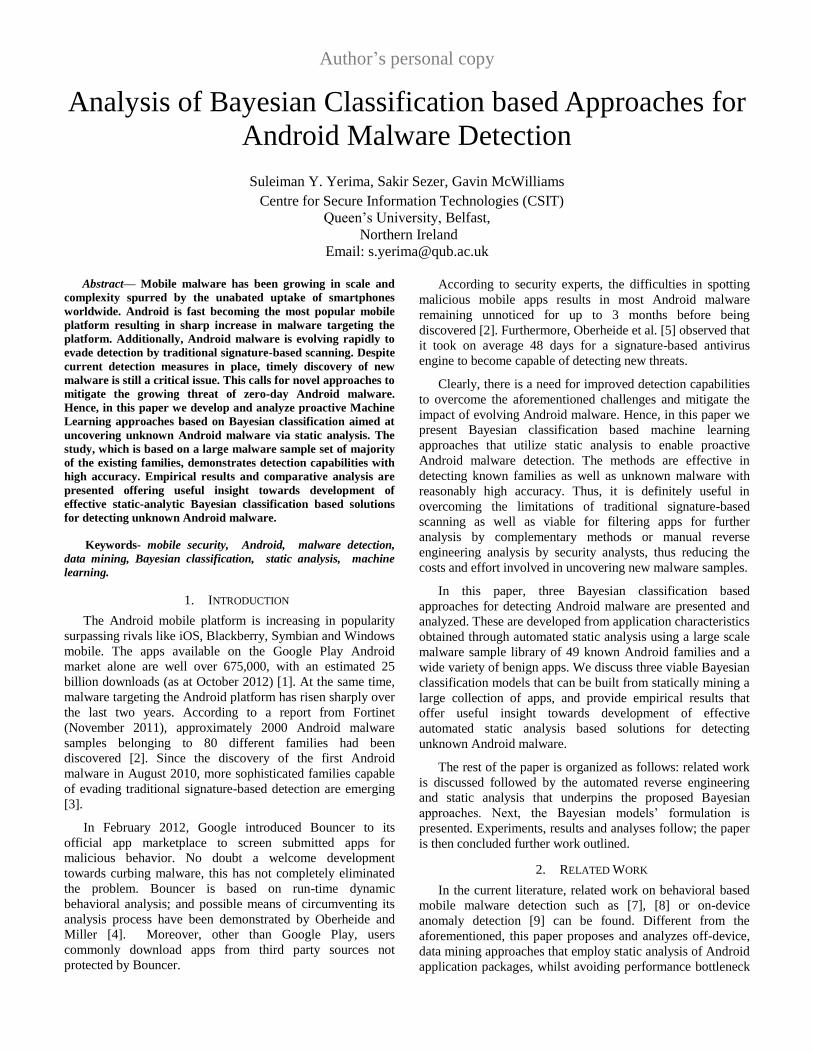
Figure 1. Automated Android app reverse engineering and
data mining for Bayesian model(s) feature extraction with
the Java-based custom built APK analyzer.
The Android application is built from four different types
of components: Activities, Services, Broadcast Receivers, and
Content Providers [23]. An application must declare its
components in a Manifest file which must be at the root of the
application project directory. Before the Android system can
start an application component, the system must know that the
component exists by reading this file. The Manifest file also
states the user permissions that the application requires, such
as internet access or read-access to the user’s contacts.
In order to facilitate the machine learning detection
approaches in this paper, we implemented a Java-based
Android package analyzer and profiling tool for automated
reverse engineering of the APK files. The steps involved are
shown in Figure 1.
First, the .apk files are decompressed into separate folders
containing the Manifest file, .dex file and other resource
subfolders. Afterwards, the manifest file is converted into
readable format using AXML2jar. The .dex file is then
disassembled using a tool called Baksmali [24]. Baksmali is a
disassembler for the dex format used by Dalvik. Baksmali
disassembles .dex files into multiple files with .smali
extensions. Each .smali file contains only one class
information which is equivalent to a Java .class file. The files
in the decompressed folders are mined to extract relevant
properties subsequently used to construct the Bayesian
classification-based models.
4. THE MACHINE LEARNING APPROACHES
Data mining and machine learning are increasingly being
applied in the anti-malware industry, particularly in
augmenting well-established heuristics and generics methods
[25]. Data mining drives automation, which is motivated by
reducing maintenance costs associated with the traditional
heuristics and generics methods [25]. Data mining usually
employs machine learning methods for inference, prediction,
classification etc. Hence, it is important to select an
appropriate method depending on the particular application.
Bayesian classification is well suited to our problem of
filtering large amounts of apps as it can perform relatively fast
classification with low computational overhead once trained.
Another important property which motivates its
implementation in our approach for detecting suspicious
Android applications, is the ability to model both an ‘expert’
and ‘learning’ system with relative ease compared to other
machine learning techniques. Bayesian method allows the
incorporation of prior probabilities (expert knowledge) even
before the training phase. This hybrid property can be
exploited as a performance tuning tool without incurring
additional computational overhead.
4.1 The classifier model
The Bayesian based classifier consists of learning and
detection stages. The learning stage uses a training set of
known malicious samples in the wild and another set of
benign Android applications, collectively called the app
corpus. The Java-based package analyzer uses several
‘detectors’ to extract the desired features from each app in the
corpus. The feature set is subsequently reduced by a feature
ranking and selection function, while the training function
calculates the marginal and conditional probabilities used in
formulating the algorithm employed for the final classification
decisions.
4.2 Feature ranking and selection
Let an application characteristic ri obtained from mining of
the APKs by the analyzer, be defined by a random variable:
1, cov det0,{i
if dis ered by the ectorsotherwiseR
(1)
In order to ensure selection of the most relevant
application features for the classification stage, we calculate
the Mutual Information (MI) [26] or information gain of each
feature Ri with respect to the class variable C. This is used to
rank the features and select the most relevant features during
the feature selection stage prior to model training. Let C be a
random variable representing the application class, suspicious
or benign:
,{ }C suspicious benign
Every application is assigned a vector defined by
1, 2,... nr r r rwith ri being the result of the ith random
variable Ri. As the goal is to select the most relevant features,
the feature selection function computes the MI ranking score
of each random variable calculated as follows:
2
;; og
.0,1 { , }
( , ) P Ri r C cP Ri r C c l
P Ri r P C cr c sus ben
MI Ri C
(2)
Author’s personal copy
Given that ; ( ) ( | )P Ri r C c P Ri r P C c Ri r the above equation
becomes:
0,1 { , }
|| og
2( , )
r c sus ben
P C c Ri ri P Ri r P C c Ri r l
P C cMI R C
(3)
After calculating the score for each feature Ri, the feature
set is then ranked in descending order and the top n most
relevant features with the highest information gain are then
selected for training the model in order to maximize the
classification accuracy.
4.3 Bayesian classification.
A. Model evaluation
According to Bayes theorem, the probability of an
application with the feature vector 1, 2,... nr r r r
belonging in class C is given by:
1
{0,1} 1
( | )
( ) ( | )
( ) ( | )j j
n
i i
i
n
i i
j i
P C c R r
P C c P R r C c
P C c P R r C c
(4)
Where ( | )i iP R r C c and ( )jP C c are the estimated
probabilities obtained from the frequencies calculated on the
app learning corpus. While n is the number of features used in
the classification engine; c0 and c1 are the benign and
suspicious classes respectively.
An app represented by the vector 1, 2,... nr r r r
is
classified as benign if:
( | ) ( | )P C benign R r P C suspicious R r (5)
Otherwise, it is classified as suspicious. In terms of
classification error, two cases can occur: (a) A benign app
misclassified as suspicious. (b) A suspicious app misclassified
as benign. In the context of our problem, the latter case is
considered more critical, since allowing a malicious app to
reach an end device is more critical than excluding a benign
app from the distribution chain to be subject to further
scrutiny.
4.4 Implemented Bayesian models from different data
mining approaches
Three different data mining methods are implemented
within the apk analyzer in order to build the Bayesian
classification models. Through automated mining of the pre-
processed .apk files, three separate models are built from:
Input features derived from standard Android
permissions extracted by static analysis of the
Manifest files.
Input features derived from code-based properties
obtained by parsing disassembled .dex files present
in the apk and other external resource files resulting
from the apk decompression by the custom built
analyzer.
Input feature set consisting of a mixture of both
standard permissions and code-based properties.
4.4.1 Permission-based Bayesian classifier
Permissions are the most recognizable security feature in
Android [22]. A user must accept them in order to install an
application. Kirin [27] uses permissions for lightweight on-
device application certification. Permissions have also been
used in several of the Android tools mentioned in section 2,
to provide app profiling information. Thus, their efficacy for
machine learning based malware detection using trained
models from large malware sample sets will be investigated.
A permission is declared using the <uses-permission>
tag in the Manifest file. For example, in order for an
application to read phone contacts it must declare the
standard Android permission as follows:
<uses-permission
android:name="android.permission.READ_CON
TACTS">
</uses-permission>
In order to build our permission-based model, 2000
Android applications comprising 1000 malware samples
(from 49 different families) and 1000 benign apps were
utilized. The apk analyzer parses the decrypted manifest file
from each app and uses a permissions detector to match 131
standard Android permissions. Once a permission is detected,
its count is incremented and stored. The stored total for each
permission is further utilized by the feature selection function
to rank and select the most relevant features for the
permission-based Bayesian classifier, using equation (3).
The breakdown of the 49 malware families used and their
respective number of samples are shown in Table 1. The
malware samples were obtained from the Android Malware
Genome Project [3]. The set of 1000 non-malicious apps
were made up of different categories in order to cover a wide
variety of application types. The categories include:
entertainment, system tools, sports, health and fitness, news
and magazines, finance, music and audio, business,
education, games and a few other miscellaneous categories.
The apps from third party market places were screened using
virustotal scanning service to exclude potentially malicious
apps from the benign set.
TABLE 1. MALWARE FAMILIES USED AND THEIR NUMBERS.
FAMILY NO OF
SAMPLES FAMILY
NO OF
SAMPLES
ADRD 22 GINGERMASTER 4
ANSERVERBOT 130 GOLDDREAM 47
ASROOT 8 GONE60 9
BASEBRIDGE 100 GPSSMSSPY 6
BEANBOT 8 HIPPOSMS 4
BGSERVE 9 JIFAKE 1
COINPIRATE 1 JSMSHIDER 16
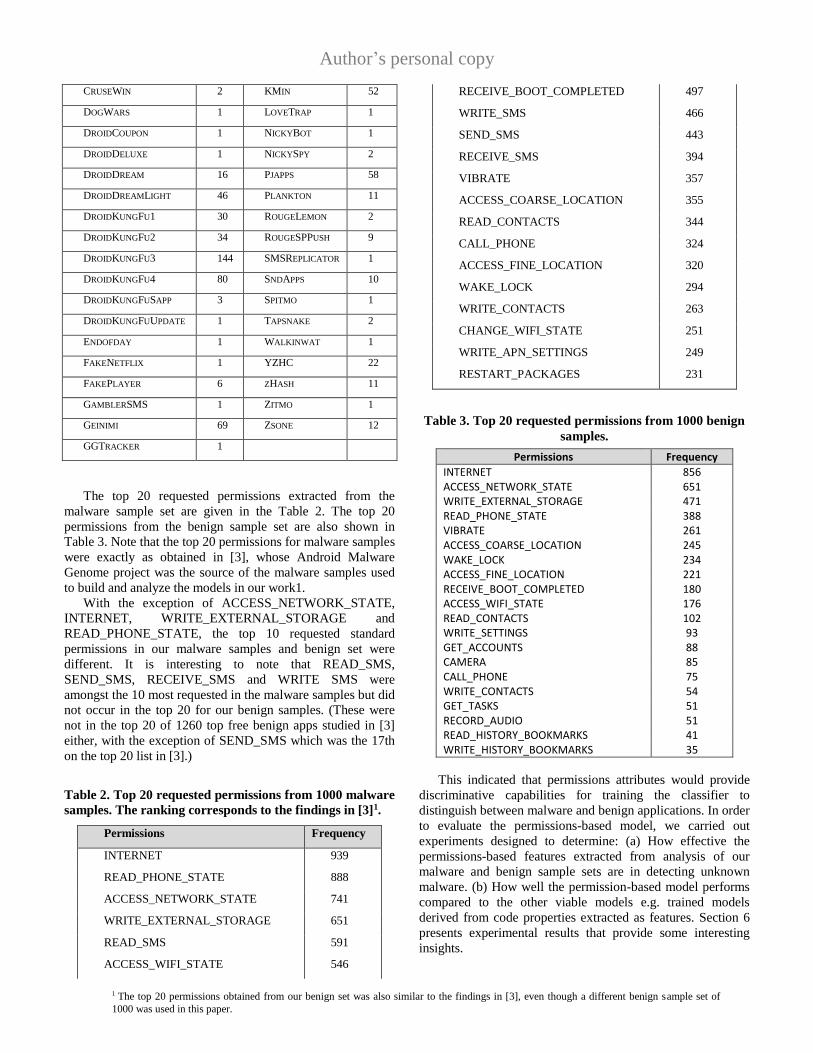
Author’s personal copy
CRUSEWIN 2 KMIN 52
DOGWARS 1 LOVETRAP 1
DROIDCOUPON 1 NICKYBOT 1
DROIDDELUXE 1 NICKYSPY 2
DROIDDREAM 16 PJAPPS 58
DROIDDREAMLIGHT 46 PLANKTON 11
DROIDKUNGFU1 30 ROUGELEMON 2
DROIDKUNGFU2 34 ROUGESPPUSH 9
DROIDKUNGFU3 144 SMSREPLICATOR 1
DROIDKUNGFU4 80 SNDAPPS 10
DROIDKUNGFUSAPP 3 SPITMO 1
DROIDKUNGFUUPDATE 1 TAPSNAKE 2
ENDOFDAY 1 WALKINWAT 1
FAKENETFLIX 1 YZHC 22
FAKEPLAYER 6 ZHASH 11
GAMBLERSMS 1 ZITMO 1
GEINIMI 69 ZSONE 12
GGTRACKER 1
The top 20 requested permissions extracted from the
malware sample set are given in the Table 2. The top 20
permissions from the benign sample set are also shown in
Table 3. Note that the top 20 permissions for malware samples
were exactly as obtained in [3], whose Android Malware
Genome project was the source of the malware samples used
to build and analyze the models in our work1.
With the exception of ACCESS_NETWORK_STATE,
INTERNET, WRITE_EXTERNAL_STORAGE and
READ_PHONE_STATE, the top 10 requested standard
permissions in our malware samples and benign set were
different. It is interesting to note that READ_SMS,
SEND_SMS, RECEIVE_SMS and WRITE SMS were
amongst the 10 most requested in the malware samples but did
not occur in the top 20 for our benign samples. (These were
not in the top 20 of 1260 top free benign apps studied in [3]
either, with the exception of SEND_SMS which was the 17th
on the top 20 list in [3].)
Table 2. Top 20 requested permissions from 1000 malware
samples. The ranking corresponds to the findings in [3]1.
Permissions Frequency
INTERNET 939
READ_PHONE_STATE 888
ACCESS_NETWORK_STATE 741
WRITE_EXTERNAL_STORAGE 651
READ_SMS 591
ACCESS_WIFI_STATE 546
RECEIVE_BOOT_COMPLETED 497
WRITE_SMS 466
SEND_SMS 443
RECEIVE_SMS 394
VIBRATE 357
ACCESS_COARSE_LOCATION 355
READ_CONTACTS 344
CALL_PHONE 324
ACCESS_FINE_LOCATION 320
WAKE_LOCK 294
WRITE_CONTACTS 263
CHANGE_WIFI_STATE 251
WRITE_APN_SETTINGS 249
RESTART_PACKAGES 231
Table 3. Top 20 requested permissions from 1000 benign
samples.
Permissions Frequency
INTERNET 856 ACCESS_NETWORK_STATE 651 WRITE_EXTERNAL_STORAGE 471 READ_PHONE_STATE 388 VIBRATE 261 ACCESS_COARSE_LOCATION 245 WAKE_LOCK 234 ACCESS_FINE_LOCATION 221 RECEIVE_BOOT_COMPLETED 180 ACCESS_WIFI_STATE 176 READ_CONTACTS 102 WRITE_SETTINGS 93 GET_ACCOUNTS 88 CAMERA 85 CALL_PHONE 75 WRITE_CONTACTS 54 GET_TASKS 51 RECORD_AUDIO 51 READ_HISTORY_BOOKMARKS 41 WRITE_HISTORY_BOOKMARKS 35
This indicated that permissions attributes would provide
discriminative capabilities for training the classifier to
distinguish between malware and benign applications. In order
to evaluate the permissions-based model, we carried out
experiments designed to determine: (a) How effective the
permissions-based features extracted from analysis of our
malware and benign sample sets are in detecting unknown
malware. (b) How well the permission-based model performs
compared to the other viable models e.g. trained models
derived from code properties extracted as features. Section 6
presents experimental results that provide some interesting
insights.
1 The top 20 permissions obtained from our benign set was also similar to the findings in [3], even though a different benign sample set of
1000 was used in this paper.
Author’s personal copy
These are indeed pertinent questions given that a larger
malware sample set covering more recent strains of Android
malware is employed for our investigations compared to most
previous works in Android malware detection that utilize
machine learning. Also, permission based models provide a
relatively lightweight static analysis approach since the need
for reverse engineering of the .dex files and parsing a large
number of files for feature extraction and classification is
eliminated, resulting in considerable reduction of detection
effort and time. Furthermore, permissions-based classification
is useful because it is not susceptible to disassembly or
decompilation failure which can sometimes hamper the
reverse engineering during static analysis.
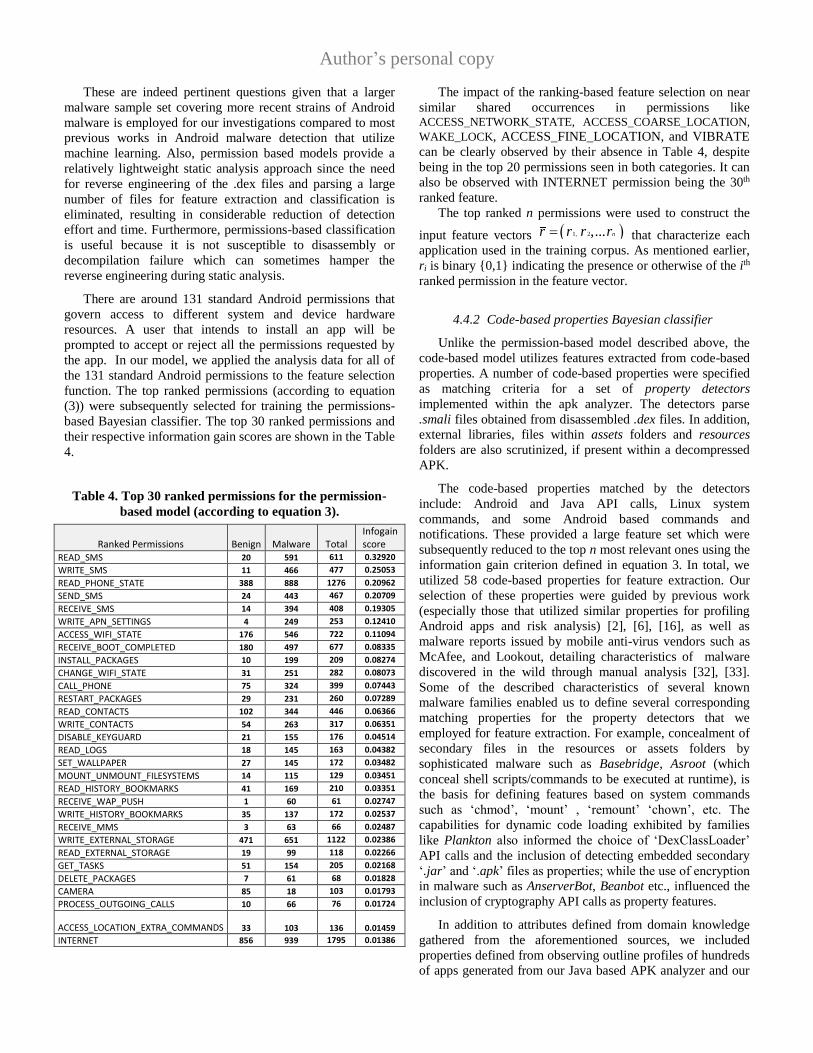
There are around 131 standard Android permissions that
govern access to different system and device hardware
resources. A user that intends to install an app will be
prompted to accept or reject all the permissions requested by
the app. In our model, we applied the analysis data for all of
the 131 standard Android permissions to the feature selection
function. The top ranked permissions (according to equation
(3)) were subsequently selected for training the permissions-
based Bayesian classifier. The top 30 ranked permissions and
their respective information gain scores are shown in the Table
4.
Table 4. Top 30 ranked permissions for the permission-
based model (according to equation 3).
Ranked Permissions Benign Malware
Total Infogain score
READ_SMS 20 591 611 0.32920
WRITE_SMS 11 466 477 0.25053
READ_PHONE_STATE 388 888 1276 0.20962
SEND_SMS 24 443 467 0.20709
RECEIVE_SMS 14 394 408 0.19305
WRITE_APN_SETTINGS 4 249 253 0.12410
ACCESS_WIFI_STATE 176 546 722 0.11094
RECEIVE_BOOT_COMPLETED 180 497 677 0.08335
INSTALL_PACKAGES 10 199 209 0.08274
CHANGE_WIFI_STATE 31 251 282 0.08073
CALL_PHONE 75 324 399 0.07443
RESTART_PACKAGES 29 231 260 0.07289
READ_CONTACTS 102 344 446 0.06366
WRITE_CONTACTS 54 263 317 0.06351
DISABLE_KEYGUARD 21 155 176 0.04514
READ_LOGS 18 145 163 0.04382
SET_WALLPAPER 27 145 172 0.03482
MOUNT_UNMOUNT_FILESYSTEMS 14 115 129 0.03451
READ_HISTORY_BOOKMARKS 41 169 210 0.03351
RECEIVE_WAP_PUSH 1 60 61 0.02747
WRITE_HISTORY_BOOKMARKS 35 137 172 0.02537
RECEIVE_MMS 3 63 66 0.02487
WRITE_EXTERNAL_STORAGE 471 651 1122 0.02386
READ_EXTERNAL_STORAGE 19 99 118 0.02266
GET_TASKS 51 154 205 0.02168
DELETE_PACKAGES 7 61 68 0.01828
CAMERA 85 18 103 0.01793
PROCESS_OUTGOING_CALLS 10 66 76 0.01724
ACCESS_LOCATION_EXTRA_COMMANDS
33
103
136
0.01459
INTERNET 856 939 1795 0.01386
The impact of the ranking-based feature selection on near
similar shared occurrences in permissions like ACCESS_NETWORK_STATE, ACCESS_COARSE_LOCATION,
WAKE_LOCK, ACCESS_FINE_LOCATION, and VIBRATE
can be clearly observed by their absence in Table 4, despite
being in the top 20 permissions seen in both categories. It can
also be observed with INTERNET permission being the 30th
ranked feature.
The top ranked n permissions were used to construct the
input feature vectors 1, 2,... nr r r r that characterize each
application used in the training corpus. As mentioned earlier,
ri is binary {0,1} indicating the presence or otherwise of the ith
ranked permission in the feature vector.
4.4.2 Code-based properties Bayesian classifier
Unlike the permission-based model described above, the
code-based model utilizes features extracted from code-based
properties. A number of code-based properties were specified
as matching criteria for a set of property detectors
implemented within the apk analyzer. The detectors parse
.smali files obtained from disassembled .dex files. In addition,
external libraries, files within assets folders and resources
folders are also scrutinized, if present within a decompressed
APK.
The code-based properties matched by the detectors
include: Android and Java API calls, Linux system
commands, and some Android based commands and
notifications. These provided a large feature set which were
subsequently reduced to the top n most relevant ones using the
information gain criterion defined in equation 3. In total, we
utilized 58 code-based properties for feature extraction. Our
selection of these properties were guided by previous work
(especially those that utilized similar properties for profiling
Android apps and risk analysis) [2], [6], [16], as well as
malware reports issued by mobile anti-virus vendors such as
McAfee, and Lookout, detailing characteristics of malware
discovered in the wild through manual analysis [32], [33].
Some of the described characteristics of several known
malware families enabled us to define several corresponding
matching properties for the property detectors that we
employed for feature extraction. For example, concealment of
secondary files in the resources or assets folders by
sophisticated malware such as Basebridge, Asroot (which
conceal shell scripts/commands to be executed at runtime), is
the basis for defining features based on system commands
such as ‘chmod’, ‘mount’ , ‘remount’ ‘chown’, etc. The
capabilities for dynamic code loading exhibited by families
like Plankton also informed the choice of ‘DexClassLoader’
API calls and the inclusion of detecting embedded secondary
‘.jar’ and ‘.apk’ files as properties; while the use of encryption
in malware such as AnserverBot, Beanbot etc., influenced the
inclusion of cryptography API calls as property features.
In addition to attributes defined from domain knowledge
gathered from the aforementioned sources, we included
properties defined from observing outline profiles of hundreds
of apps generated from our Java based APK analyzer and our
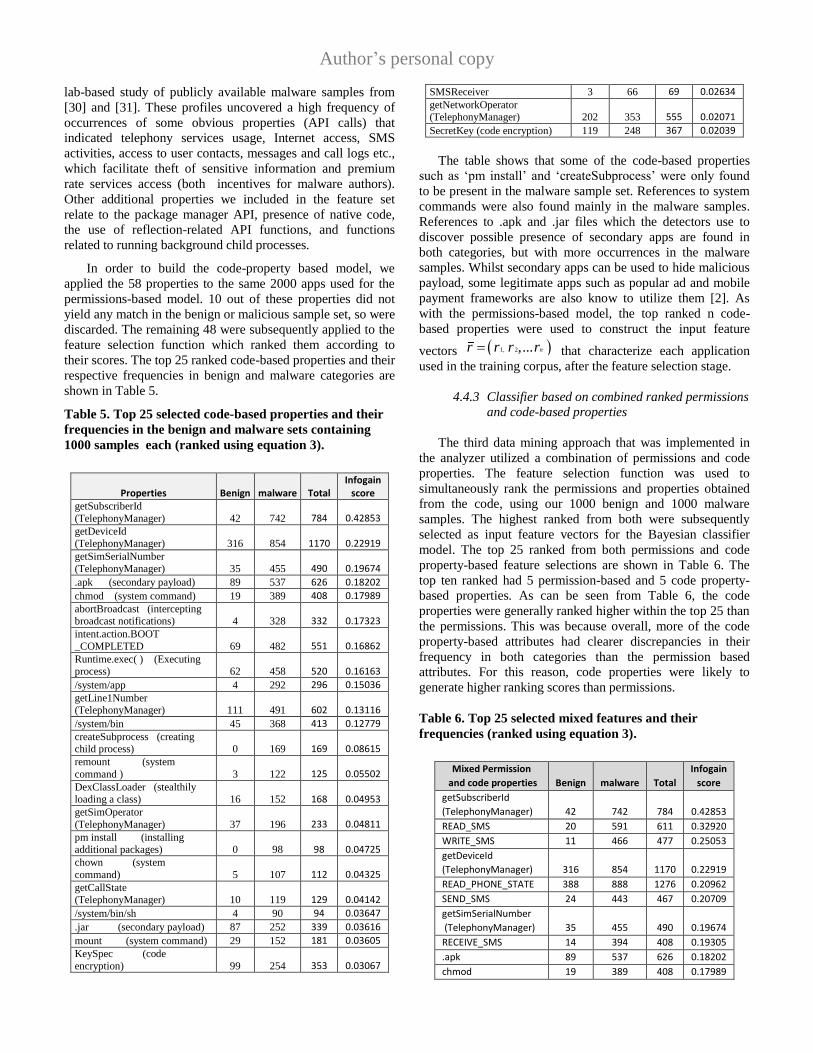
Author’s personal copy
lab-based study of publicly available malware samples from
[30] and [31]. These profiles uncovered a high frequency of
occurrences of some obvious properties (API calls) that
indicated telephony services usage, Internet access, SMS
activities, access to user contacts, messages and call logs etc.,
which facilitate theft of sensitive information and premium
rate services access (both incentives for malware authors).
Other additional properties we included in the feature set
relate to the package manager API, presence of native code,
the use of reflection-related API functions, and functions
related to running background child processes.
In order to build the code-property based model, we
applied the 58 properties to the same 2000 apps used for the
permissions-based model. 10 out of these properties did not
yield any match in the benign or malicious sample set, so were
discarded. The remaining 48 were subsequently applied to the
feature selection function which ranked them according to
their scores. The top 25 ranked code-based properties and their
respective frequencies in benign and malware categories are
shown in Table 5.
Table 5. Top 25 selected code-based properties and their
frequencies in the benign and malware sets containing
1000 samples each (ranked using equation 3).
Properties Benign malware
Total Infogain
score getSubscriberId
(TelephonyManager) 42 742 784 0.42853 getDeviceId (TelephonyManager) 316 854 1170 0.22919 getSimSerialNumber
(TelephonyManager) 35 455 490 0.19674
.apk (secondary payload) 89 537 626 0.18202
chmod (system command) 19 389 408 0.17989 abortBroadcast (intercepting broadcast notifications) 4 328 332 0.17323 intent.action.BOOT
_COMPLETED 69 482 551 0.16862 Runtime.exec( ) (Executing process) 62 458 520 0.16163
/system/app 4 292 296 0.15036 getLine1Number (TelephonyManager) 111 491 602 0.13116
/system/bin 45 368 413 0.12779 createSubprocess (creating child process) 0 169 169 0.08615 remount (system
command ) 3 122 125 0.05502 DexClassLoader (stealthily loading a class) 16 152 168 0.04953 getSimOperator
(TelephonyManager) 37 196 233 0.04811 pm install (installing additional packages) 0 98 98 0.04725 chown (system
command) 5 107 112 0.04325 getCallState (TelephonyManager) 10 119 129 0.04142
/system/bin/sh 4 90 94 0.03647
.jar (secondary payload) 87 252 339 0.03616
mount (system command) 29 152 181 0.03605 KeySpec (code
encryption) 99 254 353 0.03067
SMSReceiver 3 66 69 0.02634 getNetworkOperator (TelephonyManager) 202 353 555 0.02071
SecretKey (code encryption) 119 248 367 0.02039
The table shows that some of the code-based properties
such as ‘pm install’ and ‘createSubprocess’ were only found
to be present in the malware sample set. References to system
commands were also found mainly in the malware samples.
References to .apk and .jar files which the detectors use to
discover possible presence of secondary apps are found in
both categories, but with more occurrences in the malware
samples. Whilst secondary apps can be used to hide malicious
payload, some legitimate apps such as popular ad and mobile
payment frameworks are also know to utilize them [2]. As
with the permissions-based model, the top ranked n code-
based properties were used to construct the input feature
vectors 1, 2,... nr r r r that characterize each application
used in the training corpus, after the feature selection stage.
4.4.3 Classifier based on combined ranked permissions
and code-based properties
The third data mining approach that was implemented in
the analyzer utilized a combination of permissions and code
properties. The feature selection function was used to
simultaneously rank the permissions and properties obtained
from the code, using our 1000 benign and 1000 malware
samples. The highest ranked from both were subsequently
selected as input feature vectors for the Bayesian classifier
model. The top 25 ranked from both permissions and code
property-based feature selections are shown in Table 6. The
top ten ranked had 5 permission-based and 5 code property-
based properties. As can be seen from Table 6, the code
properties were generally ranked higher within the top 25 than
the permissions. This was because overall, more of the code
property-based attributes had clearer discrepancies in their
frequency in both categories than the permission based
attributes. For this reason, code properties were likely to
generate higher ranking scores than permissions.
Table 6. Top 25 selected mixed features and their
frequencies (ranked using equation 3).
Mixed Permission
and code properties Benign malware
Total
Infogain
score
getSubscriberId
(TelephonyManager) 42 742 784 0.42853
READ_SMS 20 591 611 0.32920
WRITE_SMS 11 466 477 0.25053
getDeviceId
(TelephonyManager) 316 854 1170 0.22919
READ_PHONE_STATE 388 888 1276 0.20962
SEND_SMS 24 443 467 0.20709
getSimSerialNumber
(TelephonyManager) 35 455 490 0.19674
RECEIVE_SMS 14 394 408 0.19305
.apk 89 537 626 0.18202
chmod 19 389 408 0.17989
Author’s personal copy
abortBroadcast 4 328 332 0.17323
intent.action.BOOT
_COMPLETED 69 482 551 0.16862
Runtime.exec( ) 62 458 520 0.16163
/system/app 4 292 296 0.15036
getLine1Number
(TelephonyManager) 111 491 602 0.13116
/system/bin 45 368 413 0.12779
WRITE_APN_SETTINGS 4 249 253 0.12410
ACCESS_WIFI_STATE 176 546 722 0.11094
createSubprocess 0 169 169 0.08615
RECEIVE_BOOT
_COMPLETED 180 497
677 0.08335
INSTALL_PACKAGES 10 199 209 0.08274
CHANGE_WIFI_STATE 31 251 282 0.08073
CALL_PHONE 75 324 399 0.07443
RESTART_PACKAGES 29 231 260 0.07289
READ_CONTACTS 102 344 446 0.06366
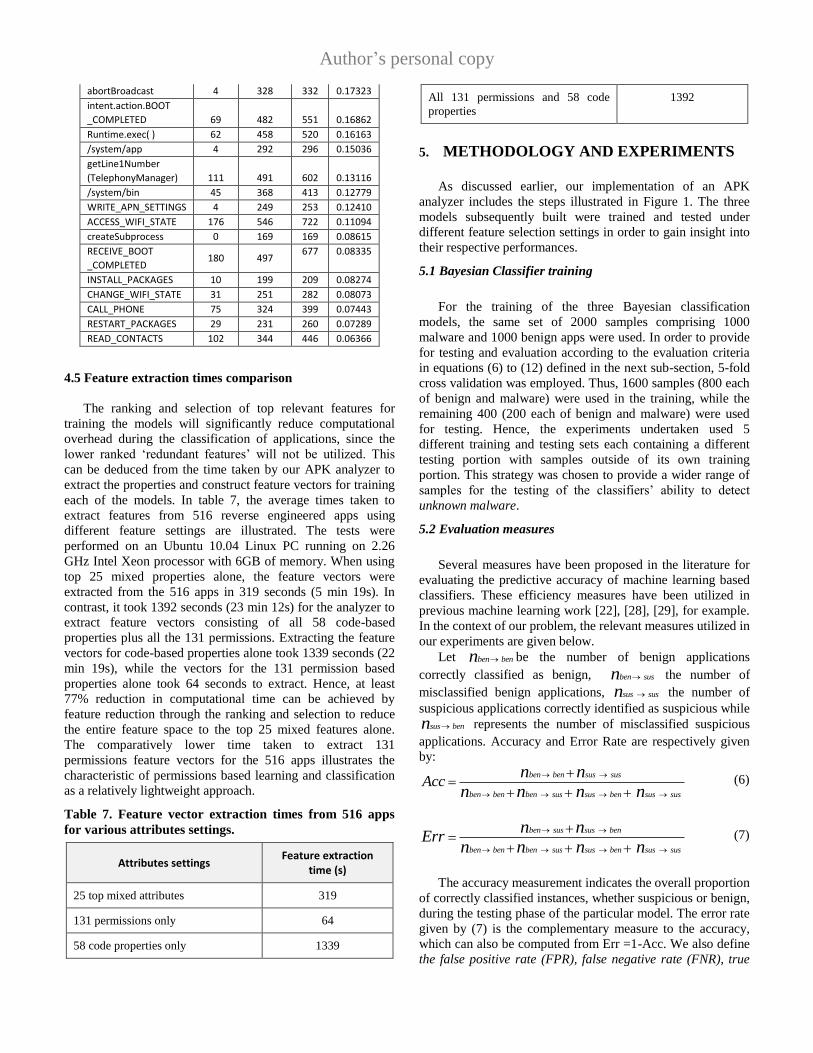
4.5 Feature extraction times comparison
The ranking and selection of top relevant features for
training the models will significantly reduce computational
overhead during the classification of applications, since the
lower ranked ‘redundant features’ will not be utilized. This
can be deduced from the time taken by our APK analyzer to
extract the properties and construct feature vectors for training
each of the models. In table 7, the average times taken to
extract features from 516 reverse engineered apps using
different feature settings are illustrated. The tests were
performed on an Ubuntu 10.04 Linux PC running on 2.26
GHz Intel Xeon processor with 6GB of memory. When using
top 25 mixed properties alone, the feature vectors were
extracted from the 516 apps in 319 seconds (5 min 19s). In
contrast, it took 1392 seconds (23 min 12s) for the analyzer to
extract feature vectors consisting of all 58 code-based
properties plus all the 131 permissions. Extracting the feature
vectors for code-based properties alone took 1339 seconds (22
min 19s), while the vectors for the 131 permission based
properties alone took 64 seconds to extract. Hence, at least
77% reduction in computational time can be achieved by
feature reduction through the ranking and selection to reduce
the entire feature space to the top 25 mixed features alone.
The comparatively lower time taken to extract 131
permissions feature vectors for the 516 apps illustrates the
characteristic of permissions based learning and classification
as a relatively lightweight approach.
Table 7. Feature vector extraction times from 516 apps
for various attributes settings.
Attributes settings Feature extraction
time (s)
25 top mixed attributes 319
131 permissions only 64
58 code properties only 1339
All 131 permissions and 58 code
properties
1392
5. METHODOLOGY AND EXPERIMENTS
As discussed earlier, our implementation of an APK
analyzer includes the steps illustrated in Figure 1. The three
models subsequently built were trained and tested under
different feature selection settings in order to gain insight into
their respective performances.
5.1 Bayesian Classifier training
For the training of the three Bayesian classification
models, the same set of 2000 samples comprising 1000
malware and 1000 benign apps were used. In order to provide
for testing and evaluation according to the evaluation criteria
in equations (6) to (12) defined in the next sub-section, 5-fold
cross validation was employed. Thus, 1600 samples (800 each
of benign and malware) were used in the training, while the
remaining 400 (200 each of benign and malware) were used
for testing. Hence, the experiments undertaken used 5
different training and testing sets each containing a different
testing portion with samples outside of its own training
portion. This strategy was chosen to provide a wider range of
samples for the testing of the classifiers’ ability to detect
unknown malware.
5.2 Evaluation measures
Several measures have been proposed in the literature for
evaluating the predictive accuracy of machine learning based
classifiers. These efficiency measures have been utilized in
previous machine learning work [22], [28], [29], for example.
In the context of our problem, the relevant measures utilized in
our experiments are given below.
Let ben benn be the number of benign applications
correctly classified as benign, ben susn the number of
misclassified benign applications, sus susn the number of
suspicious applications correctly identified as suspicious while
sus benn represents the number of misclassified suspicious
applications. Accuracy and Error Rate are respectively given
by:
ben ben sus sus
ben ben ben sus sus ben sus sus
Accn n
n n n n
(6)
ben sus sus ben
ben ben ben sus sus ben sus sus
Errn n
n n n n
(7)
The accuracy measurement indicates the overall proportion
of correctly classified instances, whether suspicious or benign,
during the testing phase of the particular model. The error rate
given by (7) is the complementary measure to the accuracy,
which can also be computed from Err =1-Acc. We also define
the false positive rate (FPR), false negative rate (FNR), true
Author’s personal copy
positive rate (TPR), true negative rate (TNR) and precision (р)
as follows:
ben sus
ben sus ben ben
FPRn
n n
(8)
sus ben
sus sus sus ben
FNRn
n n
(9)
sus sus
sus ben sus sus
TPRn
n n
(10)
ben ben
ben sus ben ben
TNRn
n n
(11)
sus sus
ben sus sus sus
pn
n n
(12)
The false positive rate FPR, with respect to the suspicious
class is measured by the proportion of misclassified true
benign samples to the total number of benign sample instances
during the testing phase. This is complementary to the true
negative rate TNR, given by the proportion of the overall
benign set that is correctly classified, illustrated by (11).
Thus, true positive rate, TPR refers to truly malicious samples
classified as suspicious divided by the overall number of
malicious samples in the testing set. We also use the TPR and
‘detection rate’ interchangeably, since this measure represents
the model’s capability to detect ‘unknown’ malicious samples.
FNR measures the models tendency to misclassify suspicious
apps as benign and is complementary to the detection rate.
The precision reflects the precision of the model when it
makes a decision to classify a sample as suspicious. Lastly, in
our experiments, we also measured the AUC (Area under the
Receiver Operator Characteristics (ROC) curve), i.e. the total
area under the plot of TPR vs. FPR for every possible
detection cut-off known as ROC. A perfect classifier will have
an AUC of 1. Thus, the closer the AUC is to 1, the greater the
model’s predictive power.
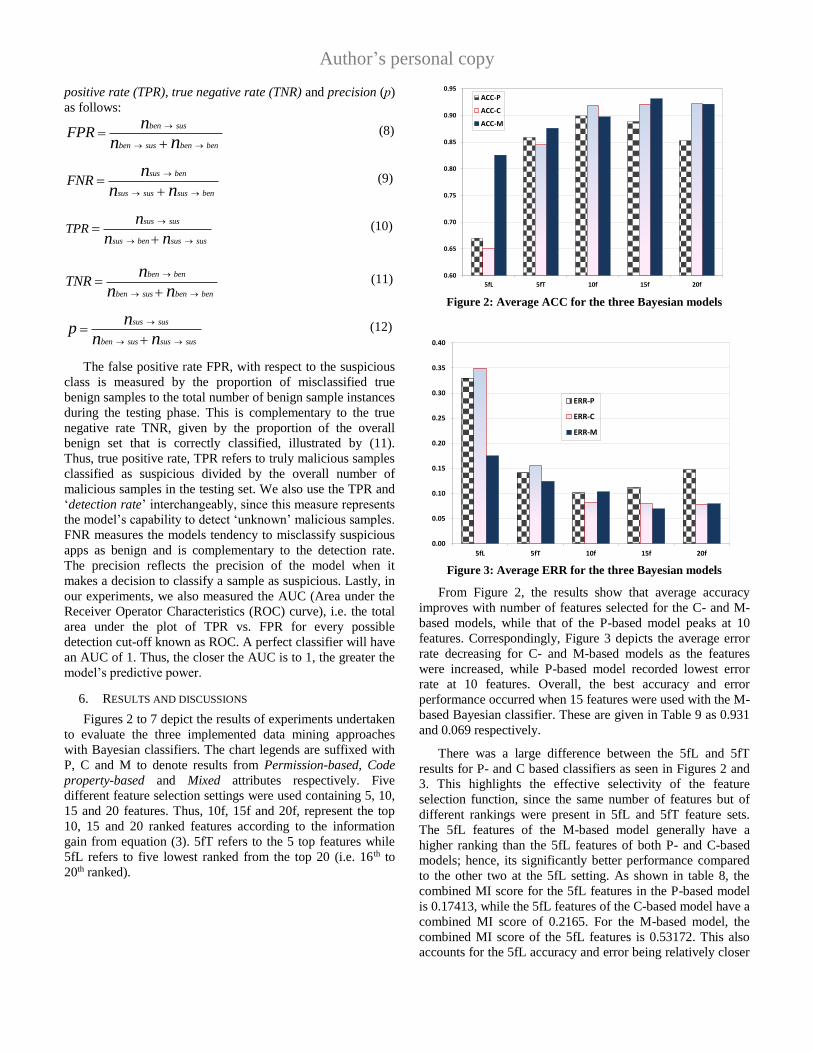
6. RESULTS AND DISCUSSIONS
Figures 2 to 7 depict the results of experiments undertaken
to evaluate the three implemented data mining approaches
with Bayesian classifiers. The chart legends are suffixed with
P, C and M to denote results from Permission-based, Code
property-based and Mixed attributes respectively. Five
different feature selection settings were used containing 5, 10,
15 and 20 features. Thus, 10f, 15f and 20f, represent the top
10, 15 and 20 ranked features according to the information
gain from equation (3). 5fT refers to the 5 top features while
5fL refers to five lowest ranked from the top 20 (i.e. 16th to
20th ranked).
0.60
0.65
0.70
0.75
0.80
0.85
0.90
0.95
5fL 5fT 10f 15f 20f
ACC-P
ACC-C
ACC-M
Figure 2: Average ACC for the three Bayesian models
0.00
0.05
0.10
0.15
0.20
0.25
0.30
0.35
0.40
5fL 5fT 10f 15f 20f
ERR-P
ERR-C
ERR-M
Figure 3: Average ERR for the three Bayesian models
From Figure 2, the results show that average accuracy
improves with number of features selected for the C- and M-
based models, while that of the P-based model peaks at 10
features. Correspondingly, Figure 3 depicts the average error
rate decreasing for C- and M-based models as the features
were increased, while P-based model recorded lowest error
rate at 10 features. Overall, the best accuracy and error
performance occurred when 15 features were used with the M-
based Bayesian classifier. These are given in Table 9 as 0.931
and 0.069 respectively.
There was a large difference between the 5fL and 5fT
results for P- and C based classifiers as seen in Figures 2 and
3. This highlights the effective selectivity of the feature
selection function, since the same number of features but of
different rankings were present in 5fL and 5fT feature sets.
The 5fL features of the M-based model generally have a
higher ranking than the 5fL features of both P- and C-based
models; hence, its significantly better performance compared
to the other two at the 5fL setting. As shown in table 8, the
combined MI score for the 5fL features in the P-based model
is 0.17413, while the 5fL features of the C-based model have a
combined MI score of 0.2165. For the M-based model, the
combined MI score of the 5fL features is 0.53172. This also
accounts for the 5fL accuracy and error being relatively closer
Author’s personal copy
to that of 5fT for the M-based model when compared to the
case with the P- and C-based models.
Table 8. Information gain score comparison for the 5fL
models.
Model P-based
5fL C-based
5fL M-based
5fL
Combined Information gain score
0.17413 0.21650 0.53172
Figures 2 and 3 also show that 15f accuracy/error
performance is better than that of 20f for the M-based model.
The plausible explanation for this can be found in Table 6. We
notice that ACCESS_WIFI_STATE,
RECEIVE_BOOT_COMPLETED, which form part of the 20f
feature set, have a good number of occurrences in the benign
category. The absence of these in the 15f set has the overall
effect of reducing classification error rate. (This also accounts
for the better TNR and FPR results of 15f than 20f for the M-
based in Figures 6 and 7)
0.00
0.10
0.20
0.30
0.40
0.50
0.60
0.70
0.80
0.90
1.00
5fL 5fT 10f 15f 20f
TPR-P
TPR-C
TPR-M
Figure 4: Average TPR for the three models.
0.00
0.10
0.20
0.30
0.40
0.50
0.60
0.70
5fL 5fT 10f 15f 20f
FNR-P
FNR-C
FNR-M
Figure 5: Average FNR for the three models.
Figure 4 depicts the TPR results for the three models with
different feature settings. That is, the average rate of unknown
malware detection by the trained models. The P-based model
has lower detection rate than the M- and C- models at all
feature settings, except at 5fL setting where C-based model is
the lowest. The detection rates are quite similar for the 15f and
20f sets in C-based and M-based models. The actual values
are shown in Table 9.
Overall, the best detection rate and hence lowest false
negative rate were recorded with 15f used in the M-based
model. In the context of our problem of filtering large app
sample collections, a low false negative rate is highly
desirable since this represents the proportion of ‘missed’
malware apps which may subsequently be installed as
‘benign’ apps. On that basis, the models based on M- or C-
based features with the higher features settings should be
preferred over the P-based model.
0.84
0.86
0.88
0.90
0.92
0.94
0.96
0.98
5fL 5fT 10f 15f 20f
TNR-P
TNR-C
TNR-M
Figure 6: Average TNR for the three models.
0.00
0.02
0.04
0.06
0.08
0.10
0.12
5fL 5fT 10f 15f 20f
FPR-P
FPR-C
FPR-M
Figure 7: Average FPR for the three models.
In Figure 6, the average TNR results are illustrated. The
exceptionally good performance shown by the 5fT for the P-
based model can be attributed to ‘sparse feature vectors’ (as a
Author’s personal copy
result of fewer features used in model training) that will occur
in a high proportion of benign samples (and also many of the
malware samples). This leads to classifier bias towards benign
class and hence high TNR; but, on the other hand it also
results in higher FNR as can be seen clearly in Figure 5. Thus,
we can conclude on that basis that M- or C-based models will
still be preferable. Moreover, 5fT P-based model only yields
about 70% detection rate.
Similarly, the exceptionally high FPR with 5fT for C-
based model as seen in Figure 7 can be attributed to classifier
bias due to ‘sparse feature vectors’ resulting from low number
of features used for the model training. Again, from Table 9,
15f used with M-based model (which has the overall best
accuracy/error performance) gave a reasonable low FPR of
0.051.
Table 9. Summary of experimental results for the three
models.
ERR-P ERR-C ERR-M ACC-P ACC-C ACC-M
5fL 0.330 0.350 0.175 0.670 0.650 0.826
5fT 0.142 0.155 0.124 0.859 0.845 0.876
10f 0.101 0.082 0.103 0.899 0.918 0.897
15f 0.112 0.079 0.069 0.889 0.921 0.931
20f 0.147 0.079 0.079 0.853 0.921 0.921
TPR-P TPR-C TPR-M FNR-P FNR-C FNR-M
5fL 0.429 0.335 0.744 0.571 0.665 0.256
5fT 0.701 0.799 0.803 0.299 0.201 0.197
10f 0.844 0.906 0.851 0.156 0.094 0.149
15f 0.843 0.904 0.909 0.157 0.096 0.091
20f 0.774 0.906 0.895 0.226 0.094 0.105
TNR-P TNR-C TNR-M FPR-P FPR-C FPR-M
5fL 0.911 0.954 0.947 0.089 0.046 0.053
5fT 0.968 0.890 0.953 0.032 0.110 0.047
10f 0.954 0.932 0.943 0.046 0.068 0.057
15f 0.934 0.939 0.949 0.066 0.061 0.051
20f 0.932 0.937 0.911 0.068 0.063 0.089
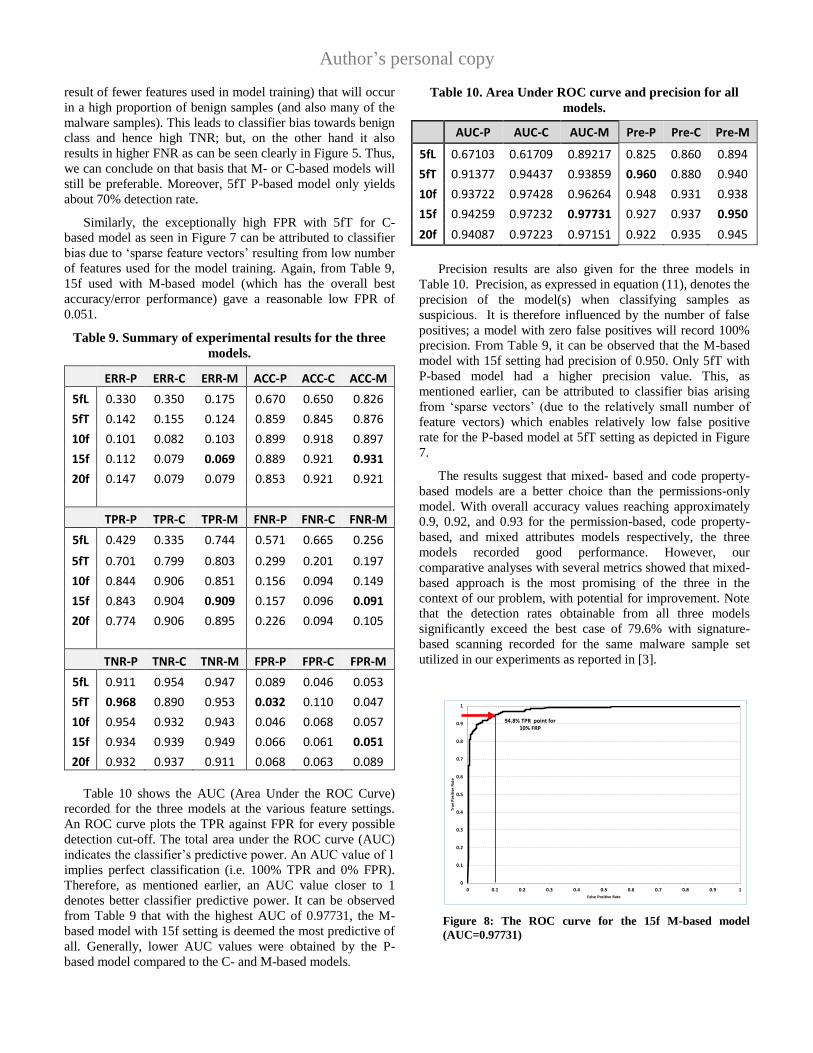
Table 10 shows the AUC (Area Under the ROC Curve)
recorded for the three models at the various feature settings.
An ROC curve plots the TPR against FPR for every possible
detection cut-off. The total area under the ROC curve (AUC)
indicates the classifier’s predictive power. An AUC value of 1
implies perfect classification (i.e. 100% TPR and 0% FPR).
Therefore, as mentioned earlier, an AUC value closer to 1
denotes better classifier predictive power. It can be observed
from Table 9 that with the highest AUC of 0.97731, the M-
based model with 15f setting is deemed the most predictive of
all. Generally, lower AUC values were obtained by the P-
based model compared to the C- and M-based models.
Table 10. Area Under ROC curve and precision for all
models.
AUC-P AUC-C AUC-M Pre-P Pre-C Pre-M
5fL 0.67103 0.61709 0.89217 0.825 0.860 0.894
5fT 0.91377 0.94437 0.93859 0.960 0.880 0.940
10f 0.93722 0.97428 0.96264 0.948 0.931 0.938
15f 0.94259 0.97232 0.97731 0.927 0.937 0.950
20f 0.94087 0.97223 0.97151 0.922 0.935 0.945
Precision results are also given for the three models in
Table 10. Precision, as expressed in equation (11), denotes the
precision of the model(s) when classifying samples as
suspicious. It is therefore influenced by the number of false
positives; a model with zero false positives will record 100%
precision. From Table 9, it can be observed that the M-based
model with 15f setting had precision of 0.950. Only 5fT with
P-based model had a higher precision value. This, as
mentioned earlier, can be attributed to classifier bias arising
from ‘sparse vectors’ (due to the relatively small number of
feature vectors) which enables relatively low false positive
rate for the P-based model at 5fT setting as depicted in Figure
7.
The results suggest that mixed- based and code property-
based models are a better choice than the permissions-only
model. With overall accuracy values reaching approximately
0.9, 0.92, and 0.93 for the permission-based, code property-
based, and mixed attributes models respectively, the three
models recorded good performance. However, our
comparative analyses with several metrics showed that mixed-
based approach is the most promising of the three in the
context of our problem, with potential for improvement. Note
that the detection rates obtainable from all three models
significantly exceed the best case of 79.6% with signature-
based scanning recorded for the same malware sample set
utilized in our experiments as reported in [3].
0
0.1
0.2
0.3
0.4
0.5
0.6
0.7
0.8
0.9
1
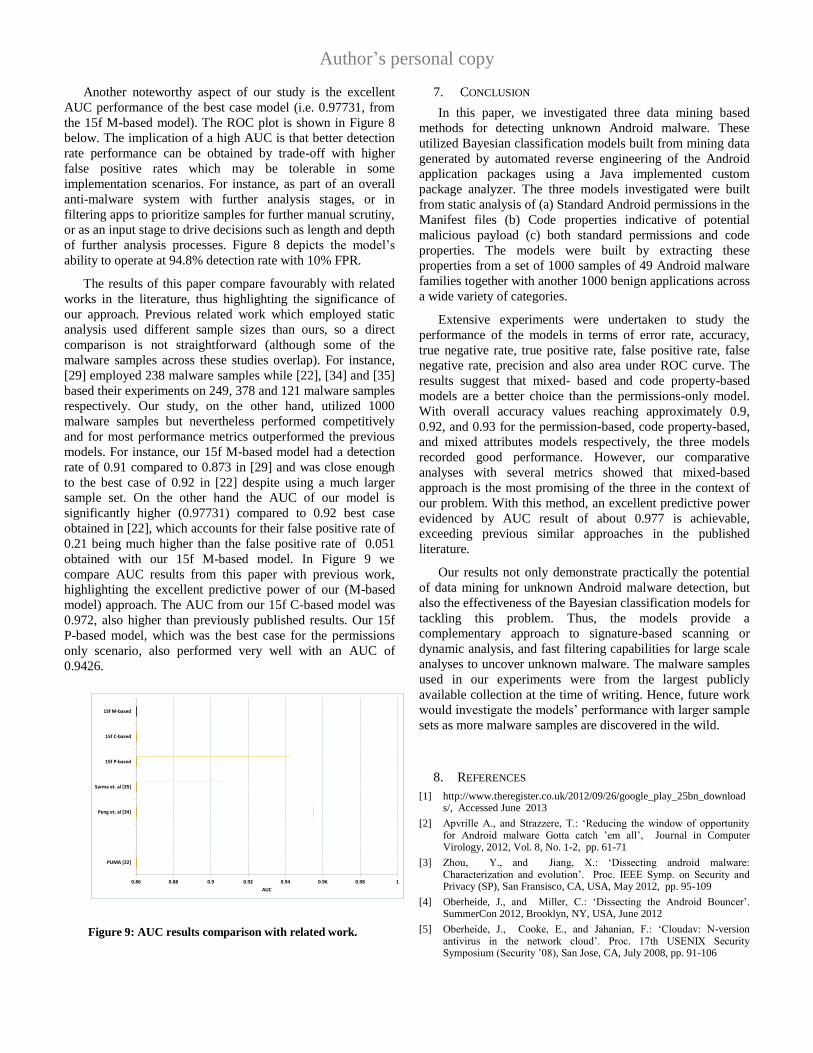
0 0.1 0.2 0.3 0.4 0.5 0.6 0.7 0.8 0.9 1
Tru
e P
osi
tive
Rat
e
False Positive Rate
94.8% TPR point for 10% FRP
Figure 8: The ROC curve for the 15f M-based model
(AUC=0.97731)
Author’s personal copy
Another noteworthy aspect of our study is the excellent
AUC performance of the best case model (i.e. 0.97731, from
the 15f M-based model). The ROC plot is shown in Figure 8
below. The implication of a high AUC is that better detection
rate performance can be obtained by trade-off with higher
false positive rates which may be tolerable in some
implementation scenarios. For instance, as part of an overall
anti-malware system with further analysis stages, or in
filtering apps to prioritize samples for further manual scrutiny,
or as an input stage to drive decisions such as length and depth
of further analysis processes. Figure 8 depicts the model’s
ability to operate at 94.8% detection rate with 10% FPR.
The results of this paper compare favourably with related
works in the literature, thus highlighting the significance of
our approach. Previous related work which employed static
analysis used different sample sizes than ours, so a direct
comparison is not straightforward (although some of the
malware samples across these studies overlap). For instance,
[29] employed 238 malware samples while [22], [34] and [35]
based their experiments on 249, 378 and 121 malware samples
respectively. Our study, on the other hand, utilized 1000
malware samples but nevertheless performed competitively
and for most performance metrics outperformed the previous
models. For instance, our 15f M-based model had a detection
rate of 0.91 compared to 0.873 in [29] and was close enough
to the best case of 0.92 in [22] despite using a much larger
sample set. On the other hand the AUC of our model is
significantly higher (0.97731) compared to 0.92 best case
obtained in [22], which accounts for their false positive rate of
0.21 being much higher than the false positive rate of 0.051
obtained with our 15f M-based model. In Figure 9 we
compare AUC results from this paper with previous work,
highlighting the excellent predictive power of our (M-based
model) approach. The AUC from our 15f C-based model was
0.972, also higher than previously published results. Our 15f
P-based model, which was the best case for the permissions
only scenario, also performed very well with an AUC of
0.9426.
0.86 0.88 0.9 0.92 0.94 0.96 0.98 1
PUMA [22]
Peng et. al [34]
Sarma et. al [35]
15f P-based
15f C-based
15f M-based
AUC
Figure 9: AUC results comparison with related work.
7. CONCLUSION
In this paper, we investigated three data mining based
methods for detecting unknown Android malware. These
utilized Bayesian classification models built from mining data
generated by automated reverse engineering of the Android
application packages using a Java implemented custom
package analyzer. The three models investigated were built
from static analysis of (a) Standard Android permissions in the
Manifest files (b) Code properties indicative of potential
malicious payload (c) both standard permissions and code
properties. The models were built by extracting these
properties from a set of 1000 samples of 49 Android malware
families together with another 1000 benign applications across
a wide variety of categories.
Extensive experiments were undertaken to study the
performance of the models in terms of error rate, accuracy,
true negative rate, true positive rate, false positive rate, false
negative rate, precision and also area under ROC curve. The
results suggest that mixed- based and code property-based
models are a better choice than the permissions-only model.
With overall accuracy values reaching approximately 0.9,
0.92, and 0.93 for the permission-based, code property-based,
and mixed attributes models respectively, the three models
recorded good performance. However, our comparative
analyses with several metrics showed that mixed-based
approach is the most promising of the three in the context of
our problem. With this method, an excellent predictive power
evidenced by AUC result of about 0.977 is achievable,
exceeding previous similar approaches in the published
literature.
Our results not only demonstrate practically the potential
of data mining for unknown Android malware detection, but
also the effectiveness of the Bayesian classification models for
tackling this problem. Thus, the models provide a
complementary approach to signature-based scanning or
dynamic analysis, and fast filtering capabilities for large scale
analyses to uncover unknown malware. The malware samples
used in our experiments were from the largest publicly
available collection at the time of writing. Hence, future work
would investigate the models’ performance with larger sample
sets as more malware samples are discovered in the wild.
8. REFERENCES
[1] http://www.theregister.co.uk/2012/09/26/google_play_25bn_downloads/, Accessed June 2013
[2] Apvrille A., and Strazzere, T.: ‘Reducing the window of opportunity for Android malware Gotta catch ’em all’, Journal in Computer Virology, 2012, Vol. 8, No. 1-2, pp. 61-71
[3] Zhou, Y., and Jiang, X.: ‘Dissecting android malware: Characterization and evolution’. Proc. IEEE Symp. on Security and Privacy (SP), San Fransisco, CA, USA, May 2012, pp. 95-109
[4] Oberheide, J., and Miller, C.: ‘Dissecting the Android Bouncer’. SummerCon 2012, Brooklyn, NY, USA, June 2012
[5] Oberheide, J., Cooke, E., and Jahanian, F.: ‘Cloudav: N-version antivirus in the network cloud’. Proc. 17th USENIX Security Symposium (Security ’08), San Jose, CA, July 2008, pp. 91-106
Author’s personal copy
[6] Grace, M. , Zhou, Y., Zhang, Q., Zou, S., and Jiang. X.: ‘RiskRanker: scalable and accurate zero-day android malware detection’. Proc. 10th Int. Conf. on Mobile Systems, Applications, and Services (MobiSys '12) ACM, Low Wood Bay, Lake District, UK, June 2012, pp. 281-294
[7] Bose, A., Hu, X., Shin, K. G., and Park, T.: ‘Behavioral detection of malware on mobile handsets’. Proc. 6th Intl. Conf. on Mobile Systems, Applications and Services (MobiSys '08) ACM, Breckenridge, CO, USA, June 2008, pp. 225-238
[8] Burguera, I., Zurutuza, U., and Nadjm-Tehrani, S.: ‘Crowdroid: behavior-based malware detection system for Android’. Proc. 1st ACM Workshop on Security and Privacy in Smartphones and Mobile devices (SPSM ’11), New York, NY, USA, , 2011, pp. 15–26
[9] Schmidt, A. –D., Peters, F., Lamour, F., and Albayrak, S.: ‘Monitoring smartphones for anomaly detection’. Proc. Int. Conf. on Mobile Wireless Middleware, Operating Systems, and Applications (MOBILWARE 2008), Innsbruck, Austria, February 2008
[10] Chin, E., Felt, A. P., Greenwood, K., and Wagner, D.: ‘ Analyzing inter-application communication in Android’. Proc. 9th Int. Conf. on Mobile Systems, Applications, and Services (MobiSys '11). ACM, Washington, DC, USA, June 2011, pp. 239-252
[11] Chan, P. P.F., Hui, L. C.K., and Yiu. S. M.: ‘DroidChecker: analyzing android applications for capability leak’. Proc. fifth ACM Conf. on Security and Privacy in Wirelessand Mobile Networks (WISEC '12), Tucson, AZ, USA, April 2012, pp. 125-136
[12] Wei, X., Gomez, L., Neamtiu, I., and Faloutsos. M.: ‘ProfileDroid: multi-layer profiling of android applications’ Proc. 18th Int. Conf. on Mobile Computing and Networking (Mobicom '12). ACM, Istanbul, Turkey, August 2012, pp. 137-148
[13] Batyuk, L., Herpich, M., Camtepe, S. A., Raddatz, K., Schmidt, A., Albayrak, S.: ‘Using Static Analysis for Automatic Assessment and Mitigation of Unwanted and Malicious Activities Within Android Applications’. 6th Int. Conf. on Malicious and Unwanted Software (MALWARE 2011), Fajardo, PR, USA, October 2011, pp. 66-72
[14] Kim, J., Yoon, Y., Yi, K., and Shin, J.: ‘SCANDAL: Static Analyzer for Detecting Privacy Leaks in Android Applications’. Mobile Security Technologies, MoST 2012, San Francisco, May 2012
[15] Gibler, C., Crussell, J., Erickson, J., and Chen, H.: ‘AndroidLeaks: Automatically Detecting Potential Privacy Leaks in Android Applications on a Large Scale’. Proc. 5th Int. Conf. on Trust and Trustworthy Computing (TRUST 2012), Vienna, Austria, June 2012, pp. 291-307
[16] Mann, C., and Starostin, A.: ‘A framework for static detection of privacy leaks in android applications’. Proc. 27th Annual ACM Symposium on Applied Computing (SAC '12), Trento, Italy, March 2012, pp. 1457-1462
[17] Blasing, T., Batyuk, L. , Schmidt, A.-D., Camtepe, S. A., Albayrak S.: ‘An Android Application Sandbox system for suspicious software detection’. 5th Int. Conf. on Malicious and Unwanted Software (MALWARE 2010), Nancy, France, Oct. 2010, p.55-62
[18] Schmidt, A.-D., Bye, R., Schmidt, H.-G., Clausen, J., Kiraz, O., Yuksel, K. A., Camtepe, S. A., Albayrak, S.: ‘Static Analysis of Executables for Collaborative Malware Detection on Android’. IEEE International Conference on Communications, (ICC '09), Dresden, Germany, June 2009, pp.1-5
[19] Schultz, M. G., Eskin, E., Zadok, E., and Stolfo, S. J.: ‘Data mining methods for detection of new malicious executables’. Proc. 2001 IEEE
Symposium on Security and Privacy, (SP ’01), Oakland, CA, USA, May 2001, pp. 38-49
[20] Wang, T-Y., Wu, C-H. , Hsieh, C-C.: ‘A virus prevention model based on static analysis and data mining methods’. Proc. IEEE 8th Int. Conf. on Computer and Information Technology Workshops, Sydney, July 2008, pp. 288-293
[21] Sahs J., and Khan L.: ‘A Machine Learning Approach to Android Malware Detection’. Proc. of European Intelligence and Security Informatics Conference, Odense, Denmark, August 2012, pp. 141-147
[22] Sanz, B., Santos, I., Laorden, C., Ugarte-Pedro, X., Bringas, P. G., Alvarez G.: ‘PUMA: Permission Usage to Detect Malware in Android’. International Joint Conference CISIS’12-ICEUTE´12-SOCO´12 Special Sessions, in Advances in Intelligent Systems and Computing, Volume 189, pp. 289-298
[23] Android Application Fundamentals. http:// developer.android.com/guide/components/fundamentals.html, Accessed June 2013
[24] Baksmali. http://code.google.com/p/smali, Accesed June 2013
[25] Muttik, I.: ‘Malware Mining’. Proc. 21st Virus Bulletin International Conference, VB2011, 5-7 Oct. 2011, Barcelona,Spain.
[26] Cover, T. M., and Thomas, J. A.: Elements of Information Theory, (John Wiley & Sons Inc., 1991).
[27] Enck, W., Ongtang M., and McDaniel, P.: ‘On Lightweight Mobile Phone Application Certification’. Proc. of the 16th ACM Conference on Computer and Communications Security (CCS ‘09), Chicago, IL, USA, November 2009, pp. 235-245
[28] Santos, I., Brezo, F., Sanz B., Laorden, C., Bringas. P.G.: ‘Using opcode sequences in single-class learning to detect unknown malware’, IET inf. Secur., 2011, Vol. 5, Iss. 4, pp. 220-227
[29] Dong-Jie, W., Ching-Hao, M., Te-En, W., Hahn-Ming, L., and Kuo-Ping, W.: ‘DroidMat: Android malware detection through manifest and API calls tracing’, Proc. Seventh Asia Joint Conference on Information Security (Asia JCIS), 2012, pp. 62-69
[30] Contagio mobile. http://contagiominidump.blogspot.com/, Accessed June 2013
[31] Andoid Malware Genome Project: http://www.malgenomeproject.org/, Accesed June 2013
[32] Castillo, Carlos A. : ‘Android Malware Past, Present, and Future’. McAfee White Paper, 2011, Accesed June 2013 http://www.mcafee.com/us/resources/white-papers/wp-android-malware-past-present-future.pdf
[33] Strazzere, T: ‘LeNa Technical Tear Down’, Accessed June 2013, https://blog.lookout.com/wp-content/uploads/2011/10/LeNa-Legacy-Native-Teardown_Lookout-Mobile-Security1.pdf
[34] Peng, H., Gates, C., Sarma, B., Li, N., Qi, A., Potharaju, R., Nita-Rotaru, C., and Molloy, I.: ’Using Probabilistic Generative Models for Ranking Risks of Android Apps’. Proc. of the 19th ACM Conference on Computer and Communications Security (CCS 2012), Raleigh, NC, USA, Oct. 2012, pp. 241-252
[35] Sarma, B., Gates, C., Li, N., Potharaju, R., Nita-Rotaru, C., Molloy. I.: ‘Android Permissions: A Perspective Combining Risks and Benefits’. Proc. 17th ACM Symposium on Access Control Models and Technologies, (SACMAT ’12), June 2012, pp. 13-22
Recommended