社内勉強会資料
Apache Hadoop YARN: Moving beyond MapReduce and Batch Processing with
Apache Hadoop 2
輪読会
第6章
Apache Hadoop YARN Administration
大槌 剛彦 (@ohtsuchi)
1
第6章の内容
1. Script-based Configuration – configure-hadoop2.sh の使い方
2. Nagios
– ResourceManager の監視例
– NRPE でリモートホストの監視例
– JVM の監視例
3. Ganglia
– 載っているが少しだけ…
4. Administration with Ambari – 画面の説明
5. JVM Analysis
– jmap, jhat
6. Basic YARN Administration – 設定値
• それほど詳しい事は書いてない…
2
pdsh, pdcp (第5章の復習)
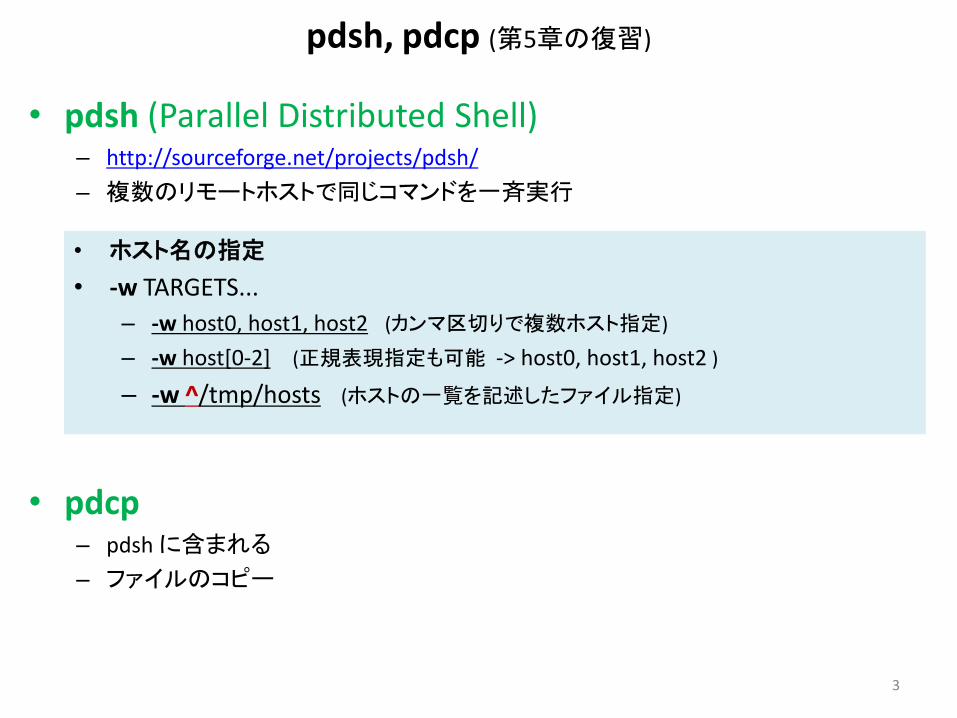
• pdsh (Parallel Distributed Shell) – http://sourceforge.net/projects/pdsh/
– 複数のリモートホストで同じコマンドを一斉実行
• pdcp – pdsh に含まれる
– ファイルのコピー
• ホスト名の指定
• -w TARGETS...
– -w host0, host1, host2 (カンマ区切りで複数ホスト指定)
– -w host[0-2] (正規表現指定も可能 -> host0, host1, host2 )
– -w ^/tmp/hosts (ホストの一覧を記述したファイル指定)
3
Script-based Configuration (1)
4
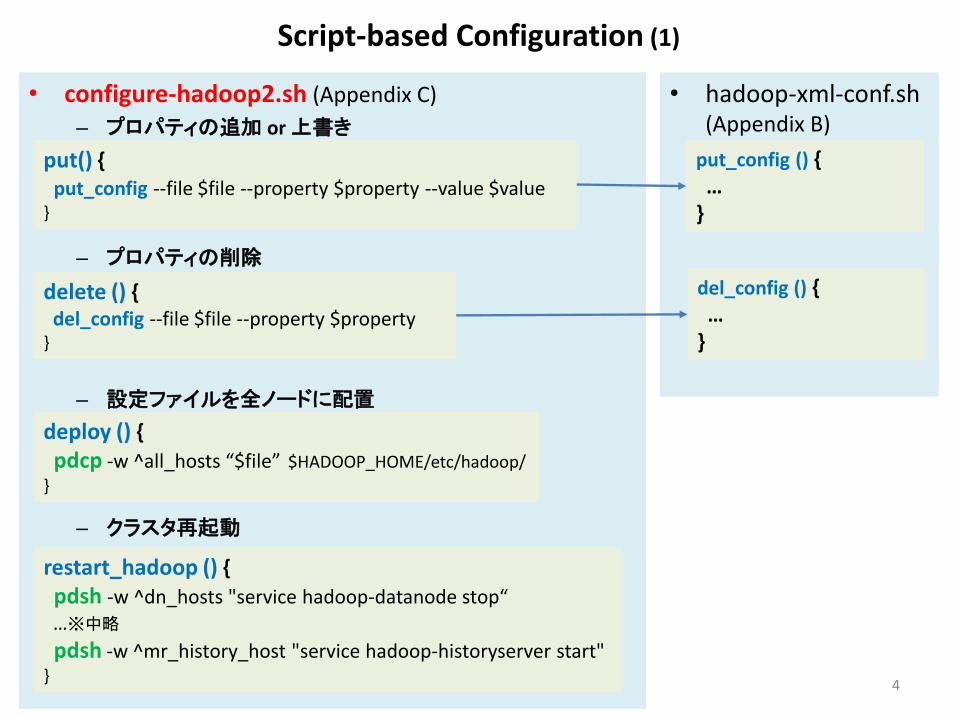
• configure-hadoop2.sh (Appendix C)
– プロパティの追加 or 上書き
– プロパティの削除
– 設定ファイルを全ノードに配置
– クラスタ再起動
• hadoop-xml-conf.sh (Appendix B)
put() { put_config --file $file --property $property --value $value }
put_config () { … }
delete () { del_config --file $file --property $property }
del_config () { … }
deploy () {
pdcp -w ^all_hosts “$file” $HADOOP_HOME/etc/hadoop/
}
restart_hadoop () {
pdsh -w ^dn_hosts "service hadoop-datanode stop“ …※中略
pdsh -w ^mr_history_host "service hadoop-historyserver start" }
Script-based Configuration (2)
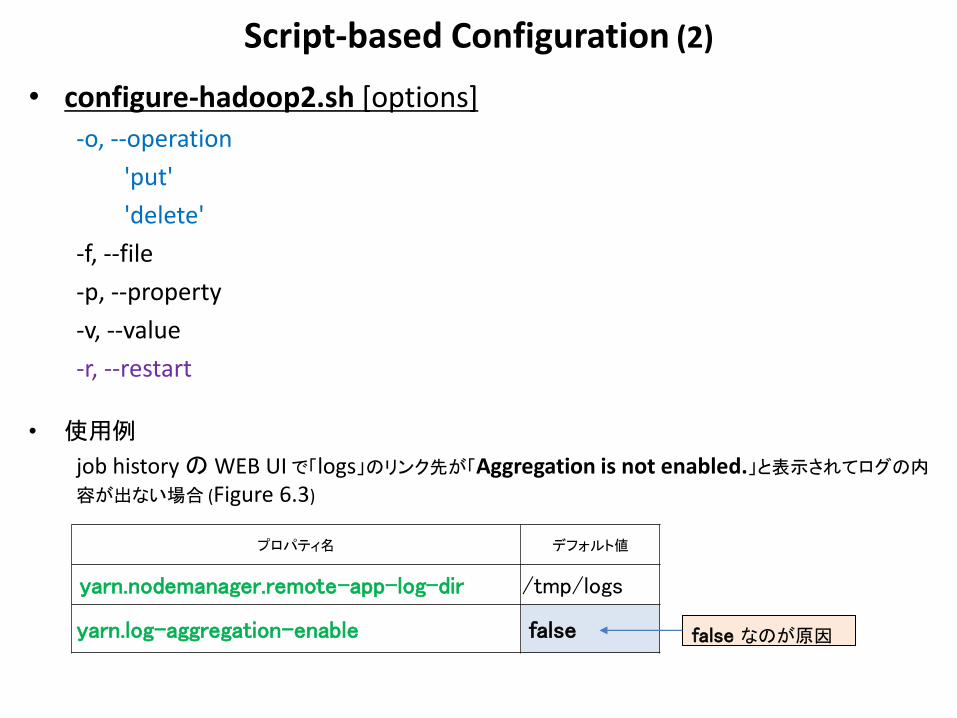
• configure-hadoop2.sh [options] -o, --operation
'put'
'delete'
-f, --file
-p, --property
-v, --value
-r, --restart
• 使用例
job history の WEB UI で「logs」のリンク先が「Aggregation is not enabled.」と表示されてログの内容が出ない場合 (Figure 6.3)
プロパティ名 デフォルト値
yarn.nodemanager.remote-app-log-dir /tmp/logs
yarn.log-aggregation-enable false false なのが原因
Script-based Configuration (3)
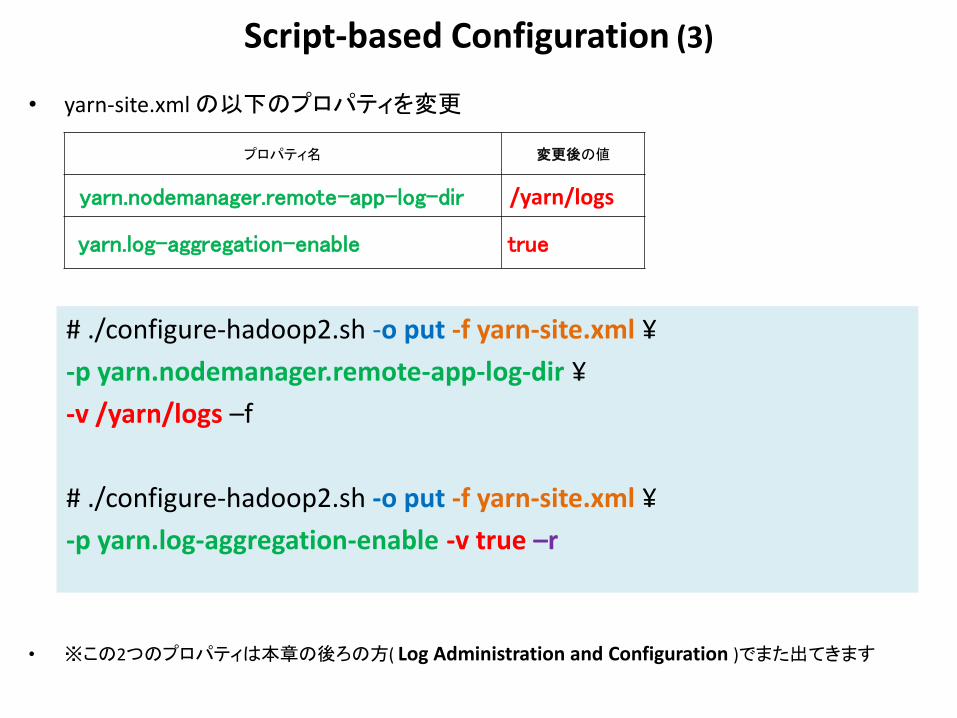
• yarn-site.xml の以下のプロパティを変更
• ※この2つのプロパティは本章の後ろの方( Log Administration and Configuration )でまた出てきます
プロパティ名 変更後の値
yarn.nodemanager.remote-app-log-dir /yarn/logs
yarn.log-aggregation-enable true
# ./configure-hadoop2.sh -o put -f yarn-site.xml ¥
-p yarn.nodemanager.remote-app-log-dir ¥
-v /yarn/logs –f
# ./configure-hadoop2.sh -o put -f yarn-site.xml ¥
-p yarn.log-aggregation-enable -v true –r
Monitoring Cluster Health: Nagios (1)
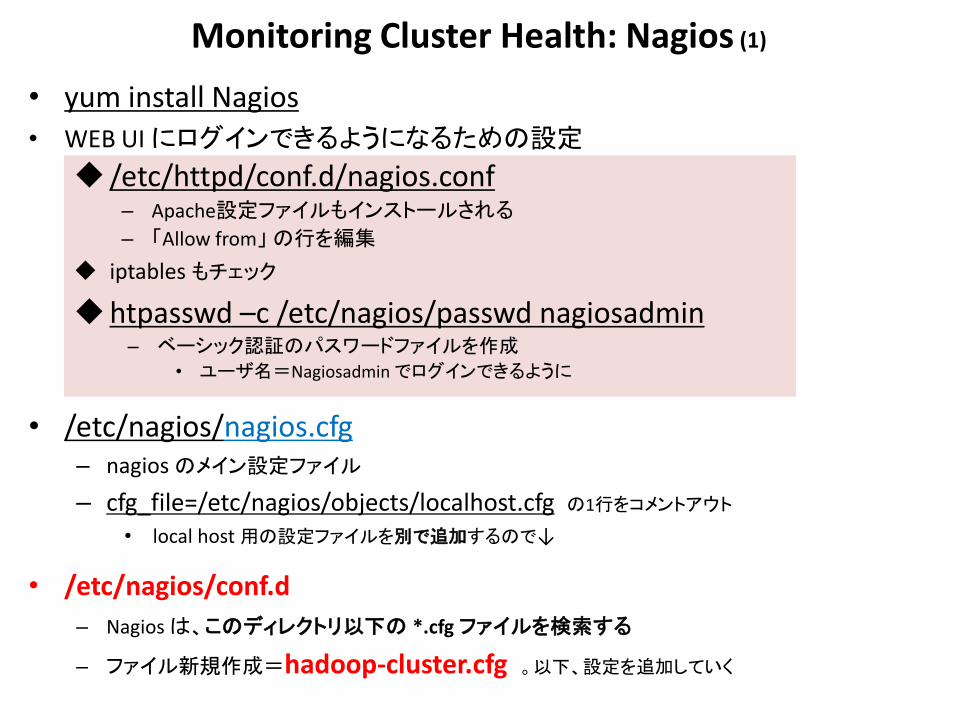
• yum install Nagios
• WEB UI にログインできるようになるための設定
• /etc/nagios/nagios.cfg – nagios のメイン設定ファイル
– cfg_file=/etc/nagios/objects/localhost.cfg の1行をコメントアウト
• local host 用の設定ファイルを別で追加するので↓
• /etc/nagios/conf.d
– Nagios は、このディレクトリ以下の *.cfg ファイルを検索する
– ファイル新規作成=hadoop-cluster.cfg 。以下、設定を追加していく
/etc/httpd/conf.d/nagios.conf – Apache設定ファイルもインストールされる
– 「Allow from」 の行を編集
iptables もチェック
htpasswd –c /etc/nagios/passwd nagiosadmin – ベーシック認証のパスワードファイルを作成
• ユーザ名=Nagiosadmin でログインできるように
Monitoring Cluster Health: Nagios (2)
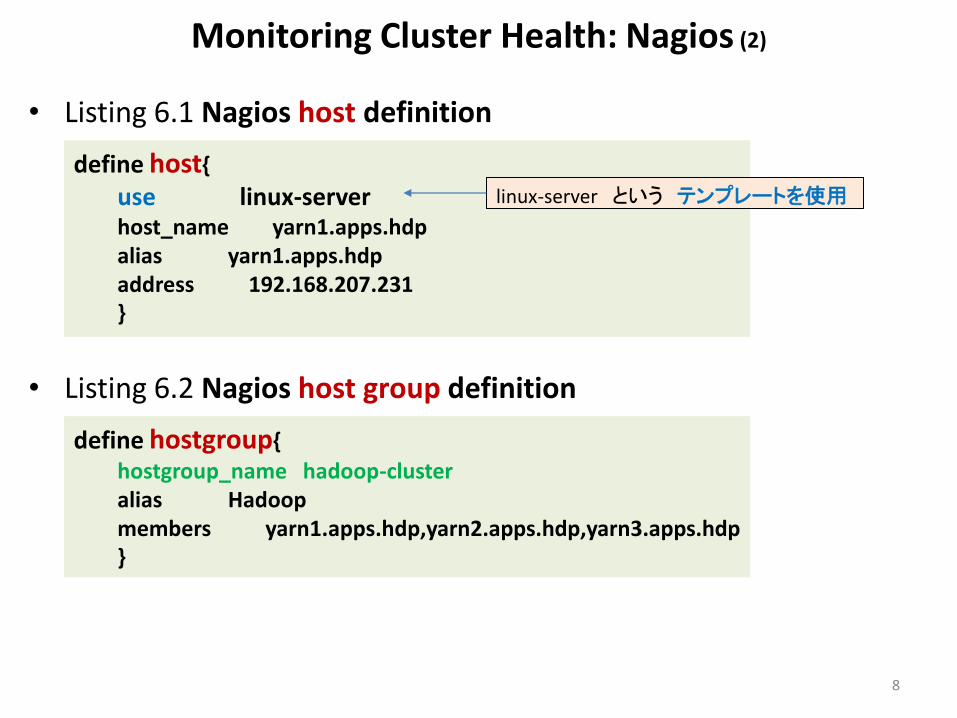
• Listing 6.1 Nagios host definition
• Listing 6.2 Nagios host group definition
8
define host{
use linux-server host_name yarn1.apps.hdp alias yarn1.apps.hdp address 192.168.207.231 }
linux-server という テンプレートを使用
define hostgroup{
hostgroup_name hadoop-cluster alias Hadoop members yarn1.apps.hdp,yarn2.apps.hdp,yarn3.apps.hdp }
Monitoring Basic Hadoop Services : Nagios (1)
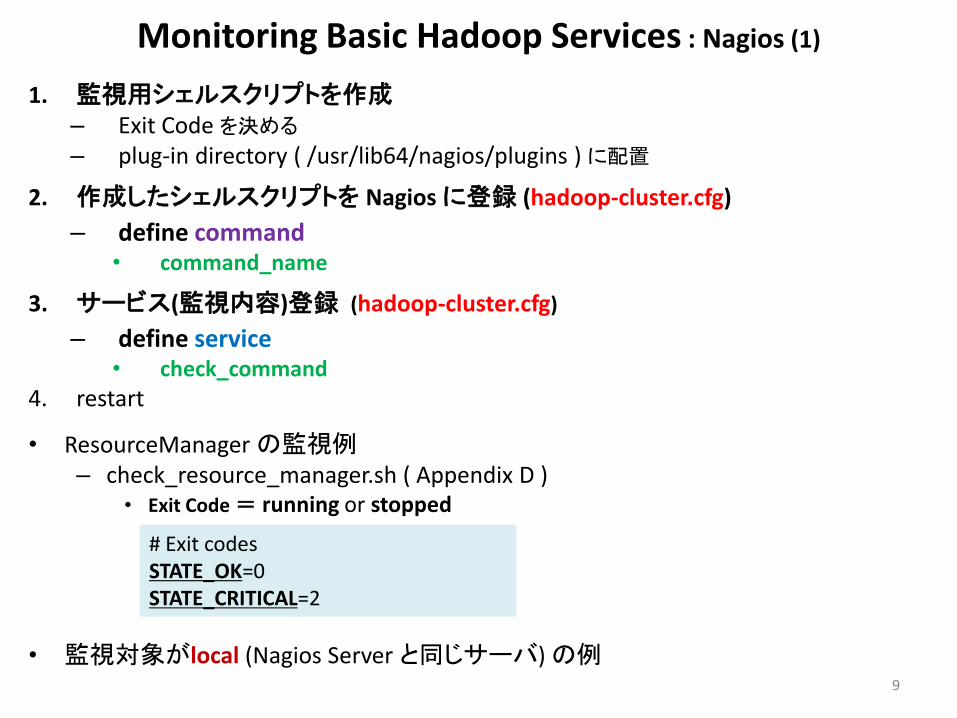
1. 監視用シェルスクリプトを作成 – Exit Code を決める
– plug-in directory ( /usr/lib64/nagios/plugins ) に配置
2. 作成したシェルスクリプトを Nagios に登録 (hadoop-cluster.cfg)
– define command • command_name
3. サービス(監視内容)登録 (hadoop-cluster.cfg)
– define service • check_command
4. restart
• ResourceManager の監視例 – check_resource_manager.sh ( Appendix D )
• Exit Code = running or stopped
• 監視対象がlocal (Nagios Server と同じサーバ) の例
9
# Exit codes STATE_OK=0 STATE_CRITICAL=2
Monitoring Basic Hadoop Services : Nagios (2)
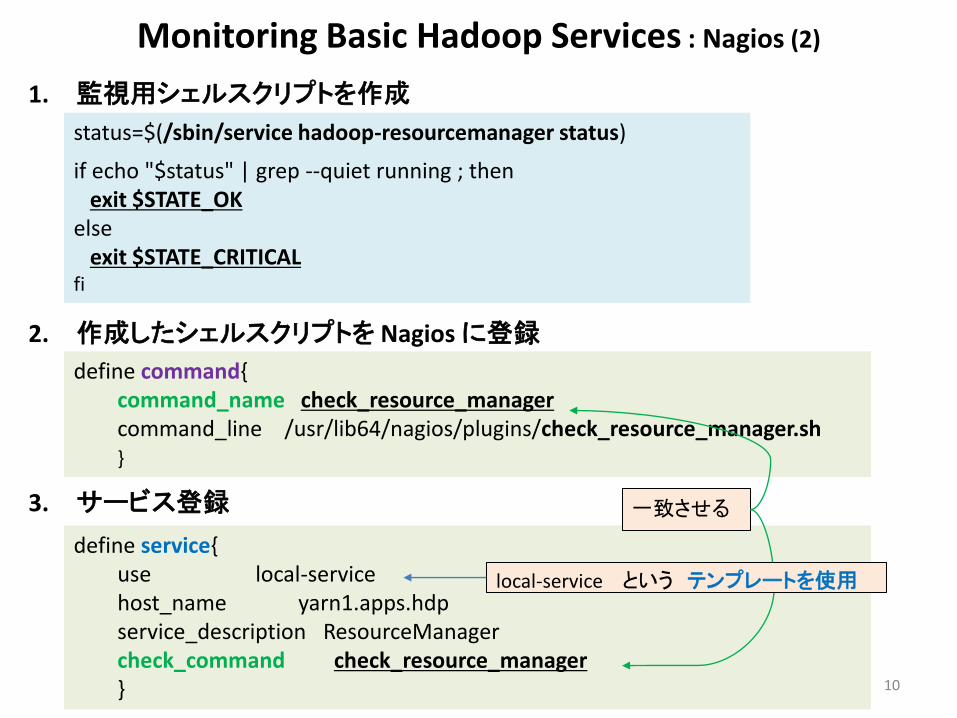
1. 監視用シェルスクリプトを作成
2. 作成したシェルスクリプトを Nagios に登録
3. サービス登録
10
status=$(/sbin/service hadoop-resourcemanager status)
if echo "$status" | grep --quiet running ; then exit $STATE_OK else exit $STATE_CRITICAL fi
define command{ command_name check_resource_manager command_line /usr/lib64/nagios/plugins/check_resource_manager.sh }
define service{ use local-service host_name yarn1.apps.hdp service_description ResourceManager check_command check_resource_manager }
一致させる
local-service という テンプレートを使用
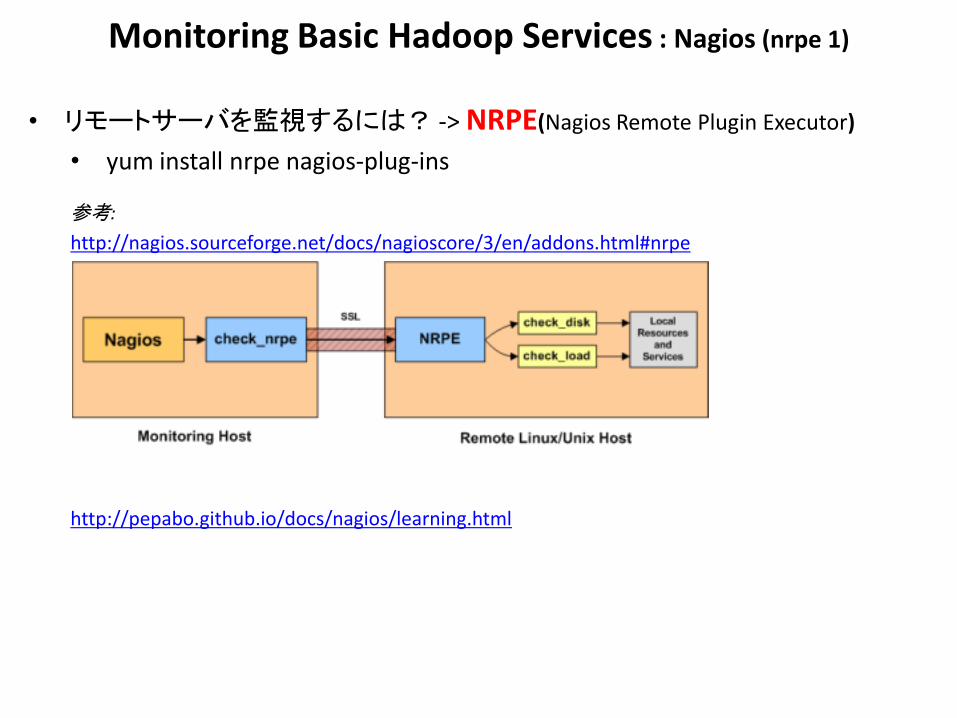
Monitoring Basic Hadoop Services : Nagios (nrpe 1)
• リモートサーバを監視するには? -> NRPE(Nagios Remote Plugin Executor)
• yum install nrpe nagios-plug-ins
参考:
http://nagios.sourceforge.net/docs/nagioscore/3/en/addons.html#nrpe
http://pepabo.github.io/docs/nagios/learning.html
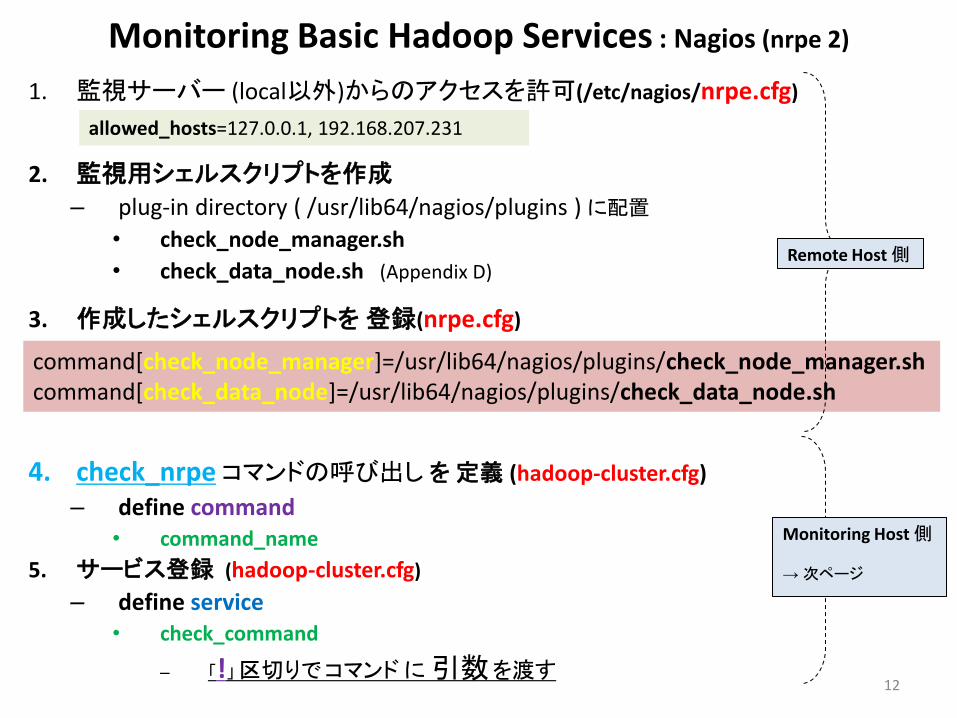
Monitoring Basic Hadoop Services : Nagios (nrpe 2)
1. 監視サーバー (local以外)からのアクセスを許可(/etc/nagios/nrpe.cfg)
2. 監視用シェルスクリプトを作成
– plug-in directory ( /usr/lib64/nagios/plugins ) に配置
• check_node_manager.sh
• check_data_node.sh (Appendix D)
3. 作成したシェルスクリプトを 登録(nrpe.cfg)
4. check_nrpe コマンドの呼び出し を 定義 (hadoop-cluster.cfg)
– define command • command_name
5. サービス登録 (hadoop-cluster.cfg)
– define service • check_command
– 「!」 区切りで コマンド に 引数 を渡す
12
allowed_hosts=127.0.0.1, 192.168.207.231
command[check_node_manager]=/usr/lib64/nagios/plugins/check_node_manager.sh command[check_data_node]=/usr/lib64/nagios/plugins/check_data_node.sh
Remote Host 側
Monitoring Host 側
→ 次ページ
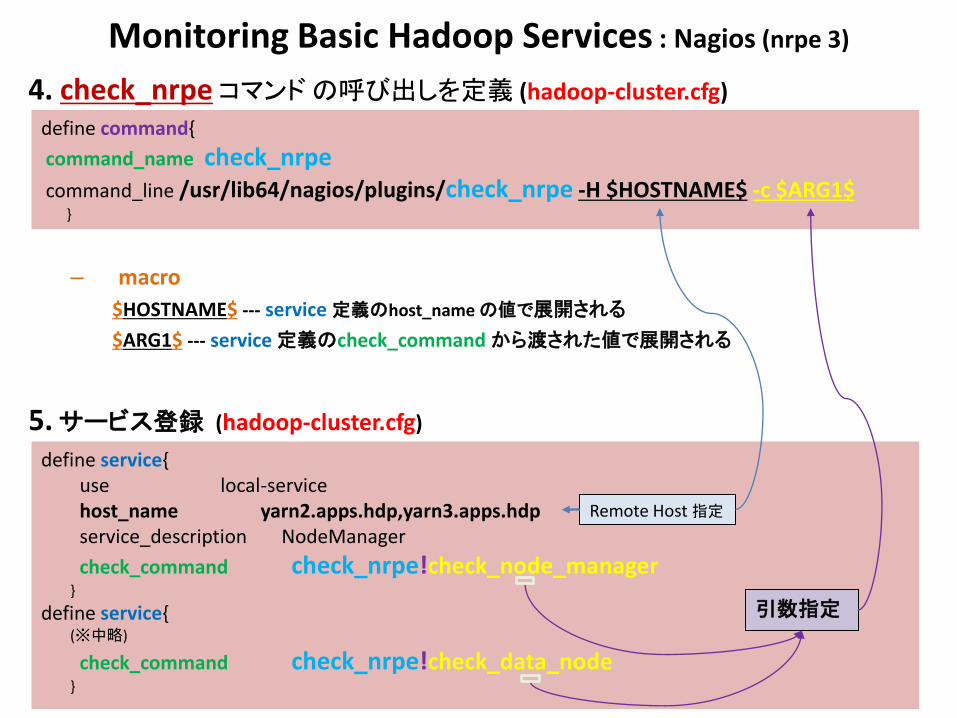
Monitoring Basic Hadoop Services : Nagios (nrpe 3)
4. check_nrpe コマンド の呼び出しを定義 (hadoop-cluster.cfg)
– macro
$HOSTNAME$ --- service 定義のhost_name の値で展開される
$ARG1$ --- service 定義のcheck_command から渡された値で展開される
5. サービス登録 (hadoop-cluster.cfg)
13
define command{
command_name check_nrpe command_line /usr/lib64/nagios/plugins/check_nrpe -H $HOSTNAME$ -c $ARG1$ }
define service{ use local-service host_name yarn2.apps.hdp,yarn3.apps.hdp service_description NodeManager
check_command check_nrpe!check_node_manager }
define service{ (※中略)
check_command check_nrpe!check_data_node }
引数指定
Remote Host 指定
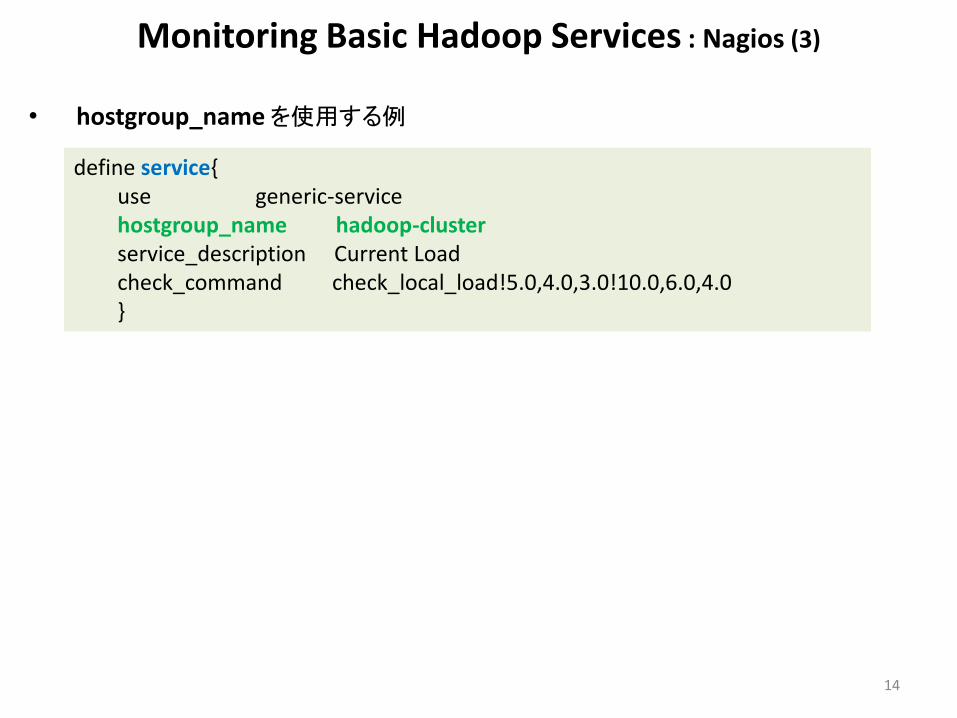
Monitoring Basic Hadoop Services : Nagios (3)
• hostgroup_name を使用する例
14
define service{ use generic-service hostgroup_name hadoop-cluster service_description Current Load check_command check_local_load!5.0,4.0,3.0!10.0,6.0,4.0 }
Monitoring Basic Hadoop Services : Nagios
(Monitoring the JVM 1)
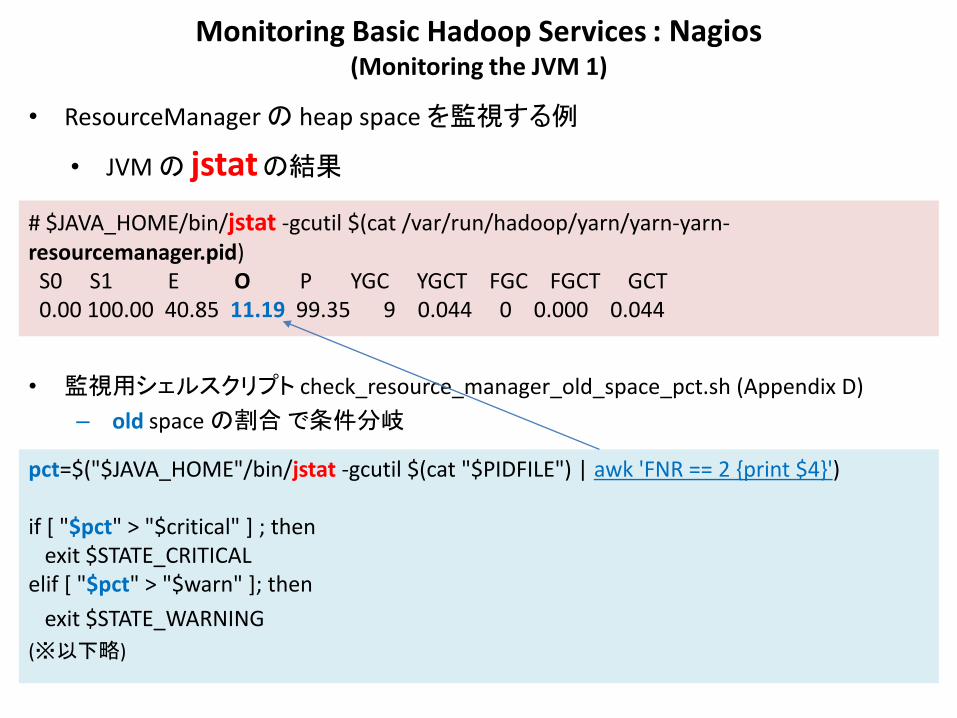
• ResourceManager の heap space を監視する例
• JVM の jstat の結果
• 監視用シェルスクリプト check_resource_manager_old_space_pct.sh (Appendix D)
– old space の割合 で条件分岐
# $JAVA_HOME/bin/jstat -gcutil $(cat /var/run/hadoop/yarn/yarn-yarn-resourcemanager.pid) S0 S1 E O P YGC YGCT FGC FGCT GCT 0.00 100.00 40.85 11.19 99.35 9 0.044 0 0.000 0.044
pct=$("$JAVA_HOME"/bin/jstat -gcutil $(cat "$PIDFILE") | awk 'FNR == 2 {print $4}') if [ "$pct" > "$critical" ] ; then exit $STATE_CRITICAL elif [ "$pct" > "$warn" ]; then
exit $STATE_WARNING
(※以下略)
Monitoring Basic Hadoop Services : Nagios (Monitoring the JVM 2)
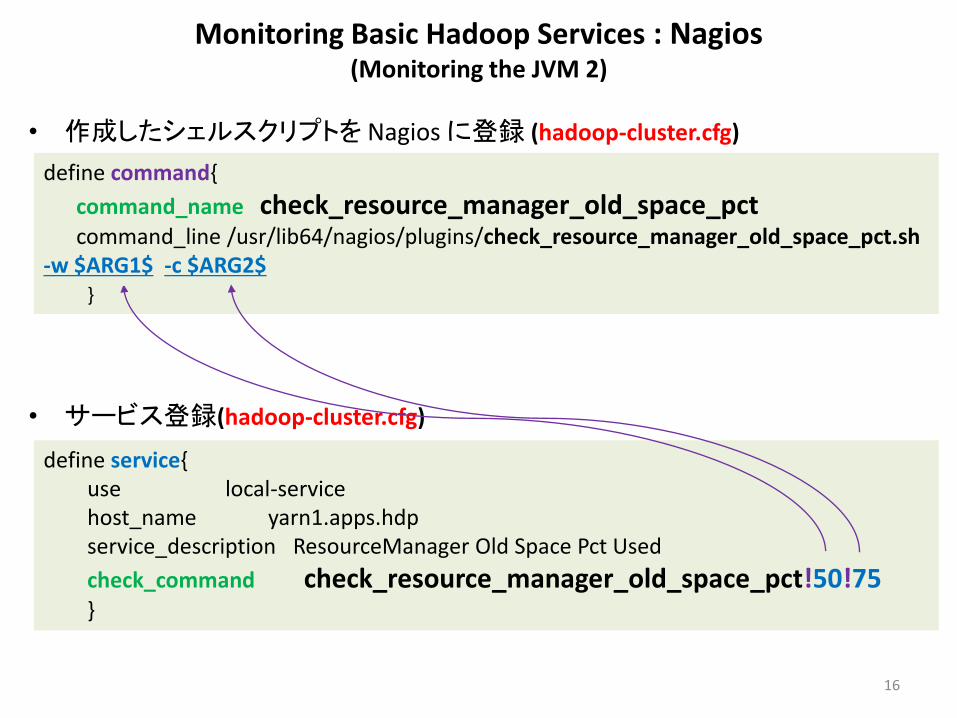
• 作成したシェルスクリプトを Nagios に登録 (hadoop-cluster.cfg)
• サービス登録(hadoop-cluster.cfg)
16
define command{
command_name check_resource_manager_old_space_pct command_line /usr/lib64/nagios/plugins/check_resource_manager_old_space_pct.sh -w $ARG1$ -c $ARG2$ }
define service{ use local-service host_name yarn1.apps.hdp service_description ResourceManager Old Space Pct Used
check_command check_resource_manager_old_space_pct!50!75 }
Real-time Monitoring: Ganglia (1)
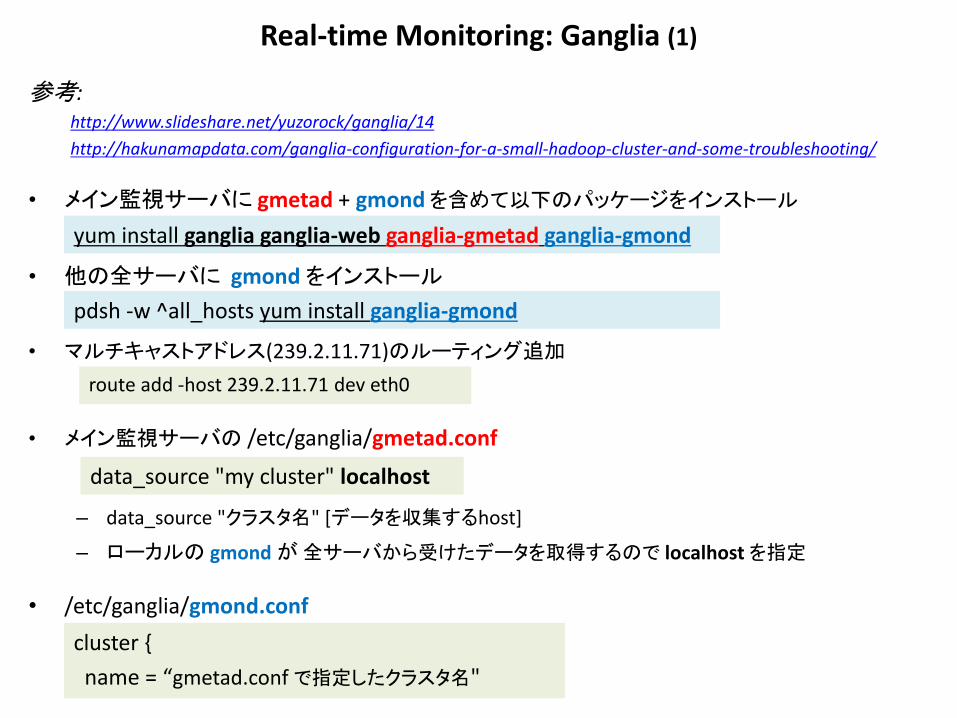
参考: http://www.slideshare.net/yuzorock/ganglia/14
http://hakunamapdata.com/ganglia-configuration-for-a-small-hadoop-cluster-and-some-troubleshooting/
• メイン監視サーバに gmetad + gmond を含めて以下のパッケージをインストール
• 他の全サーバに gmond をインストール
• マルチキャストアドレス(239.2.11.71)のルーティング追加
• メイン監視サーバの /etc/ganglia/gmetad.conf
– data_source "クラスタ名" [データを収集するhost]
– ローカルの gmond が 全サーバから受けたデータを取得するので localhost を指定
• /etc/ganglia/gmond.conf
yum install ganglia ganglia-web ganglia-gmetad ganglia-gmond
pdsh -w ^all_hosts yum install ganglia-gmond
data_source "my cluster" localhost
cluster {
name = “gmetad.conf で指定したクラスタ名"
route add -host 239.2.11.71 dev eth0
Real-time Monitoring: Ganglia (2)
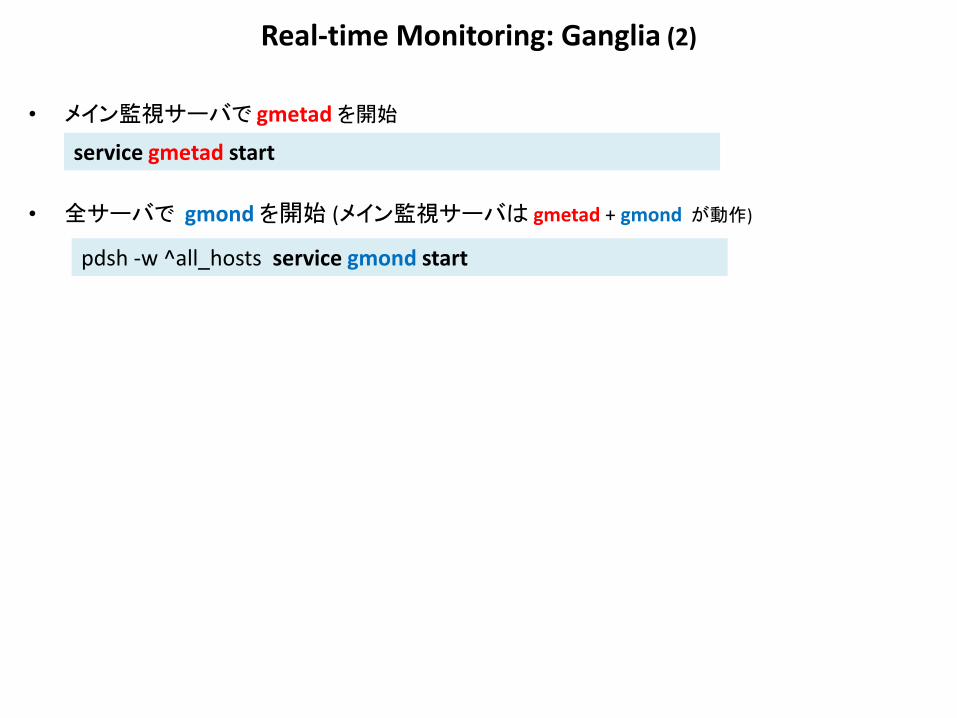
• メイン監視サーバで gmetad を開始
• 全サーバで gmond を開始 (メイン監視サーバは gmetad + gmond が動作)
service gmetad start
pdsh -w ^all_hosts service gmond start
Administration with Ambari
• 画面の説明 – Figure 6.7 ~ Figure 6.13 参照。詳細は割愛…
• Dashboard
• Heatmaps – クラスタの全ノードを visualize 化
• Services – 設定ファイルの編集 – 実行中の全サービスの metrics を表示 – サービスの start , stop が可能
• Hosts – 各ノードの状態 – down しているノードがあれば警告
• Admin – ユーザの作成、権限設定
– HA – セキュリテイ – Misc
JVM Analysis
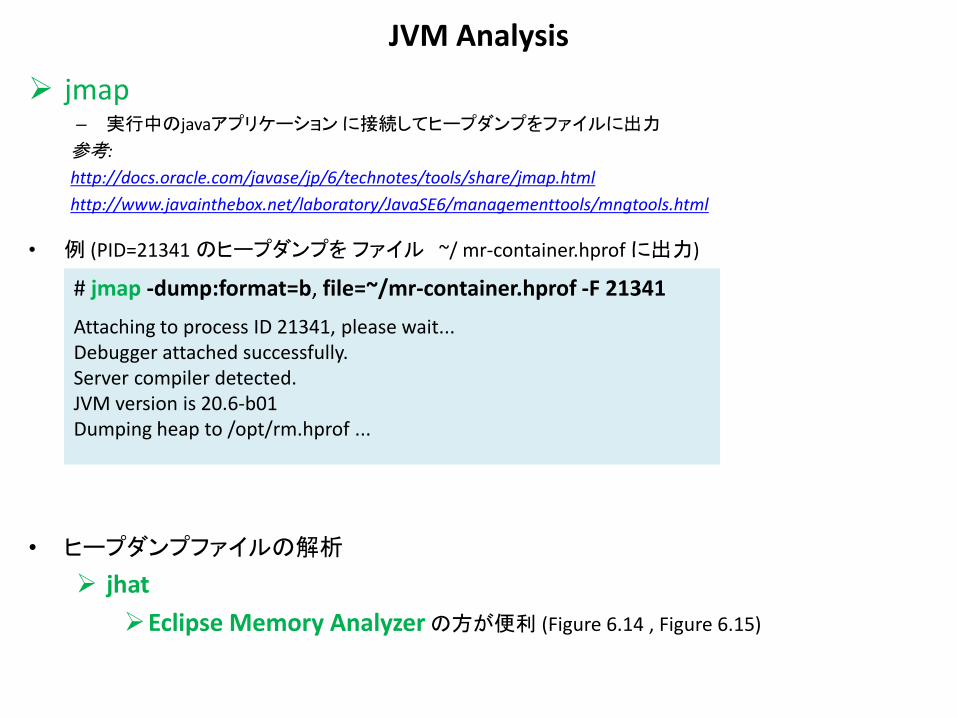
jmap – 実行中のjavaアプリケーション に接続してヒープダンプをファイルに出力
参考:
http://docs.oracle.com/javase/jp/6/technotes/tools/share/jmap.html
http://www.javainthebox.net/laboratory/JavaSE6/managementtools/mngtools.html
• 例 (PID=21341 のヒープダンプを ファイル ~/ mr-container.hprof に出力)
• ヒープダンプファイルの解析
jhat
Eclipse Memory Analyzer の方が便利 (Figure 6.14 , Figure 6.15)
# jmap -dump:format=b, file=~/mr-container.hprof -F 21341
Attaching to process ID 21341, please wait... Debugger attached successfully. Server compiler detected. JVM version is 20.6-b01 Dumping heap to /opt/rm.hprof ...
Basic YARN Administration (1)
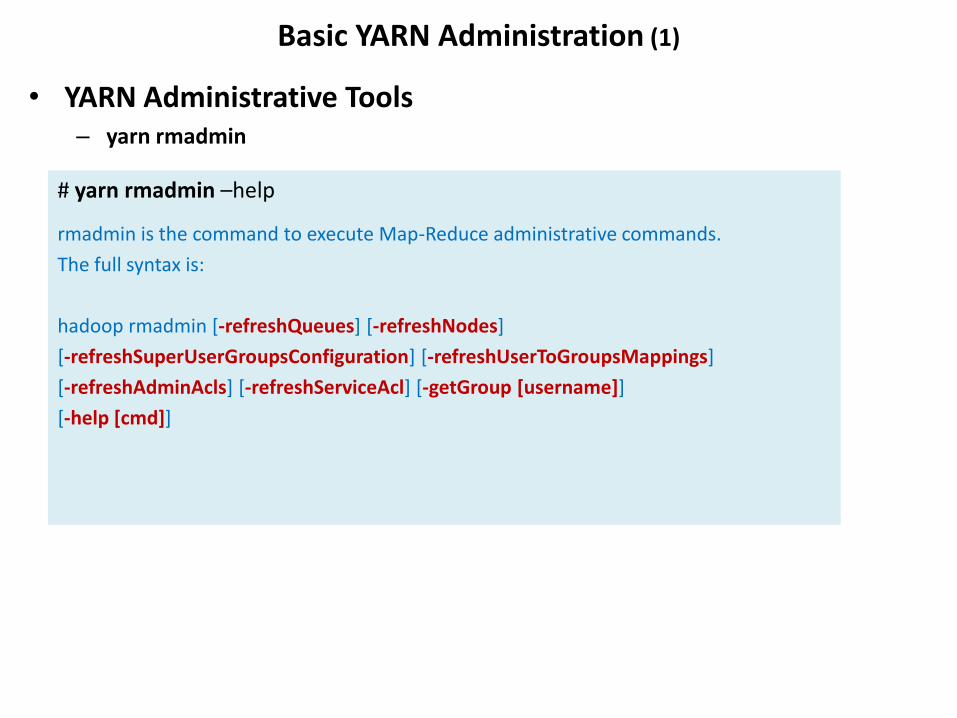
• YARN Administrative Tools – yarn rmadmin
# yarn rmadmin –help
rmadmin is the command to execute Map-Reduce administrative commands.
The full syntax is:
hadoop rmadmin [-refreshQueues] [-refreshNodes]
[-refreshSuperUserGroupsConfiguration] [-refreshUserToGroupsMappings]
[-refreshAdminAcls] [-refreshServiceAcl] [-getGroup [username]]
[-help [cmd]]
Basic YARN Administration (2)
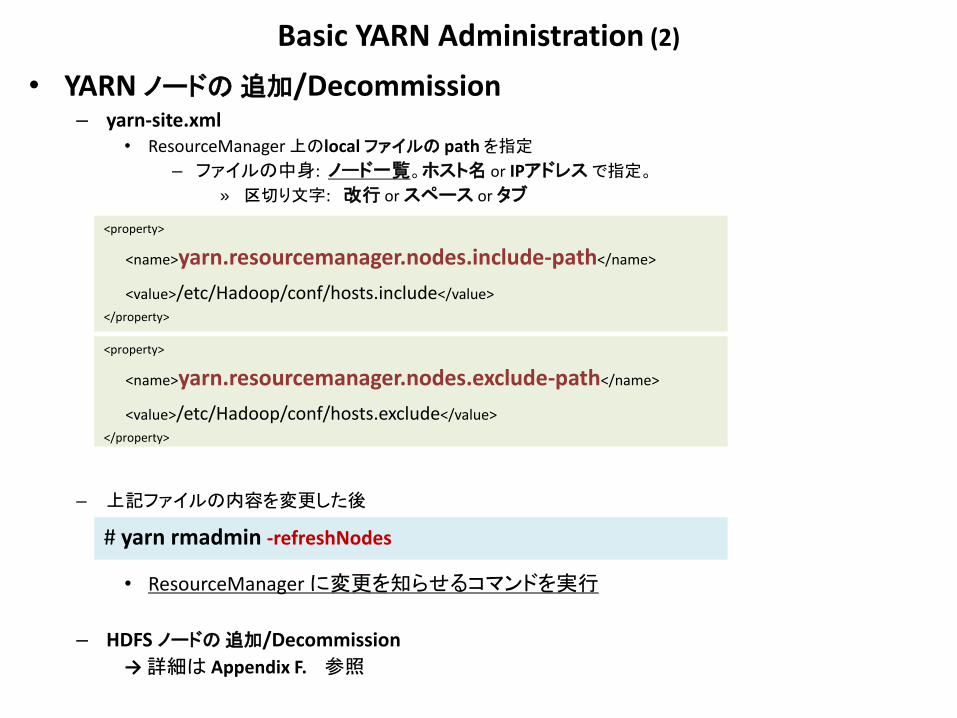
• YARN ノードの 追加/Decommission – yarn-site.xml
• ResourceManager 上のlocal ファイルの path を指定
– ファイルの中身: ノード一覧。ホスト名 or IPアドレス で指定。
» 区切り文字: 改行 or スペース or タブ
– 上記ファイルの内容を変更した後
• ResourceManager に変更を知らせるコマンドを実行
– HDFS ノードの 追加/Decommission
→ 詳細は Appendix F. 参照
# yarn rmadmin -refreshNodes
<property>
<name>yarn.resourcemanager.nodes.include-path</name>
<value>/etc/Hadoop/conf/hosts.include</value>
</property>
<property>
<name>yarn.resourcemanager.nodes.exclude-path</name>
<value>/etc/Hadoop/conf/hosts.exclude</value>
</property>
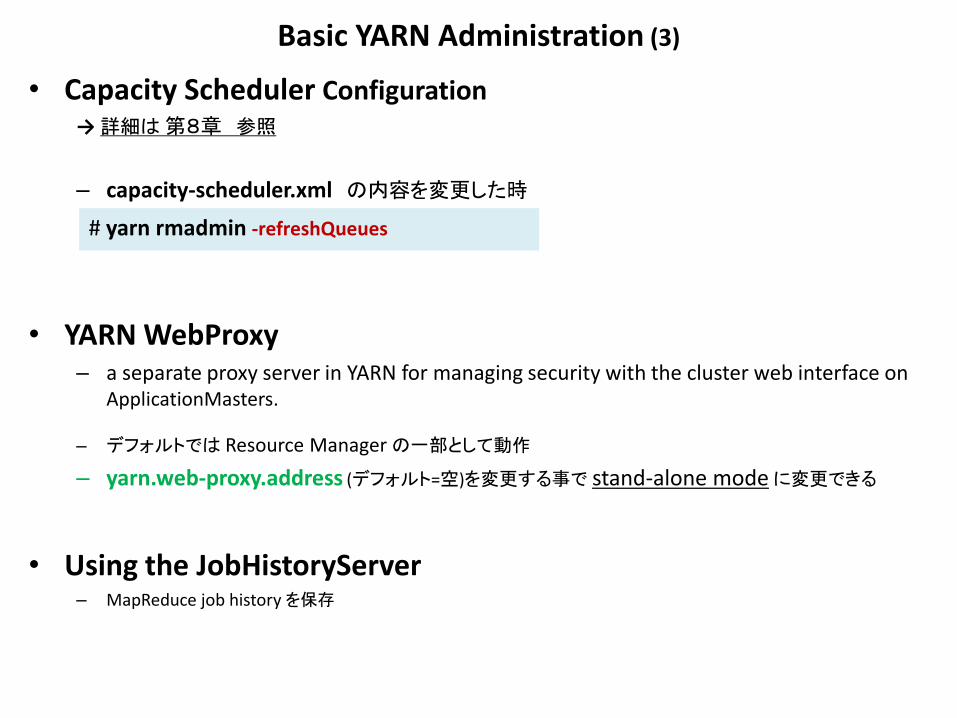
Basic YARN Administration (3)
• Capacity Scheduler Configuration → 詳細は 第8章 参照
– capacity-scheduler.xml の内容を変更した時
• YARN WebProxy – a separate proxy server in YARN for managing security with the cluster web interface on
ApplicationMasters.
– デフォルトでは Resource Manager の一部として動作
– yarn.web-proxy.address (デフォルト=空)を変更する事で stand-alone mode に変更できる
• Using the JobHistoryServer – MapReduce job history を保存
# yarn rmadmin -refreshQueues
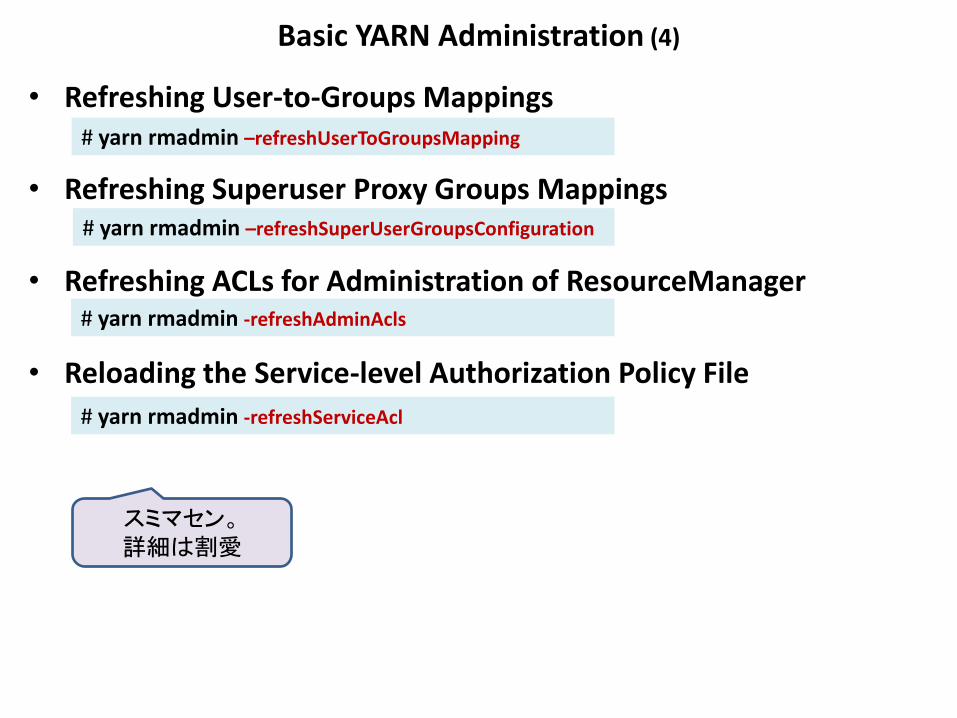
Basic YARN Administration (4)
• Refreshing User-to-Groups Mappings
• Refreshing Superuser Proxy Groups Mappings
• Refreshing ACLs for Administration of ResourceManager
• Reloading the Service-level Authorization Policy File
# yarn rmadmin –refreshUserToGroupsMapping
# yarn rmadmin –refreshSuperUserGroupsConfiguration
# yarn rmadmin -refreshAdminAcls
# yarn rmadmin -refreshServiceAcl
スミマセン。 詳細は割愛
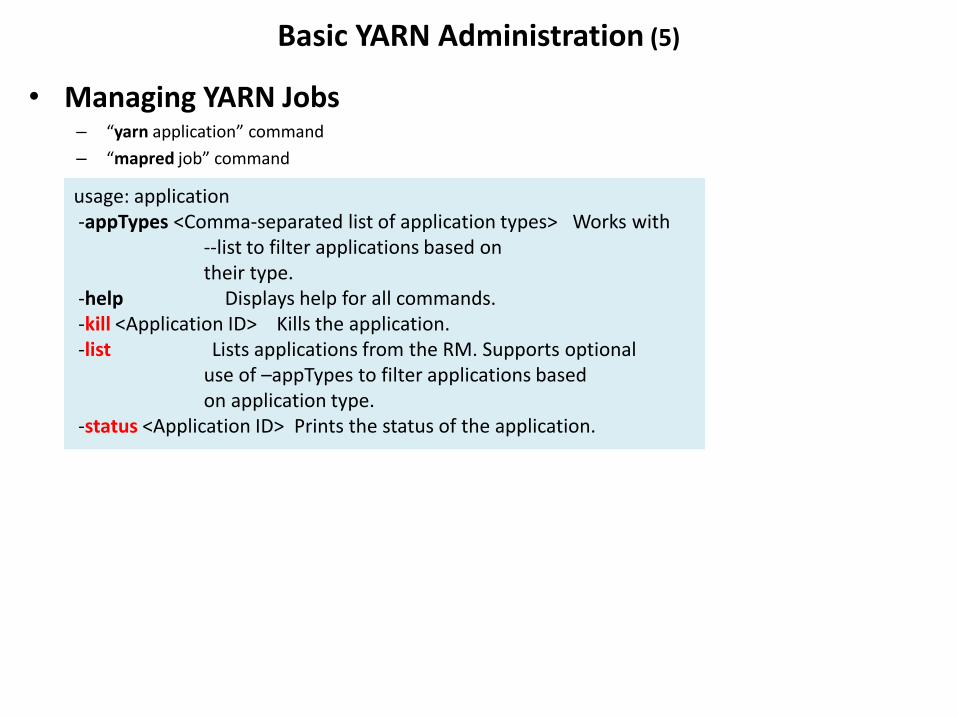
Basic YARN Administration (5)
• Managing YARN Jobs – “yarn application” command
– “mapred job” command
usage: application -appTypes <Comma-separated list of application types> Works with --list to filter applications based on their type. -help Displays help for all commands. -kill <Application ID> Kills the application. -list Lists applications from the RM. Supports optional use of –appTypes to filter applications based on application type. -status <Application ID> Prints the status of the application.
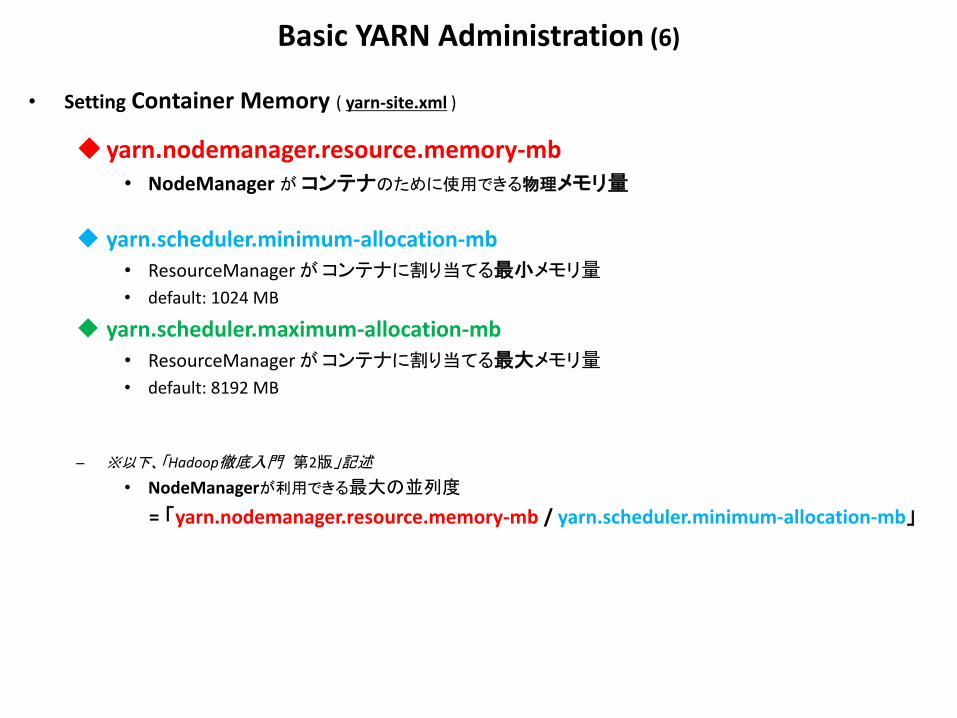
Basic YARN Administration (6)
• Setting Container Memory ( yarn-site.xml )
yarn.nodemanager.resource.memory-mb • NodeManager が コンテナのために使用できる物理メモリ量
yarn.scheduler.minimum-allocation-mb
• ResourceManager が コンテナに割り当てる最小メモリ量
• default: 1024 MB
yarn.scheduler.maximum-allocation-mb
• ResourceManager が コンテナに割り当てる最大メモリ量
• default: 8192 MB
– ※以下、「Hadoop徹底入門 第2版」記述
• NodeManagerが利用できる最大の並列度
= 「yarn.nodemanager.resource.memory-mb / yarn.scheduler.minimum-allocation-mb」
Basic YARN Administration (7)
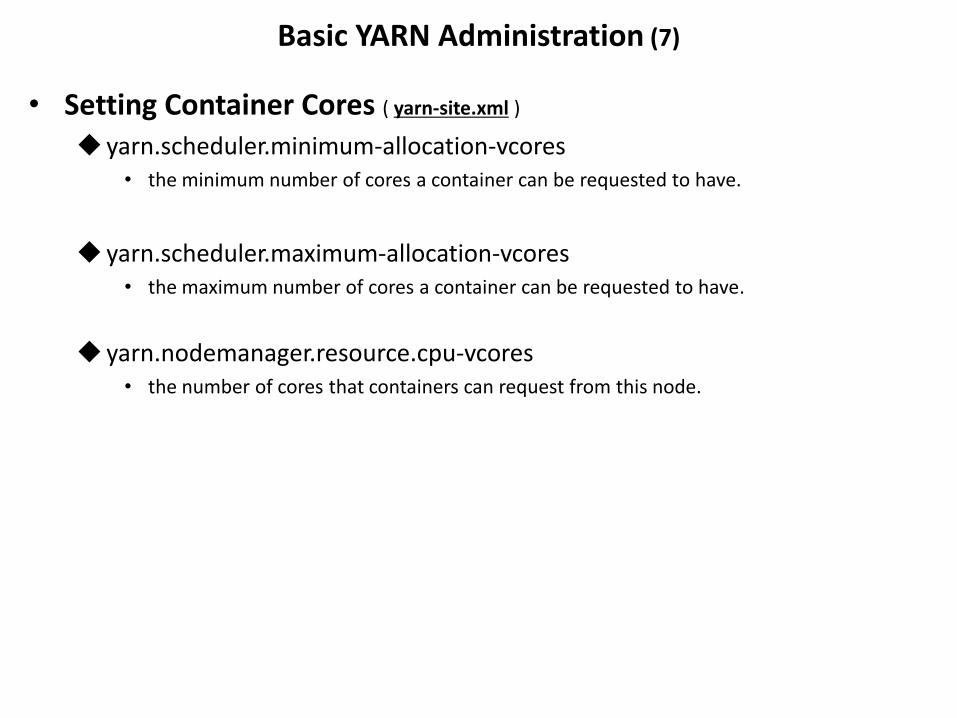
• Setting Container Cores ( yarn-site.xml )
yarn.scheduler.minimum-allocation-vcores • the minimum number of cores a container can be requested to have.
yarn.scheduler.maximum-allocation-vcores • the maximum number of cores a container can be requested to have.
yarn.nodemanager.resource.cpu-vcores • the number of cores that containers can request from this node.
Basic YARN Administration (8)
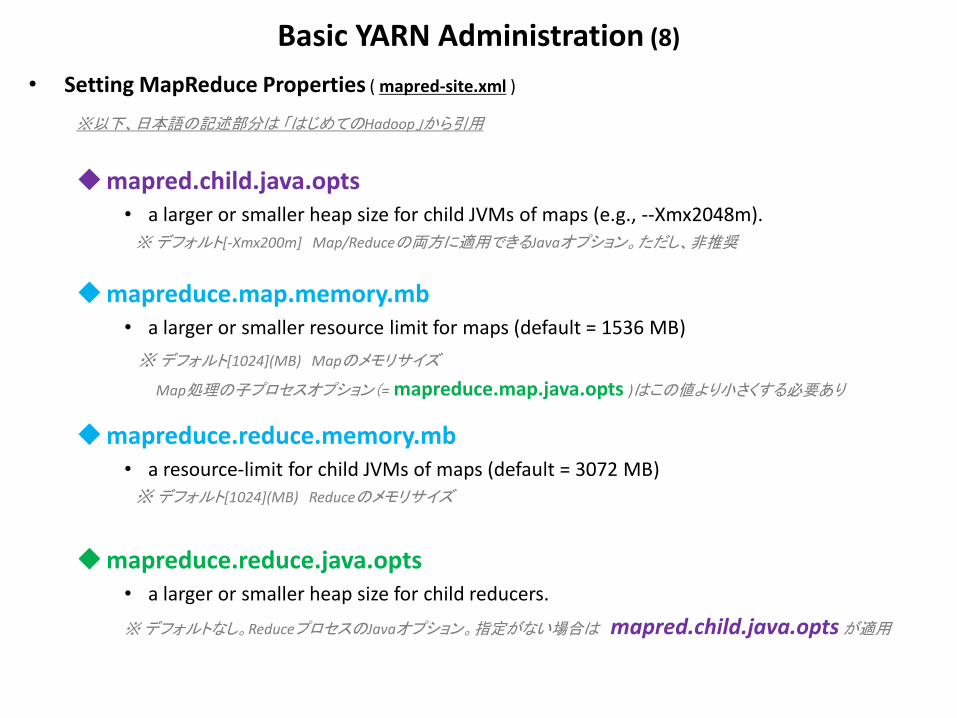
• Setting MapReduce Properties ( mapred-site.xml )
※以下、日本語の記述部分は 「はじめてのHadoop」から引用
mapred.child.java.opts • a larger or smaller heap size for child JVMs of maps (e.g., --Xmx2048m). ※ デフォルト[-Xmx200m] Map/Reduceの両方に適用できるJavaオプション。ただし、非推奨
mapreduce.map.memory.mb • a larger or smaller resource limit for maps (default = 1536 MB)
※ デフォルト[1024](MB) Mapのメモリサイズ
Map処理の子プロセスオプション(= mapreduce.map.java.opts )はこの値より小さくする必要あり
mapreduce.reduce.memory.mb • a resource-limit for child JVMs of maps (default = 3072 MB) ※ デフォルト[1024](MB) Reduceのメモリサイズ
mapreduce.reduce.java.opts • a larger or smaller heap size for child reducers.
※ デフォルトなし。ReduceプロセスのJavaオプション。指定がない場合は mapred.child.java.opts が適用
Basic YARN Administration User Log Management (1)
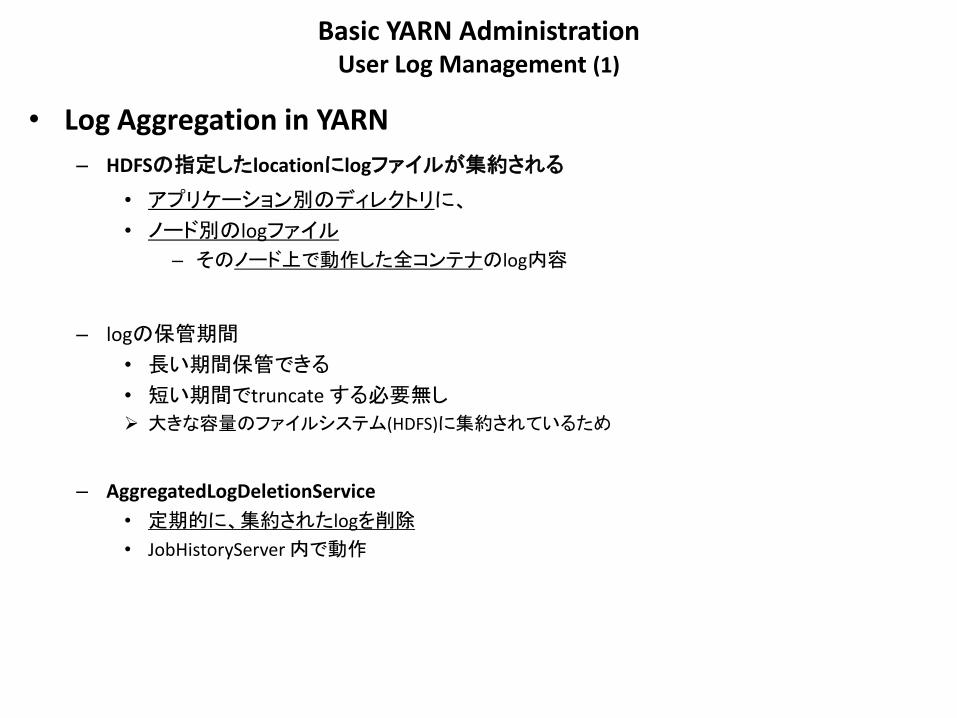
• Log Aggregation in YARN
– HDFSの指定したlocationにlogファイルが集約される
• アプリケーション別のディレクトリに、
• ノード別のlogファイル
– そのノード上で動作した全コンテナのlog内容
– logの保管期間
• 長い期間保管できる
• 短い期間でtruncate する必要無し
大きな容量のファイルシステム(HDFS)に集約されているため
– AggregatedLogDeletionService
• 定期的に、集約されたlogを削除
• JobHistoryServer 内で動作
Basic YARN Administration User Log Management (2)
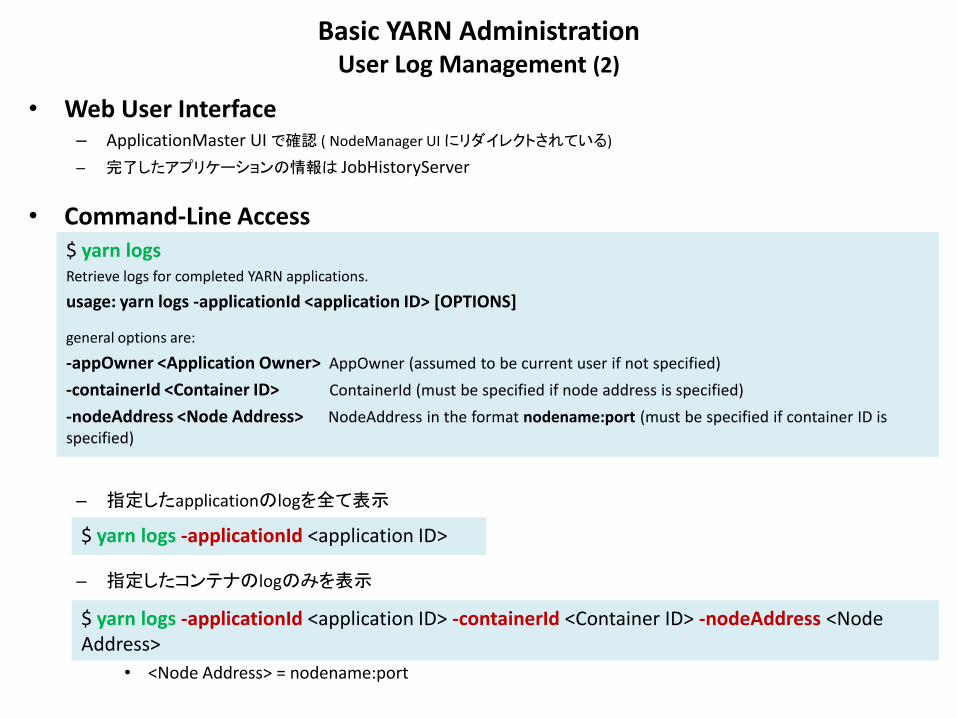
• Web User Interface – ApplicationMaster UI で確認 ( NodeManager UI にリダイレクトされている)
– 完了したアプリケーションの情報は JobHistoryServer
• Command-Line Access
– 指定したapplicationのlogを全て表示
– 指定したコンテナのlogのみを表示
• <Node Address> = nodename:port
$ yarn logs Retrieve logs for completed YARN applications.
usage: yarn logs -applicationId <application ID> [OPTIONS]
general options are:
-appOwner <Application Owner> AppOwner (assumed to be current user if not specified)
-containerId <Container ID> ContainerId (must be specified if node address is specified)
-nodeAddress <Node Address> NodeAddress in the format nodename:port (must be specified if container ID is specified)
$ yarn logs -applicationId <application ID>
$ yarn logs -applicationId <application ID> -containerId <Container ID> -nodeAddress <Node Address>
Basic YARN Administration User Log Management (3)
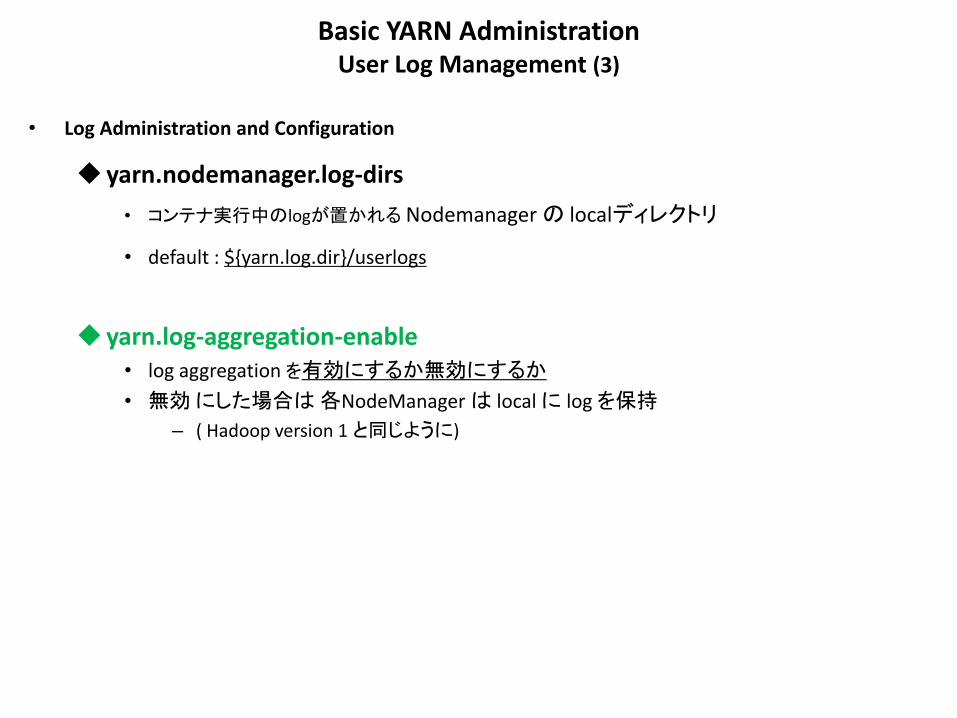
• Log Administration and Configuration
yarn.nodemanager.log-dirs
• コンテナ実行中のlogが置かれる Nodemanager の localディレクトリ
• default : ${yarn.log.dir}/userlogs
yarn.log-aggregation-enable • log aggregation を有効にするか無効にするか
• 無効 にした場合は 各NodeManager は local に log を保持
– ( Hadoop version 1 と同じように)

Basic YARN Administration User Log Management (4)
• log aggregation を有効 にした場合に効力のあるプロパティ
yarn.nodemanager.remote-app-log-dir • 各NodeManager が log を 集約するディレクトリ • 通常は HDFS
• local file system を指定すべきではない – 他の daemon (例えば history server) がlogを扱えなくなるため
• default: /tmp/logs
yarn.nodemanager.remote-app-log-dir-suffix • remote log directoryのpath に付くサフィックス
= {yarn.nodemanager.remote-app-log-dir}/${user}/{suffix}
• default: logs
yarn.log-aggregation.retain-seconds • 集約 log の保持期間
– 負数を指定すると logの削除が無効化
• 分散 file system にとっては負荷にならないため、小さすぎる値を設定しないように注意。
yarn.log-aggregation.retain-check-interval-seconds yarn.log.server.url
• Web UI で 集約されたlogの場所を表示させる時にリダイレクトさせるURL -> JobHistory
Basic YARN Administration User Log Management (5)
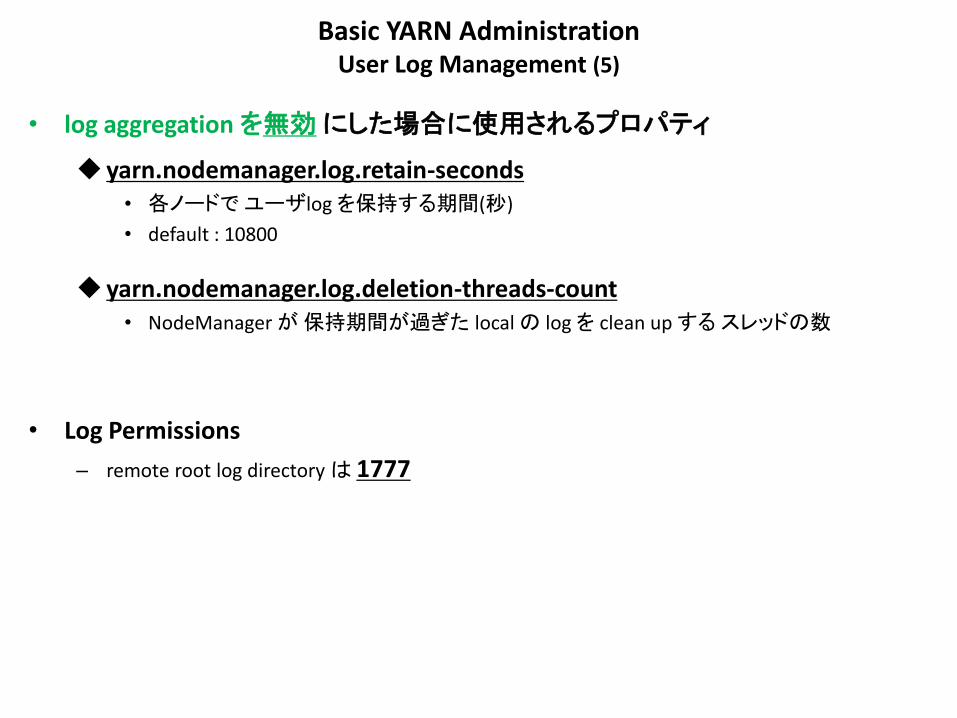
• log aggregation を無効 にした場合に使用されるプロパティ
yarn.nodemanager.log.retain-seconds • 各ノードで ユーザlog を保持する期間(秒)
• default : 10800
yarn.nodemanager.log.deletion-threads-count • NodeManager が 保持期間が過ぎた local の log を clean up する スレッドの数
• Log Permissions
– remote root log directory は 1777
Recommended


![chap06.ppt [호환 모드]graphics.hallym.ac.kr/teach/2008/mm/src/chap06.pdf · z사운드의생성을대변하는“사건”을부호 화한다. synthesizer sequencer MIDIkeyboardsynthesizer](https://img.pdfslide.tips/doc/110x75/5e44e25704339c72e1255796/-eeoegraphicshallymackrteach2008mmsrcchap06pdf-zeoefeoeeeaoeeae.jpg)