Atmospheric Environment Vol. 27A, No. 17/18, pp, 3029 3036, 1993. 0004q5981/93 $6.00+0.00 Printed in Great Britain. © 1993 Pergamon Press Ltd
ARCTIC A E R O S O L S IN G R E E N L A N D
N. Z. HEIDAM, P. W,~HLIN and K. KEMP National Environmental Research Institute, Division of Emissions and Air Pollution, Frederiksborgvej 399,
DK-4000 Roskilde, Denmark
(First receiced 10 January 1992 and in final forra 15 October 1992)
Abstract--Elemental composition of Arctic aerosols is being studied on the Greenland Icecap and in northeast Greenland to determine the level, composition, seasonal variation and origin of the aerosols, of which little is known in the remote and elevated central region. In particular, the degree of penetration of arctic haze aerosols is of interest since this may cause perturbations of climatic parameters.
Arctic haze aerosols have previously been found at four coastal sites notably in north Greenland. Receptor modelling of the aerosol by factor analysis revealed three to five components of remote origin from both natural and anthropogenic sources. In north Greenland the anthropogenic components exhibited large annual cycles with pronounced maxima in winter caused by long-range atmospheric transport from mid- latitude areas. These measurements have been resumed as a reference to the Icecap Experiment.
On the Icecap, aerosol samples are being collected in two size ranges on a continuous basis concurrent with the Greenland Icecore Programme 1989-1993 at Summit, 3200 m a.s.l. The sampling equipment is designed for collection of weekly samples especially suited for PIXE analysis, retrieval once a year, automatic operation under extremely cold conditions and very low energy consumption. Preliminary results from samples covering for the first time also the winter season on the central Icecap are discussed in relation to arctic haze occurrences at sea level.
Key word index: Aerosols, sampling, arctic haze, factor analysis, Greenland, Icecap.
INTRODUCTION
Arctic air pollution research in Greenland has over the recent decade been focused on the tropospheric aerosols occurring in this remote region. These and other investigations have revealed that the arctic troposphere is recurrently burdened with a significant pollution load, particularly during the winter (Arctic Air Chemistry, 1977, 1981, 1985, 1989; AGASP, 1984; Arctic Air Pollution, 1986; Heidam, 1984, 1985; Ottar et al., 1986). Such perturbations of the naturally pristine polar atmosphere may have widespread envir- onmental and climatic consequences since the Arctic region occupies an essential position in the atmo- spheric circulation systems that dominate the Nor- thern Hemisphere.
Many of these investigations have incorporated studies of the composition and seasonal variations of arctic aerosols and they have been particularly useful in increasing our understanding of the mid-latitude origin of arctic air pollution and of the meteorological conditions leading to the phenomenon of arctic haze which regularly afflicts the polar region. In this paper, current research and preliminary results from the Danish programme SAGA, Studies of Aerosols in the Greenland Atmosphere, are described against a back- ground of previous SAGA investigations.
ARCTIC HAZE AEROSOLS
SAGA 1979-1983
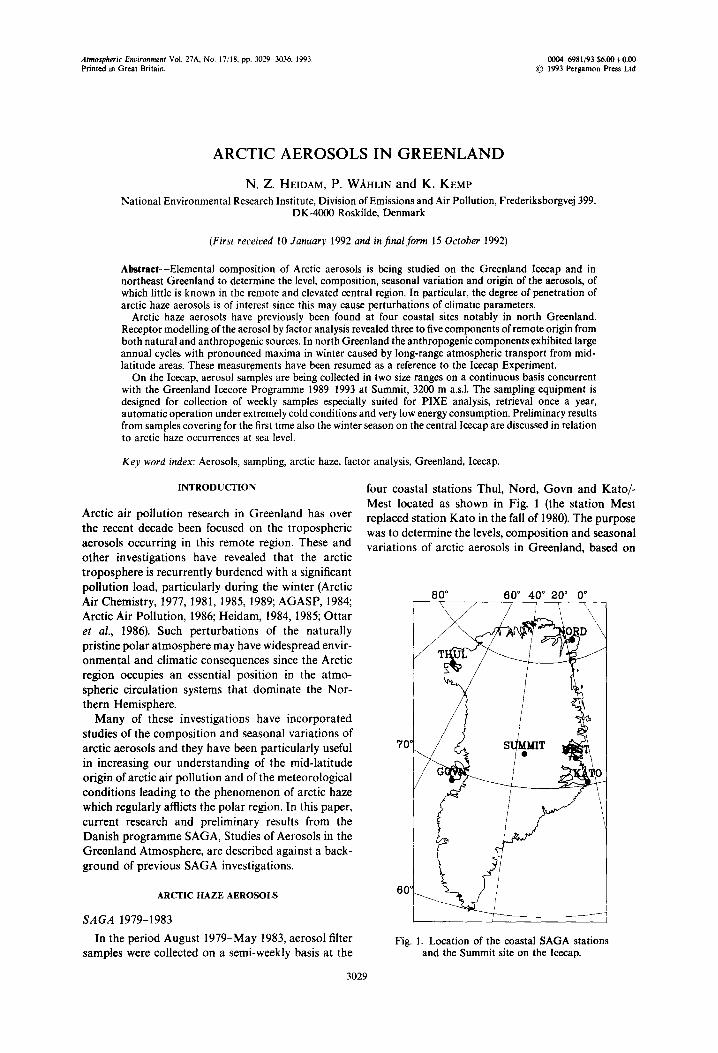
In the period August 1979-May 1983, aerosol filter samples were collected on a semi-weekly basis at the
four coastal stations Thul, Nord, Govn and Kato/- Mest located as shown in Fig. 1 (the station Mest replaced station Kato in the fall of 1980). The purpose was to determine the levels, composition and seasonal variations of arctic aerosols in Greenland, based on
8 0 ° 6 0 ° 4 0 ° 2 0 ° 0 °
70'
6 0 '
Fig. 1. Location of the coastal SAGA stations and the Summit site on the Icecap.
3029
3030 N.Z. HEIDAM et al.
the elemental contents determined by PIXE analyses. In order to elucidate the origins and transport
routes of arctic air pollution the results were subjected to factor analysis (Harman, 1976; Heidam, 1982, 1984). In the ensuing factor models the structure of the variations and covariations of the 15-20 elements detected is represented by a small set of factors which can b¢ interpreted physically in terms of a few virtually independent aerosol components. Examples of these models are shown in Tableg 1 and 2 and it is seen that 3-4 factors suffice to account for 85-90% of the total variance associated with the concentration variations. The variance is distributed over the factors as shown and the column of communalities, which are the
fractions of variance explained by the model, shows the distribution over individual elements. The model- ling of the individual elements is also quite good since the communality is generally greater than 75%. The interpretation of the factors as representations of physical aerosol components is based on the composi- tion of elements most strongly coupled to the factor.
The models obtained at the various stations for both coincident (Heidam, 1984, 1985) and separate time periods (Tables 1 and 2) turn out to be mutually quite similar in that they contain the same set of source-related components: anthropogenic compon- ents originating from combustion processes in power generation and transportation, or industrial processes
Table 1. Varimax rotated 3-factor model for the arctic aerosol, Nord June 1981-May 1982
Factor 1: Factor 2: Factor 3: Communality erosion metals combustion
Ai 0.977 0.012 -0.004 0.954 Fe 0.968 0.153 0.062 0.965 Ti 0.941 0.067 0.013 0.891 Si 0.871 -0.014 -0.262 0.826 Ca 0.870 0.206 0.227 0.850 K 0.834 0.417 0.206 0.912 Mn 0.811 0.514 0.206 0.964 Sr 0.566 0.472 0.410 0.710
Zn 0.202 0.831 0.345 0.850 Cu 0.002 0.763 0.449 0.785 Cr 0.503 0.634 0.274 0.730
Br 0.016 0.228 0.973 0.999 S -0.151 0.456 0.754 0.799 Pb 0.191 0.259 0.640 0.513
Variances 6.317 2.732 2.698 11.747 explained 83.9%
Table 2. Varimax rotated 4-factor model for the arctic aerosol, Thul May 1982-May 1983
Factor 1: Factor 2: Factor 3: Factor 4: erosion combustion metals marine Communality
Ti 0.971 0.029 0.154 1 0.135 0.986 Si 0.966 -0.065 0.163 0.094 0.973 A1 0.961 0.095 0.166 0.106 0.972 Fe 0.957 0.138 0.214 0.114 0.995 Mn 0.853 0.310 0.354 0.104 0.959 K 0.609 0.386 0.348 0.506 0.897
S -0.085 0.919 0.207 -0.171 0.923 Br 0.055 0.847 0.385 0.149 0.890 Ni 0.138 0.823 0.289 0.019 0.781 Ca 0.410 0.623 0.369 0.438 0.885
Pb 0.230 0.397 0.804 0.060 0.860 Cu 0.317 0.257 0.778 0.149 0.794 Zn 0.230 0.485 0.765 0.089 0.881 Cr 0.363 0.527 0.546 0.090 0.715
CI 0.080 -0.117 0.032 0.844 0.734 Sr 0.491 0.503 0.310 0.633 0.990
Variances 5.599 3.908 3.012 1.717 14.234 explained 89.0%
Arctic aerosols in Greenland 3031
such as metal smelting, and natural components of a crustal or marine character. Although the strengths of these source influences might vary from station to station it can be concluded that this simple source- related composition is a general characteristic of the arctic aerosols, not only in Greenland but in the Arctic in general. This conclusion allows the most important characteristics of the aerosol variations to be illustra- ted by a few elements selected as tracers for the various aerosol components.
Seasonal variations and meteorological mechanisms
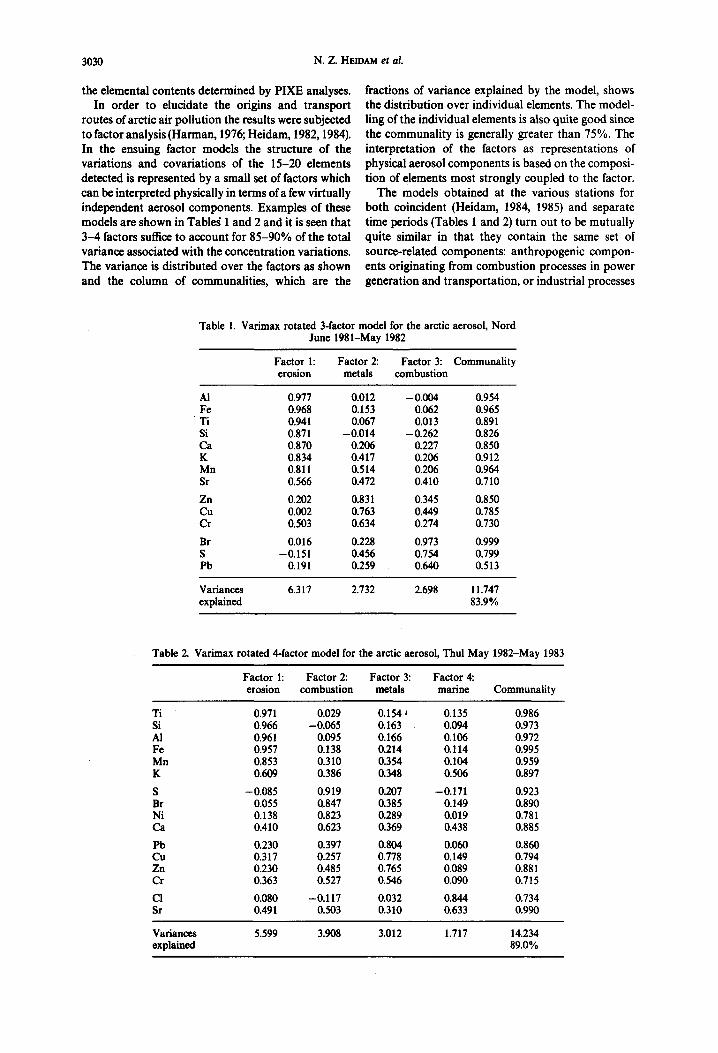
Monthly geometric mean values at the two nor- thern stations Thul and Nord for the four elements sulphur, lead, zinc and titanium are shown in Fig. 2. The first two elements, S and Pb, show the typical behaviour of the anthropogenic combustion factor; Zn is representative of the metallic factor and Ti represents the crustal part of the aerosol.
It is seen that the anthropogenic components are characterized by a systematic and recurrent behaviour with large winter maxima that occur almost syn- chronously at these two stations separated by more than 1000 km. In view of the absence of any large sources of this nature in the region, this behaviour must be interpreted as evidence of an Arctic-wide phenomenon of long-range atmospheric transport from distant sources. The maximum concentrations of particulate sulphur, the main component of arctic haze observed all over the polar region in winter, are in fact comparable to levels found in rural regions of
Europe. The secondary summer maxima of Pb and Zn are on the other hand thought to be of a more local origin (Heidam, Arctic Air Pollution, 1986). The tem- poral variation of the crustal component as exempli- fied by Ti is more erratic and consistent with that of wind-blown dust particles of indigeneous origin since large coastal tracts of Greenland are snow-free in summer.
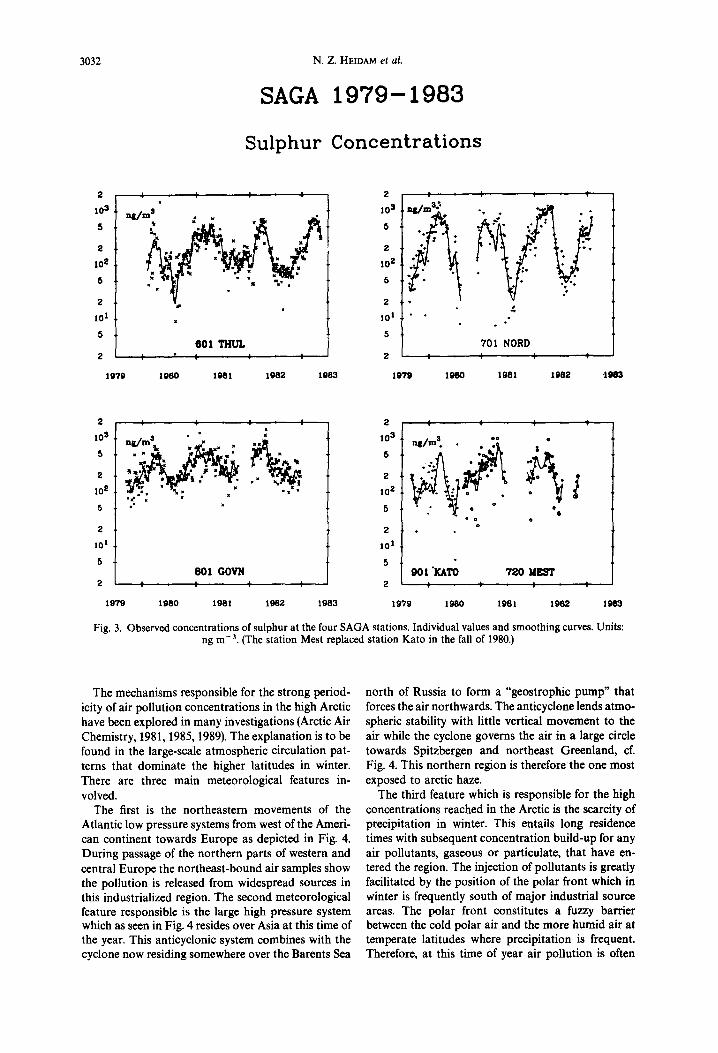
Individual results are shown on a logarithmic scale for sulphur at all stations in Fig. 3. for the whole experimental period of the SAGA project. The plots are arranged spatially to reflect the geographical positions of the stations. To facilitate comparisons smoothed spline curves, representing low-pass filters, are shown. The curves correspond approximately to moving averages over 15 observations, i.e. 1.8 months.
It is seen from these figures that the temporal variations are particular to the site, reflecting a geo- graphical variation in source impacts. However, the models are essentially the same at all the stations, signifying the strong influence of long-range atmo- spheric transport from remote sources on the Green- land aerosol. This influence is weakest at the southern stations but closer inspection reveals that both the marine and combustion components do possess regu- lar seasonal variations, particularly at Govn on the west coast. The systematic recurrency of annual max- ima and minima are much more pronounced at the northern sites, in particular at Nard where they range over more than two decades. Thus, northeast Green- land seems to be the region most systematically ex- posed to long-range transport.
12oo
SAGA: Concentrat ions of Su lphu r
1000 N
8OO
600
4OO
2OO
o ,I
1979
JUL JAN JI)L JAN JUL JAN JEll. JAN
1980 1981 1982 1983
60
SAGA: Concentrotions Of Lead
5O
4O
3O
20
10
0 :-~
1979
x THUL'5
= NORD
dUL ,,M,,N JUL JAN JUL JAN JUL JAN
1980 1981 1982 1983
la
16
14
12
10
8
6
4
2
0
SAGA: Concentrat ions of Zinc
K 1HUL "2
= NORD
JUL JAN JUL JAN JUt. JAN JUL
SAGA: Concentrat ions of T i tanium
M THUL "2
= NORD
JUL JAN JUL JAN JUL JAN Jill JAN
Fig. 2. Monthly geometric mean values of concentrations at Thul and Nard. Units: ng m-3.
3032 N. Z. HEIDAM el al.
SAGA 1979-1983
S u l p h u r C o n c e n L r a L i o n s
2
103
5
2
l O z
,5
2
101
5
2
1979
! I I I
~ m s
x
I I I I
1980 1981 1982 1983
2 !
IO s *l/=*'-".
2
10 2
5
2 ,
101
5
2 I
t t I
ot
7 0 1 NORD i i
1979 1960 1981
I
1982 .19113
2
IO B
5
2
102
5
2
101
5
n i / m " " "" " I N i i "
... ".
. .
601 GOVN I I I I
I I t
. . e,. 8 "
o o
2
103
5
2
102
5
2
101
5
2
1979
901 "lOtTO !
1979 1980 l g B I 1982 1983 1980
720 M~'r ! ! ¢,
1981 1982 19113
Fig. 3. Observed concentrations of sulphur at the four SAGA stations. Individual values and smoothing curves. Units: ng m -a. (The station Mest replaced station Kato in the fall of 1980.)
The mechanisms responsible for the strong period- icity of air pollution concentrations in the high Arctic have been explored in many investigations (Arctic Air Chemistry, 1981, 1985, 1989). The explanation is to be found in the large-scale atmospheric circulation pat- terns that dominate the higher latitudes in winter. There are three main meteorological features in- volved.
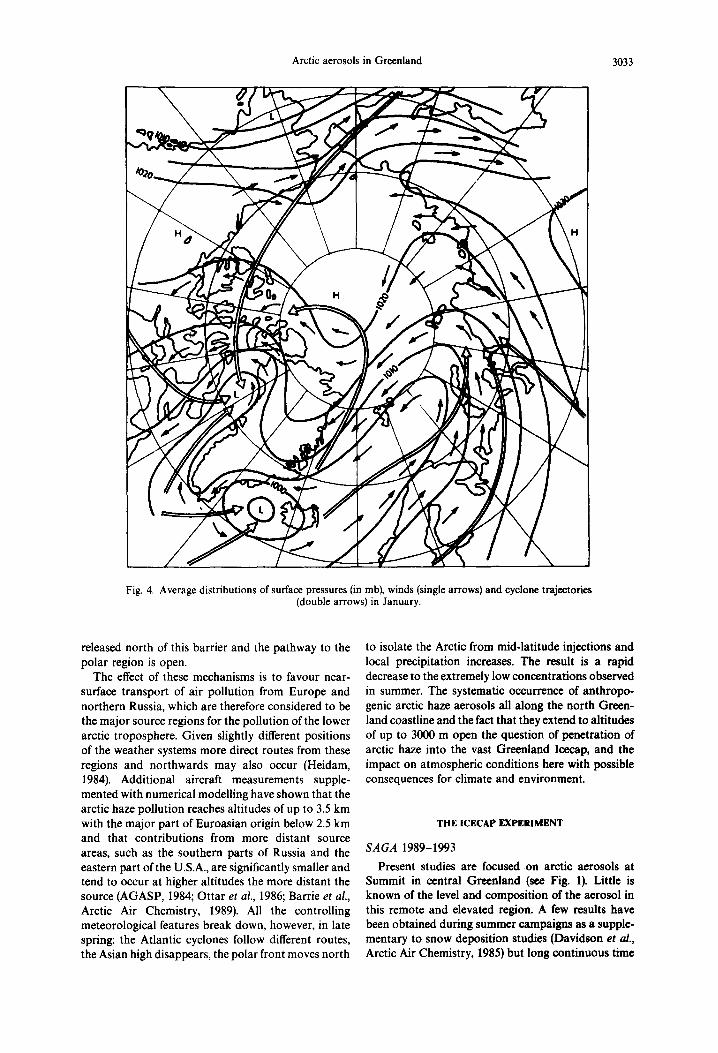
The first is the northeastern movements of the Atlantic low pressure systems from west of the Ameri- can continent towards Europe as depicted in Fig. 4. During passage of the northern parts of western and central Europe the northeast-bound air samples show the pollution is released from widespread sources in this industrialized region. The second meteorological feature responsible is the large high pressure system which as seen in Fig. 4 resides over Asia at this time of the year. This anticyclonic system combines with the cyclone now residing somewhere over the Barents Sea
north of Russia to form a "geostrophic pump" that forces the air northwards. The anticyclone lends atmo- spheric stability with little vertical movement to the air while the cyclone governs the air in a large circle towards Spitzbergen and northeast Greenland, cf. Fig. 4. This northern region is therefore the one most exposed to arctic haze.
The third feature which is responsible for the high concentrations reached in the Arctic is the scarcity of precipitation in winter. This entails long residence times with subsequent concentration build-up for any air pollutants, gaseous or particulate, that have en- tered the region. The injection of pollutants is greatly facilitated by the position of the polar front which in winter is frequently south of major industrial source areas. The polar front constitutes a fuzzy barrier between the cold polar air and the more humid air at temperate latitudes where precipitation is frequent. Therefore, at this time of year air pollution is often
Arctic aerosols in Greenland 3033
Fig. 4. Average distributions of surface pressures (in mb), winds (single arrows) and cyclone trajectories (double arrows) in January.
released north of this barrier and the pathway to the polar region is open.
The effect of these mechanisms is to favour near- surface transport of air pollution from Europe and northern Russia, which are therefore considered to be the major source regions for the pollution of the lower arctic troposphere. Given slightly different positions of the weather systems more direct routes from these regions and northwards may also occur (Heidam, 1984). Additional aircraft measurements supple- mented with numerical modelling have shown that the arctic haze pollution reaches altitudes of up to 3.5 km with the major part of Euroasian origin below 2.5 km and that contributions from more distant source areas, such as the southern parts of Russia and the eastern part of the U.S.A., are significantly smaller and tend to occur at higher altitudes the more distant the source (AGASP, 1984; Ottar et al., 1986; Barrie et al., Arctic Air Chemistry, 1989). All the controlling meteorological features break down, however, in late spring: the Atlantic cyclones follow different routes, the Asian high disappears, the polar front moves north
to isolate the Arctic from mid-latitude injections and local precipitation increases. The result is a rapid decrease to the extremely low concentrations observed in summer. The systematic occurrence of anthropo- genic arctic haze aerosols all along the north Green- land coastline and the fact that they extend to altitudes of up to 3000 m open the question of penetration of arctic haze into the vast Greenland Icecap, and the impact on atmospheric conditions here with possible consequences for climate and environment.
THE ICECAP EXPERIMENT
S A G A 1989-1993
Present studies are focused on arctic aerosols at Summit in central Greenland (see Fig. 1). Little is known of the level and composition of the aerosol in this remote and elevated region. A few results have been obtained during summer campaigns as a supple- mentary to snow deposition studies (Davidson et al., Arctic Air Chemistry, 1985) but long continuous time
3034 N.Z. HEID^M et al.
series of the kind collected in the SAGA project 1979-1983 are needed to cover all seasonal variations and to determine the origin of this aerosol.
The Greenland Icecap is the second largest perma- nent ice-mass on Earth; it covers an area of 1.8 million km 2 and reaches heights of more than 3000 m. Large scale penetration of pollution-derived aerosols into this pristine area may severely perturb the precipi- tation and cloud distribution patterns or the tropos- pheric radiation balance with possible climatic im- pacts on an hemispheric scale. That some penetration does occur is evident from reports that the contents of heavy metals, sulfate and nitrate in deposits recovered form icecores have risen dramatically over the last few decades (Murozumi et ai., 1969; Weiss et al., 1971; Busenberg and Langway, 1979; Barrie and Hoff, Arc- tic Air Chemistry, 1985; Finkel et al., 1986; Mayewski et al., 1986). To obtain factual evidence on-site mea- surements are needed since the topography of the Icecap makes it unlikely that extrapolation of results obtained from the low-lying coastal sites would yield reliable results.
The central Icecap of Greenland is virtually in- accessible without special and costly equipment. In addition the region is unfit for prolonged stays. The SAGA Icecap Experiment is therefore carried out with automated equipment and in association with the joint European Greenland Icecore Programme, GRIP. It is one of two large international icecoring projects currently carried out 20 km apart at semi- permanent drilling camps in the SUMMIT region located at an altitude of 3200 m a.s.l. The purpose of both the American project GISP 2 and GRIP is to retrieve a 3000 m icecore down to bedrock which will take several seasons of drilling on the ice.
Aerosol sampling was started in summer 1989 about 6 km north of the GRIP site and is to continue for the whole drilling period. Particulate samples in two size ranges are collected consecutively on a weekly basis and analysed for elemental contents by PIXE. Retrieval'of the samples occurs only once a year during a summer visit to the site. In order to estimate the degree of penetration of arctic haze aerosols into the central Greenland region concurrent measure- ments are carded out with identical equipment de- ployed in northeastern Greenland at Station Nord (W~lhlin, 1993).
Experimental
The samples are collected with a battery-driven two- stage discrete streaker designed to provide samples specially suited for PIXE analysis and to operate automatically through one year under some of the harshest climatic conditions on Earth (Kemp and W~hlin, 1993). Since a more detailed description will be given elsewhere we shall only briefly outline the design.
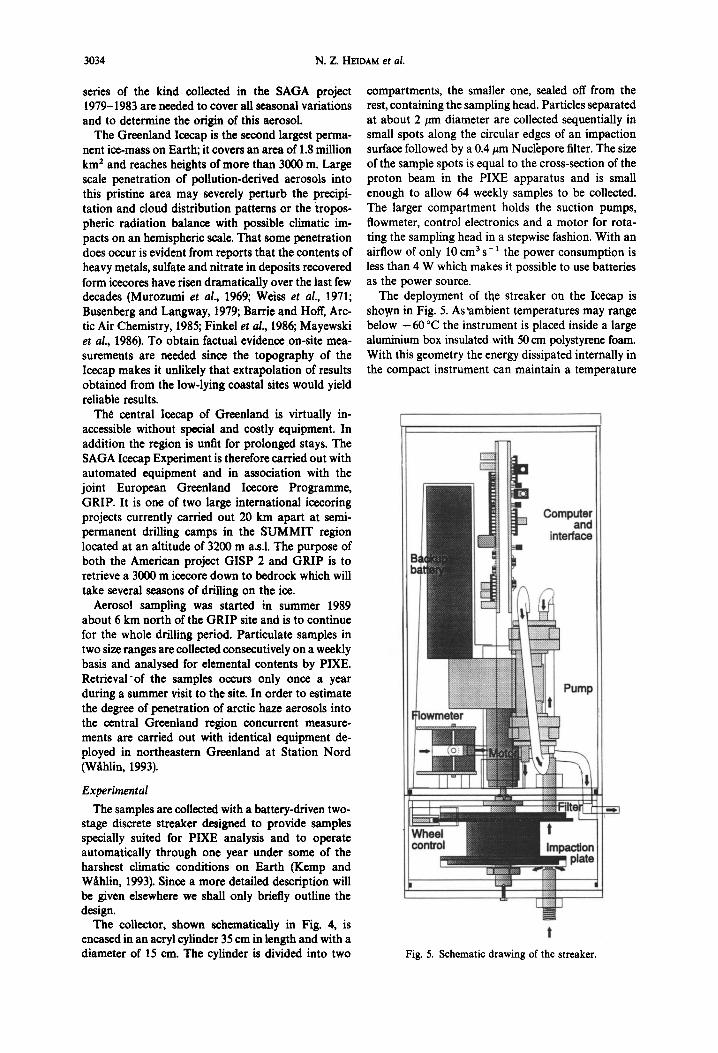
The collector, shown schematically in Fig. 4, is encased in an acryl cylinder 35 cm in length and with a diameter of 15 cm. The cylinder is divided into two
compartments, the smaller one, sealed off from the rest, containing the sampling head. Particles separated at about 2 #m diameter are collected sequentially in small spots along the circular edges of an impaction surface followed by a 0.4 #m Nucl~pore filter. The size of the sample spots is equal to the cross-section of the proton beam in the PIXE apparatus and is small enough to allow 64 weekly samples to be collected. The larger compartment holds the suction pumps, flowmeter, control electronics and a motor for rota- ting the sampling head in a stepwise fashion. With an airflow of only 10 cm 3 s- 1 the power consumption is less than 4 W which makes it possible to use batteries as the power source.
The deployment of the streaker on the Icecap is shown in Fig. 5. As'ambient temperatures may range below - 6 0 °C the instrument is placed inside a large aluminium box insulated with 50 cm polystyrene foam. With this geometry the energy dissipated internally in the compact instrument can maintain a temperature
!
Fig. 5. Schematic drawing of the streaker.
Arctic aerosols in Greenland 3035
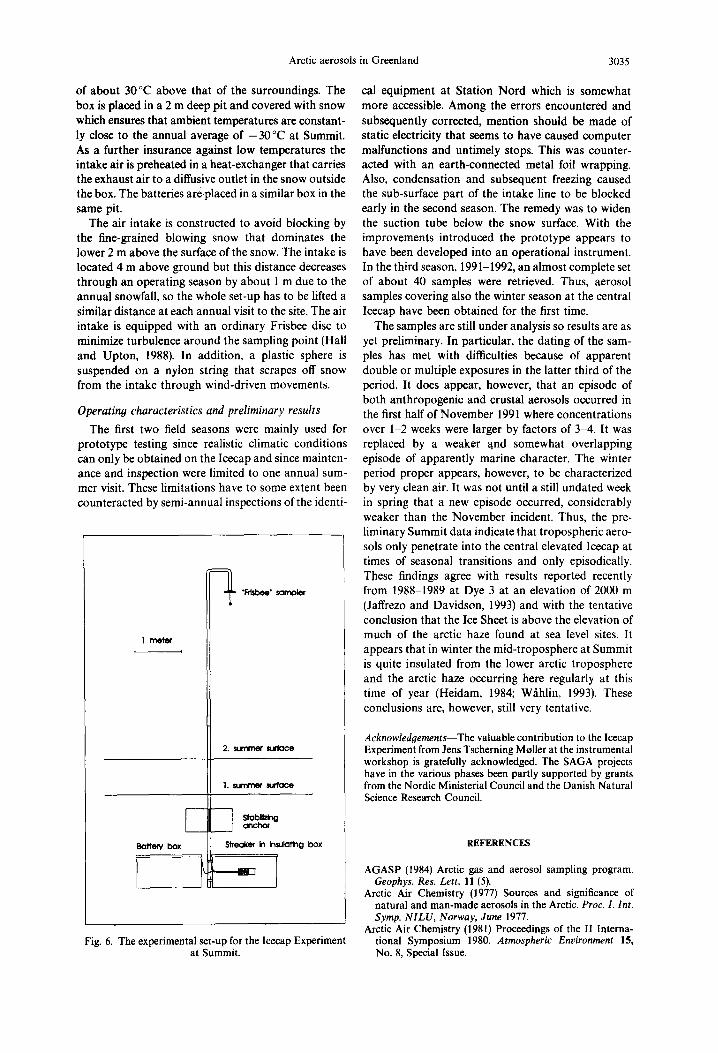
of about 30°C above that of the surroundings. The box is placed in a 2 m deep pit and covered with snow which ensures that ambient temperatures are constant- ly close to the annual average of - 3 0 °C at Summit. As a further insurance against low temperatures the intake air is preheated in a heat-exchanger that carries the exhaust air to a diffusive outlet in the snow outside the box. The batteries are.placed in a similar box in the same pit.
The air intake is constructed to avoid blocking by the fine-grained blowing snow that dominates the lower 2 m above the surface of the snow. The intake is located 4 m above ground but this distance decreases through an operating season by about 1 m due to the annual snowfall, so the whole set-up has to be lifted a similar distance at each annual visit to the site. The air intake is equipped with an ordinary Frisbee disc to minimize turbulence around the sampling point (Hall and Upton, 1988). In addition, a plastic sphere is suspended on a nylon string that scrapes off snow from the intake through wind-driven movements.
Operating characteristics and preliminary results
The first two field seasons were mainly used for prototype testing since realistic climatic conditions can only be obtained on the Icecap and since mainten- ance and inspection were limited to one annual sum- mer visit. These limitations have to some extent been counteracted by semi-annual inspections of the identi-
I motet
• Fdsbee" t, arnoier
2. summer surface
I. summer sucface
Battery box In k~uloflng box
Fig. 6. The experimental set-up for the Icecap Experiment at Summit.
cal equipment at Station Nord which is somewhat more accessible. Among the errors encountered and subsequently corrected, mention should be made of static electricity that seems to have caused computer malfunctions and untimely stops. This was counter- acted with an earth-connected metal foil wrapping. Also, condensation and subsequent freezing caused the sub-surface part of the intake line to be blocked early in the second season. The remedy was to widen the suction tube below the snow surface. With the improvements introduced the prototype appears to have been developed into an operational instrument. In the third season, 1991-1992, an almost complete set of about 40 samples were retrieved. Thus, aerosol samples covering also the winter season at the central Icecap have been obtained for the first time.
The samples are still under analysis so results are as yet preliminary. In particular, the dating of the sam- ples has met with difficulties because of apparent double or multiple exposures in the latter third of the period. It does appear, however, that an episode of both anthropogenic and crustal aerosols occurred in the first half of November 1991 where concentrations over 1-2 weeks were larger by factors of 3-4. It was replaced by a weaker and somewhat overlapping episode of apparently marine character. The winter period proper appears, however, to be characterized by very clean air. It was not until a still undated week in spring that a new episode occurred, considerably weaker than the November incident. Thus, the pre- liminary Summit data indicate that tropospheric aero- sols only penetrate into the central elevated Icecap at times of seasonal transitions and only episodically. These findings agree with results reported recently from 1988-1989 at Dye 3 at an elevation of 2000 m (Jaffrezo and Davidson, 1993) and with the tentative conclusion that the Ice Sheet is above the elevation of much of the arctic haze found at sea level sites. It appears that in winter the mid-troposphere at Summit is quite insulated from the lower arctic troposphere and the arctic haze occurring here regularly at this time of year (Heidam, 1984; W~thlin, 1993). These conclusions are, however, still very tentative.
Acknowledgements--The valuable contribution to the Icecap Experiment from Jens Tscherning Moiler at the instrumental workshop is gratefully acknowledged. The SAGA projects have in the various phases been partly supported by grants from the Nordic Ministerial Council and the Danish Natural Science Research Council.
REFERENCES
AGASP (1984) Arctic gas and aerosol sampling program. Geophys. Res. Lett. 11 (5).
Arctic Air Chemistry (1977) Sources and significance of natural and man-made aerosols in the Arctic. Proc. I. Int. Symp. NILU, Norway, June 1977.
Arctic Air Chemistry (1981) Proceedings of the II Interna- tional Symposium 1980. Atmospheric Environment 15, No. 8, Special Issue.
3036 N.Z. HEIDAM et al.
Arctic Air Chemistry (1985) Proceedings of the III Interna- tional Symposium 1984. Atmospheric Environment 19, No. 12, Special Issue.
Arctic Air Chemistry (1989) Proceedings of the IV Interna- tional Symposium 1987. Atmospheric Environment 23, No. 11, Special Issue.
Arctic Air Pollution (1986) Proceedings of a Symposium 1985 (edited by Stonehouse B.). Cambridge University Press, Cambridge.
Busenberg E. and Langway C. C. Jr (1979) Levels of ammo- nium, sulfate, chloride, calcium and sodium in snow and ice from southern Greenland. J. geophys. Res. 84C, 1705-1709.
Finkel R. C., Langway C. C. Jr and Clausen H. B. (1986) Changes in precipitation chemistry at Dye 3, Greenland. J. geophys. Res. 91D, 9849-9855. '~
Hall D. J. and Upton S. L. (1988) A wind tunnel study of the particle collection efficiency of an inverted Frisbee used as a dust deposition gauge. Atmospheric Environment 22, 1383-1394.
Harman H. H. (1976) Modern Factor Analysis, 3rd revised edition. The University of Chicago Press, Chicago.
Heidam N. Z. (1982) Atmospheric aerosol factor models, mass and missing data. Atmospheric Environment 16, 1923-1931.
Heidam N. Z. (1984) The components of the arctic aerosol. Atmospheric Environment lg, 329-343.
Heidam N. Z. (1985) Crustal enrichments of the arctic aerosol. Atmospheric Environment 19, 2083-2097.
Jaffrezo J.-L. and Davidson C. I. (1993) Sulfate and MSA in air and snow on the Greenland Icesheet. In Proc. V Int. Syrup. Arctic Air Chemistry, Denmark, September 1992. National Environmental Research Institute, Denmark. NERI Technical Report No. 70.
Kemp K. and W~hlin P. (1993) Aerosol sampler for un- attended all-year sampling at remote sites. In Proc. V Int. Syrup. Arctic Air Chemistry, Denmark, September 1992. National Environmental Research Institute, Denmark, NERI Technical Report No. 70.
Mayewski P. A., Lyons W. B., Spencer M. J., Twickler M., Dansgaard W., Koci B., Davidson C. I. and Honrath R. E. (1986) Sulfate and nitrate concentrations from a south Greenland Icecore. Science 232, 975-977.
Murozumi M., Chow T. J. and Patterson C. (1969) Chemical concentrations of lead aerosols, terrestrial dusts and sea salts in Greenland and antarctic snow strata. Geochim. Cosmochim. Acta 33, 1247-1294.
Ottar B., Gotaas Y., Hov O., Iversen T., Joranger E., Oehme M., Pacyna J., Semb A. and Vitols V. (1986) Air pollutants in the Arctic. NILU Report OR 30/86.
W~hlin P. (1993) A receptor model applied to aerosol data from northeastern Greenland. Proc. V Int. Syrup. Arctic Air Chemistry, Denmark, September 1992. National Envir- onmental Research Institute, Denmark. NERI Technical Report No. 70.
Weiss H., Koide M. and Goldbcrg E. D. (1971) Selenium and sulphur in a Greenland Ice Sheet: relation to fossil fuel combustion. Science 172, 261-263.
Recommended


![[RPG] d20 - Greenland Saga](https://img.pdfslide.tips/doc/110x75/577d35c81a28ab3a6b916516/rpg-d20-greenland-saga.jpg)