
உऔऔं ंश्री गुरवे सरणं
Universidade de Aveiro
2013
Departamento de Engenharia de Materiais e Cerâmica
Arivumani Ravanan Processamento e tenacificação de compósitos de fase metálica e carbonetos duais
Processing and Toughening of Dual-Metallic Phase Dual-Carbide Composites
உऔऔं ंश्री गुरवे सरणं
Universidade de Aveiro
2013
Departamento de Engenharia de Materiais e Cerâmica
Arivumani Ravanan
Processamento e tenacificação de compósitos de fase metálica e carbonetos duais
Processing and Toughening of Dual-Metallic Phase Dual-Carbide Composites
Dissertação apresentada à Universidade de Aveiro para cumprimento dos requisitos necessários à obtenção do grau de Mestre do mestrado europeu EMMS - Mestrado Europeu em Ciência dos Materiais, realizada sob a orientação científica do Doutor Joaquim Manuel Vieira Professor Catedrático do Departamento de Engenharia de Materiais e Cerâmica da Universidade de Aveiro. Dissertation presented to University of Aveiro for the requirement of partial fulfillment of the Masters of Science degree European EMMS Masters - Joint European Master in Materials Science under supervision of Doctor Joaquim Manuel Vieira, Full Professor in the Department of Materials and Ceramic Engineering of the University of Aveiro.
உऔऔं ंश्री गुरवे सरणं
Universidade de Aveiro
2013
Departamento de Engenharia de Materiais e Cerâmica
o júri
Presidente Arguente Vogal Orientador
Professora. Drª. Maria Margarida Tavares Lopes de Almeida, Professora Auxiliar da Universidade de Aveiro Professor Dr. Manuel Fernando Gonçalves Vieira, Professor Associado da Universidade do Porto - Faculdade de Engenharia
Doutor Filipe José Alves de Oliveira, Equiparado a Investigador Auxiliar da Universidade de Aveiro Professor Dr. Joaquim Manuel Vieira, Professor Catedrático da Universidade de Aveiro
உऔऔं ंश्री गुरवे सरणं
Universidade de Aveiro
2013
Departamento de Engenharia de Materiais e Cerâmica
acknowlegments
I am thankful to my supervisor Professor Dr. Joaquim M. Vieira for the guidance in the work as in the philosophy of science which enabled me to develop and conclude this dissertation. I also would like to extend my gratitude to my co-supervisor Professor Dr. Patrick Huber of Technical University Hamburg-Harburg for his time in reviewing the thesis under the Erasmus Mundus in Materials Science program. I am also very thankful to Professor Dr. Augusto Luís Barros Lopes for his useful advice and Dr. Filipe J. Oliveira for his support during mechanical experiments. I am also very grateful to Professor Dr. Joachim Albrecht for his valuable guidance in TUHH and also to Dr. Karl-Heinz Schwalbe and Dr.Prof. Jörg Müller in TUHH. And I convey my hearty thanks to my program co-ordinators and teachers Professors Dr. Vitor S. Amaral and Dr. Florinda M. Costa of UA for their support for completing this course. I oblige my deepest thanks to my scientific co-ordinators Professors Drª Margarida M. Almeida and Dr. Hans Wittich of UA and TUHH, respectively, for their guidance during my initial period of these studies. I wish to share my thanks to all the members of Department of Materials and Ceramic Engineering especially Ms.Célia Cristina Miranda, Ms. Alexandra Vale Martins, Ms. Maria João Bastos, Mr. Octavio Santos Contente, and also thanking the PhD. scholars MSc Diogo Mata, Muhammad Asif Rafiq and Devaraj Ramasamy Nadar and pos-doctoral fellows Dr. Flávia Aparecida de Almeida and Dr. Miguel Neto My hearty regards to all my friends, family and other officials of UA and TUHH who supported me by all the ways and they are many, however a few to mention here are Drª. Lúcia Avelar, Dr. Niall Power, Mr.Sivakumar Rajendiran, Ms.Vijayalakshmi Srikanth, Ms.Harini Sampathkumar and Maha Meru Mandali. And my sincere thanks to another hand of this experimental work MSc Bruno Almeida, for his supporting during all experiments and electron microscopy, useful comments and helpful suggestions in this work. And my obedient gratitude to the almighty of God and the Master who has been educating me as well. I would like to thank the EMMS consortium for the program and the European Commission for the scholarship. I also acknowledge RNME – Pole University of Aveiro (FCT Project RED/1509/RME/2005) for grating the use of the Hitachi SU-70 SE-SEM with the Bruker QUANTAX 400 high yield EDS system and for scientific and technical assistance.
உऔऔं ंश्री गुरवे सरणं
Universidade de Aveiro
2013
Departamento de Engenharia de Materiais e Cerâmica
palavras-chave
Liga de Al-Si, carboneto de boro, carboneto de silício, infiltração reactiva, compósitos, dureza, tenacidade, diagramas de fases.
resumo
Este trabalho incide sobre o processamento e estudo da tenacificação dos compósitos de fase metálica dual e dupla fase de carbonetos, com B4C e SiC, e utiliza a técnica infiltração reactiva da liga fundida para preparar amostras quase totalmente densas dos compósitos. Lotes de ligas hipereutécticas de Al-Si fundidas uma e duas vezes foram produzidas a partir de pós de alumínio e de silício, na proporção de 25% em peso e 35% em peso de Si e tendo-se feito a fusão a 1000 ºC durante 60 minutos em atmosfera de argon. Utilizou-se um pó de carboneto de boro de 10 um de tamanho médio de partícula, com carbono livre, principalmente grafite, para preparar provetes cilíndricos, de 7,5 mm de altura e densidade relativa nominal de 50%, por prensagem uniaxial seguida de prensagem isostática a frio. O fundido reactivo da liga de Al-Si infiltra espontaneamente as preformas de B4C às temperaturas de 1200 ºC e 1300 ºC, em 5 minutos, tendo-se utilizando um forno de resistência de grafite com uma atmosfera inerte de árgon. No estudo descrevem-se os defeitos relacionados com a infiltração e são discutidas as condições experimentais e da contaminação em oxigénio da atmosfera do forno e da liga que poderiam ter causado a infiltração parcial ou a ausência de infiltração das preformas de B4C. Obteve-se um conjunto de amostras dos compósitos totalmente infiltradas representando diferentes proporções de Si no infiltrado e as duas temperaturas em que a infiltração se tornou exequível dentro do intervalo de condições experimentais deste estudo. Seções polidas longitudinais dos provetes foram investigadas através de métodos quantitativos de DRX com padrões para a determinação das fracções volúmicas das principais fases cristalinas, Al, Si, B4C e SiC e a microscopia electrónica de varrimento com análise de energia dispersiva sem padrão SEM/EDS para distribuição dos elementos na composição das fases. Os percursos de reacção no interior dos compósitos tendo em conta as alterações na fracção volúmica das fases entre a face superior, a face infiltração do fundido, e a face inferior dos provetes fundo foram representados na secção isotérmica do diagrama de fases Al-Si-B4C. As correspondentes representações da composição química elementar média dos compósitos nos diagramas de fases de Al-Si-C e Al-Si-B-C põem em evidência o elevado teor de Al nos compósitos, principalmente Al metálico, o que explica os valores de dureza comparativamente baixos. Um efeito do tamanho de indentação é observado na dureza Vickers para as cargas de indentação de 9,8 N, 98 N e 294 N, estando a dureza aos 98 N correlacionada com a concentração de Si no infiltrado de Al-Si. Apesar da dispersão de valores da tenacidade à fractura de indentação determinada a 98 N, a valores altos da tenacidade dos compósitos deste estudo estão correlacionados com os valores relativamente baixos de dureza da mesma maneira como se encontrou nos resultados recentemente publicados de um estudo semelhante de infiltração reactiva de

உऔऔं ंश्री गुरवे सरणं
Universidade de Aveiro
2013
Departamento de Engenharia de Materiais e Cerâmica
compósitos B4C com ligas Al-Si com teor de Si mais elevado. Procurou-se discutir ainda a forma como o mecanismo de tenacificação poderá depender das distribuições das fases frágeis e da fase dúctil de Al e bem como do desligamento do Al nas interfaces com as fases cerâmicas.

உऔऔं ंश्री गुरवे सरणं
Universidade de Aveiro
2013
Departamento de Engenharia de Materiais e Cerâmica
keywords
Al-Si alloy, boron carbide, silicon carbide, reactive melt infiltration, composites, hardness, toughness, phase diagrams
abstract
This work on the processing and study of the indentation fracture composites of dual-metallic phase of Al-Si and dual carbide phase of B4C and SiC uses the reactive melt infiltration method to prepare nearly fully dense samples. Batches of single and twice smelted Al-Si alloys of hypereutectic composition were produced by mixing aluminium and silicon powders in the proportion of 25 wt% and 35 wt% Si and melting at 1000 ºC for 60 minutes in argon atmosphere. Boron carbide powder of 10 µm average particle size, containing free carbon, mostly graphite, was used to prepare nominally 50% dense cylindrical pellets of 7.5 mm of height by uniaxial pressing followed by cold isostatic pressing. B4C preforms become spontaneously infiltrated by the reactive melt of the Al-Si alloy at 1200 °C and 1300 °C in 5 minutes using a resistive heated graphite furnace with inert argon atmosphere. Defects related to infiltration are described in the study, the conditions and contamination in oxygen of the alloy and furnace atmosphere that could have caused partial or absence of infiltration of the B4C preforms are discussed. A set of fully infiltrated samples of the composites was obtained representing different Si proportions in the infiltrate and two temperatures where infiltration became feasible within the range of experimental conditions of this study. Polished longitudinal sections of the pellets were further investigated by using quantitative XRD methods with standards for the volume fractions of the main crystalline phases, Al, Si, B4C and SiC and scanning electron microscopy with standard-less energy dispersive analysis SEM/EDS for the element distribution in the phases. The reaction path accounting for changes in the volume fraction of the phases from top, the melt infiltration face, to the bottom areas were represented in isothermal section of the Al-Si-B4C phase diagram. The corresponding representations of the average elemental composition of the composites in the Al-Si-C and Al-Si-B-C phase diagrams expose a large content of Al, mostly Al metal in the composites which explains the comparatively low values of hardness. An indentation size effect of the Vickers hardness is observed for indentation loads of 9.8 N, 98 N and 294 N, the hardness of the composites determined at 98 N being correlated to the Si concentration of the Al-Si infiltrate. In spite of the scatter of indentation fracture toughness determined at 98 N, the high values toughness of the composites in this study are correlated to the comparatively low values of hardness in the same way as recently published in a similar study of reactive melt infiltration of B4C composites with Al-Si alloys of high Si content. The way the toughening mechanism may depend on the distribution of the brittle phases and ductile Al and interphase de-bonding is further discussed.

Processing and Toughening of Dual-Metallic Phase Dual-Carbide Composites 2013
i
TABLE OF CONTENTS உ औ ंश्री गुरवे सरणं உ औ ंश्री गुरवे सरणं
TABLE OF CONTENTS ..................................................................................................... i
LIST OF FIGURES ............................................................................................................. v
LIST OF TABLES ............................................................................................................ xiii
SYMBOLS AND ABBREVIATIONS ............................................................................. xv
1.0 INTRODUCTION .................................................................................................... 1
2.0 STATE OF ART ....................................................................................................... 7
2.1 BORON CARBIDE ...................................................................................................... 9
2.1.1 B-C phase diagram............................................................................................ 11
2.1.2 Mechanical behavior ........................................................................................ 12
2.1.3 Chemical behaviour and oxidation of B4C ........................................................ 15
2.2 SILICON CARBIDE ................................................................................................... 16
2.2.1 Si-C Phase diagram .......................................................................................... 19
2.2.2 Chemical stability of SiC ................................................................................... 20
2.2.3 Mechanical behaviour of SiC ............................................................................ 20
2.3 ALUMINIUM-SILICON ALLOYS ..................................................................................... 21
2.3.1 Properties of Aluminium-Silicon alloys ............................................................ 23
2.3.2 Mechanical properties of the Al-Si alloys ......................................................... 25
2.4 REACTIVE MELT INFILTRATION .............................................................................. 27
2.4.1 Melt infiltration controlled by viscous flow ..................................................... 28
2.4.2 Wetting Phenomena........................................................................................... 30
2.4.3 Capillary Phenomena ........................................................................................ 32
2.4.4 Reactive infiltration of intermetallics and composites ...................................... 33
Processing and Toughening of Dual-Metallic Phase Dual-Carbide Composites 2013
ii
2.5. TERNARY PHASE DIAGRAMS WITH BORON CARBIDE ............................................... 36
2.5.1 Al-B-C ternary system ....................................................................................... 37
2.5.2 B-C-Si ternary system ....................................................................................... 38
3.0 EXPERIMENTAL PROCEDURE ....................................................................... 41
3.1 PREPARATION OF B4C PREFORMS .......................................................................... 41
3.1.1 B4C powders ...................................................................................................... 41
3.1.2 B4C preform preparation process ..................................................................... 41
3.2. PREPARATION AND MELTING OF THE ALUMINIUM-SILICON ALLOYS ...................... 45
3.3. MELT INFILTRATION PROCESS ................................................................................ 48
3.4 SAMPLE PREPARATION AND CHARACTERIZATION BY XRD AND SEM/EDS .......... 51
3.5 INDENTATION HARDNESS AND FRACTURE TOUGHNESS MECHANICAL TESTS .......... 54
4.0 RESULTS AND DISCUSSION ............................................................................. 59
4.1 CHARACTERIZATION OF B4C POWDER AND GREEN DENSITY OF THE PREFORMS ..... 59
4.1.1 Free carbon content of the B4C powder ........................................................... 60
4.1.2 Thermal analysis of the B4C powders ............................................................... 63
4.1.3 Pressing efficiency of the B4C powder .............................................................. 65
4.2. CHARACTERISATION OF THE Al-Si ALLOY ............................................................. 67
4.3. Al-Si REACTIVE MELT INFILTRATION OF B4C ......................................................... 72
4.3.1 Failure of the melt infiltration process ............................................................. 75
4.3.2 Partial melt infiltration of B4C preforms ........................................................... 77
4.4. STRUCTURAL EVOLUTION AND CHARACTERIZATION OF THE COMPOSITES ............. 81
4.4.1 General characterization of the composites ..................................................... 81
4.4.2 XRD and SEM/EDS analysis of the composites ................................................ 82
4.4.2.1 Composite A ............................................................................................. 84
Processing and Toughening of Dual-Metallic Phase Dual-Carbide Composites 2013
iii
4.4.2.2 Reaction path in the Al-Si-B4C ternary diagram ....................................... 90
4.4.2.3 Composite B .............................................................................................. 91
4.4.2.4 Composite C .............................................................................................. 95
4.4.3 Comparison of phase composition of the composites .................................... 100
4.4.4 Al-Si-C Ternary phase diagrams.................................................................... 105
4.4.5 Al - Si - B -C Quaternary Phase Diagram .................................................... 107
4.5. MECHANICAL PROPERTIES OF THE COMPOSITES ................................................... 111
4.5.1. Microhardness ................................................................................................ 112
4.5.2. Macrohardness ............................................................................................... 116
4.5.3 Indentation fracture toughness....................................................................... 123
5.0 CONCLUSIONS ................................................................................................... 133
BIBLIOGRAPHY ............................................................................................................ 139
ANNEXES ........................................................................................................................ 151
ANNEX - A ...................................................................................................................... 153
ANNEX - B ...................................................................................................................... 157
ANNEX - C ...................................................................................................................... 161
ANNEX - D ...................................................................................................................... 165

Processing and Toughening of Dual-Metallic Phase Dual-Carbide Composites 2013
iv
Processing and Toughening of Dual-Metallic Phase Dual-Carbide Composites 2013
v
LIST OF FIGURES
Figure 2.01: Interdependence of microstructural, physical, mechanical and chemical
properties in designing a metal matrix composite. ……………………...….8
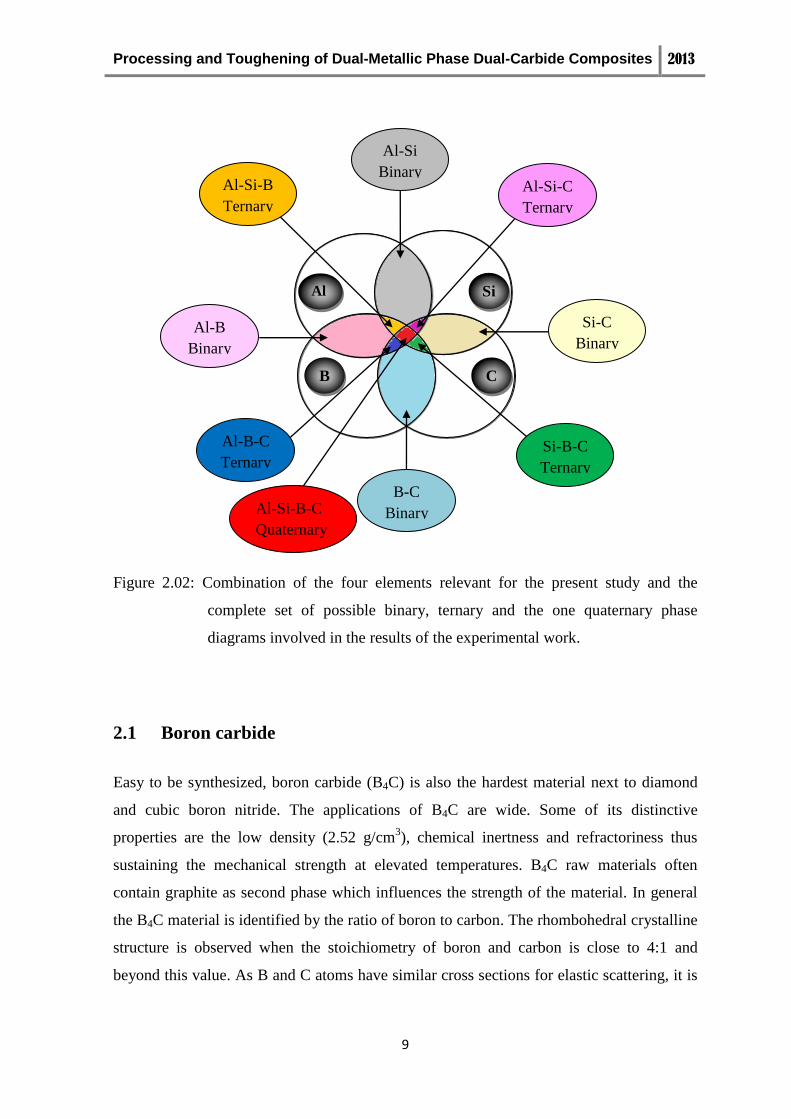
Figure 2.02: Combination of the four elements relevant for the present study and the
complete set of possible binary, ternary and the one quaternary phase
diagrams involved in the results of the experimental work ………………. 9
Figure 2.03: Rhombohedral crystalline structure of B4C …………….…………...……....10
Figure 2.04: The B-C binary phase diagram: (a) calculated, (b) from experimental
results………………………………………………………………...…….11
Figure 2.05: Variation of E/(1 - ʋ2) ratio versus the carbon concentration LPCVD coatings
deposited at 1020 ºC in which (1) B50C2, (2) B50C2+B13C2, (3) B13C2 (
0.2 is the Poisson ratio)………………..….………………………………..12
Figure 2.06: (a) Schematic positions of atom centers for a close spherical packing
(b) Stacking of successive layers of Si and C in polytypes of SiC ............17
Figure 2.07: SiC polytypes with images of the atom arrangement of the crystalline lattices,
(a) Single crystals of SiC polytypes (b) Hexagonal crystal lattice of α-SiC
(6H-polytype) and, (c) Cubic crystal lattices of β-SiC (3C-polytype) …....18
Figure 2.08: The binary phase diagram of the Si-C system …..……………….……..…...19
Figure 2.09: Crystal structure of aluminum and silicon (a) Crystalline cell of the Al cubic
lattice, (b) Elementary cell of Si the crystalline lattice …..………….....….22
Figure 2.10: Al-Si equilibrium binary phase diagram …..…………..…………...………..22
Figure 2.11: Microstructure of a hypereutectic Al-Si alloy ………...………..........…..….24
Figure 2.12: Density of Al-Si alloy as a function of Si content in wt% …..……….........24
Processing and Toughening of Dual-Metallic Phase Dual-Carbide Composites 2013
vi
Figure 2.13: Dependence of Young modulus of Al–Si alloys on Si content (1) results of
levitated melt and (2) results of conventional casting in mould …....….....25
Figure 2.14: Correlations of the change of Young modulus with Si content after heat
treatment of the Al-Si alloys to 500 ºC …..…………………...……...........26
Figure 2.15: The dependence of the shapes of partially wetting liquid droplets on the
equilibrium of surface tension in accordance with Young's equation: (a)
Poor wetting, and (b) Wetting .………………………………………..…31
Figure 2.16: Capillary pressure across a curved interface with surface tension γ................32
Figure 2.17: Dependence of the wetting angle on temperature in graphite wetting by the
Al-Si melts .……………………………...………………………….…..…35
Figure 2.18: B - Al - C ternary phase diagram at 1400 ºC .………….………………...…37
Figure 2.19: Isothermal section at 1727 ºC of the Si - B - C ternary phase diagram..…….39
Figure 3.01: Flow diagram of B4C preform preparation process …………....………........42
Figure 3.02: Granulated mixture of B4C powder and PVA solution………………...……43
Figure 3.03: Uni-axial pressing of as prepared the B4C powder with addition of PVA .....44
Figure 3.04: Process flow diagram of fusion Al-Si alloys ..................................................45
Figure 3.05: Apparatus inside the resistance furnace chamber for fusion of Al-Si alloys..46
Figure 3.06 Heating cycle, temperature holdings and cooling cycle in the fusion of Al-Si
alloys ..............................................................................................................47
Figure 3.07: Flow diagram of the melt infiltration process .................................................48
Figure 3.08: Assembly of samples inside the furnace chamber for melt infiltration ..........49
Figure 3.09: Time-temperature cycles of different melt infiltration runs ..........................50
Processing and Toughening of Dual-Metallic Phase Dual-Carbide Composites 2013
vii
Figure 3.10: Cross sectioned composites (one half is acrylic mounted) .............................52
Figure 3.11: Indication of points on the cross-section of the composite (top, middle and
bottom) selected for Hv10 macrohardness testing .......................................56
Figure 3.12: Indentation fracture. (a) Scheme of Vickers indentation radial/median crack
system, (b) Measurement of the radial crack length, c, on a SEM image for
determining the indentation fracture toughness KIC ......................................57
Figure 4.01: Crystalline phases of the 10µm B4C powder as detected in two separated
XRD Tests ......................................................................................................60
Figure 4.02: X-ray diffraction spectra of the as supplied 10µm and 18µm B4C powders
and their mixtures; results of two independent tests ......................................61
Figure 4.03: Simultaneous DTA/TG analysis in air: a) 10 m B4C powder, b) 18 m B4C
powder ............................................................................................................64
Figure 4.04: Values of the corrected relative density of isostatic pressed B4C preforms
determined for control of the process, X and Y in the text .........................67
Figure 4.05: XRD result of Al-Si alloys of fusion batches (1) to (4) ..............................69
Figure 4.06: Dendrite formation in star like agglomerates of Si in the Al-35 wt% Si
alloy.………………………………………………………………….....…70
Figure 4.07: Bulky dendrite formation in Al-25 wt.% Si alloy of fusion batch ….....….71
Figure 4.08: Cross sectioned view of a melt infiltrated B4C composite - spreading of the
alloy along a thin flaw of the porous medium, (arrow mark indicates the
direction of infiltration from the top side) ……..............................…….....73
Processing and Toughening of Dual-Metallic Phase Dual-Carbide Composites 2013
viii
Figure 4.09 : esults of one infiltration run done at 1300 C in the resistance heated graphite
furnace, (A) Non-infiltrated B4C preform; (B) remnants of the Al-Si alloy on
top of preform; (C) thin layer of Al2O3; (D) Al2O3 plate; (E) and (F)
successful infiltrated composites (IV) and (V) respectively with excess Al-Si
alloy left on top …….............................................................………..……...76
i ure 4.10 Cross sectioned iew of composite- , infiltrated at 1300 C for 5 minutes with
a non-infiltrated volume in the middle region ...........................................…78
Figure 4.11 : Cross sectioned view of the composite-I, infiltrated at 1300º C for 5 minutes
with a depression of the liquid Al-Si alloy surface due to slow down of
infiltration acted by surface tension forces .............................................…...79
Figure 4.12: Cross-sectioned view of two composites with irregularly shaped flaws with
non-infiltrated volumes– composite VI (top) & VII (bottom) ……..........….80
Figure 4.13: XRD patterns of the longitudinal cross section of composite A: a) from top
(T), middle (M) and bottom (B) areas; b) Enlarged view of XRD pattern of
bottom (B) zone, () Al4C3 and traces of () Al3B48C3 (traces) ………..…84
Figure 4.14: EDS maps of the elements of SEM microscopy of bottom zone of composite
of A: (a) Si; (b) Al and Si; (c) B and (d) with all four elements Al, Si, B
and C ……...….................................……………………………………..86
Figure 4.15: Image of optical microscopy of composite A at 400X ………………...….87
Figure 4.16: EDS map of the elements of SEM microscopy of bottom zone of composite
of A ………………………………………………………..………..……..88
Figure 4.17: Plot of the phase composition in volume fraction in Al-Si-B4C ternary phase
diagram, at (T) top, (M) middle and (B) bottom areas of the longitudinal
cross section of composites A ( ), B ( ), and C ( ) …………....90
Figure 4.18: XRD spectra of the top, middle and bottom areas of the longitudinal cross
section of the pellet of composite B ………………………………..........….91
Processing and Toughening of Dual-Metallic Phase Dual-Carbide Composites 2013
ix
Figure 4.19: SEM microscopy of composite of B with EDS maps of (a) Al; (b) Si, (c) B
and (d) the full set of the elements Al, Si, B including C from top (T)
area……………………………………………………………………..……92
Figure 4.20: Image of optical microscope of a specimen of composite B, 1000X
magnification ………………………………………………………......…...93
Figure 4.21: SEM image of a specimen of composite B from Top (T) zone(Courtesy of
MSc Bruno A. Almeida, RNME - Rede Nacional de Microscopia
Eletrónica)……………………………………………………………..…..94
Figure 4.22: XRD patterns of top, middle and bottom areas of the longitudinal cross
section of composite C ………………………………………………….....96
Figure 4.23: EDS maps of the distribution of the elements of composite C done by SEM
microscopy: a) Al, b) Si, c) B and d) all the chemical elements Al, Si, B,
including C ……………………………………………………………….....97
Figure 4.24: Optical microscopy image of composite C, 400X magnification ………......98
Figure 4.25: SEM image of a specimen of composite C from middle (M) zone (Courtesy
of MSc Bruno A. Almeida, RNME - Rede Nacional de Microscopia
Eletrónica)…………………………………………………………………...………99
Figure 4.26: Average volumetric phase composition of composites A, B and C .............102
Figure 4.27:Distribution of crystalline phases in top (T), middle (M) and bottom (B)
regions of the longitudinal cross sections of composites A, B and C: a) Al
and B4C; b) Si and SiC ..............................................................................103
Figure 4.28: Al-Si-C ternary phase diagram adapted from Viala. (a) Isothermal section at
1000 ºC; (b) Isothermal section at 1497 ºC with projections of the
composition of composites A, B and C ........................................................106
Figure 4.29: Isothermal section of Al - Si - B- C quaternary phase diagram (in at.%)
between 1300 ºC -1497 ºC ...........................................................................108
Processing and Toughening of Dual-Metallic Phase Dual-Carbide Composites 2013
x
Figure 4.30: Distribution of values of Vickers microhardness HV (9.8 N) along the
direction transverse to the axis of the pellet at the top (T), middle (M) and
bottom (B) areas of the longitudinal cross sections of the composites: (a)
Composite A, (b) Composite B and (c) Composite C ..............................114
Figure 4.31: Image of optical microscopy of the microhardness indentation impression of a
point with HV = 6.7 GPa, 9.8N applied load on top (T) region of composite B
at 1000X magnification ................................................................................115
Figure.4.32: Image of optical microscopy of a Vickers indenter impression of
macrohardness (98N) measurement of composite C at 400X
ma nification……………………………………………………………117
Figure 4.33: Distribution of values of Vickers macrohardness HV (98 N) along the
direction transverse to the axis of the pellet at the top (T), middle (M) and
bottom (B) areas of the longitudinal cross sections of the composites: a)
Composite A, b) Composite B and c) Composite C ..................................119
Figure 4.34: Image of optical microscopy of a Vickers indenter impression of
macrohardness (294N) measurement of composite C at 200X
magnification..............................................................................................120
Figure 4.35: A comparison map of micro and macro and hardness of three composites A,
B and C at loads 9.8, 98N and 294 N……….............................................121
Figure 4.36: Dependence of Vickers hardness the composites on the Si fraction in the Al-
Si alloy used for reactive melt infiltration of B4C preforms, 29.4 N applied
load (Wu et al) ...........................................................................................123
Figure 4.37: SEM image of the pyramidal profile a 98 N Vickers indentation of
composite-C..................................................................................................126
Figure 4.38: SEM enlarged view of indentation fracture cracks of the pyramidal mark of a
98 N Vickers hardness test of composite C (corner of indentation mark to the
Processing and Toughening of Dual-Metallic Phase Dual-Carbide Composites 2013
xi
nearby right, not shown). Lateral cracks, transgranular fracture and crack
bridging indicated by arrows ........................................................................127
Figure 4.39: SEM image of a pyramidal profile of Vickers indentation of composite B at
98N load no radial cracks or crack branches nucleated at the indentation
corner, arrows mark indenter impression diagonal and grain dislodging with
matrix microcraking at the indentation edge ................................................128
Figure 4.40: SEM image of a pyramidal profile of the Vickers indentation of composite A
at 98N load, arrows mark the indentation diagonal, the nucleation of the
radial crack at the indentation corner and of a lateral crack at the indenter-
piece interface ..............................................................................................129
Figure 4.41: Interdependence of indentation fracture toughness and the Vickers hardness
of the RMI composites of Al-Si alloy reactive melt infiltrated into B4C
preforms (Wu et al) .....................................................................................130
உ औ ंश्री गुरवे सरणं

Processing and Toughening of Dual-Metallic Phase Dual-Carbide Composites 2013
xii
Processing and Toughening of Dual-Metallic Phase Dual-Carbide Composites 2013
xiii
LIST OF TABLES
Table 3.01: Mass calculation for the preparation of a 50% porous green pellet, of the Al-Si
alloy and mass of alloy needed for melt infiltration ………….………………42
able 4.01 elati e intensity of the 2 raphite 2 - 26 peak as percenta e of the
intensity of the 2 - 38 XRD main peak of the B4C phase for the as supplied
powders and mixtures of them in the given weight fractions …....…… …….62
Table 4.02: Samples of isostatic pressed B4C preform with its corrected green density,
relative density and the PVA solution added for binding …………...……..…65
Table 4.03: Composition of the Al-Si alloy batches after melting determined from
quantitative DRX measurements and calculated values of density …………..68
Table 4.04: Conditions selected for the preparation and melt infiltration of the B4C
composites and final values of density and relative density of the composites
……………………………………………………………………………….74
Table 4.05: Volume fraction of the three main phases of the composites on different zones
of the longitudinal cross sections of the melt infiltrated pellets: top (T), middle
(M) and bottom (B) ………………………………………………...…….…..83
Table 4.06: The processed parameters of composites with its calculated and measured
densities and evaluated volumetric phase composition ……….……….… ...101
Table 4.07: Composition of the composites given by the atomic fractions of the Al, Si and
C (in at.%)………...…………………………………………………………105
Table 4.08: Atomic fractions of the elements Al, Si, B and C in the overall composition of
the composites determined from the phase volume fractions (table 4.06) ….110
Table 4.09: Calculated hardness and Young modulus along with the measured values of
Vickers microhardness and macrohardness and indentation fracture toughness
of composites A, B and C ………………………………………...……….111

Processing and Toughening of Dual-Metallic Phase Dual-Carbide Composites 2013
xiv
உ औ ंश्री गुरवे सरणं

Processing and Toughening of Dual-Metallic Phase Dual-Carbide Composites 2013
xv
SYMBOLS AND ABBREVIATIONS
AB , AC - undeterminable unknowns, the XRD absorption coefficients for the given
peaks of the B4C and graphite phases respectively,
c - Length of radial crack taken from the center of the indenter impression to
the crack tip
dAl - Density of aluminium
dgb - Apparent density of the green body
dH2O - Density of water
dm - Density of liquid metal,
ds - Density of the solid (as B4C)
Ds - Equivalent spherical diameter of the loose particles in the porous bed.
dSi - Density of silicon,
E - Young modulus,
fI - Buoyancy force
g - Acceleration of gravity
H - Hardness
Hv - Vickers Hardness / HV1, HV10 and HV30 -Vickers hardness (Suffix 1, 10, 30
indicates the load applied in Kgs.)
K - Calibration constant of the method
K - Symmetric tensor of permeability of the porous medium, or
KIC - Fracture toughness
LCap - Capillary length
m - Mass,
P - Applied load,
P - Porosity fraction of the porous bed/Permeability coefficient of Darcy´s
equation
R1, R2 - Principal radii of curvature of the curved interface
rp - Average pore radius/ equivalent cylindrical pore radius of the open porosity
So - Specific surface area per unit of volume of the solids
Sw - Mass specific surface area of the powder.
Vs - Solid olume fraction or relati e density (ρ) of the preform
vs - Volume of the solid phase
Processing and Toughening of Dual-Metallic Phase Dual-Carbide Composites 2013
xvi
XC - Corresponding weight fraction of the C phase (graphite) in the sample
a - Tensile stress
- Gradient of pressure acting on the fluid
µ - Viscosity
2 - Diffraction angles (where, - Bragg angle)
at% - Atomic percentage
mAl - Mass of aluminium
mSi - Mass of silicon
ʋAl - Volume of aluminium,
ʋc - Volume of composite,
ʋo - Superficial velocity of the fluid (the infiltrate, liquid metal),
ʋp - Volume of pores
ʋSi - Volume of silicon
wt% - Weight percentage
γlv - Specific surface energy of liquid-vapour interface
γsl - Specific surface energy of solid-liquid interface
γsv - Specific surface energy of solid-vapour interface
Δp - Pressure difference across the curved liquid-vapour interface
- Contact angle (Wetting Phenomena)
ρ - Relative density
4-D - Four Dimensional (phase diagram)
CIP - Cold Isostatic Pressing
DTA - Differential Thermal Analysis
EDS - Energy Dispersive X-ray Spectroscopy
FCC - Face Centred Cubic;
LPCVD - Low Pressure Chemical Vapor Deposition
LPS - Liquid Phased Sintered
MRI - Melt Reactive Infiltration
SEM - Scanning Electron Microscope
TG - Thermo Gravimetric Analysis (TGA)
XRD/ DRX - X-Ray Diffraction
Processing and Toughening of Dual-Metallic Phase Dual-Carbide Composites 2013
1
1.0 INTRODUCTION
On account of the greater benefits of excellent combinations of properties of a few metal
ceramic composites which play a significant role in the modern industry, there is the need
to identify more economic and effective processing methods and to incorporate them in the
industrial practice. The subject of the experimental work as given by the titled of the
dissertation deals with processing and toughening of dual metallic phase dual carbide
composites where the processing and resulting properties of new combinations of metal Al-
Si alloys infiltrate into the low density B4C carbide matrix is explored to formulate metal
reinforced ceramic matrix composites of wide potential of use. Development of such
composites is dictated by the need of reduction in absolute weight ratio, increase in
strength to weight ratio, better toughness in combination with high neutron absorption of
boron containing materials. Also relevant for nuclear and non-nuclear use as advanced
composites are the expected high wear resistance, lower density and potentially high
impact resistance that gives them ballistic features. As such, this study in line with other
results of the research group[1] is an attempt to improve the understanding of these new
composites and gather data that may contributed to improved economic design procedures
and processing methodologies for achieving the best combination of attributes of the
metals and ceramics in light weight composites of better reliability.
The processing procedure was designed in the view of obtaining a good fracture toughness
preserving the hardness property through the use of a dual metallic phase that reacts with
the starting carbide in the matrix to produce dual carbide phases in the finished composite.
This research was undertaken and started with the following objectives: (i) processing of
metal ceramic composites (ii) studying their composition in phases, microstructure,
hardness and indentation fracture toughness, (iii) investigating the conditions of the liquid
metallic phases and carbide phases of the composites and quantification of the dual
metallic and dual carbide phases using reference standards (iv) characterizing the
mechanical behavior of the composites.
The key materials of this work are aluminium, silicon and boron carbide powders in the
pure form. The inherent quality and characteristics of these materials in various
combinations and processing methods provide the required tailor made composites. When
alloying the aluminium with silicon a material of even lower density which also increases
Processing and Toughening of Dual-Metallic Phase Dual-Carbide Composites 2013
2
the fluidity of the melt a reduction of the melting temperature is anticipated and a decrease
in the shrinkage and residual porosity related with solidification is expected. On account of
the least solubility of silicon in aluminium, phases separate and virtually pure silicon forms
hard precipitates which generally improves the abrasion resistance.
Boron carbide is an important ceramic material by itself with outstanding hardness,
excellent mechanical and thermal properties. The attribute of a large cross section for
thermal neutrons makes it an attractive candidate for absorption or retardation of neutron
radiation in power plants and as well as in first-wall coating in fusion reactors. It has found
applications in the fields of micro-electronics, nuclear, military, space and medical
technologies. It has a low density (2.52g/cm3) comparable to the density of silicon (2.34
g/cm3) or the aluminium (2.70 g/cm
3). A few expected qualities of B4C composites object
of this experimental work, the better toughness in combination with the mentioned above
high neutron absorption have activated the interest in lower weight and high strength
aluminium-boron carbide composites. Moreover, the study of the phase equilibrium of
combinations of these two materials (B4C and Al) set the standing conditions for adequate
processing; especially of the temperatures which promote the wetting to high level, yield
better control of reactions and properly designed microstructures. The presence of the
silicon improves the wetting and accelerates the penetration of the molten alloy into the
porous medium. Indeed, a good wetting between ceramic and metal phases is needed in
order to accomplish fully infiltrated composites.
In this work, a method seen as economic, the reactive infiltration is used for bonding B4C
into a ceramic structure apart from the other two conventional processes such as hot
pressing and pressure-less sintering with solid or liquid phase sintering aids. Conventional
hot-pressing methods need extra pressure with high fabrication temperature (>1800 °C)
and high sintering temperature (2000 °C – 2400 °C) is required for pressure-less sintering
process and both are more expensive methods [2]. At the same time, reaction bonding
method is a spontaneous infiltration process where a molten metal can penetrate into the
pore channels of a powder, fiber or pre-sintered preform by capillary pressure of the liquid
that wets the solid. Spontaneous infiltration demands good wetting between two main
phases of the process. For a solid liquid phase system with suitable surface free energy,
infiltration can be used to achieve full density, preserve dimensions with precision, save
Processing and Toughening of Dual-Metallic Phase Dual-Carbide Composites 2013
3
the geometry of the pieces and assure good bonding of the composites. And in such
process no external pressure has to be applied by any mode [1].
In the present process, initially uni- axially pressed and iso-static compacted porous B4C
preforms were been prepared to achieve 50% of nominal porosity. In a resistance heated
graphite furnace, the Al-Si alloy (range of 25 wt% Si to 35 wt% Si) was fused by twice
smelting, cut into bits and compacted by pressing. By the effect capillary pressure the
prepared uni-axially pressed Al-Si alloy in a protective atmosphere of argon gas infiltrates
into the porous B4C pre-forms in the temperature range of 1200 °C or 1300 °C after a five
minute duration of time at the maximum infiltration temperature. The successful
infiltration provided the dual metallic phase dual carbide composites of various grades due
to various combinations of alloys and parameters used.
As the chemical interaction between the molten Si and B4C is strong, the carbon of boron
carbide can dissolve into to the metallic phase to form SiC in a significant level. Apart
from formation of aluminum- silicon phases the newly fabricated dual carbide phases such
as silicon carbide and boron sub-carbides took a significant role in the investigation. The
major goal of this research work is producing a tough, reliable ceramic composite.
The experimental work was planned under the assumption that in order to obtain a tougher
composite the metallic Si content in the reactive melt infiltration composite should be kept
to a minimum favouring the maximum volume fraction of the tough metallic Al phase [2],
provided that the Si content would be maintained above a threshold of Si in the Al-Si alloy
that inhibits the formation of Al4C3 carbide [1]. These kind of metal ceramic composites
have previously recorded values of the fracture toughness of less than 4 MPa.m1/2
[1]whereas in this experimental work, the processes, procedure, and combination of
materials are newly designed to the anticipated toughness limit of nearly 9 MPa.m1/2
.
In the structure of this dissertation, the state of art of this work has been prepared by
studying the history of the related materials, their properties, processes and applications. It
was then drafted with necessary things in brief form. The chapter on the experimental
procedure comprises the preparation of the ceramic powder, smelting of alloys and
infiltration processes along with sort description of main equipments, techniques and
methods of this study. It also deals with the methodologies such as sample preparation and
Processing and Toughening of Dual-Metallic Phase Dual-Carbide Composites 2013
4
characterization by XRD, SEM/EDS and indentation hardness and fracture toughness
mechanical tests.
The characterisation of as supplied B4C powder was done by analysing the constituents
and contribution of in free carbon by XRD tests and thermal analysis (DTA/TG). The
pressing efficiency of the B4C materials used for the preform was determined too. The
influence of the various compositions of the Al-Si alloy and the characterisation results
were described. The Al-Si reactive melt infiltrations of B4C, the consequences of failure of
the melt infiltration process, partially and fully infiltrated composites were reported with
the support of images. These elements are presented and discussed in the first three
sections of the chapter on results and discussion.
Three successfully impregnated composites which were prepared from various
compositions and processing parameters were separated and used for further investigation
of properties such as the structural evolution, physical, chemical and mechanical
characterization. Based on the appearance, performance during sample preparation the
results of XRD and SEM/EDS analysis were used to characterised the composites and do
the representation of their composition in Al-Si-B4C ternary diagrams. With the aid of
standards related to this experimental work, the quantification of individual phases of the
composites was done and the volumetric phase distribution of each composite was
determined. The comparisons of the composites were conducted based on the SEM/EDS
analysis and volumetric phase distribution of composites. The characterisations and the
comparisons among the composites were supported by the graphical and pictorial
representations. For this investigation on the distribution of phases each composite was
divided in three zones top, middle and bottom with respect to the infiltration direction
hence details of the changes occurring inside each region were obtained.
By applying the elemental fraction method and the phase quantification by quantitative
XRD methods with standards the amounts of individual elements and of each crystalline
phases in the composition of the composites were determined. The identification and
location of carbides of each composite were done by preparing isothermal section Al-Si-C
ternary phase diagram. For the in depth investigation of the process a related isothermal
section of Al - Si - B -C quaternary phase diagram was composed where the composition
of the each composite as derived is plotted and further discussed in the text.

Processing and Toughening of Dual-Metallic Phase Dual-Carbide Composites 2013
5
The mechanical behaviours of the composites were evaluated by the results of
microhardness and marcohardness test conducted at the loads of 9.8 N, 98 N and 294 N.
The discussion of the elastic modulus, fracture toughness and the toughening mechanism
of the composites were further done. Some supplementary images and tables are given in
annexes.

Processing and Toughening of Dual-Metallic Phase Dual-Carbide Composites 2013
6
உ औ ंश्ररे् गुरवे सरण ं
Processing and Toughening of Dual-Metallic Phase Dual-Carbide Composites 2013
7
2.0 STATE OF ART
The objective of the Masters work is the study of ´Processing and toughening of dual
metallic phase dual carbide composites´. In relation to this theme a bibliographic review of
different types of sources, research articles, book chapters, conference proceedings and
doctoral thesis works was done and is succinctly presented in this chapter of the
dissertation. The past background on the materials, methods and processes involved in this
research are handled at the beginning. The up-date of the state of art on the processing and
properties of such composites with most recent publications, such as the group publication
Wu H et al (2012) that inspired this work was determinant for this study[1]. Details of the
methods and specific equipment used to prepare or study the composites are left for the
following chapter on the experimental lay-out and techniques. This chapter briefly deals
with the overall reviewing of necessary parts of the literature to support the work to be
done.
The raw materials of the experimental tasks of the study were taken in the form of
powders: boron carbide, aluminium and silicon. Composites made of four solid phases,
B4C, SiC, metallic Al and Si are the major output of this work and form a dual metallic,
dual carbide system. As schematically represented in figure 2.01 various properties of the
individual elements and compounds are interconnected and involved in the design and
processing of such metal matrix composites.
The structure of B4C, SiC, Al and Si solid alloy are described in the first section of this
chapter which also includes the a selection of representative binary phase diagrams such as
the B-C, Si-C, Al-Si systems.
The reactions and representation of changes in composition of multi-element systems are
better followed on phase diagrams and there are many combinations of the elements of the
system that lead to relevant binary and ternary phase diagrams as indicated in figure 2.02.
In this connection, the ternary systems including boron carbide are outlined in the final part
of this chapter where the isothermal sections of ternary phase diagrams of Al-B-C and Si-
B-C systems are added and discussed.

Processing and Toughening of Dual-Metallic Phase Dual-Carbide Composites 2013
8
Figure 2.0 1: Interdependence of microstructural, physical, mechanical and chemical
properties in designing a metal matrix composite
Furthermore, physical, mechanical and chemical properties of these phases are assessed in
a short way. It is of this experimental work the reactive infiltration, which is reviewed in
the following section along with major phenomena that control pressure-less, spontaneous
infiltration, the wetting and the action of capillary forces, wetting of graphite surfaces by
Al melts and wetting on ceramic phases by molten metal, namely by those of the Al-Si
system.
Dual Metallic
Dual Carbide
Composite
Chemical
properties
Mechanical
properties
Micro -
structure
Processing and Toughening of Dual-Metallic Phase Dual-Carbide Composites 2013
9
Figure 2.02: Combination of the four elements relevant for the present study and the
complete set of possible binary, ternary and the one quaternary phase
diagrams involved in the results of the experimental work.
2.1 Boron carbide
Easy to be synthesized, boron carbide (B4C) is also the hardest material next to diamond
and cubic boron nitride. The applications of B4C are wide. Some of its distinctive
properties are the low density (2.52 g/cm3), chemical inertness and refractoriness thus
sustaining the mechanical strength at elevated temperatures. B4C raw materials often
contain graphite as second phase which influences the strength of the material. In general
the B4C material is identified by the ratio of boron to carbon. The rhombohedral crystalline
structure is observed when the stoichiometry of boron and carbon is close to 4:1 and
beyond this value. As B and C atoms have similar cross sections for elastic scattering, it is
C
B
Si
Al
B-C
Binary
Si-C
Binary
Al-Si
Binary
Al-B
Binary
Al-B-C
Ternary
Si-B-C
Ternary
Al-Si-C
Ternary
Al-Si-B
Ternary
Al-Si-B-C
Quaternary
Processing and Toughening of Dual-Metallic Phase Dual-Carbide Composites 2013
10
difficult to locate them in the crystalline them by neutron or X-ray diffraction techniques
[3]. The location of C in the crystalline structure is best established by using spectroscopic
methods.
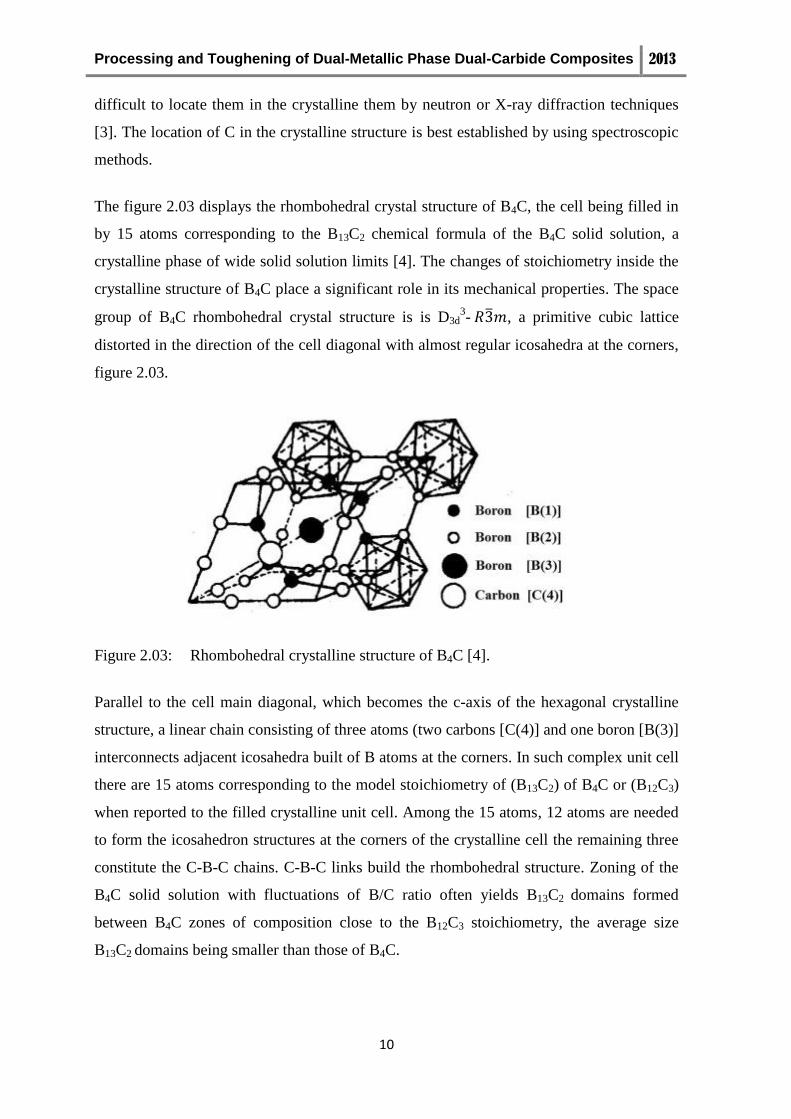
The figure 2.03 displays the rhombohedral crystal structure of B4C, the cell being filled in
by 15 atoms corresponding to the B13C2 chemical formula of the B4C solid solution, a
crystalline phase of wide solid solution limits [4]. The changes of stoichiometry inside the
crystalline structure of B4C place a significant role in its mechanical properties. The space
group of B4C rhombohedral crystal structure is is D3d3- , a primitive cubic lattice
distorted in the direction of the cell diagonal with almost regular icosahedra at the corners,
figure 2.03.
Figure 2.03: Rhombohedral crystalline structure of B4C [4].
Parallel to the cell main diagonal, which becomes the c-axis of the hexagonal crystalline
structure, a linear chain consisting of three atoms (two carbons [C(4)] and one boron [B(3)]
interconnects adjacent icosahedra built of B atoms at the corners. In such complex unit cell
there are 15 atoms corresponding to the model stoichiometry of (B13C2) of B4C or (B12C3)
when reported to the filled crystalline unit cell. Among the 15 atoms, 12 atoms are needed
to form the icosahedron structures at the corners of the crystalline cell the remaining three
constitute the C-B-C chains. C-B-C links build the rhombohedral structure. Zoning of the
B4C solid solution with fluctuations of B/C ratio often yields B13C2 domains formed
between B4C zones of composition close to the B12C3 stoichiometry, the average size
B13C2 domains being smaller than those of B4C.

Processing and Toughening of Dual-Metallic Phase Dual-Carbide Composites 2013
11
2.1.1 B-C phase diagram
Two versions of the B-C binary phase diagram are given in figure 2.04, calculated (a)[5]
and prepared after the experimental study (b) with microprobe analysis of Schwetz and
Karduc [6] where a maximum C content of only 19.2 at% was found in the B4C phase in
equilibrium with graphite at the eutectic point (2380 ºC), and concentration of 18.5 at% C
at 1000 ºC the late value corresponding to B4.3C. In the calculated binary phase diagram
given on figure 2.04 (a) the eutectic temperature appears at 2375 ± 5 ºC, with the maximum
C content of the B4C solid solution 19.3–20.0 at% for an eutectic composition around 29-
31 at%.
Figure 2.04: The B-C binary phase diagram: (a) calculated [5], (b) from experimental
results [6].
Depending on the temperature, B13C2, the only crystalline structure of the binary phase
accepted at the present among several phases of B4C, has a broad range of homogeneity
which ranges from 8.8 at% C at the low solid solution limit to the 20 at% C discussed
above. This phase at the composition of 18.5 at% C melts congruently with the maximum
melting point of 2450 ºC [7].

Processing and Toughening of Dual-Metallic Phase Dual-Carbide Composites 2013
12
2.1.2 Mechanical behavior
Large refractoriness and covalent bonding of B4C leads to poor sinterability requesting
additives to promote grain boundary diffusion and often the use of sintering temperatures
above 2000 ºC and applied pressure to achieve full densification of the ceramic part[1, 8].
The variations in modulus of elasticity, hardness, mechanical strength and fracture
toughness of B4C ceramics are explained by the sintering temperature, content of graphite
and particle size. The Young modulus is an intrinsic property of a material dominated by
the intensity of the chemical bond between atoms. The modulus of elasticity of B4C is
about 474 GPa and 480 GPa for B13C2 [9] . Due to such high elasticity modulus it is being
selected material in several high technology fields such as ballistic armour applications[9].
Figure 2.05 gives the dependence of Young modulus of high B B-C coatings on the
concentration of the carbon in of LPCVD (Low Pressure Chemical Vapour Deposited)
coating.
Figure 2.05 : Variation of E/(1 - ʋ2) ratio versus the carbon concentration LPCVD coatings
deposited at 1020 ºC in which (1) B50C2, (2) B50C2+B13C2, (3) B13C2 [10],
( 0.2 is the Poisson ratio).
Processing and Toughening of Dual-Metallic Phase Dual-Carbide Composites 2013
13
These coatings show the strong influence of composition on the elastic modulus where the
maximum value of 475 GPa is obtained for the B13C2 stoichiometry. Bouchacourt reported
an (ISE) indentation size effect in the hardness values of B4C displaying exponentially rise
with decreasing loads [11]. At very low loads (around 0.25 N), hardness values up to 58
GPa have been measured in B4C with large standard deviation[11]. In general,
approximately constant hardness values of B4C materials are measured at loads above 20 N
in which the large area of the indentations incorporates the details of the microstructure to
return microstructure averaged values of hardness in the range 26-35 GPa [1]. At the same
time, residual porosity, flaws, the presence of free carbon, namely as graphite in the B4C
samples and the loads of indentation testing explane the scatter of hardness values of B4C
reported in the bibliography. When comparing the hardness of diamond, c-BN and B4C,
the last compound displays the lowest hardness of the three at room temperature, at 500-
600 ºC the structure of diamond transforms to graphite of much lower hardness, whereas
above 1100 ºC in non-oxidizing atmosphere B4C becomes the hardest material in this set
[12]. Hence it has been used in high temperature technologies, in wear-resistant parts and
inserts for mortars and ball mills, wear resistant nozzles, dressing tools in grinding
application, lightweight armor plates for helicopters, tanks, and in fiber reinforced plastics
(as bullet-proof protection) [12].
Large effort has been done to toughen the brittle ceramics and increase the fracture energy.
Successful results were obtained by using short fibre and whisker reinforcements as well as
by inclusion transformation toughening, even though the effectiveness of such toughening
mechanisms and the improved performance of the ceramics matrix composites under the
elevated temperatures is often subtle[13]. In general toughening mechanisms can be
classified as intrinsic and extrinsic. The intrinsic mechanisms act ahead of the crack tip in
which the original microstructure of the system loses stability and is modify by the stress
field of the coming crack tip. In the general case, the plasticity can blunt crack tips by
motion of dislocations in the process zone ahead of the crack. Crack tip blunting may
equally come from viscous deformation of amorphous phases softened by heating. By
increasing the precipitate particle spacing, as in the case of metallic alloys, the ductility and
plasticity of the materials are changed which results in improvements of fracture
Processing and Toughening of Dual-Metallic Phase Dual-Carbide Composites 2013
14
toughness. There are two different principles that explain the extrinsic mechanism of
toughening, zone shielding and crack shielding which act behind the crack tip during crack
propagation and decrease the stress intensity factor of the applied stress at the location of
the crack front. Crack deflection toughening, micro-crack toughening, macro-crack
bridging are few of the toughening mechanisms operating in the single phase
polycrystalline ceramics. Transformation toughening is one of the methods in which the
constituents of the second phase (or partially stabilized particles of the same phase)
experience a stress induced martensitic phase transformation that absorbs the elastic energy
and positively contributes to toughen the structural ceramics [13]. In a different way,
toughening by soft metal inclusions is an alternative method to toughen ceramics in a
compromise with the hardness and temperature of use of the finished composites.
Processed as ceramics, B4C materials display high hardness but with moderate mechanical
bending strength in the 270-420 MPa range. Hot isostatic pressing of high grade B4C
eliminated the residual porosity and improved the (1600-1800 ºC) hot strength to 500-700
MPa, a remarkable value among high technology structural materials[14]. But the true
limitation of the B4C ceramics for engineering applications is the low fracture toughness
limited to values in the 1.3-3.7 MPa.m1/2
range[8] . The room temperature strength of B4C
composites prepared by reactive melt infiltration with the Al-Si alloy are comparable to the
bending strength of hot pressed B4C ceramics, the dual phase composites of B4C
displaying higher fracture toughness and being much less demanding in temperatures for
processing[1].
The low density of B4C coupled to the high hardness and availability of raw materials
makes this material either as dense ceramic plates or as mosaics of dual phase B4C
composites a candidate for the design of ballistic protection armour in the combination
with other materials. The ballistic response of hard materials like B4C is dependent on
microstructure, especially trough the hardness. Density and elastic modulus are deciding
factors that set mechanical impedance and determine shock behavior. Light weight and at
the same time stiffer ceramics are considered as effective armor modulus. Materials that
combine high hardness, high elastic modulus and low density have exceptionally high
specific stopping power to defeat high velocity projectiles[15, 16]. Deflection of the
projectile, erosion of projectile and target shattering, propagation and reflection of

Processing and Toughening of Dual-Metallic Phase Dual-Carbide Composites 2013
15
shockwaves, crack initiation and coalescence and are the usual failure modes of the
protection and are affected by the inertia and rigidity of the armor module [15, 16]. While
all these mechanisms have a part in deciding for the minimum least weight armor
protection, the potential role of B4C materials for such applications is appreciable.
2.1.3 Chemical behaviour and oxidation of B4C
Oxidation of B4C in air and other oxygen containing atmospheres is one of the chemical
properties of B4C that limits its use as structural material. B4C strongly reacts in oxidizing
environment. The second limitation of B4C for wider application at high temperature is its
instability when in contact with most metals. The formation of borides and carbides are
determined by the affinity of metal to boron or carbon[17] . When there are no stable metal
carbides in the system the reaction of B4C with the metals leads to formation of free
carbon. When oxides contacting the B4C are reduced borides and CO are formed. In spite
that a few borides can be formed when the reaction occurs in air, it is mostly the metal
borates that are generated by the reaction of B4C and metals in air. In gaseous hydrogen
B4C reacts slowly with this element above 1200°C to form borane and methane, the vapor
phase transport inhibits sintering of B4C in hydrogen atmosphere[12].
B4C powders begin to oxidize in detectable way at 250 ºC in the presence of H2O vapor
and at 450 ºC in dry air [18], the oxidation by dry air being slower than in H2O vapour for
temperatures up to approximately 700 ºC [18]. As it oxidizes in air B4C is immediately
coated by a passivation B2O3 layer, while in presence of water a hydroboric acid (H2BO3)
layer forms within a few moments[19, 20]. xidation initiated at 500 -600 ºC accelerates
significantly above 800-1000 ºC, depending on the humidity in the atmosphere. In the
work of Matje et al[19], B4C powders were surface cleaned, Si-sputtered and (1 ppm O2
and 1 ppm H2O impurity) Ar+ ion implanted or left untreated and the wei ht ain at 20 C in
air was monitored. The Si-sputtered and Ar-implanted powder showed a strong and
immediate weight gain, it was substantially higher for the treated powder compared to the
untreated one. While the Si-sputtered material remained stable after 20 hours, the Ar-
implanted powder exhibited a continuous weight gain with increasing final oxygen content
4 wt%. Ar-implanting of the Si-sputtered B4C powder lead to the enlarged surface area
Processing and Toughening of Dual-Metallic Phase Dual-Carbide Composites 2013
16
besides formation of structural defects which facilitated oxygen diffusion and oxidation at
room temperature[19]. These studies also indicated similar weight-gains in the dry and
humid air atmospheres, a parabolic weight-gain and an increase in weight linear dependent
on time at 52% humidity and 92% humidity, respectively.
Following Telle et al the large cross section of 4000 barn for thermal neutrons of the 10
B
isotope that exists at concentration of 19.9% in natural boron makes B4C ceramics special
for absorption or retardation of neutron radiation. It is widely used in nuclear fission power
plants and may become the first-wall coating in fusion reactors where it also guarantees
stability to ionizing radiation and most chemicals[12].
2.2 Silicon carbide
Silicon carbide the compound with Si and C covalently bonded in tetrahedral coordination
has over 180 polymorphic forms. SiC is a prominent representative of polytypic
compounds [21]. Noteworthy properties of SiC materials are the low density (3.21 g/cm3),
high elastic modulus and hardness, superior chemical inertness and excellent thermal shock
resistance. In recent times improved grades of SiC emerged as high quality technical
ceramics with improved mechanical properties. It is used in abrasives, refractories and
other high-tech applications. Structural and wear applications of SiC are constantly
developing. It is extensively employed as an electrical semiconductor for resistance heating
applications, flame igniters and electronic components[22].
Si and C layers are alternatively stacked in the crystalline structure of SiC due to its binary,
tetragonal structure half the tetragonal voids between consecutive closed packed Si layers
are occupied by a C layer, as shown in figure 2.06 a). The two identical closed-packings
(Si and C) interpenetrate each other and form the structure where one packing is displaced
relative to the other along c- axis with the layer spacing of 1/4. There are only four possible
space groups for SiC as the tetragonal arrangement of atoms in SiC does not permit either a
centre of symmetry or a plane of symmetry perpendicular to [001]. There are only three
possible positions for atom centers - A, B and C - given in figure 2.06 a) [23]. The most
frequently occurring stack sequences in the crystalline structure of SiC correspond to the
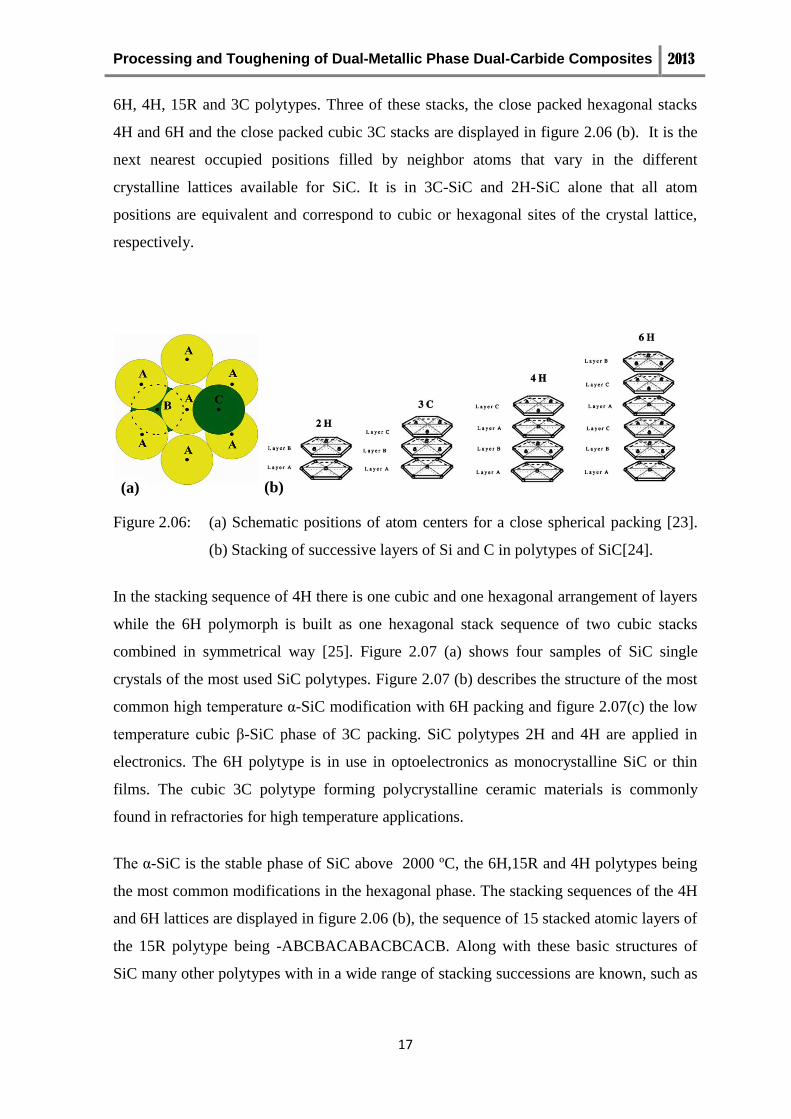
Processing and Toughening of Dual-Metallic Phase Dual-Carbide Composites 2013
17
6H, 4H, 15R and 3C polytypes. Three of these stacks, the close packed hexagonal stacks
4H and 6H and the close packed cubic 3C stacks are displayed in figure 2.06 (b). It is the
next nearest occupied positions filled by neighbor atoms that vary in the different
crystalline lattices available for SiC. It is in 3C-SiC and 2H-SiC alone that all atom
positions are equivalent and correspond to cubic or hexagonal sites of the crystal lattice,
respectively.
Figure 2.06: (a) Schematic positions of atom centers for a close spherical packing [23].
(b) Stacking of successive layers of Si and C in polytypes of SiC[24].
In the stacking sequence of 4H there is one cubic and one hexagonal arrangement of layers
while the 6H polymorph is built as one hexagonal stack sequence of two cubic stacks
combined in symmetrical way [25]. Figure 2.07 (a) shows four samples of SiC single
crystals of the most used SiC polytypes. Figure 2.07 (b) describes the structure of the most
common hi h temperature α-SiC modification with 6H packing and figure 2.07(c) the low
temperature cubic β-SiC phase of 3C packing. SiC polytypes 2H and 4H are applied in
electronics. The 6H polytype is in use in optoelectronics as monocrystalline SiC or thin
films. The cubic 3C polytype forming polycrystalline ceramic materials is commonly
found in refractories for high temperature applications.
he α-SiC is the stable phase of SiC above 2000 ºC, the 6H,15R and 4H polytypes being
the most common modifications in the hexagonal phase. The stacking sequences of the 4H
and 6H lattices are displayed in figure 2.06 (b), the sequence of 15 stacked atomic layers of
the 15R polytype being -ABCBACABACBCACB. Along with these basic structures of
SiC many other polytypes with in a wide range of stacking successions are known, such as
(a) (b)

Processing and Toughening of Dual-Metallic Phase Dual-Carbide Composites 2013
18
the remarkably long 51R SiC often detected in reaction-bonded SiC ceramic matrix
composites[26].
Figure 2.07: SiC polytypes with images of the atom arrangement of the crystalline lattices,
(a) Single crystals of SiC polytypes[26] (b) Hexagonal crystal lattice of α-SiC
(6H-polytype)[21, 27] and, (c) Cubic crystal lattices of β-SiC (3C-
polytype)[21, 27]
he cubic β-SiC (3C) is stable below 1800 ºC and transforms into the stable, high
temperature hexa onal α-SiC (6H) phase above this temperature [28, 29]. Metastable
modifications of SiC may undergo solid-state transformation to the 3C and 6H structures at
temperatures above 1400 ºC [29]. Inomata et al determined the following ranges of
stability for some of SiC polytypes: the 2H is stable below 1400 ºC, 3C between 1400 ºC
and 1600 ºC, 4H between 1600 ºC and 2100 ºC, 6H above 2100 ºC and 15R above 2200 ºC
[30]. The impurities play a role in developing of different SiC polytypes. In short, 4H is
crystallised by additions of Al, pure α-SiC mainly appears as 6H and Al in small amounts
promoted the formation of 15R SiC.
(b) (c)
(a)

Processing and Toughening of Dual-Metallic Phase Dual-Carbide Composites 2013
19
2.2.1 Si-C Phase diagram
Figure 2.08 gives the Si-C binary phase diagram at the total pressure of 0.1 MPa (1 atm)
which has SiC as the only binary compound (at 70 wt% Si). By introducing a transition
metal the solubility of C in Si melt may be increased[31]. SiC does not have a congruent
melting point. In an open system SiC start to compose at 2300 ºC with the formation of
gaseous Si and graphite as a residue whereas in a closed system in equilibrium conditions
the decomposition of SiC occurs at 2830 ºC,
Figure 2.08: The binary phase diagram of the Si-C system [32]
the highest temperature at which crystallization of SiC may be observed during
solidification of the Si-C melts. Conversely this is the temperature at which SiC breaks
down into graphite and a Si rich melt at total pressure of 0.1 MPa. At the peritectic
temperature, 2830 ºC, the solubility of C in liquid Si is 13 at% C. The solubility of C in
crystalline Si in very low, SiC and Si forming a degenerate eutectic at 1413 ºC and 0.02
at% C, as given in figure 2.08 [32].
SiC + C
Processing and Toughening of Dual-Metallic Phase Dual-Carbide Composites 2013
20
2.2.2 Chemical stability of SiC
Despite the high affinity of silicon for oxygen, SiC materials have the prominent property
of high chemical resistance. Oxidation of pure SiC at around 600 ºC forms a passivation
SiO2 coating that prevents further oxidation and allows the use of SiC refractories and
heating elements in air atmosphere to temperatures in excess of 1500 ºC. If this passivation
layer is removed as in atmospheres of high H2O partial pressure at high temperature, the
oxidizing agents will attack and decompose SiC and enable the corrosion reactions to go
on[33]. The behaviour of SiC in contact molten metal is manifold. Zinc and zinc vapour do
not attack SiC, whereas Al attacks SiC in a slow way forming the aluminium carbide and
silicon as reaction products, but as Si concentration in the liquid increases the reaction
finally ceases because the equilibrium conditions are reached[34].
2.2.3 Mechanical behaviour of SiC
SiC is noted for the outermost hardness H of about 9.50-9.75 Mohs scale, SiC being an
abrasive of widespread industrial use, the SiC ceramics exhibiting high abrasion resistance.
It equally has high rigidity, the Young modulus E being close to 450 GPa. Both the high
values of E and H explain the brittleness of SiC. High grade SiC materials retain the hot
strength till temperatures above 1500 ºC[14]. SiC materials made by various methods are
available as (solid state) sintered silicon carbide (SSiC), chemical vapour deposited silicon
carbide (CVD SiC) and reaction bonded silicon carbide (RBSC), or as a composite of SiC
and Si3N4 in the nitride bonded silicon carbide (NBSC)[27]. The differences of residual
porosity, particle size and chemical composition of SiC materials impose changes in the
microstructure and a wide span of values of the mechanical properties. Though there are
some general limitations in the mechanical strength of SiC due to the brittleness,
recrystallized SiC is much stronger than ceramic (phase) bonded SiC. Reaction-sintered
SiC is still stronger but only up to 1400 C, whereas the best strength values are provided by
the hot pressed materials and sinter-HIPed ones. Liquid phased sintered SiC (LPS-SiC) has
improved fracture toughness, this property imparts resistance against mechanical chipping,
hence the application of LPS-SiC is wider in grinding works, components for equipment in
transportation sectors, tooling industries than that of SSiC[27, 35]. The mechanical
Processing and Toughening of Dual-Metallic Phase Dual-Carbide Composites 2013
21
strength and fracture energy of SiC can be improved when SiC fibers are embedded in the
SiC ceramic matrix forming composites. Mechanical properties of ceramic composites can
be tailor made by controlling the parameters of the SiC fibers and fiber/matrix
interface[36].
2.3 Aluminium-Silicon alloys
Important technological properties of aluminium are low density, high specific strength,
superior malleability, ability to be machined, excellent corrosion resistance and good
thermal and electrical conductivity. Silicon is able to reduce the density, the coefficient of
thermal expansion and improve the hardness of the Al alloys hence Si has been added to Al
at various proportions. Though several additives are used to modify the industrial Al
alloys, hypereutectic Al-Si alloys got much attention recently[37, 38]. Along with the
above features silicon improved room temperature mechanical properties such as elastic
modulus and strength, thermal stability and wear resistance of aluminum. Hypereutectic
Al-Si alloys caused considerable interest leading to research of new members of the Al–Si
alloys with potentially new applications in several fields of technology[37]. Recent
research was focussed on unmodified cast alloys, especially with hypereutectic Al–Si
alloys. The structure and mechanical properties of hypereutectic unmodified cast alloys
have been studied mainly in relation to the increasing in Si content up to a concentration 19
at% Si.
The α-Al solid solution, the matrix phase of cast aluminum-silicon forms the non-faceted
dendrites. he α-Al phase has the face centered cubic (fcc) lattice, shown in figure 2.09 (a),
with Al in coordination 12 and 4 Al atoms in each fcc crystalline cell, the corresponding
cell filling factor being 0.74 [39].
Silicon crystal lattice is A4, cubic, of diamond type where each atom is connected with
four others with covalent bonds and forming a tetrahedron. Eight tetrahedrons form one
elementary cell of the face centered A4 lattice, with four additional atoms from the center
of each tetrahedron[40]. When comparing to A1 lattice this structure is lesser close packed
with the filling factor of 0.34. Si has very low solubility in aluminium as shown in the Al-
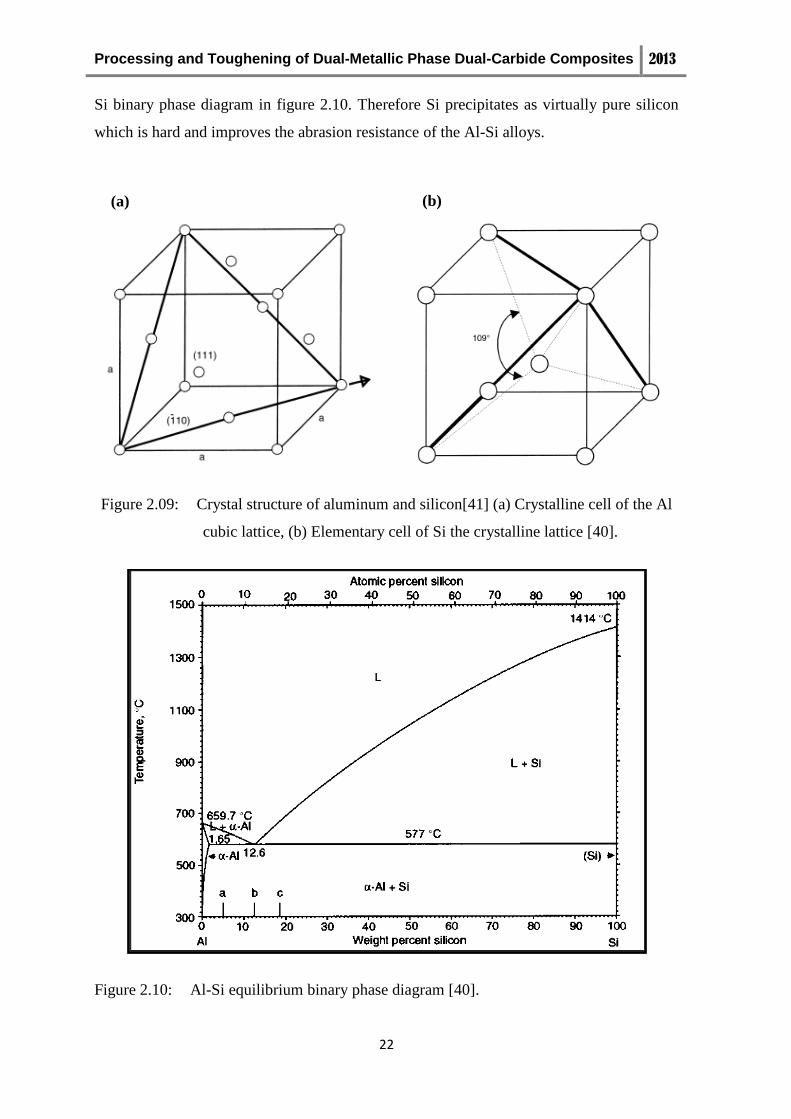
Processing and Toughening of Dual-Metallic Phase Dual-Carbide Composites 2013
22
Si binary phase diagram in figure 2.10. Therefore Si precipitates as virtually pure silicon
which is hard and improves the abrasion resistance of the Al-Si alloys.
Figure 2.09: Crystal structure of aluminum and silicon[41] (a) Crystalline cell of the Al
cubic lattice, (b) Elementary cell of Si the crystalline lattice [40].
Figure 2.10: Al-Si equilibrium binary phase diagram [40].
(a) (b)
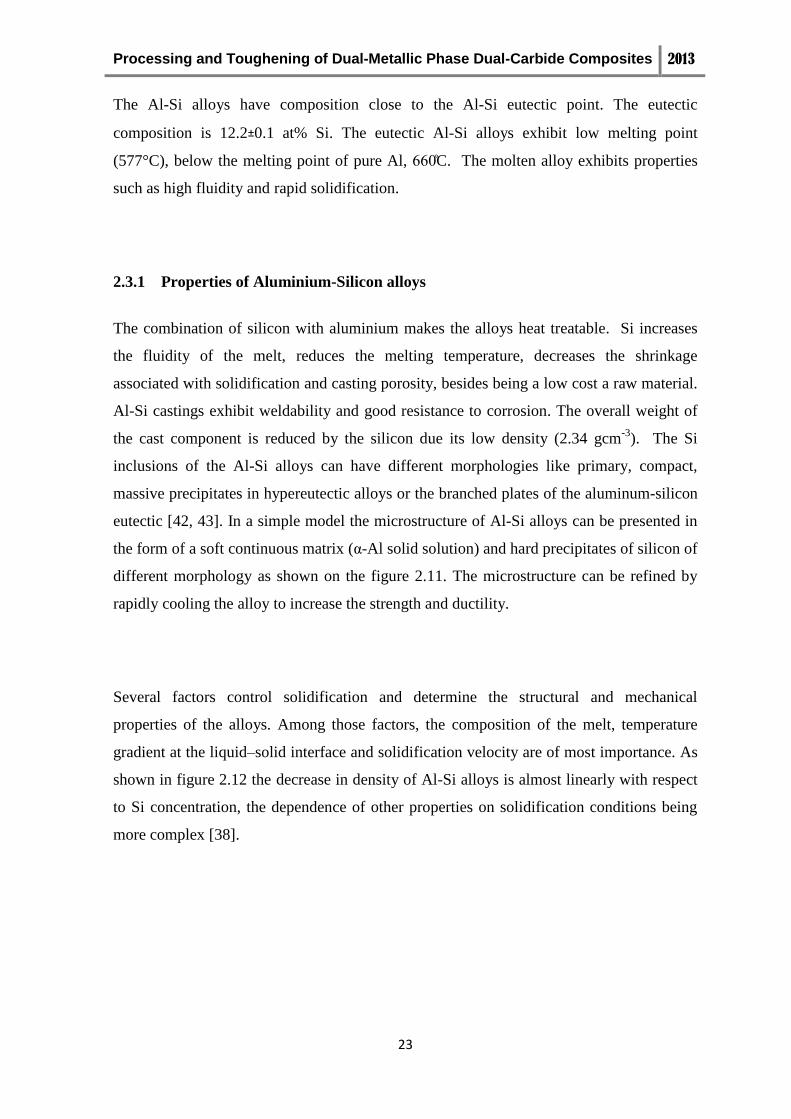
Processing and Toughening of Dual-Metallic Phase Dual-Carbide Composites 2013
23
The Al-Si alloys have composition close to the Al-Si eutectic point. The eutectic
composition is 12.2±0.1 at% Si. The eutectic Al-Si alloys exhibit low melting point
(577°C), below the melting point of pure Al, 660 C. The molten alloy exhibits properties
such as high fluidity and rapid solidification.
2.3.1 Properties of Aluminium-Silicon alloys
The combination of silicon with aluminium makes the alloys heat treatable. Si increases
the fluidity of the melt, reduces the melting temperature, decreases the shrinkage
associated with solidification and casting porosity, besides being a low cost a raw material.
Al-Si castings exhibit weldability and good resistance to corrosion. The overall weight of
the cast component is reduced by the silicon due its low density (2.34 gcm-3
). The Si
inclusions of the Al-Si alloys can have different morphologies like primary, compact,
massive precipitates in hypereutectic alloys or the branched plates of the aluminum-silicon
eutectic [42, 43]. In a simple model the microstructure of Al-Si alloys can be presented in
the form of a soft continuous matrix (α-Al solid solution) and hard precipitates of silicon of
different morphology as shown on the figure 2.11. The microstructure can be refined by
rapidly cooling the alloy to increase the strength and ductility.
Several factors control solidification and determine the structural and mechanical
properties of the alloys. Among those factors, the composition of the melt, temperature
gradient at the liquid–solid interface and solidification velocity are of most importance. As
shown in figure 2.12 the decrease in density of Al-Si alloys is almost linearly with respect
to Si concentration, the dependence of other properties on solidification conditions being
more complex [38].
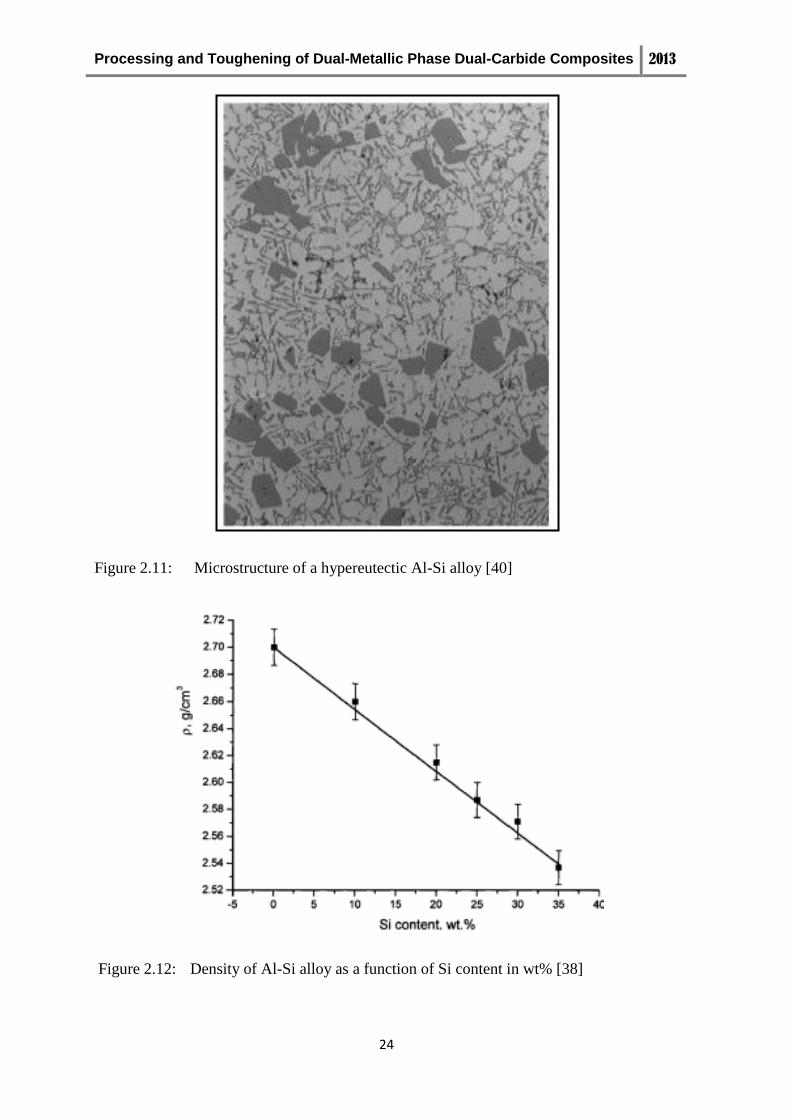
Processing and Toughening of Dual-Metallic Phase Dual-Carbide Composites 2013
24
Figure 2.11: Microstructure of a hypereutectic Al-Si alloy [40]
Figure 2.12: Density of Al-Si alloy as a function of Si content in wt% [38]
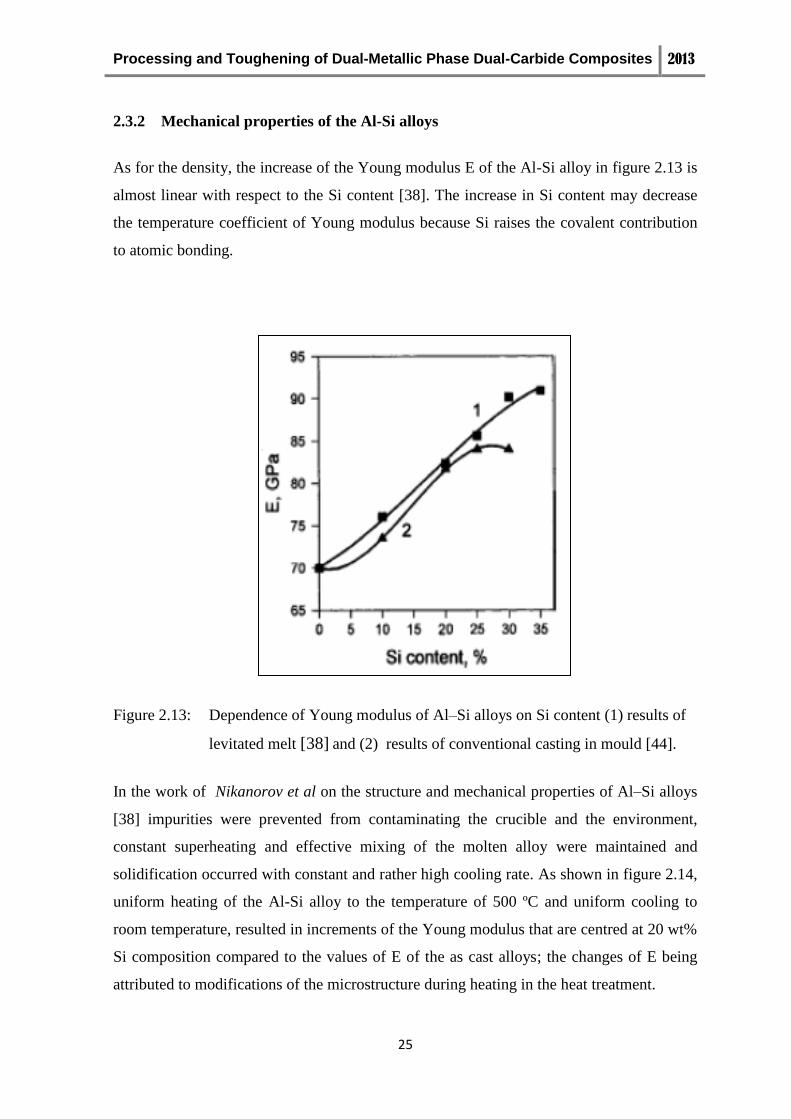
Processing and Toughening of Dual-Metallic Phase Dual-Carbide Composites 2013
25
2.3.2 Mechanical properties of the Al-Si alloys
As for the density, the increase of the Young modulus E of the Al-Si alloy in figure 2.13 is
almost linear with respect to the Si content [38]. The increase in Si content may decrease
the temperature coefficient of Young modulus because Si raises the covalent contribution
to atomic bonding.
Figure 2.13: Dependence of Young modulus of Al–Si alloys on Si content (1) results of
levitated melt [38] and (2) results of conventional casting in mould [44].
In the work of Nikanorov et al on the structure and mechanical properties of Al–Si alloys
[38] impurities were prevented from contaminating the crucible and the environment,
constant superheating and effective mixing of the molten alloy were maintained and
solidification occurred with constant and rather high cooling rate. As shown in figure 2.14,
uniform heating of the Al-Si alloy to the temperature of 500 ºC and uniform cooling to
room temperature, resulted in increments of the Young modulus that are centred at 20 wt%
Si composition compared to the values of E of the as cast alloys; the changes of E being
attributed to modifications of the microstructure during heating in the heat treatment.
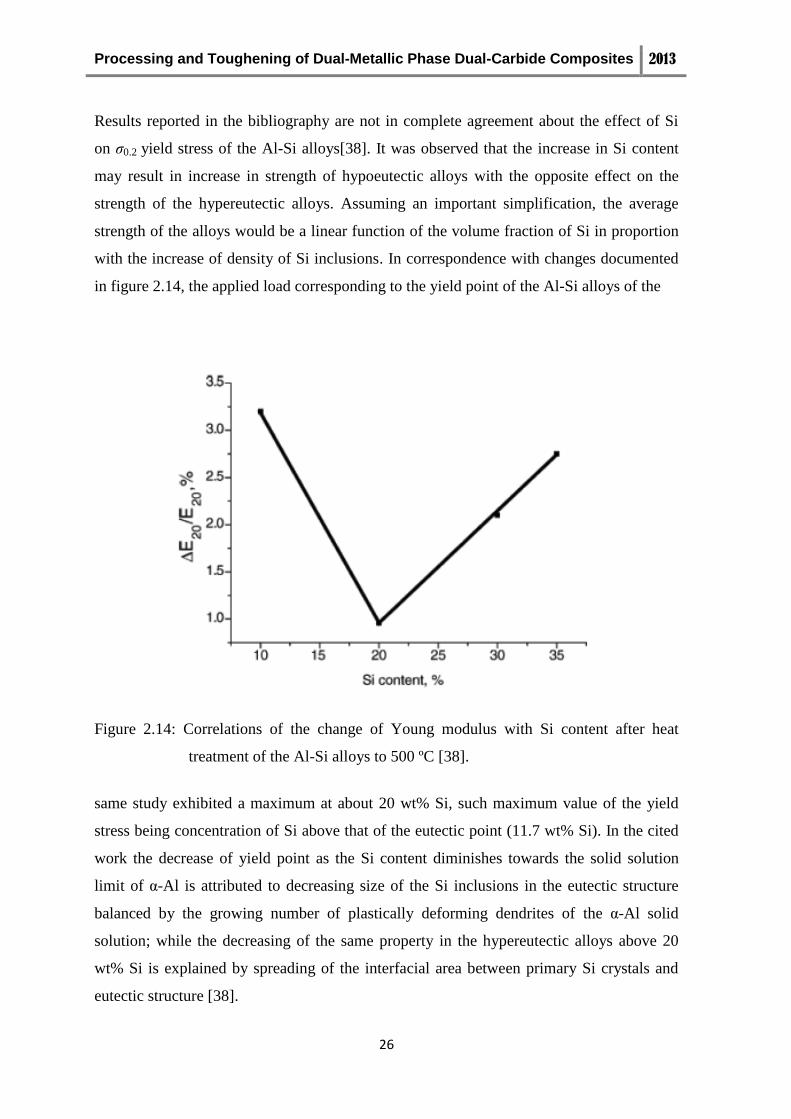
Processing and Toughening of Dual-Metallic Phase Dual-Carbide Composites 2013
26
Results reported in the bibliography are not in complete agreement about the effect of Si
on σ0.2 yield stress of the Al-Si alloys[38]. It was observed that the increase in Si content
may result in increase in strength of hypoeutectic alloys with the opposite effect on the
strength of the hypereutectic alloys. Assuming an important simplification, the average
strength of the alloys would be a linear function of the volume fraction of Si in proportion
with the increase of density of Si inclusions. In correspondence with changes documented
in figure 2.14, the applied load corresponding to the yield point of the Al-Si alloys of the
Figure 2.14: Correlations of the change of Young modulus with Si content after heat
treatment of the Al-Si alloys to 500 ºC [38].
same study exhibited a maximum at about 20 wt% Si, such maximum value of the yield
stress being concentration of Si above that of the eutectic point (11.7 wt% Si). In the cited
work the decrease of yield point as the Si content diminishes towards the solid solution
limit of α-Al is attributed to decreasing size of the Si inclusions in the eutectic structure
balanced by the growing number of plastically deforming dendrites of the α-Al solid
solution; while the decreasing of the same property in the hypereutectic alloys above 20
wt% Si is explained by spreading of the interfacial area between primary Si crystals and
eutectic structure [38].
Processing and Toughening of Dual-Metallic Phase Dual-Carbide Composites 2013
27
2.4 Reactive melt infiltration
Melt infiltration was early proposed as an alternative route to prepare dense ceramic-matrix
composites and ceramic-metal composites [45-47]. The possibility that the driving pressure
for melt infiltration derived from the capillary forces developed by the wetting liquid in the
open pores of the fine grain ceramic matrix may easy overcome the forces of gravity on the
melt is a relevant technological advantage[48]. In the absence of reactions between the
melt and the porous matrix the rate of melt infiltration is determined by viscous flow
dependent on viscosity of the melt, wetting angle and the porosity and morphology of the
porous bed, namely the hydraulic pore radius[45]. More often, reactions occur either at the
melt-ceramic-gas triple line setting the wetting and fixing the velocity of spreading of the
liquid in the pores or they develop afterwards in the spaces filled by the melt with changes
in volume fraction and composition of the solid skeleton, alteration of the composition of
the melt and modification of the permeability of the bed faced by the advancing reactive
melt[1, 49, 50]. By the process of reactive melt infiltration (RMI) near-net shape
manufacturing, quick processing times and at low cost can be achieved. The reactants and
reaction products are usually of varying density and the overall conservation of mass
imposes straining forces related to chemical conversion which can directly influence the
infiltration behaviour. As a result the advancing of the infiltration front is affected by
fluctuations of the driving pressure coupled to competing driving forces coming from
chemical conversion of phases.
In (RMI), the desired shape is first formed by the production of a porous preform of the
piece. As a driving force of spontaneous RMI, gravity and capillary forces are used in
wetting systems like Si and C. In the non-wetting systems (such aluminium-alumina)
applied pressure is needed to force the infiltrate liquid into the porous preform. The
commercial production of reinforced Al, Zn, Cu based alloys and Mg is usually done by
pressure assisted melt infiltration [51]. Near net shape processing of materials that have
little or no machinability, conservation of integrity of the preforms in non-reacting
systems, efficiency in time and lower material costs are the major advantages of the several
variant methods melt infiltration. The need of post-process machining is limited in RMI
making this process particularly attractive for the manufacturing of brittle and hard
ceramic-matrix composites[27, 37].
Processing and Toughening of Dual-Metallic Phase Dual-Carbide Composites 2013
28
2.4.1 Melt infiltration controlled by viscous flow
Infiltration processes governed by viscous flow are generally ruled by Darcy´s law [52]
that gives the velocity of the permeating incompressible fluid (liquid metal, water) per unit
area, or the volumetric flux, as
Eq. (2.01)
where ʋo is the superficial velocity of the fluid (the infiltrate, liquid metal), µ its viscosity,
dm its density, K the symmetric tensor of permeability of the porous medium, the
gradient of pressure acting on the fluid, g the acceleration of gravity. Neglecting the effect
of gravity compared to the driving pressure from the curvature of the meniscus of the
wetting fluid inside open pores with diameters of few microns or even smaller and
invoking continuity, the pore velocity or velocity that the fluid presents inside pores is
faster than ʋo and it is given as:
………Eq. (2.02)
where Vs is the solid volume fraction or relative density (ρ) of the preform, and 1 - Vs = P
is the porosity fraction of the porous bed.
Several models and correlations were made available to set the relationship between the
permeability coefficient of Darcy´s equation, K, and particle size and morphology of the
porous bed. The Blake-Kozeny equation is one of the simplest and most widely used
approaches for the permeability of an isotropic porous medium:
………Eq. (2.03)
where the factor 4.2 accounts for the tortuosity of the open porosity and So is the specific
surface area per unit of volume of the solids which is related to equivalent spherical
diameter of the loose particles in the porous bed, Ds, as,
……..Eq. (2.04)
Processing and Toughening of Dual-Metallic Phase Dual-Carbide Composites 2013
29
Sw being the mass specific surface area of the powder.
The powder bed is not a regular system of capillaries of equal radius. Out of several
methods proposed to define the average pore radius rp or equivalent cylindrical pore radius
of the open porosity in the porous bed of loose particles, the following equation of rp due to
Carman is in frequent use [53]:
……..Eq. (2.05)
where Vs, ds and Sw were defined above.
For nonreactive wetting, the contact angle of the infiltrate on the preform must remain
constant thus fixing the value of the capillary forces. Capillary forces drive the whole
process of spontaneous, pressure-less infiltration. The overall infiltration kinetics is
calculated by using slug-flow assumption. When the pressure gradient in Eqs. (2.01 and
2.02) is approximated by the difference of pressure at the advancing interface of the fluid
and the pressure at the entrance divided by the length of the infiltrated layer, the squared
length becomes proportional to the time of infiltration.
The permeability, K, in Darcy´s law, equations (2.01 and 2.02), is a complex function of
time and position in reactive systems such as the RMI systems, because the pore space
filled in by the melt changes size, shape and volume fraction when reactions occur. The
sum of the applied pressure, of the internal pressure of entrapped gas phases and the
integral of the capillary pressure in the system yields the effective pressure noted as p in
the Darcy´s law.
Brusque changes in the flow of the infiltrate due to constrictions in pore geometry or
roughness of pore surfaces are known as Haines jumps. Due to Haines jumps hysteresis is
observed between the imbibition and drainage of a porous medium, a difference of energy
being involved in an irreversible way [54]. Even if there are no chemical reactions between
infiltrate and preform, Haines jumps would disturb the local velocity of the infiltrate and
lead to a rough melt-gas interface at the forefront of the advancing melt inside the porous
preform which may cause isolation of volumes missing the infiltration process. If the
Processing and Toughening of Dual-Metallic Phase Dual-Carbide Composites 2013
30
isolated volumes become close they will retain gas from the furnace atmosphere. The
internal pressure of the entrapped gases in the closed volume will resist filling by the melt
under the driving pressure of capillary forces.
This kind of process will also complicate the chemical interactions between the liquid and
solid phases when active as in the RMI. The spontaneous infiltration of the Al-Si alloy in
B4C preforms is like a wicking action; hence it is relatively important to address the
subjects of wetting and capillary phenomenon which is the objective of the following two
subsections.
2.4.2 Wetting Phenomena
Wettability describes ability of a liquid to spread on a solid surface. This usually represents
the extent of intimate contact between a liquid and a solid. Al alloys exhibit poor
wettability of ceramics. This is due to the presence of contamination, moisture or a
adsorbed gas layer covering the ceramic surface, or the Al2O3 layer that coats liquid Al
and/or to the native SiO2 layer that ordinarily covers SiC particles[55].
The infiltration of the liquid into the porous bed depends on the degree at which the liquid
wets the solid. Most often as given in literature sources wettability is determined by using
the sessile drop method. In this method a droplet of liquid, said probe liquid with a known
specific surface energy is placed on the surface of a solid and the contact angle of the drop
is measured, the specific surface energy of the solid being determined from the values of
the contact angle and liquid specific surface energy of a set of several probe liquids. The
results are i en in terms of the contact an le shown in figure 2.15, where if < 90° the
liquid wets the solid. The surface tension or specific surface energies γof the three
interfaces are related to the contact angle through Young's equation [56]:
s sl l ……….Eq. (2.06)
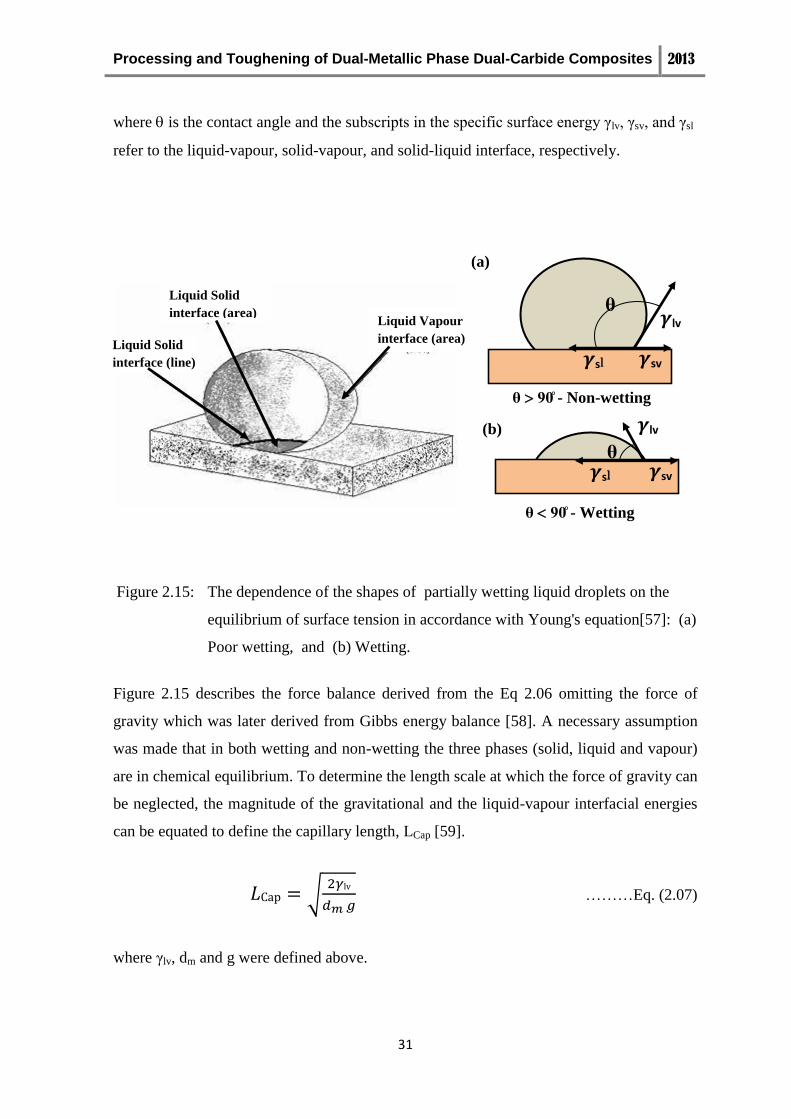
Processing and Toughening of Dual-Metallic Phase Dual-Carbide Composites 2013
31
where is the contact angle and the subscripts in the specific surface ener y γlv, γsv, and γsl
refer to the liquid-vapour, solid-vapour, and solid-liquid interface, respectively.
Figure 2.15: The dependence of the shapes of partially wetting liquid droplets on the
equilibrium of surface tension in accordance with Young's equation[57]: (a)
Poor wetting, and (b) Wetting.
Figure 2.15 describes the force balance derived from the Eq 2.06 omitting the force of
gravity which was later derived from Gibbs energy balance [58]. A necessary assumption
was made that in both wetting and non-wetting the three phases (solid, liquid and vapour)
are in chemical equilibrium. To determine the length scale at which the force of gravity can
be neglected, the magnitude of the gravitational and the liquid-vapour interfacial energies
can be equated to define the capillary length, LCap [59].
………Eq. (2.07)
where γlv, dm and g were defined above.
(a)
(b)
Liquid Solid
interface (area) Liquid Vapour
interface (area) Liquid Solid
interface (line)
θ
θ - Non-wetting
θ
θ - Wetting
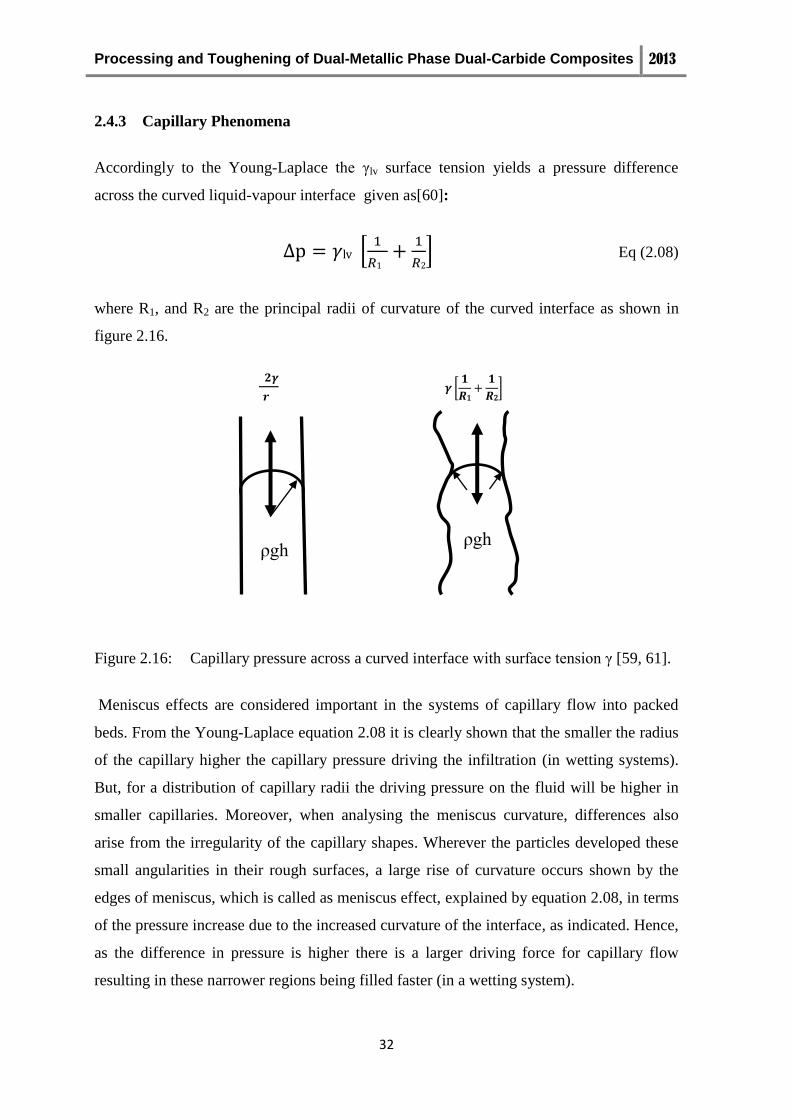
Processing and Toughening of Dual-Metallic Phase Dual-Carbide Composites 2013
32
2.4.3 Capillary Phenomena
Accordingly to the Young-Laplace the γlv surface tension yields a pressure difference
across the curved liquid-vapour interface given as[60]:
Eq (2.08)
where R1, and R2 are the principal radii of curvature of the curved interface as shown in
figure 2.16.
Figure 2.16: Capillary pressure across a curved interface with surface tension γ [59, 61].
Meniscus effects are considered important in the systems of capillary flow into packed
beds. From the Young-Laplace equation 2.08 it is clearly shown that the smaller the radius
of the capillary higher the capillary pressure driving the infiltration (in wetting systems).
But, for a distribution of capillary radii the driving pressure on the fluid will be higher in
smaller capillaries. Moreover, when analysing the meniscus curvature, differences also
arise from the irregularity of the capillary shapes. Wherever the particles developed these
small angularities in their rough surfaces, a large rise of curvature occurs shown by the
edges of meniscus, which is called as meniscus effect, explained by equation 2.08, in terms
of the pressure increase due to the increased curvature of the interface, as indicated. Hence,
as the difference in pressure is higher there is a larger driving force for capillary flow
resulting in these narrower regions being filled faster (in a wetting system).
ρ h
ρ h
Processing and Toughening of Dual-Metallic Phase Dual-Carbide Composites 2013
33
2.4.4 Reactive infiltration of intermetallics and composites
The techniques used and the major problems in wetting of graphite surface and the ceramic
surfaces during the reactive infiltration processes are discussed in this section with the aid
of some experimental works related to Al, Si and B4C. In order to produce stainless steel
fibre reinforced aluminium matrix composites, Colin et al used the squeeze casting
technique. However, they have found that the complex interactions and reactions during
solidification cause significant problems in achieving non-reacted samples [62].
Production of titanium aluminide composites in situ by infiltrating titanium oxide preforms
with aluminium was done by squeeze casting by Fukunaga et al. Alumino thermal
reduction occurred in parallel with infiltration. The flow of the liquid aluminium is
restricted by the formation of the solid reaction layer that constricted the channels for
advancing of the liquid metal. The effect is named as reaction choking, which is also
observed for capillary driven reactive infiltration of carbon by silicon [63].
When considering the potential chemical reactions between the Si and Al elements and the
B4C powder of the preforms there are four reactions that can yield the SiC phase, alone or
in combination with ternary carbides and boron-carbides. The direct reaction of liquid Si
with C (mostly graphite in B4C powders):
……….Eq. (2.09)
at melt infiltration temperatures yields the rhombohedral 15R SiC phase[27].The
simultaneous reaction of B4C with the Al and Si also produces SiC as given by the
following reactions:
………Eq. (2.10)
………Eq. (2.11)

Processing and Toughening of Dual-Metallic Phase Dual-Carbide Composites 2013
34
Besides the reactions 2.09 to 2.12 above, the reaction Si of with B4C may also deliver the
siliconised B12.97Si0.03C2 phase, equation 2.12, whereas B4C may decompose into the high
B and low B sub-carbides, equation 2.13 [12]:
………Eq. (2.12)
………Eq. (2.13)
The temperature dependence of the wetting angles of aluminium and its alloys on graphite
substrates determined by the sessile drop method was investigated by Pastukhov et al [64],
the results for the Al-Si alloy being given in figure 2.17. They found that formation of
aluminium carbide took place after heating the aluminium drop at 1200 ºС which spreads
on the graphite with a wetting angle 38º after 13 minutes. Between 1100 ºС and 1200 ºС
the adhesion of Al to graphite increases from 0.15 J/m2 up to 1.52 J/m
2. In their
experiments the wetting angles of Al on graphite reduced to 85º after 5 minutes at 1200 ºC.
Foaming of the metal drop begins resulting in an increase in volume due to carbide
formation, where the drop moves from the liquid state to a mixed liquid/solid state [64].
Increased temperature above 1200 ºC resulted in greater distortion of the drop, leading to
spread of the liquid aluminium with the formation of a thin coating on the graphite
substrate surface and inflows on the metallic surface of the drop. The drop presented the
Al4C3 phase. Two carbon modifications and one unidentified phase were determined by the
x-ray diffraction.
Better understanding of the wetting properties was gained from the study of wetting and
adhesion of several non-reactive silicon-ceramic systems. It was shown that when band
energy of the solid decreases, the work of adhesion increases and the contact angle
decreases. The existence of these relationships strongly suggests that silicon-ceramic
interface is formed which is associated with the creation of chemical bonds at the interface,
caused by the charge transfer between silicon and the ceramic[65].

Processing and Toughening of Dual-Metallic Phase Dual-Carbide Composites 2013
35
Figure 2.17: Dependence of the wetting angle on temperature in graphite wetting by the
Al-Si melts [64]
The wetting of ceramic materials by liquid silicon, aluminium and metallic melts was
reviewed by Jian-Guo Li and he concluded that wetting in metal/ceramic systems is
complex and depends strongly on the development of chemical reactions at the metal-
ceramic interfaces[55]. In the few of experimental results related to reactive infiltration
processes of B4C by Al, Si in the study of Hayun et al the presence of Al in the B4C–Si
system significantly enhances the transformation of the initial B4C particles into a newly
formed quaternary carbide phase and the kinetics of the rim-region growth. This work was
conducted in the presence of alumina parts inside the graphite furnace. It was the source of
Al in the composites fabricated by infiltration of porous boron carbide preforms with liquid
Si at 1753K under vacuum condition [49].
Toptan et al reported poor wetting of B4C particles by liquid aluminium. The effective
bonding could not be formed at the matrix/reinforcement interface in Al-B4C composites
produced at the relatively lower temperature of 850°C. The poor wetting issue was
effectively solved by allowing for the formation of 80-180 nm thin reaction layers of TiB2
and TiC by adding the K2TiF6 flux [50]. Wu et al [1] stated that during the preparation of
Processing and Toughening of Dual-Metallic Phase Dual-Carbide Composites 2013
36
multi-carbides/(Al, Si) composites by infiltrating porous B4C and B4C/C preforms with
several hypereutectic Al–Si alloys in the temperature range of 1200 ºC – 1400 ºC under
vacuum, the dense composites showed besides B4C, SiC, Al and Si the presence of the
ternary carbides AlB12C2, Al3B48C2. It was also reported that the added C remained
partially unreacted in the composites and lowered the flexural strength. Ductile tearing of
the Al phase and partial de-bonding of Al/carbide interfaces favoured the fracture
toughness of the composites [1].
2.5. Ternary phase diagrams with boron carbide
Three dimensional representations of the equilibrium relations between three components
of a ternary system are known as ternary phase diagrams in which the composition of
phases is considered along the sides of the basal triangle and temperature is plotted along
the vertically axis. Surfaces delimit volumes of coexistence of phases in equilibrium in
accordance with the Gibbs phase rule. Contours representing lines of constant temperature
on surfaces are known as isotherms. The boundary curves of the ternary phase diagrams,
drawn as lines in ternary systems are the homologous of eutectic points of the binary
systems and any composition on one of these curves will crystallize the two phases of the
solidification fields on either side of the curve[66].
Borides keep an important place in many ternary, quaternary and higher order systems
[12]. Of high melting point and stiff, boron itself has a significant role in technology as a
single component material. Its flexibility to enter in the preparation of tailor made solid
solutions and composites provide room for attaining optimised properties of the materials.
Boron is also useful as a sintering aid of covalent bonded compounds of high melting
point. A number of systematic studies and investigations on the characteristics of chemical
bonding in multi-component phases and ternary diagrams have been stated in the recent
times[12]. When elemental boron and carbon are combined with aluminium they become
the appropriate sintering aids to attain high densification of the B4C and SiC ceramics. The
phase relationships pointed out by the B-C-Al-Si quaternary system lead to the appropriate
procedures to identify the composition of transient liquid phases that improved transient

Processing and Toughening of Dual-Metallic Phase Dual-Carbide Composites 2013
37
liquid sintering of the refractory solids. Moreover, molten Al wets and spreads on B4C
surfaces and may be used to infiltrate the B4C porous bodies and acting as a reinforcing
phase [8, 12].
2.5.1 Al-B-C ternary system
The volume of experimental data on the Al-B-C ternary equilibrium system is limited[67].
Six ternary phases, B40A1C4, B48Al12C, B51A12C, orthorhombic B48Al3C8, hexagonal
BAl3C3 (also labelled as B4Al8C7) and the orthorhombic B4A18C may be found in this
system however their ranges of temperature stability are generally unknown. The range of
solubility of the ternary solid solution B12(B,C,Al)3 was determined by Lukas et al who
Figure 2.18: B - Al - C ternary phase diagram at 1400 ºC [5]
Processing and Toughening of Dual-Metallic Phase Dual-Carbide Composites 2013
38
have calculated an isothermal section of the ternary system with the B12(B,C,Al)3 in
equilibrium with a boron-rich Al melt at above 1000°C, by omitting all boron-rich ternary
phases except the T (B4Al8C7) phase given on figure 2.18 [5, 67].
2.5.2 B-C-Si ternary system
he isothermal section at 1727 C of the Si - B - C ternary phase diagram is shown in figure
2.19 [68]. Kieffer et al did the initial experimental study of the B-C-Si ternary phase
diagram and reported the equilibrium between B4C, SiB6 and SiC phases up to
temperatures exceeding 1900 °C [69]. The thermodynamic calculations of Telle confirmed
the existence of a binary phase equilibrium between B4C, Si and the Si and B containing
melt above 1560 °C; the study also rendered in detail the extension of the homogeneity
field of B4C towards the Si-rich corner of the system B-C-Si [17]. Deviations on the B-Si
system in the view of past and more recent experiments and theoretical calculations arose
especially from the less reliable data on equilibrium at the Si rich corner. The problems
with the experiments in the ternary phase diagram are related with the high Si vapour
pressure above 1400 °C. In a latter study the stability of B12(B,C,Si)3 solid solution of B-C-
Si system was found to have the upper limit of 2.5 at% Si [70] which is in equilibrium with
a boron-saturated silicon melt [17]. Above 1380 ºC, the formation of the solid solution of
B12(B,C,Si)3 is corroborated by the β-SiC precipitates which melts eutectically with SiB6
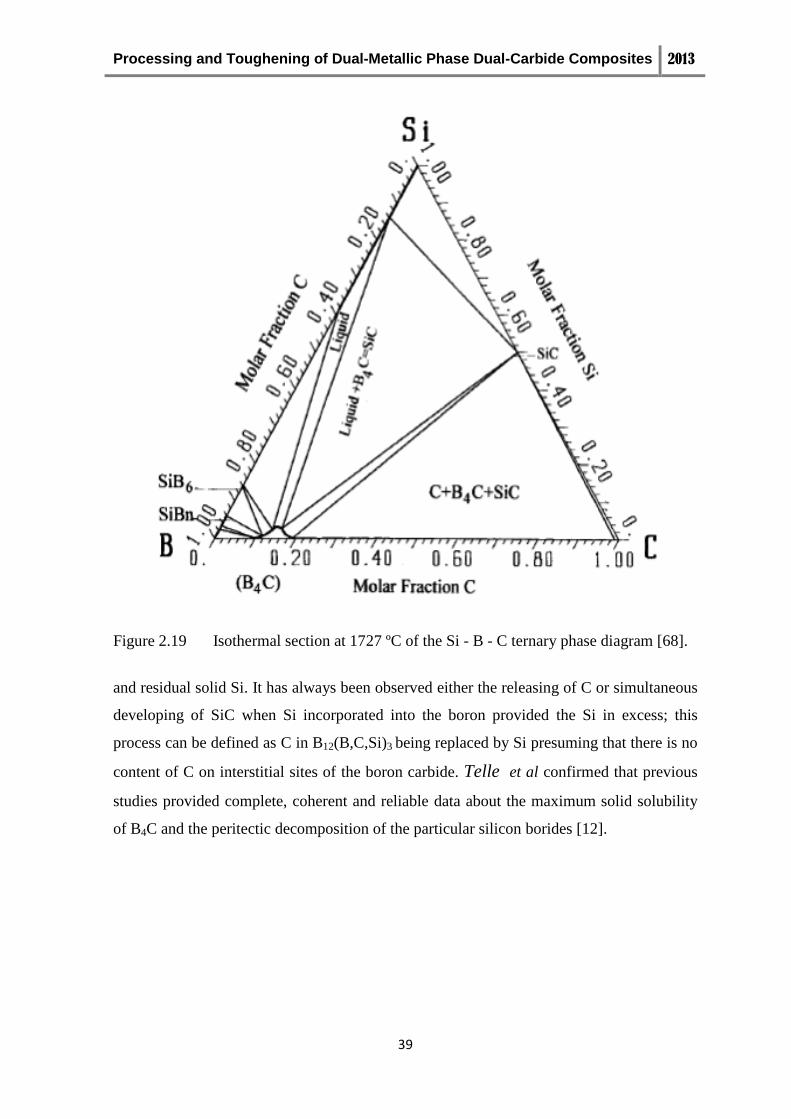
Processing and Toughening of Dual-Metallic Phase Dual-Carbide Composites 2013
39
Figure 2.19 Isothermal section at 1727 ºC of the Si - B - C ternary phase diagram [68].
and residual solid Si. It has always been observed either the releasing of C or simultaneous
developing of SiC when Si incorporated into the boron provided the Si in excess; this
process can be defined as C in B12(B,C,Si)3 being replaced by Si presuming that there is no
content of C on interstitial sites of the boron carbide. Telle et al confirmed that previous
studies provided complete, coherent and reliable data about the maximum solid solubility
of B4C and the peritectic decomposition of the particular silicon borides [12].

Processing and Toughening of Dual-Metallic Phase Dual-Carbide Composites 2013
40
உ औ ंश्ररे् गुरवे सरण ं
Processing and Toughening of Dual-Metallic Phase Dual-Carbide Composites 2013
41
3.0 EXPERIMENTAL PROCEDURE
3.1 Preparation of B4C preforms
3.1.1 B4C powders
Boron carbide (B4C) powder with 10 µm average particle size and density of 2.52 g/cm3
(Electron Microscopy sciences EMS#50510-10, lot #BC80A22#36) was used for preparing
the porous preforms. In order to determine the graphite content of this power by X-ray
diffraction methods (DRX) a second batch of B4C powder, with very low free carbon in its
composition (Electron Microscopy sciences, EMS#50510-18, lot #BC50A25#08) with 18
µm average particle size was utilized. The two as supplied B4C powders and mixtures of
both in the proportions (25 %, 50 %, 75 %) by weight were prepared and submitted to X-
ray diffraction. The mass of 29.2 g of the 10 µm B4C powder was used in simultaneous
thermogravimetric analysis (TG) and differential thermal analysis (DTA) conducted at
temperatures up 800 ºC in the air to derive the thermal behavior of the powder, namely the
weight loss by combustion of free carbon.
3.1.2 B4C preform preparation process
The process flow diagram for preparation of B4C preform is given in figure 3.01. By
estimating the relative density of the preform after pressing to be about 50 % [1] it was
planned to press the B4C into cylindrical pellets of 2 cm diameter and 0.75 cm height. The
(1 wt% PVA + water) 1 wt% soluble dilute polyvinyl alcohol (PVA) solution in amounts
4.0 wt% to 4.5 wt% of PVA was added to the dry B4C powder as pressing aid. For the
intended porosity of 50 % 2.9673 g of B4C powder and 0.1187 g of PVA (4 wt%) were
taken for each pellet, as per the calculation given in the following.
…….. Eq. (3.01)
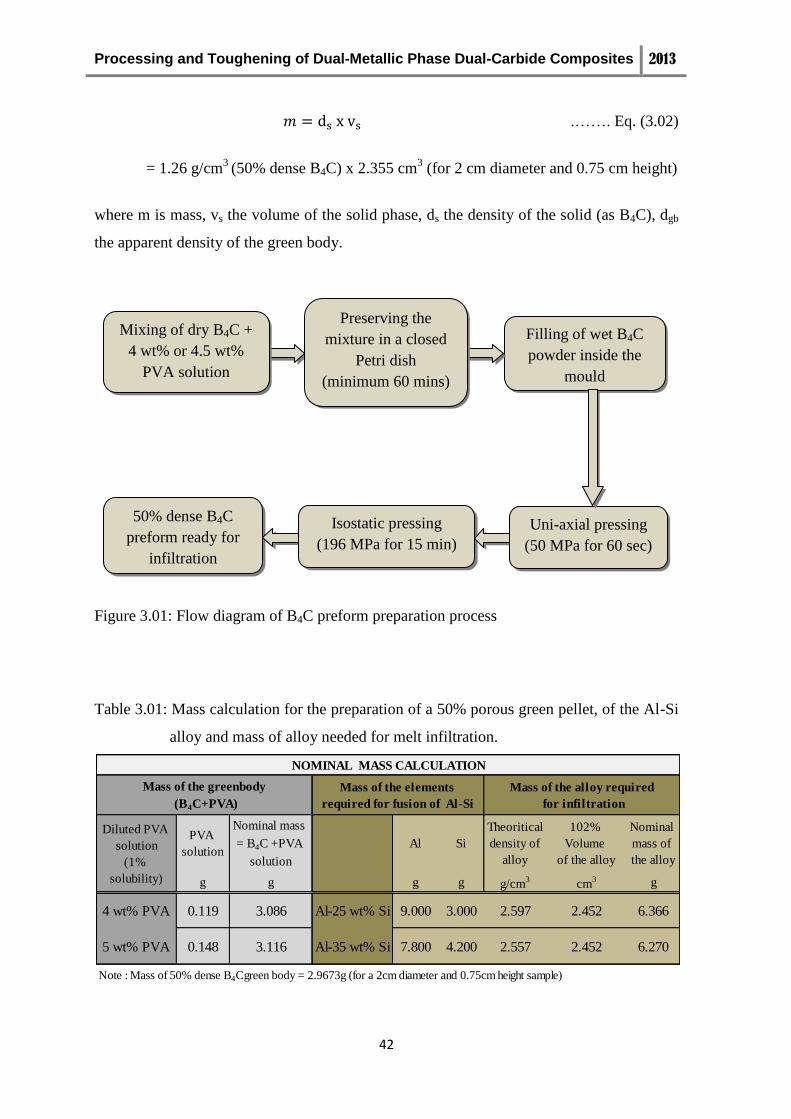
Processing and Toughening of Dual-Metallic Phase Dual-Carbide Composites 2013
42
.……. Eq. (3.02)
= 1.26 g/cm3
(50% dense B4C) x 2.355 cm3 (for 2 cm diameter and 0.75 cm height)
where m is mass, vs the volume of the solid phase, ds the density of the solid (as B4C), dgb
the apparent density of the green body.
Figure 3.01: Flow diagram of B4C preform preparation process
Table 3.01: Mass calculation for the preparation of a 50% porous green pellet, of the Al-Si
alloy and mass of alloy needed for melt infiltration.
PVA
solution
Nominal mass
= B4C +PVA
solution
Al Si
Theoritical
density of
alloy
102%
Volume
of the alloy
Nominal
mass of
the alloy
g g g g g/cm3
cm3 g
4 wt% PVA 0.119 3.086 Al-25 wt% Si 9.000 3.000 2.597 2.452 6.366
5 wt% PVA 0.148 3.116 Al-35 wt% Si 7.800 4.200 2.557 2.452 6.270
Note : Mass of 50% dense B4Cgreen body = 2.9673g (for a 2cm diameter and 0.75cm height sample)
Mass of the elements
required for fusion of Al-Si
Mass of the alloy required
for infiltration
NOMINAL MASS CALCULATION
Diluted PVA
solution
(1%
solubility)
Mass of the greenbody
(B4C+PVA)
Filling of wet B4C
powder inside the
mould
50% dense B4C
preform ready for
infiltration
Mixing of dry B4C +
4 wt% or 4.5 wt%
PVA solution
Preserving the
mixture in a closed
Petri dish
(minimum 60 mins)
Isostatic pressing
(196 MPa for 15 min)
Uni-axial pressing
(50 MPa for 60 sec)

Processing and Toughening of Dual-Metallic Phase Dual-Carbide Composites 2013
43
The dry B4C powder was added to polyvinyl alcohol (PVA) about 4.0% to 4.5 wt.% of the
B4C. The 1% concentrated PVA solution was mixed well with the fine particles of the B4C
powder. Shaking of this mixture with a spatula provided good blending of the loose
particles. They became clustered together and spontaneously granulated into of
approximately spherical shapes of sizes,
Figure 3.02: Granulated mixture of B4C powder and PVA solution
ranging from 0.1 mm to 10 mm, shown in figure 3.02. The soft granulates were collected
and preserved in closed Petri dishes from one to several hours; this length of time
improved the distribution of humidity inside the agglomerates and the bonding of the
particles.
On the completion of this stage, granulates of B4C were crushed by gentle hand pressing
using a rubber bob and weighted with a balance. The correct weighted amount of the
material was filled into the steel mould for uniaxial pressing as shown in the figure 3.03. A
uniaxial load of 50 MPa was applied (Carver Laboratory Press, uniaxial pressing with the
capacity of 5 tons) for the duration of 1 minute in order to achieve the high densification
without delamination of the pressed pellets. The bulk density of the as-pressed cylindrical
pellets of B4C was determined by the measurements of pellet volume and mass, the pressed
samples being preserved in closed Petri dishes.
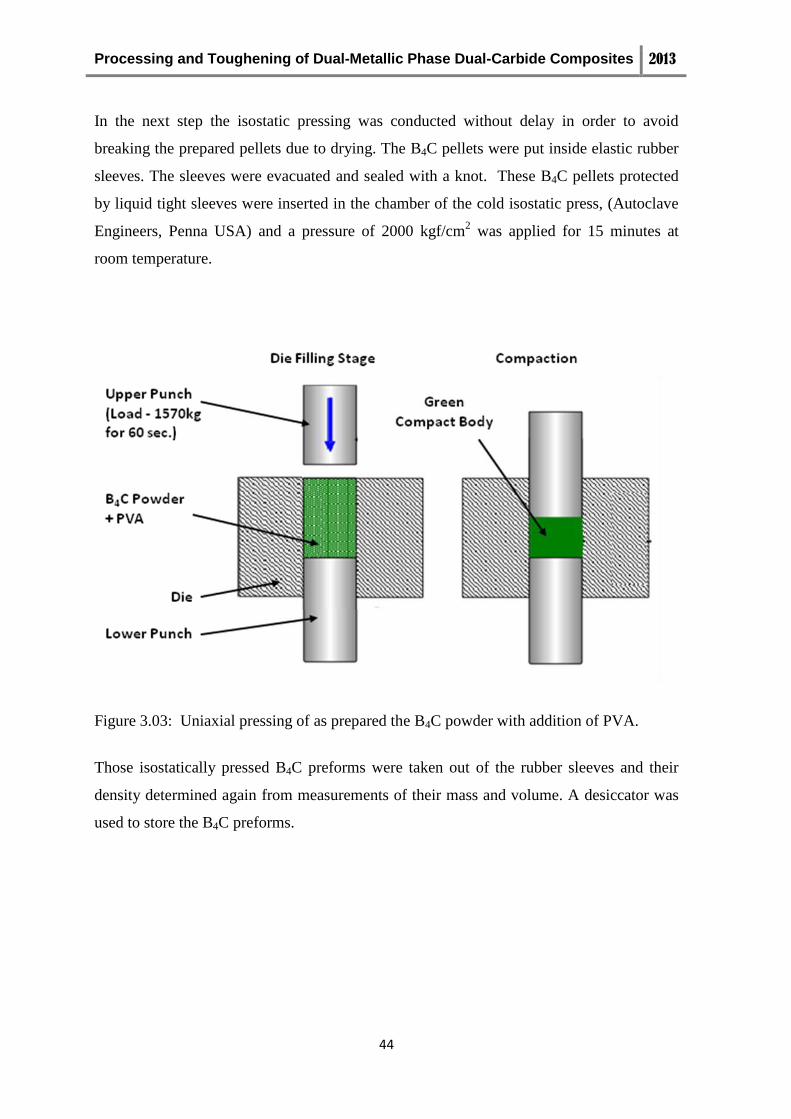
Processing and Toughening of Dual-Metallic Phase Dual-Carbide Composites 2013
44
In the next step the isostatic pressing was conducted without delay in order to avoid
breaking the prepared pellets due to drying. The B4C pellets were put inside elastic rubber
sleeves. The sleeves were evacuated and sealed with a knot. These B4C pellets protected
by liquid tight sleeves were inserted in the chamber of the cold isostatic press, (Autoclave
Engineers, Penna USA) and a pressure of 2000 kgf/cm2 was applied for 15 minutes at
room temperature.
Figure 3.03: Uniaxial pressing of as prepared the B4C powder with addition of PVA.
Those isostatically pressed B4C preforms were taken out of the rubber sleeves and their
density determined again from measurements of their mass and volume. A desiccator was
used to store the B4C preforms.
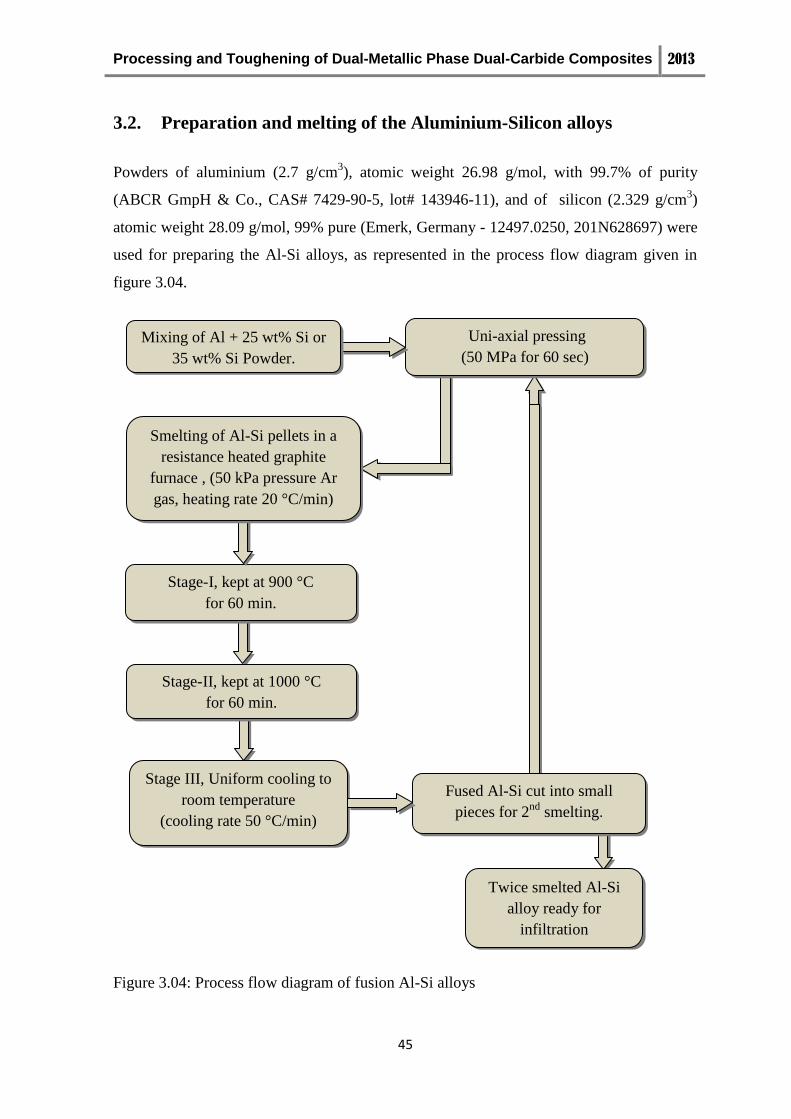
Processing and Toughening of Dual-Metallic Phase Dual-Carbide Composites 2013
45
3.2. Preparation and melting of the Aluminium-Silicon alloys
Powders of aluminium (2.7 g/cm3), atomic weight 26.98 g/mol, with 99.7% of purity
(ABCR GmpH & Co., CAS# 7429-90-5, lot# 143946-11), and of silicon (2.329 g/cm3)
atomic weight 28.09 g/mol, 99% pure (Emerk, Germany - 12497.0250, 201N628697) were
used for preparing the Al-Si alloys, as represented in the process flow diagram given in
figure 3.04.
Figure 3.04: Process flow diagram of fusion Al-Si alloys
Uni-axial pressing
(50 MPa for 60 sec)
Stage-II, kept at 1000 °C
for 60 min.
Stage-I, kept at 900 °C
for 60 min.
Twice smelted Al-Si
alloy ready for
infiltration
Mixing of Al + 25 wt% Si or
35 wt% Si Powder.
Stage III, Uniform cooling to
room temperature
(cooling rate 50 °C/min)
Fused Al-Si cut into small
pieces for 2nd
smelting.
Smelting of Al-Si pellets in a
resistance heated graphite
furnace , (50 kPa pressure Ar
gas, heating rate 20 °C/min)
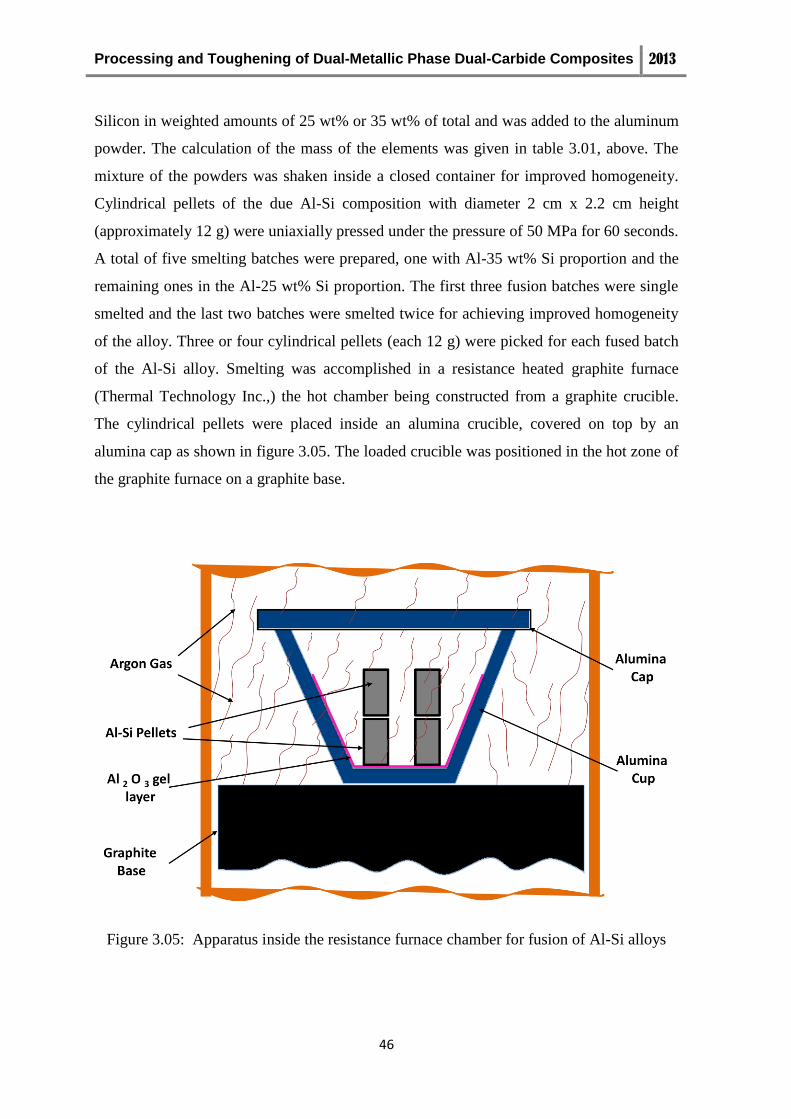
Processing and Toughening of Dual-Metallic Phase Dual-Carbide Composites 2013
46
Silicon in weighted amounts of 25 wt% or 35 wt% of total and was added to the aluminum
powder. The calculation of the mass of the elements was given in table 3.01, above. The
mixture of the powders was shaken inside a closed container for improved homogeneity.
Cylindrical pellets of the due Al-Si composition with diameter 2 cm x 2.2 cm height
(approximately 12 g) were uniaxially pressed under the pressure of 50 MPa for 60 seconds.
A total of five smelting batches were prepared, one with Al-35 wt% Si proportion and the
remaining ones in the Al-25 wt% Si proportion. The first three fusion batches were single
smelted and the last two batches were smelted twice for achieving improved homogeneity
of the alloy. Three or four cylindrical pellets (each 12 g) were picked for each fused batch
of the Al-Si alloy. Smelting was accomplished in a resistance heated graphite furnace
(Thermal Technology Inc.,) the hot chamber being constructed from a graphite crucible.
The cylindrical pellets were placed inside an alumina crucible, covered on top by an
alumina cap as shown in figure 3.05. The loaded crucible was positioned in the hot zone of
the graphite furnace on a graphite base.
Figure 3.05: Apparatus inside the resistance furnace chamber for fusion of Al-Si alloys

Processing and Toughening of Dual-Metallic Phase Dual-Carbide Composites 2013
47
The furnace chamber was flushed with argon gas after evacuation using a rotary pump, the
cycle being successively reaped three times. The furnace chamber was then filled with
flowing Ar gas (with an overpressure of 50 kPa pressure above atmospheric pressure). The
inert atmosphere must protect the metallic melts from oxidation.
The heating cycle, temperature holdings and cooling cycle in the fusion process of the Al-
Si alloys are represented in figure 3.06. On stage I, the furnace is started and the
temperature risen at 20 °C/min heating rate to 900 °C with an hold of 60 minutes for
premixing of the smelted alloy. On stage II, the temperature was further increased to 1000
°C with the same heating rate with a final temperature hold of 60 minutes for better
homogeneity of the melt. Controlled cooling of the melt in the furnace, stage III is done
with a constant cooling rate of 50 °C/min.
0 50 100 150 200 250
0
100
200
300
400
500
600
700
800
900
1000
1100
Al-Si Alloy
Fusion cycle
50°C/min
60 minutes
Tem
pera
ture(°
C)
Time duration (in minutes)
20°C/min
Stage - I Stage - II Stage - III
60 minutes
20°C/min
Figure 3.06: Heating cycle, temperature holdings and cooling cycle in the fusion of Al-Si
alloys.
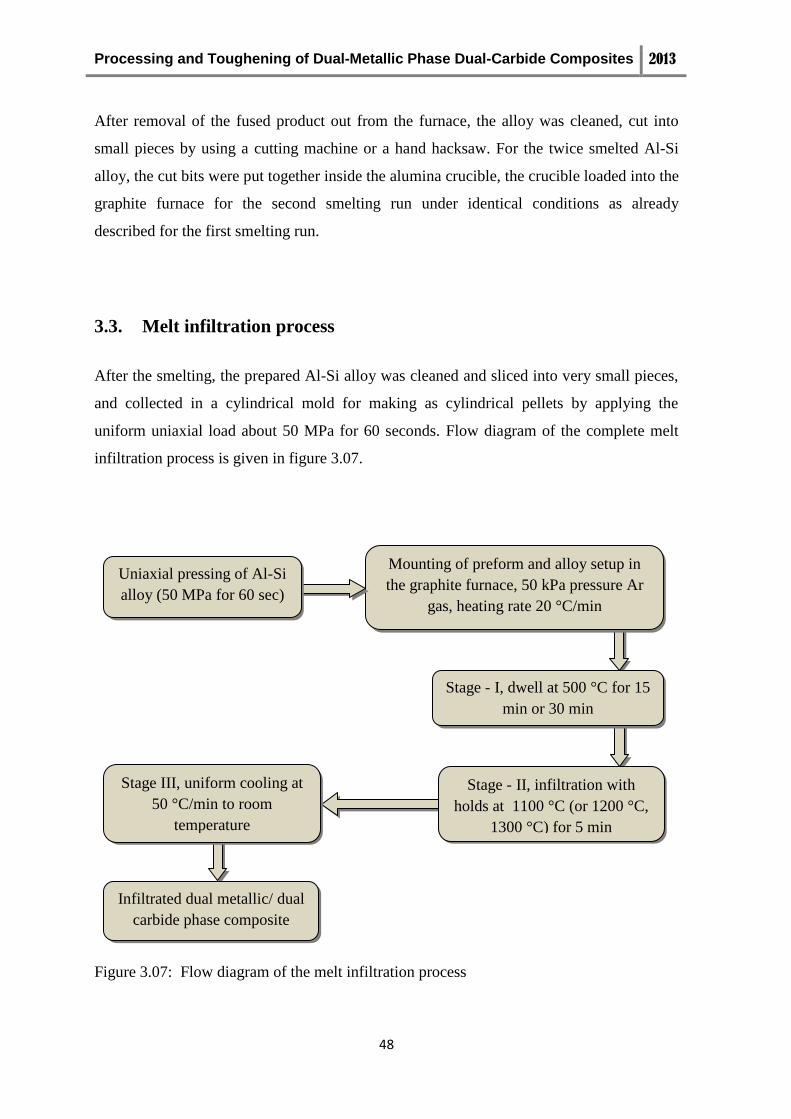
Processing and Toughening of Dual-Metallic Phase Dual-Carbide Composites 2013
48
After removal of the fused product out from the furnace, the alloy was cleaned, cut into
small pieces by using a cutting machine or a hand hacksaw. For the twice smelted Al-Si
alloy, the cut bits were put together inside the alumina crucible, the crucible loaded into the
graphite furnace for the second smelting run under identical conditions as already
described for the first smelting run.
3.3. Melt infiltration process
After the smelting, the prepared Al-Si alloy was cleaned and sliced into very small pieces,
and collected in a cylindrical mold for making as cylindrical pellets by applying the
uniform uniaxial load about 50 MPa for 60 seconds. Flow diagram of the complete melt
infiltration process is given in figure 3.07.
Figure 3.07: Flow diagram of the melt infiltration process
Mounting of preform and alloy setup in
the graphite furnace, 50 kPa pressure Ar
gas, heating rate 20 °C/min
Uniaxial pressing of Al-Si
alloy (50 MPa for 60 sec)
Stage - II, infiltration with
holds at 1100 °C (or 1200 °C,
1300 °C) for 5 min
Stage - I, dwell at 500 °C for 15
min or 30 min
Stage III, uniform cooling at
50 °C/min to room
temperature
Infiltrated dual metallic/ dual
carbide phase composite
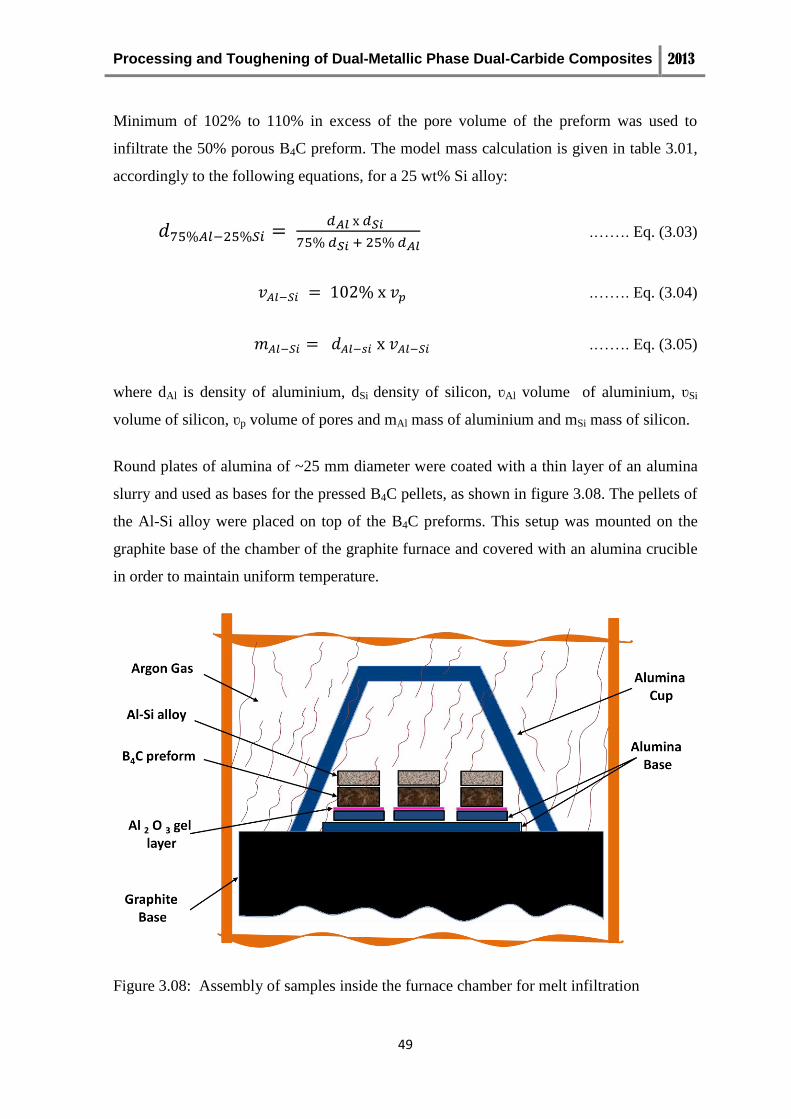
Processing and Toughening of Dual-Metallic Phase Dual-Carbide Composites 2013
49
Minimum of 102% to 110% in excess of the pore volume of the preform was used to
infiltrate the 50% porous B4C preform. The model mass calculation is given in table 3.01,
accordingly to the following equations, for a 25 wt% Si alloy:
.……. Eq. (3.03)
.……. Eq. (3.04)
.……. Eq. (3.05)
where dAl is density of aluminium, dSi density of silicon, ʋAl volume of aluminium, ʋSi
volume of silicon, ʋp volume of pores and mAl mass of aluminium and mSi mass of silicon.
Round plates of alumina of ~25 mm diameter were coated with a thin layer of an alumina
slurry and used as bases for the pressed B4C pellets, as shown in figure 3.08. The pellets of
the Al-Si alloy were placed on top of the B4C preforms. This setup was mounted on the
graphite base of the chamber of the graphite furnace and covered with an alumina crucible
in order to maintain uniform temperature.
Figure 3.08: Assembly of samples inside the furnace chamber for melt infiltration

Processing and Toughening of Dual-Metallic Phase Dual-Carbide Composites 2013
50
The chamber of the resistance heated graphite furnace was flushed three times with Ar gas
as described above in section 3.2 and filled with flowing inert Ar gas kept at a pressure of
50 kPa above atmospheric pressure. Time-temperature cycles of the different melt
infiltration runs are plotted in figure 3.09. On stage I, the furnace temperature is raised to
500 °C with constant heating rate of 20 °C/min and hold for 15-30 minutes at this
temperature to decompose the organic binders in the B4C preform.
0
200
400
600
800
1000
1200
1400
IIIII
Tem
pera
ture
C
Time (in minutes)
20°C/min.
15 min.
30 min.
Infiltration 5 min.
at 1300°C
Infiltration 5 min.
at 1200°C
Stage-I
50°C/min.
50°C/min
Infiltration 5 min.
at 1100°C
50°C/min.
Figure 3.09: Time-temperature cycles of different melt infiltration runs.
On stage II, the temperature was further increased at the same heating rate to the final melt
infiltration temperature (1300 °C for infiltration runs 01 to 08, 1200 °C for infiltration runs
09 to 11, or 1100 ºC trial infiltration runs which failed infiltration) and hold there for 5
minutes. On stage III, controlled cooling is done at the cooling rate of 50 °C/min.
Processing and Toughening of Dual-Metallic Phase Dual-Carbide Composites 2013
51
The products of melt infiltration were cleaned and their dimensions measured in order to
find dimensional changes and to determine the density after infiltration. Density of the
composites was also established by the Archimedes method too. The composite was
immersed in the water. The buoyancy force fI equal to the weight of displaced water was
determined by using a balance, fI been calculated as the difference of weight of the sample
in air and its apparent weight when immersed. By assuming that the melt infiltrate
composite has no open porosity and approaching the specific mass of water to 1 g/cm3 at
room temperature, the volume of the composite sample vc is calculated as the volume of
displaced water:
.……. Eq. (3.06)
where ʋc is the volume of composite, fI the buoyancy force and dH2O the density of water.
3.4 Sample preparation and characterization by XRD and SEM/EDS
The composite was cut into two pieces to expose the cross section by using a water
lubricated diamond saw (Struers – section 10 M/C) of 12.5 cm diameter at the speed of
3000 rpm and 0.005 mm/s feed rate. The two halves were committed for SEM/EDS, XRD
analysis and for the indentation hardness and toughness tests, respectively. The composite
half reserved for hardness and toughness tests was small and difficult to held stable during
harness and toughness tests; hence hot mounting in transparent acrylic resin (Charofast
labopress, Struers) was done.

Processing and Toughening of Dual-Metallic Phase Dual-Carbide Composites 2013
52
Figure 3.10: Cross sectioned composites (one half is acrylic mounted)
For this mounting, the flat side of the cut done in the composite sample was placed on the
polished surface of the machine base (inside the small chamber of the equipment), the
methyl methacrylate powder was used to cover the other sides of the composite sample.
The chamber is closed and heated. When temperature reaches 180 ºC, a 25 kN load is
applied for five minutes followed by the cooling in six minutes. For the second half of the
composite piece used for XRD, SEM/EDS analysis, resin mounting prior to grinding and
polishing was not necessary ant it was not done.
Grinding to create flat surfaces in both halves of the composite was done with the aid of a
semi automatic polishing machine (Struers grinder-polisher M/C), where successive grades
of silicon carbide abrasive paper (from 180, 400, 800, 1000 to 1200 grit sizes) were
utilized. Polishing of the ground surfaces of the composite was done by using polishing
cloth loaded with diamond pastes of 15 µm, 9 µm, 6 µm, 3 µm and 1 µm particle sizes,
respectively. The flatness and quality of finishing of the surface was repeatedly checked
with the optical microscope (Nikon Microport) during polishing. Ultrasonic cleaning of the
samples between grinding and polishing steps was done in the ultrasonic bath (Peralab
Processing and Toughening of Dual-Metallic Phase Dual-Carbide Composites 2013
53
Equipment Industries de Laboratories) for six minutes with the specimen immersed in
ethanol.
The half of the specimen reserved for XRD and SEM/EDS characterization was further
sliced into two parts along the direction of the pellet diameter for adequate fixing in the
sample holder of the X-Ray diffractometer (Rigaku Model - Geigorflux). For the purpose
of XRD analysis, three zones were defined on the cross section area along the infiltration
direction as corresponding to the top, middle and bottom (final of infiltration) zones,
respectively. Examination by XRD was done in the range 2 = 10 - 80 º at 3 º/min, being
the Bragg angle. DRX spectra were repeated three times on each area of observation for
the purpose of quantifying the phases with the aid of XRD standards.
The same specimens of the DRX characterization were also used for SEM/EDS
observation and analysis in the scanning electron microscopes Hitachi S-4100 CFE-SEM
with a Rontec EDS spectrometer and Hitachi SU-70 SE-SEM with the Bruker QUANTAX
400 high yield EDS system (facility of RNME-UA, the National Network of Electron
Microscopy, Pole University of Aveiro; FCT Project REDE/1509/RME/2005). To
eliminate electrical charging of the ceramic phases in the composites, the SEM specimen
after properly glued onto the aluminum stubs were C coated by uisng the carbon coating
unit (EMITECH K950).
Homogenous mixtures of Si, Al, B4C, SiC powders with pre-set weight fractions
representing the Al-Si and B4C-SiC systems and combinations of the two binary systems
were prepared and the corresponding XRD spectra used as standards for the quantitative
analysis of the phases present in Al-Si smelted alloys and in given zones of the cross-
sections of the melt infiltrated composites, Annex A. After analysis of overlapping of XRD
peaks of the different crystalline phases relevant for this study, the intensity of major XRD
peaks of Al, Si, SiC and B4C phases corresponding to the diffraction angles 2 between
38.50° - 39.50°, 28° - 29°, 36° and 38°, respectively, were selected as base for the XRD
quantitative method with standards. For the selected DRX peaks given above polynomial
functions of the relative intensity of the peaks as a function of the weight fractions of the
phases in the mixtures were calculated by least-square methods. Polynomial interpolation
Processing and Toughening of Dual-Metallic Phase Dual-Carbide Composites 2013
54
using the calculated correlation functions was applied to find the weight fraction of each
phase from the corresponding ratio of measured XRD peak heights.
Although the free C (graphite) content in the as supplied 10 µm B4C powder could be
roughly estimated from the value of the intensity ratio C/B4C of the main XRD peaks of
each crystalline phase. Such quantification does not account for the difference of mass
absorption coefficients of the X-rays in the two phases. By using the almost pure 18 µm
B4C powder as internal standard for the quantitative XRD method added with increasing x
weight fractions in the total mixture, the weight fraction of B4C, XB, in the binary system
of crystalline phases of the 10 µm B4C can be determined as the quotient of the constant to
the slope of the linear dependence of the measured peak intensity ratio on the quantity
[x/(1-x)]:
.……. Eq. (3.07)
where XC is the corresponding weight fraction of the C phase (graphite) in the sample and
AB and AC are undeterminable unknowns, the XRD absorption coefficients for the given
peaks of the B4C and graphite phases respectively, that set the value of the calibration
constant of the method, K.
3.5 Indentation hardness and fracture toughness mechanical tests
Vickers indentation hardness was determined on the polished surface of acrylic mounted
specimens. For the Vickers microhardness the testing machine (Shimadzu Data Letty 150)
with a pyramidal diamond indenter and applied load of 1 kgf (9.8 N) was used. The
dimensions of the impression of the indenter were measured with the measuring scale of
the optical microscope of the microhardness equipment.
Processing and Toughening of Dual-Metallic Phase Dual-Carbide Composites 2013
55
The Vickerss hardness (HV) was computed by the formula [71]:
.……. Eq. (3.08)
where P is the applied load, (P = 1, 10 and 30 kgf , 9.8, 98 and 294 N, in the present study)
and a is the average length of the diagonal of the indenter impression. In the standardize
Vickers test method of hardness the load is given in kgf and the indentation diagonal in
mm, hence the Vickers hardness number xxxHVyy/zz specifies the hardness xxx in
kgf/mm2 and it must include the indication of the applied load yy in kgf (and often the
loading time zz in s); in present study it would be HV1, HV10 and HV30. HV1 micro
hardness values were calculated by the software of the microhardness equipment from dial
readings of the diagonal a in the optical microscope. The dimensions of the indenter
impression were also cross checked with images taken with a second optical microscope.
For evaluation of Vickers macrohardness at 98N and 294N loads the macrohardness tester
(Zwick/Roell ZHU) was used. Figure 3.11 indicates the points of the cross section (top,
middle and bottom) where HV10 macrohardness of the composite was measured. The
dimensions of the indenter impression were determined with the optical microscope.
Images were also taken with a second optical microscope and used for measuring the size
of the diamond indenter impression and the length of indentation fracture cracks
propagated from the indentation corners as elements for the determination of indentation
fracture toughness, KIC. In the process of determining KIC, SEM microscopy was also used
to establish in accurate way the position of indentation corners and extent of indentation
crack propagation.
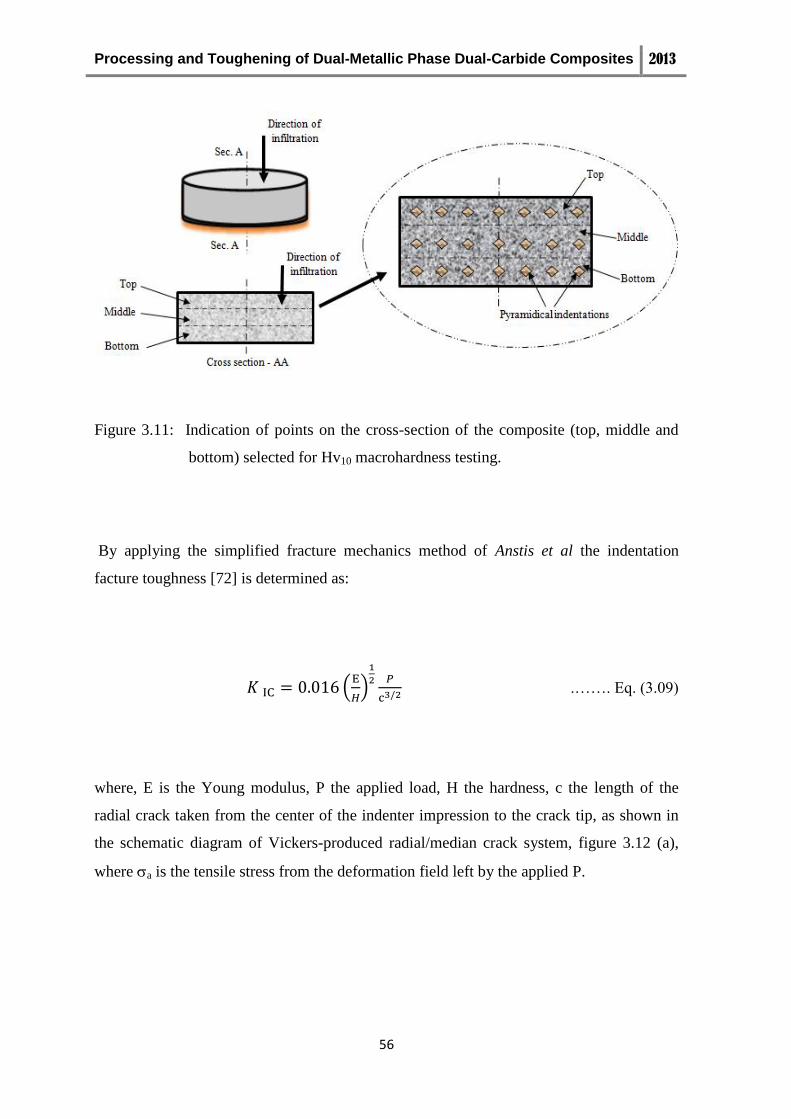
Processing and Toughening of Dual-Metallic Phase Dual-Carbide Composites 2013
56
Figure 3.11: Indication of points on the cross-section of the composite (top, middle and
bottom) selected for Hv10 macrohardness testing.
By applying the simplified fracture mechanics method of Anstis et al the indentation
facture toughness [72] is determined as:
.……. Eq. (3.09)
where, E is the Young modulus, P the applied load, H the hardness, c the length of the
radial crack taken from the center of the indenter impression to the crack tip, as shown in
the schematic diagram of Vickers-produced radial/median crack system, figure 3.12 (a),
where a is the tensile stress from the deformation field left by the applied P.
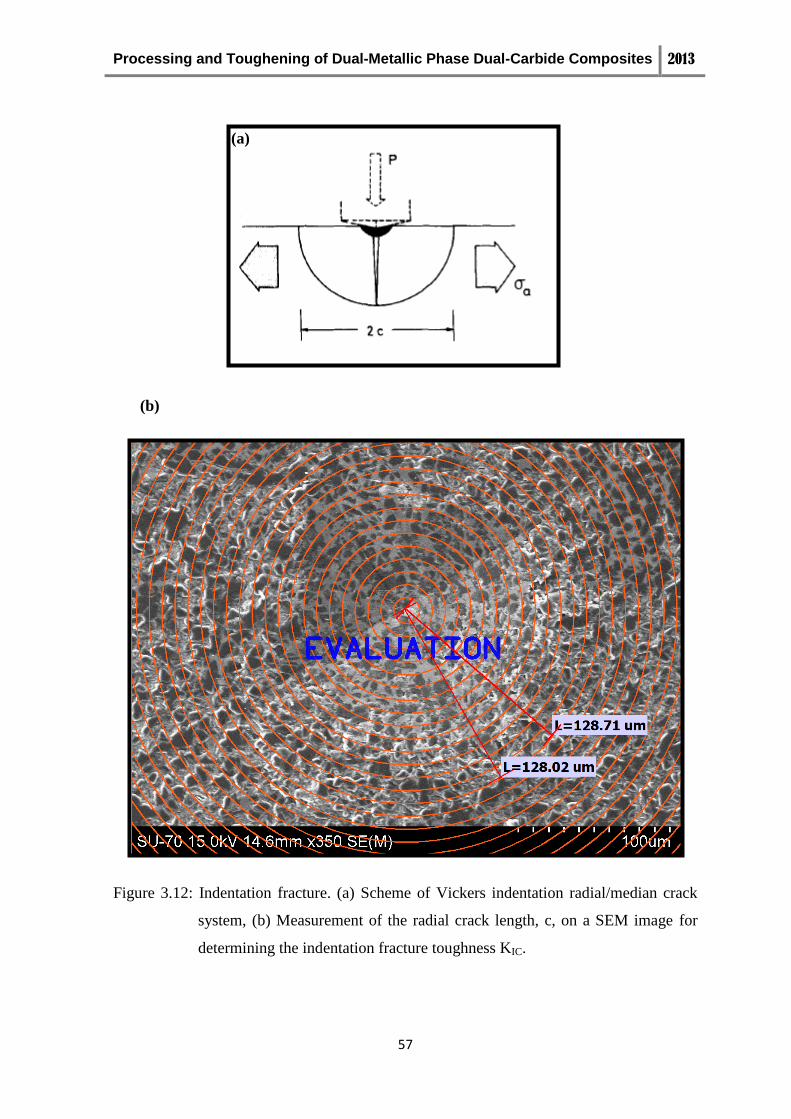
Processing and Toughening of Dual-Metallic Phase Dual-Carbide Composites 2013
57
Figure 3.12: Indentation fracture. (a) Scheme of Vickers indentation radial/median crack
system, (b) Measurement of the radial crack length, c, on a SEM image for
determining the indentation fracture toughness KIC.
(a)
(b)

Processing and Toughening of Dual-Metallic Phase Dual-Carbide Composites 2013
58
உ औ ंश्ररे् गुरवे सरण ं
Processing and Toughening of Dual-Metallic Phase Dual-Carbide Composites 2013
59
4.0 RESULTS AND DISCUSSION
The properties and composition of the B4C powders, degree of compaction of the B4C
preforms, the melting and quality of the Al-Si alloy are presented and discussed in the first
two sections of this chapter. The third section of this chapter gives the results of reactive
melt infiltration of the B4C preforms and discusses the effects of the infiltration processes
along with their causes. Out of the produced composites some show non-infiltration, poor
infiltration or partial infiltration which is discussed with the support of images and
interpreting schemes.
Successfully infiltrated composites prepared in limited numbers from different
compositions and conditions were separated for continuation of the analysis, the
corresponding results were tabulated and are discussed in last two sections of this chapter.
The evolution of microstructure, distribution of phases and phase formation mechanism of
the three composites are dealt with in section 4.4 supported by XRD, SEM/EDS
techniques, quantitative analysis and representation of the composition of the composites
in ternary and quaternary phase diagrams. The mechanical behaviour of the selected three
composites is discussed in the last section of this chapter 4.5 on the bases of
microhardness, macrohardness and indentation fracture toughness results followed by the
tentative description of the mechanism of the fracture.
4.1 Characterization of B4C powder and green density of the preforms
The ceramic raw material of this study, the B4C powder of 10µm average grain size was
selected by considering the fine grain size and size distribution as well deagglomeration as
relevant properties for pressing packing efficiency, the velocity of reactive melt infiltration
and mechanical properties of the composites. B4C powders of about 10 µm mean grain size
with minimum of 5wt.% free carbon may yield enhanced fracture toughness of the melt
infiltrated composites[73]. A coarser B4C powder almost C free, with 18µm average grain
size was used as internal standard in XRD. Characterisation of the 10µm B4C powder to
determine the amount free C from weight loss by combustion of carbon in air was also
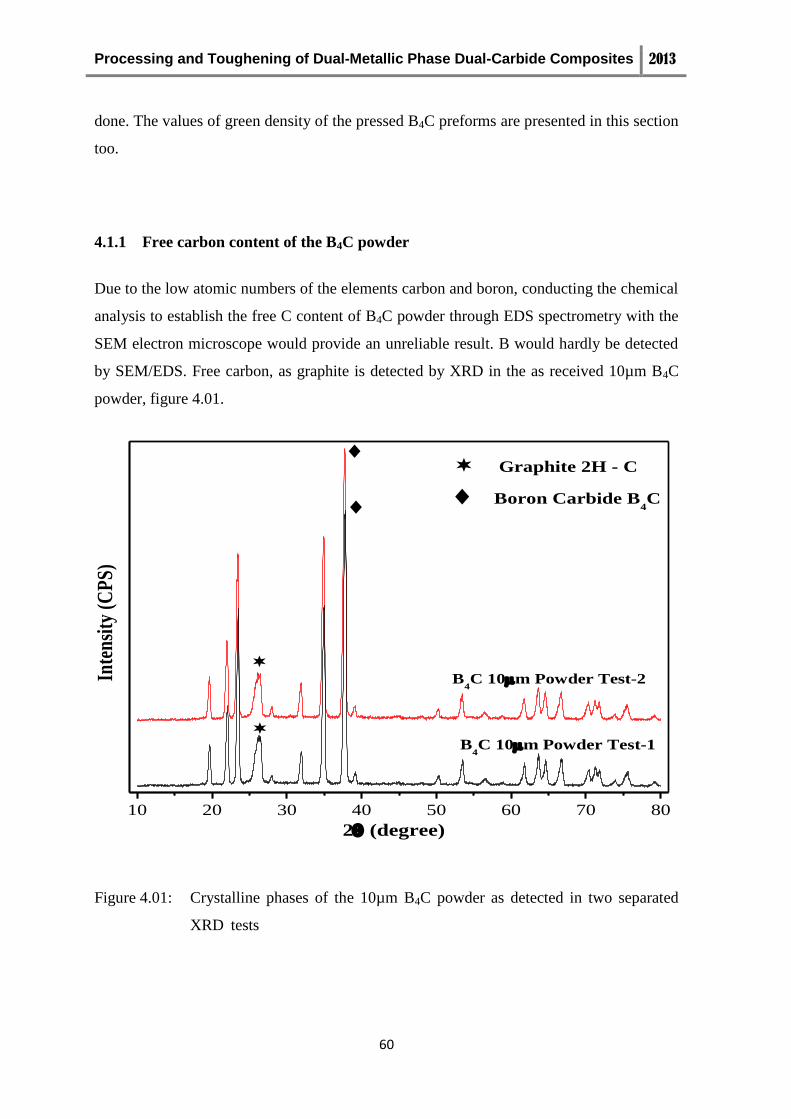
Processing and Toughening of Dual-Metallic Phase Dual-Carbide Composites 2013
60
done. The values of green density of the pressed B4C preforms are presented in this section
too.
4.1.1 Free carbon content of the B4C powder
Due to the low atomic numbers of the elements carbon and boron, conducting the chemical
analysis to establish the free C content of B4C powder through EDS spectrometry with the
SEM electron microscope would provide an unreliable result. B would hardly be detected
by SEM/EDS. Free carbon, as graphite is detected by XRD in the as received 10µm B4C
powder, figure 4.01.
10 20 30 40 50 60 70 80
B4C 10m Powder Test-1
B4C 10m Powder Test-2 In
ten
sity
(C
PS
)
2 (degree)
Graphite 2H - C
Boron Carbide B4C
Figure 4.01: Crystalline phases of the 10µm B4C powder as detected in two separated
XRD tests

Processing and Toughening of Dual-Metallic Phase Dual-Carbide Composites 2013
61
The content of free C, determined as crystalline graphite was established by comparing the
intensity ratio of the main XRD peaks of graphite and B4C phases. The XRD spectra of
each of the B4C powders of particle sized 10µm and 18µm, respectively and of the
mixtures of 10µm powder to which 25 wt.%, 50 wt.% and 75 wt.% of 18µm B4C powder
was added are shown in figure 4.02. XRD results of the as supplied and 10 µm and 18 µm
B4C powders show very similar XRD spectra with the primary peak of B4C registered in
10 20 30 40 50 60 70 80
Boron Carbide B4C
Graphite 2H - C 2. B4C 10m
25%
50%
100%
75%
In
ten
sit
y (
CP
S)
2(degree)
0%
25%
50%
100%
75%
0%
1. B4C 10m
Figure 4.02: X-ray diffraction spectra of the as supplied 10µm and 18µm B4C powders
and their mixtures; results of two independent tests.
2θ (degree)
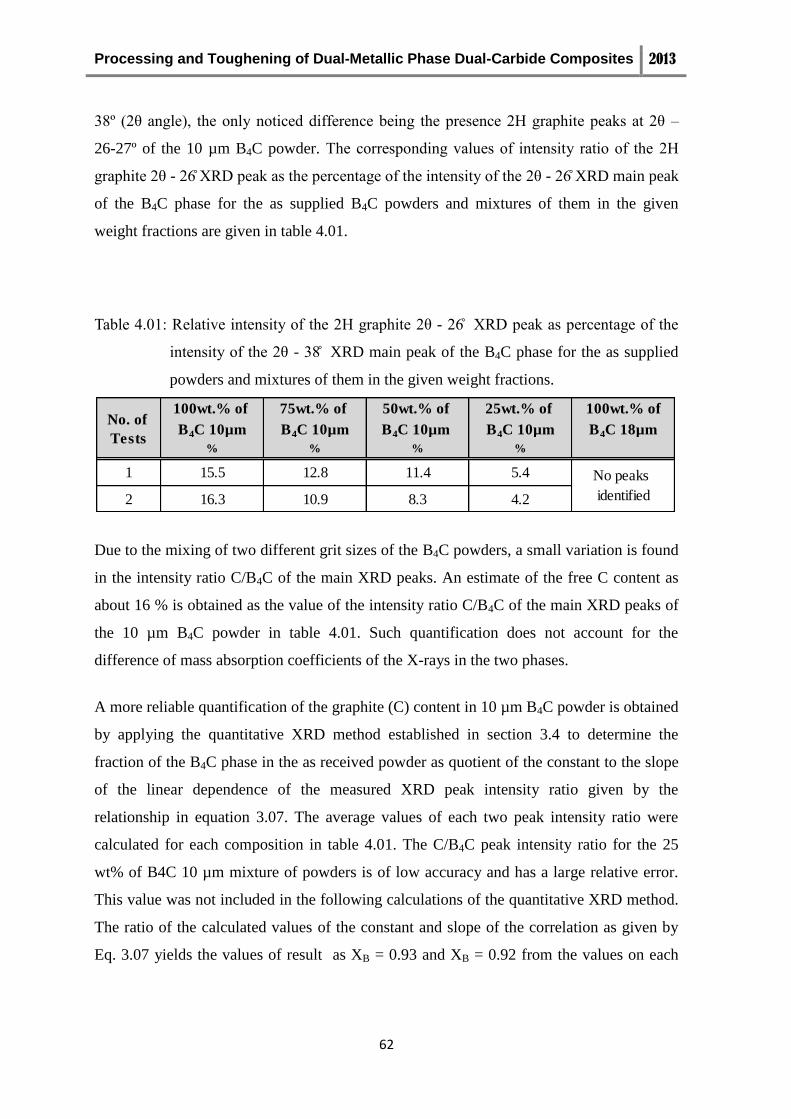
Processing and Toughening of Dual-Metallic Phase Dual-Carbide Composites 2013
62
38 (2 an le), the only noticed difference bein the presence 2 raphite peaks at 2 –
26-27º of the 10 µm B4C powder. he correspondin alues of intensity ratio of the 2
raphite 2 - 26 peak as the percenta e of the intensity of the 2 - 26 XRD main peak
of the B4C phase for the as supplied B4C powders and mixtures of them in the given
weight fractions are given in table 4.01.
able 4.01 elati e intensity of the 2 raphite 2 - 26 peak as percenta e of the
intensity of the 2 - 38 XRD main peak of the B4C phase for the as supplied
powders and mixtures of them in the given weight fractions.
Due to the mixing of two different grit sizes of the B4C powders, a small variation is found
in the intensity ratio C/B4C of the main XRD peaks. An estimate of the free C content as
about 16 % is obtained as the value of the intensity ratio C/B4C of the main XRD peaks of
the 10 µm B4C powder in table 4.01. Such quantification does not account for the
difference of mass absorption coefficients of the X-rays in the two phases.
A more reliable quantification of the graphite (C) content in 10 µm B4C powder is obtained
by applying the quantitative XRD method established in section 3.4 to determine the
fraction of the B4C phase in the as received powder as quotient of the constant to the slope
of the linear dependence of the measured XRD peak intensity ratio given by the
relationship in equation 3.07. The average values of each two peak intensity ratio were
calculated for each composition in table 4.01. The C/B4C peak intensity ratio for the 25
wt% of B4C 10 µm mixture of powders is of low accuracy and has a large relative error.
This value was not included in the following calculations of the quantitative XRD method.
The ratio of the calculated values of the constant and slope of the correlation as given by
Eq. 3.07 yields the values of result as XB = 0.93 and XB = 0.92 from the values on each
100wt.% of
B4C 10µm
75wt.% of
B4C 10µm
50wt.% of
B4C 10µm
25wt.% of
B4C 10µm
100wt.% of
B4C 18µm
% % % %
1 15.5 12.8 11.4 5.4
2 16.3 10.9 8.3 4.2
No peaks
identified
No. of
Tests
Processing and Toughening of Dual-Metallic Phase Dual-Carbide Composites 2013
63
row in table 4.01. The corresponding value free C content in the 10 m B4C will be very
close XC ≈ 8 wt%.
4.1.2 Thermal analysis of the B4C powders
The simultaneous thermogravimetric (TG) and differential thermal analysis (DTA) for both
the 10µm and 18µm B4C powders were done in air for heating temperatures up to at 800
ºC, figure 4.03. The onset of oxidation of B4C in air yielding B2O3 occurs below 800 ºC
[18-20, 74]. As the temperatures for graphite combustion and for oxidation of the B4C
particles neatly overlap the weight loss due to combustion of free carbon alone could not
be clearly determined. The strong exothermic peak at temperatures close to 680 ºC of the
10 m B4C powder in figure 4.03 (a) and the decrease of weight of the TG plot can be
attributed to combustion of free carbon with a growing contribution of oxidation of B4C.
The overlap of the two reactions would be accentuated if the free C is made of graphite
inclusions kept inside the B4C grains or in the dense agglomerates of the grains.
The corresponding exothermic peak of the 18 m B4C powder in figure 4.03 (b) moves to
temperatures above 700 ºC and the observed weight loss is lower in correspondence with
the low the C content and the coarser sizes of the B4C particles. B4C powders revealed net
oxidation in air at 800 ºC [18-20, 74]. The early starting of the exothermic reaction of
oxidation Figure 4.03 (a) for the 10 m B4C powder compared to the reaction in figure
4.03 (b) for the 18m B4C powder gives evidence of graphite presence and of finer particle
size of the B4C corresponding to the figure 4.03 (a).
Processing and Toughening of Dual-Metallic Phase Dual-Carbide Composites 2013
64
Figure 4.03: Simultaneous DTA/TG analysis in air: (a) 10 m B4C powder, (b) 18 m B4C
powder.
(a)
(b)
Processing and Toughening of Dual-Metallic Phase Dual-Carbide Composites 2013
65
4.1.3 Pressing efficiency of the B4C powder
Uniaxial pressing followed by cold isostatic pressing (CIP) was done as described in
section 3.1.2 to attain the estimated 50% of relative density of the green body where 4
wt.% of PVA solution was added as binder. The values of green density in table 4.02 of 24
compacted preforms measured for control of the process range from 1.25g/cm3 to 1.46
g/cm3. The wt % of the added PVA solution is also given in this table along with measured
values of density of the preforms. The relative density values of the prepared preforms in
table 4.02 were calculated by excluding the water content of the PVA solution and its
actual corrected values were given as “corrected” reen density in table 4.02. The
corresponding values of relative density are plotted in figure 4.04.
Table 4.02: Samples of isostatic pressed B4C preform with its corrected green density,
relative density and the PVA solution added for binding.
The green density of preforms compacted by isostatic pressing was improved about 6%
compared to the corresponding values of the density after the first step of uniaxial pressing.
They also maintain the uniform shape in isostatic pressing. Good binding of the B4C
powder was achieved by the initial addition of the PVA solution; however the water in the
binder was completed evaporated during the early heating stages of the infiltration process.
1 2 3 4 5 6 7 8 9 10 11 12
Corrected
green density(g/cm
3) 1.31 1.31 1.33 1.30 1.30 1.31 1.30 1.33 1.30 1.32 1.31 1.33
Relative
density % 51.9 51.9 52.9 51.7 51.7 51.8 51.7 52.8 51.8 52.5 51.9 52.7
PVA solution
added wt% 3.5 4.5
Samples
3 4.5
13 14 15 16 17 18 19 20 21 22 23 24
Corrected
green density(g/cm
3) 1.33 1.33 1.30 1.37 1.37 1.38 1.39 1.36 1.38 1.34 1.33 1.35
Relative
density % 52.9 51.7 54.4 54.3 54.8 55.0 54.1 54.8 53.0 52.7 53.6 52.8
PVA solution
added wt% 4 4.5 4
Samples
4.5 5
Processing and Toughening of Dual-Metallic Phase Dual-Carbide Composites 2013
66
The gray-green shaded performs in table 4.02 were selected to be processed as melt
infiltrated composites and further studied, as described in the following of this chapter.
The average value of density of the isostatic pressed preforms is 1.33±0.03 g/cm3
which
corresponds to the porosity fraction of 47.2 % ± 1%, reported to the density of pure B4C,
2.52 g/cm3 as given in section 3.1.1. The measured relative density of the green preforms is
slightly above the pre-set value of 50% densification.
Experimental factors such as content of added binder (PVA) and retained humidity,
regularity of distribution of the binder and degassing before the final step of CIP may have
contributed for the scatter of values of green density of the preforms around the average
value. All preforms were prepared as batches with various combinations of PVA solution
for ensuring good compacting performance. In the figure 4.04 two sets of values of the
relative density of the preforms are found. The preforms of those values encircled by X
were prepared with 4 wt% to 4.5 wt% of the PVA solution while the preforms of those
values marked with Y were prepared with 5 wt% of the PVA solution.

Processing and Toughening of Dual-Metallic Phase Dual-Carbide Composites 2013
67
0 5 10 15 20 25
51.5
52.0
52.5
53.0
53.5
54.0
54.5
55.0
55.5
Rela
tiv
e D
en
sity
(%
)
Compacted B4C preforms
Figure 4.04: Values of the corrected relative density of isostatic pressed B4C preforms
determined for control of the process, X and Y in the text.
4.2. Characterisation of the Al-Si alloy
The elemental composition, phase structure and mechanical properties of alloys depend on
several factors related to the solidification process. Burminskaya et al reported that
strength and hardness of the binary alloys with mutually insoluble phases increase by
augmenting the amount of the harder phase in the alloys[75]. Moreover the chemical
composition of the alloy also controls the wetting and reaction with the B4C particles even
at the lower temperatures. The smelting process of the Al-Si batches was done in an argon
atmosphere as described in section 3.2, ending with a final isothermal dwell at 1000 ºC for
60 minutes. In the XRD results of four fusion batches given in figure 4.06, Al and Si are
the main phases.
X
Y
Processing and Toughening of Dual-Metallic Phase Dual-Carbide Composites 2013
68
The weight fractions of Al and Si of the batches of Al-Si alloy were determined from
quantitative measurements of the phase main peaks in DRX, 2 = 38.5º for Al and 2 =
28.5º for the Si, by comparison with values of corresponding peak intensity ratio of the
mixtures of Al and Si powders used as standards. The values of the metal weight fractions
in the alloys, the corresponding values of density of the alloy calculated from the nominal
composition and from the weight fractions determined by XRD are given in table 4.02. The
calculated density was determined according to equation 3.03. The maximum solubility of
the Si in Al is 1.65±0.1 at% at the eutectic temperature of 577 ºC. The density of pure Al
(dAl = 2.702 g/cm3) and Si (dSi = 2.329 g/cm
3) metals were taken for calculating the density
of the alloy.
Table 4.03: Composition of the Al-Si alloy batches after melting determined from
quantitative DRX measurements and calculated values of density.
The four batches of Al-Si were melted with little modifications in composition of the
alloys and number of smelting times as given in section 3.2 and table 4.03. The
composition of fusion batch (1) after the smelting was the closest to the corresponding
nominal composition. Batches (3) and (4) were prepared by twice smelting for expectedly
better quality of the alloy. Specimens of the smelted Si-Al batches were also analysed by
SEM/EDS to check the distribution of Al and Si phases in the microstructure and the
Al-Si Mixture
Al Si Al Si
(in wt.%) (wt %) (wt %) (wt %) (wt %) (g/cm3) (g/cm
3)
1 Al-25 wt% Si 76.2 23.8 62.4 37.6 2.60 2.60 I, II(A), III
2 Al-35 wt% Si 70.0 30.0 52.0 48.0 2.56 2.58 IV(B), V
3Al-25 wt% Si
(twice smelted)83.0 17.0 71.0 29.0 2.60 2.63 VI, VII, VIII(C)
4Al-25 wt% Si
(twice smelted)78.0 22.0 73.1 26.9 2.60 2.61 --
Nominal CalculatedNominal
No. of
Batches
Density Indication of
Prepared
Composites
Composition Measured
XRD EDS
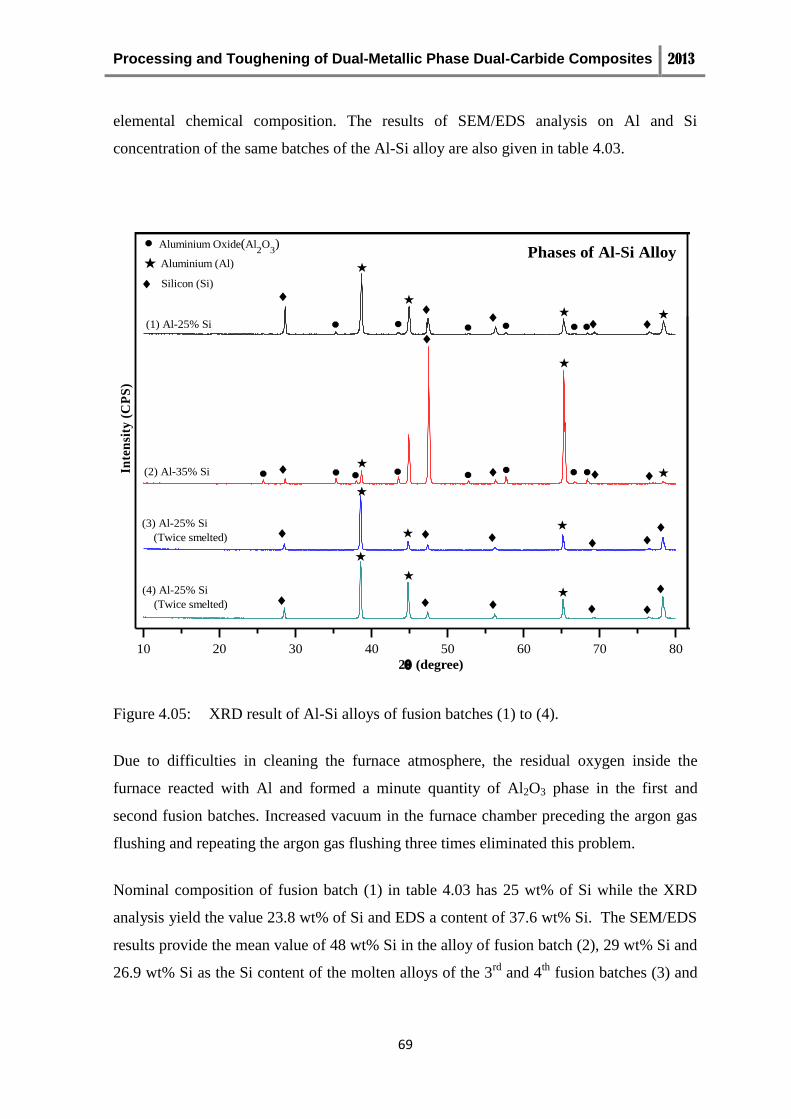
Processing and Toughening of Dual-Metallic Phase Dual-Carbide Composites 2013
69
elemental chemical composition. The results of SEM/EDS analysis on Al and Si
concentration of the same batches of the Al-Si alloy are also given in table 4.03.
10 20 30 40 50 60 70 80
Aluminium Oxide(Al2O
3)
Silicon (Si)
Aluminium (Al)
(2) Al-35% Si
(4) Al-25% Si
(Twice smelted)
(3) Al-25% Si
(Twice smelted)
(1) Al-25% Si
Inte
nsi
ty (
CP
S)
2 (degree)
Phases of Al-Si Alloy
Figure 4.05: XRD result of Al-Si alloys of fusion batches (1) to (4).
Due to difficulties in cleaning the furnace atmosphere, the residual oxygen inside the
furnace reacted with Al and formed a minute quantity of Al2O3 phase in the first and
second fusion batches. Increased vacuum in the furnace chamber preceding the argon gas
flushing and repeating the argon gas flushing three times eliminated this problem.
Nominal composition of fusion batch (1) in table 4.03 has 25 wt% of Si while the XRD
analysis yield the value 23.8 wt% of Si and EDS a content of 37.6 wt% Si. The SEM/EDS
results provide the mean value of 48 wt% Si in the alloy of fusion batch (2), 29 wt% Si and
26.9 wt% Si as the Si content of the molten alloys of the 3rd
and 4th
fusion batches (3) and
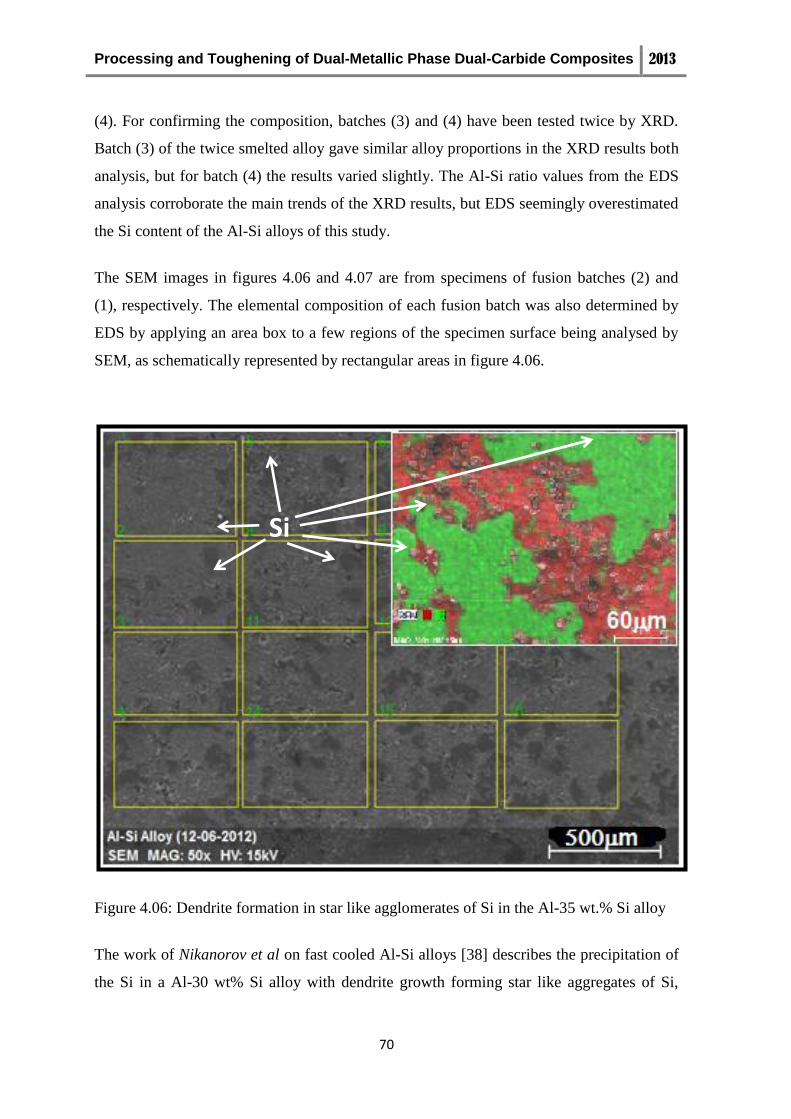
Processing and Toughening of Dual-Metallic Phase Dual-Carbide Composites 2013
70
(4). For confirming the composition, batches (3) and (4) have been tested twice by XRD.
Batch (3) of the twice smelted alloy gave similar alloy proportions in the XRD results both
analysis, but for batch (4) the results varied slightly. The Al-Si ratio values from the EDS
analysis corroborate the main trends of the XRD results, but EDS seemingly overestimated
the Si content of the Al-Si alloys of this study.
The SEM images in figures 4.06 and 4.07 are from specimens of fusion batches (2) and
(1), respectively. The elemental composition of each fusion batch was also determined by
EDS by applying an area box to a few regions of the specimen surface being analysed by
SEM, as schematically represented by rectangular areas in figure 4.06.
Figure 4.06: Dendrite formation in star like agglomerates of Si in the Al-35 wt.% Si alloy
The work of Nikanorov et al on fast cooled Al-Si alloys [38] describes the precipitation of
the Si in a Al-30 wt% Si alloy with dendrite growth forming star like aggregates of Si,
Si
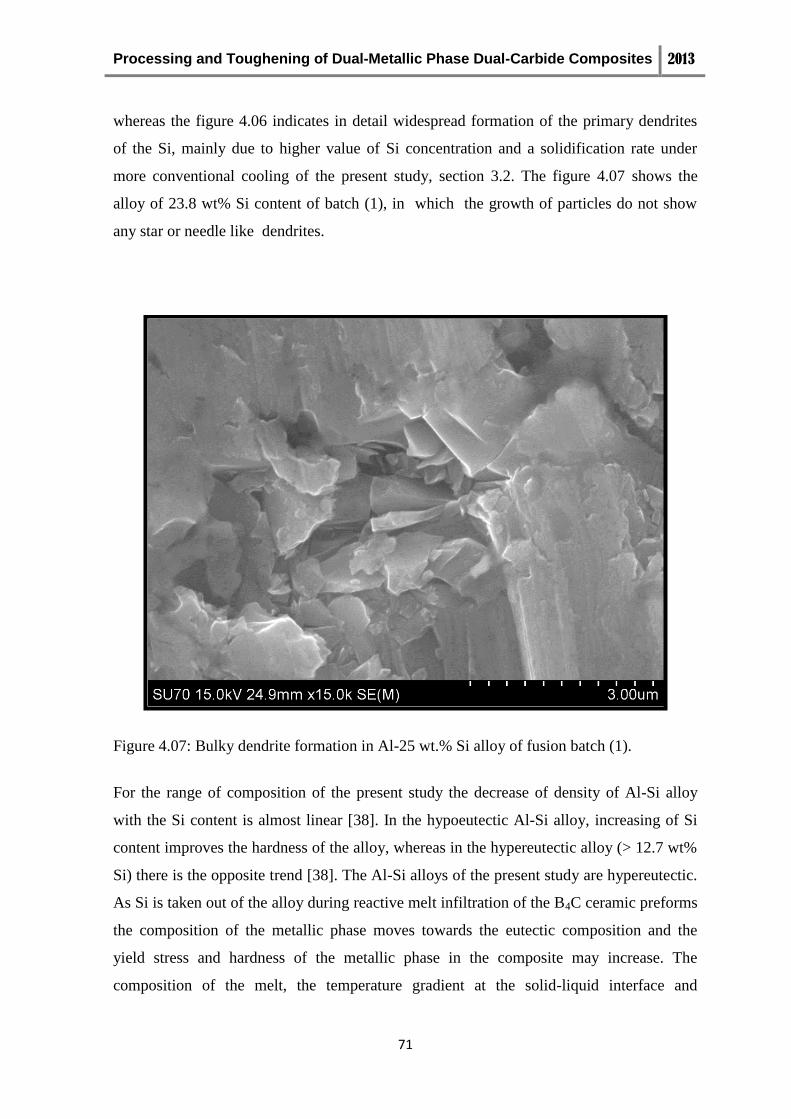
Processing and Toughening of Dual-Metallic Phase Dual-Carbide Composites 2013
71
whereas the figure 4.06 indicates in detail widespread formation of the primary dendrites
of the Si, mainly due to higher value of Si concentration and a solidification rate under
more conventional cooling of the present study, section 3.2. The figure 4.07 shows the
alloy of 23.8 wt% Si content of batch (1), in which the growth of particles do not show
any star or needle like dendrites.
Figure 4.07: Bulky dendrite formation in Al-25 wt.% Si alloy of fusion batch (1).
For the range of composition of the present study the decrease of density of Al-Si alloy
with the Si content is almost linear [38]. In the hypoeutectic Al-Si alloy, increasing of Si
content improves the hardness of the alloy, whereas in the hypereutectic alloy (> 12.7 wt%
Si) there is the opposite trend [38]. The Al-Si alloys of the present study are hypereutectic.
As Si is taken out of the alloy during reactive melt infiltration of the B4C ceramic preforms
the composition of the metallic phase moves towards the eutectic composition and the
yield stress and hardness of the metallic phase in the composite may increase. The
composition of the melt, the temperature gradient at the solid-liquid interface and
Processing and Toughening of Dual-Metallic Phase Dual-Carbide Composites 2013
72
crystallization rate are major factors in solidification. The simultaneous changes of these
factors may lead to conflicting effects on the formation of the microstructure of the
solidified alloy and its mechanical behaviour.
4.3. Al-Si reactive melt infiltration of B4C
The prepared Al-Si alloys were pressed as discs and put on the top of the porous B4C
preforms. The process of spontaneous melt infiltration at the elevated temperature was
conducted as described in section 3.3. During the infiltration and solidification stages the
infiltrated Al-Si alloy reacted with elements of B4C and formed new carbide or boron
carbide phases.
One of the important parameters was the infiltration time as it is intended the time to be
enough for the metal go through the total thickness of the porous samples at the lowest
temperatures that make infiltration feasible and stay short to decrease the extent of
reactions and preserve the Si content in the alloy above the threshold concentration of 12-
13 wt% Si for formation of brittle Al4C [76].The spontaneous infiltration of porous B4C
preforms with Al-Si alloys by the effect of capillary forces of surface tension had been
described in previous works[1, 76] but not at such short duration of infiltration time as
planned for this study. A tentative explanation for the actions occurring inside the pellet
during the infiltration process can be worked out from the early study on the kinetics of the
reaction of B4C with liquid Al, Si and other metals [77], the study of metal spreading
having been done on the polished surfaces of dense sintered B4C ceramic specimen. Liquid
Al may disperse free on a B4C flat surface at a rate of 1x10⁻⁴
m/sec to 8x10⁻⁴
m/sec at
temperatures around 1200 ºC. If during the melt infiltration processes the hypereutectic Al-
Si alloy also advances at such speed, the time for infiltration of a 15 mm thick pellet would
be less than 3 minutes. The same study also showed that the speed of Al spreading was non
constant and came down rapidly as the driving force for flowing of liquid Al on B4C
becomes almost nil in about 4 to 5 minutes due to the formation of new phases in the
contact from reactions of the liquid with the solid phase. At the same time, after 3 minutes
the contact an le of the molten Al had decreased from the initial alue of about 92 to 28
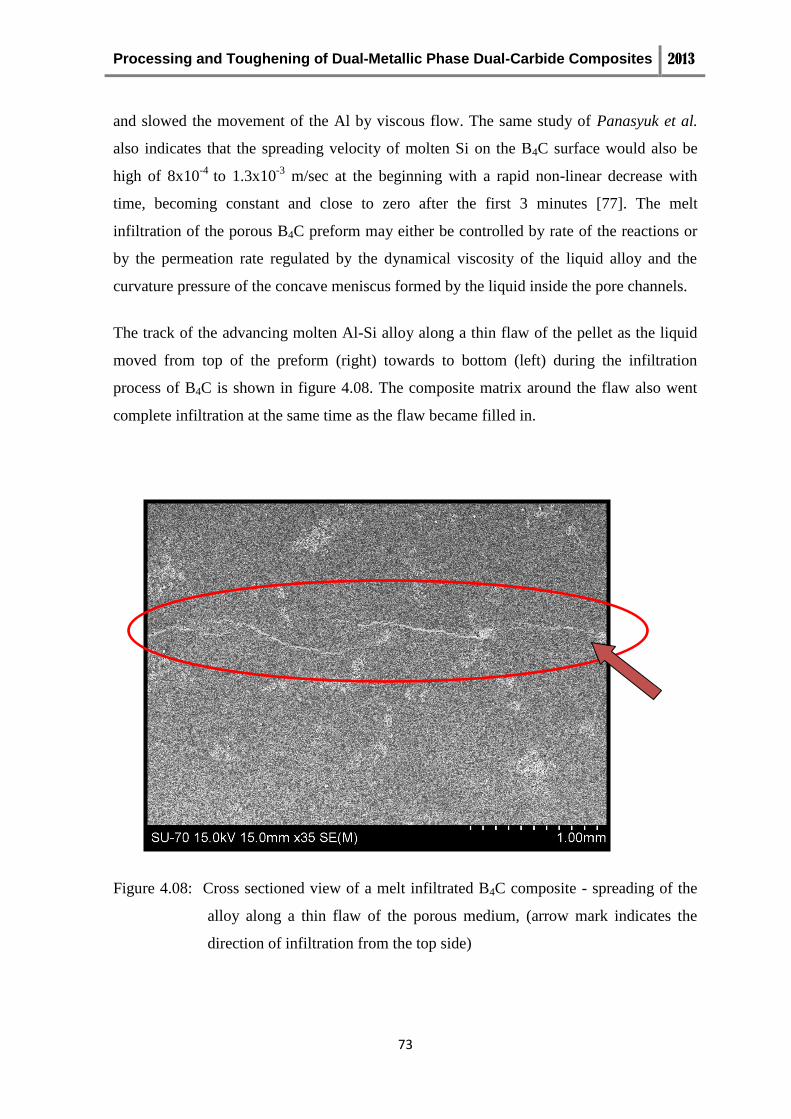
Processing and Toughening of Dual-Metallic Phase Dual-Carbide Composites 2013
73
and slowed the movement of the Al by viscous flow. The same study of Panasyuk et al.
also indicates that the spreading velocity of molten Si on the B4C surface would also be
high of 8x10⁻⁴
to 1.3x10⁻³
m/sec at the beginning with a rapid non-linear decrease with
time, becoming constant and close to zero after the first 3 minutes [77]. The melt
infiltration of the porous B4C preform may either be controlled by rate of the reactions or
by the permeation rate regulated by the dynamical viscosity of the liquid alloy and the
curvature pressure of the concave meniscus formed by the liquid inside the pore channels.
The track of the advancing molten Al-Si alloy along a thin flaw of the pellet as the liquid
moved from top of the preform (right) towards to bottom (left) during the infiltration
process of B4C is shown in figure 4.08. The composite matrix around the flaw also went
complete infiltration at the same time as the flaw became filled in.
Figure 4.08: Cross sectioned view of a melt infiltrated B4C composite - spreading of the
alloy along a thin flaw of the porous medium, (arrow mark indicates the
direction of infiltration from the top side)
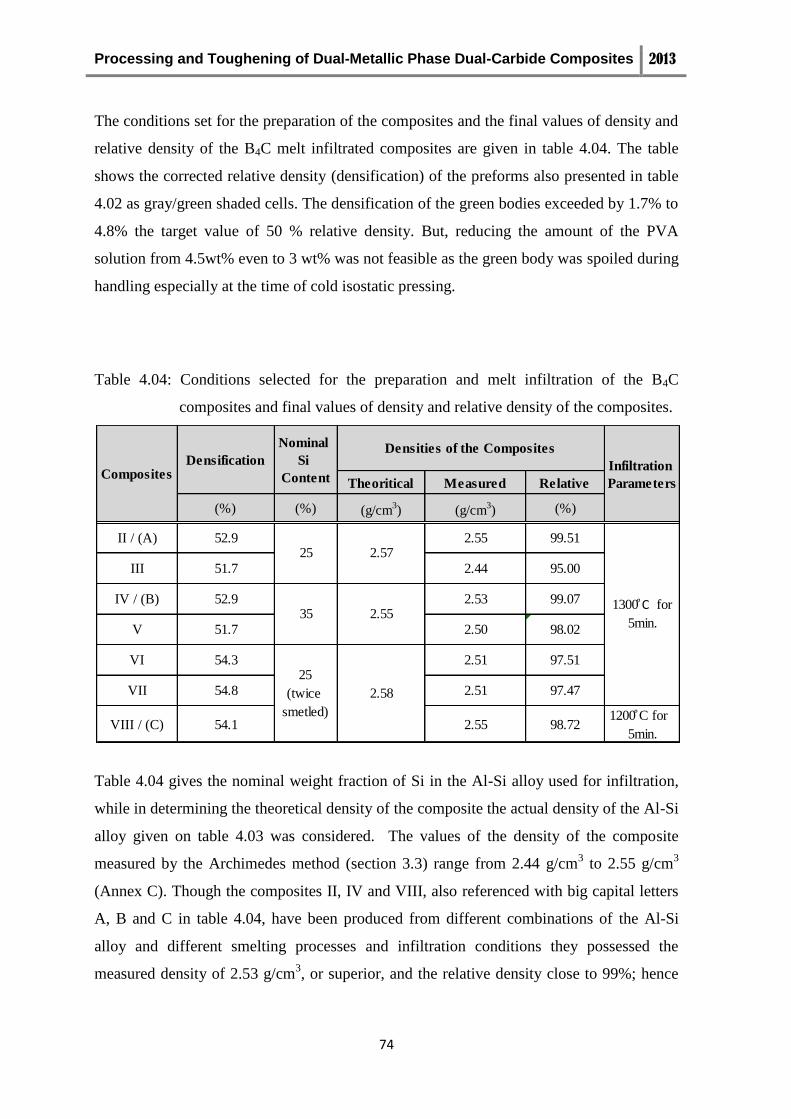
Processing and Toughening of Dual-Metallic Phase Dual-Carbide Composites 2013
74
The conditions set for the preparation of the composites and the final values of density and
relative density of the B4C melt infiltrated composites are given in table 4.04. The table
shows the corrected relative density (densification) of the preforms also presented in table
4.02 as gray/green shaded cells. The densification of the green bodies exceeded by 1.7% to
4.8% the target value of 50 % relative density. But, reducing the amount of the PVA
solution from 4.5wt% even to 3 wt% was not feasible as the green body was spoiled during
handling especially at the time of cold isostatic pressing.
Table 4.04: Conditions selected for the preparation and melt infiltration of the B4C
composites and final values of density and relative density of the composites.
Table 4.04 gives the nominal weight fraction of Si in the Al-Si alloy used for infiltration,
while in determining the theoretical density of the composite the actual density of the Al-Si
alloy given on table 4.03 was considered. The values of the density of the composite
measured by the Archimedes method (section 3.3) range from 2.44 g/cm3 to 2.55 g/cm
3
(Annex C). Though the composites II, IV and VIII, also referenced with big capital letters
A, B and C in table 4.04, have been produced from different combinations of the Al-Si
alloy and different smelting processes and infiltration conditions they possessed the
measured density of 2.53 g/cm3, or superior, and the relative density close to 99%; hence
Theoritical Measured Relative
(%) (%) (g/cm3) (g/cm
3) (%)
II / (A) 52.9 2.55 99.51
III 51.7 2.44 95.00
IV / (B) 52.9 2.53 99.07
V 51.7 2.50 98.02
VI 54.3 2.51 97.51
VII 54.8 2.51 97.47
VIII / (C) 54.1 2.55 98.721200 ͦC for
5min.
Composites Infiltration
Parameters
Densities of the CompositesDensification
Nominal
Si
Content
1300 ͦC for
5min.
25
35
25
(twice
smetled)
2.57
2.55
2.58

Processing and Toughening of Dual-Metallic Phase Dual-Carbide Composites 2013
75
they were selected for further investigation of the structure and mechanical properties of
the composites in the following sections 4.4 and 4.5. The lower values of relative density
of the remaining composites in table 4.04 are explained by the presence of defects of
reactive infiltration of insufficient time for the complete infiltration of their volumes, as
follows.
4.3.1 Failure of the melt infiltration process
During the infiltration processes, a few preforms did not infiltrate due to poor wetting or
oxidation problems. The causes behind those difficulties are analysed here. Figure 4.09
shows three pellets of one same infiltration run at 1300 ºC in which one non-infiltrated
perform was found just aside two other pellets that were both fully infiltrated under same
conditions. In initial infiltration trials the preforms were directly located over the small
alumina plates. Due to brazing at the end of the infiltration cycle, it was difficult to remove
the composite from the plate after processing. A slurry of alumina was painted on the face
of the alumina plates in the following experiments. The thin coating of the alumina fine
powder (C), figure 4.09, may turn into a source of oxidative gases (CO/CO2) when it
becomes reduced in contact with C in the pellet or with the B4C itself. Observation of the
samples also showed that a too thick layer of metal on the top of the pellet (as in
infiltration of 15 mm thick pellets) also contributed to poor wetting as adequate contact
between alloy and B4C was lost and there was a net trend for formation of oxidation layers
on the metal surfaces.
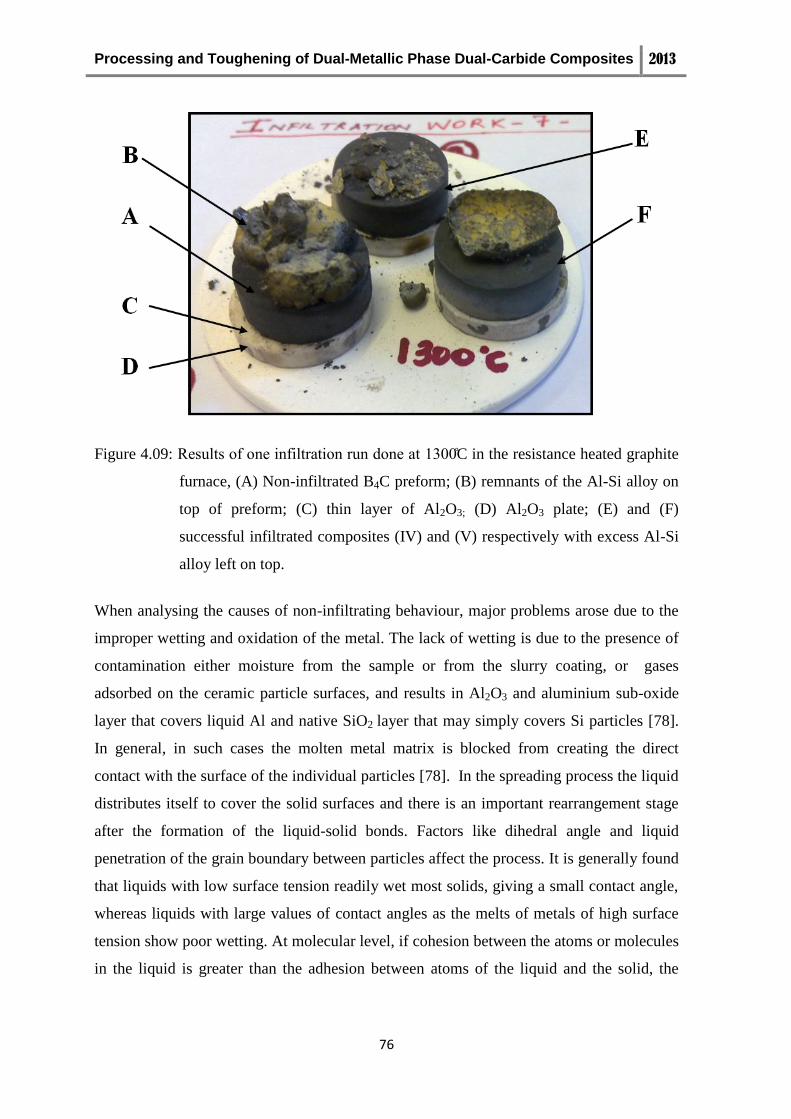
Processing and Toughening of Dual-Metallic Phase Dual-Carbide Composites 2013
76
Figure 4.09: esults of one infiltration run done at 1300 C in the resistance heated graphite
furnace, (A) Non-infiltrated B4C preform; (B) remnants of the Al-Si alloy on
top of preform; (C) thin layer of Al2O3; (D) Al2O3 plate; (E) and (F)
successful infiltrated composites (IV) and (V) respectively with excess Al-Si
alloy left on top.
When analysing the causes of non-infiltrating behaviour, major problems arose due to the
improper wetting and oxidation of the metal. The lack of wetting is due to the presence of
contamination either moisture from the sample or from the slurry coating, or gases
adsorbed on the ceramic particle surfaces, and results in Al2O3 and aluminium sub-oxide
layer that covers liquid Al and native SiO2 layer that may simply covers Si particles [78].
In general, in such cases the molten metal matrix is blocked from creating the direct
contact with the surface of the individual particles [78]. In the spreading process the liquid
distributes itself to cover the solid surfaces and there is an important rearrangement stage
after the formation of the liquid-solid bonds. Factors like dihedral angle and liquid
penetration of the grain boundary between particles affect the process. It is generally found
that liquids with low surface tension readily wet most solids, giving a small contact angle,
whereas liquids with large values of contact angles as the melts of metals of high surface
tension show poor wetting. At molecular level, if cohesion between the atoms or molecules
in the liquid is greater than the adhesion between atoms of the liquid and the solid, the
Processing and Toughening of Dual-Metallic Phase Dual-Carbide Composites 2013
77
liquid will not show the tendency to wet the solid. Hence, the infiltration of porous solids
will not take place in such cases.
There were points where some oxidation of the Al-Si alloy developed during the process.
The alloy was prepared in alumina crucibles. Although it was smelted under an inert argon
atmosphere, an oxide layer grew on the surface of the smelted alloy. It was also seen
forming an interconnected structure which contained pockets of properly smelted alloy. In
order to facilitate wetting and initial spreading of the alloy in the following steps, the alloy
was cleaned by removing the oxide layer and it was sliced into small pieces and pressed
into cylindrical discs as described in section 3.3. Only small oxide particles remained stuck
in the alloy bits.
4.3.2 Partial melt infiltration of B4C preforms
Saw cutting of the melt infiltrated pellets to expose the cross section revealed the presence
of infiltration irregularities with non infiltrated volumes of three different types in some of
the melt infiltrated pellets: (i) central volumes without infiltration in the middle portion of
the pellet, figure 4.10, (ii) volumes at the end face of the pellets centred on the pellet axis
in pellets of larger heights, figure 4.11 and (iii) irregularly shaped volumes laid closely to
the plan normal to the direction of the uniaxial pressing of the cylindrical pellets, figure
4.12. The unbounded B4C that filled these volumes were removed to uncover their walls.
Such irregularities in infiltration result from changes in the speed of spreading of the alloy
along the porosity spaces which may be connected to defects in the pressed pellets or
reactions occurring in the volume of the sample during infiltration. Differences in particle
packing efficiency during pressing may occur due to unequal loading of the moulds and to
internal friction of the hard B4C particles. Internal flaws due to delamination may appear in
the pressed pellets.
Decomposition and pyrolysis of PVA of the binder would produce gases. As escaping of
the residual H2O and pyrolysis gases or removing of gaseous contaminants from the central
volume of the pressed pellets may be delayed, to decrease the risk of developing the
irregularities of the type shown in figure 4.10 and figure 4.11, the holding time of 15
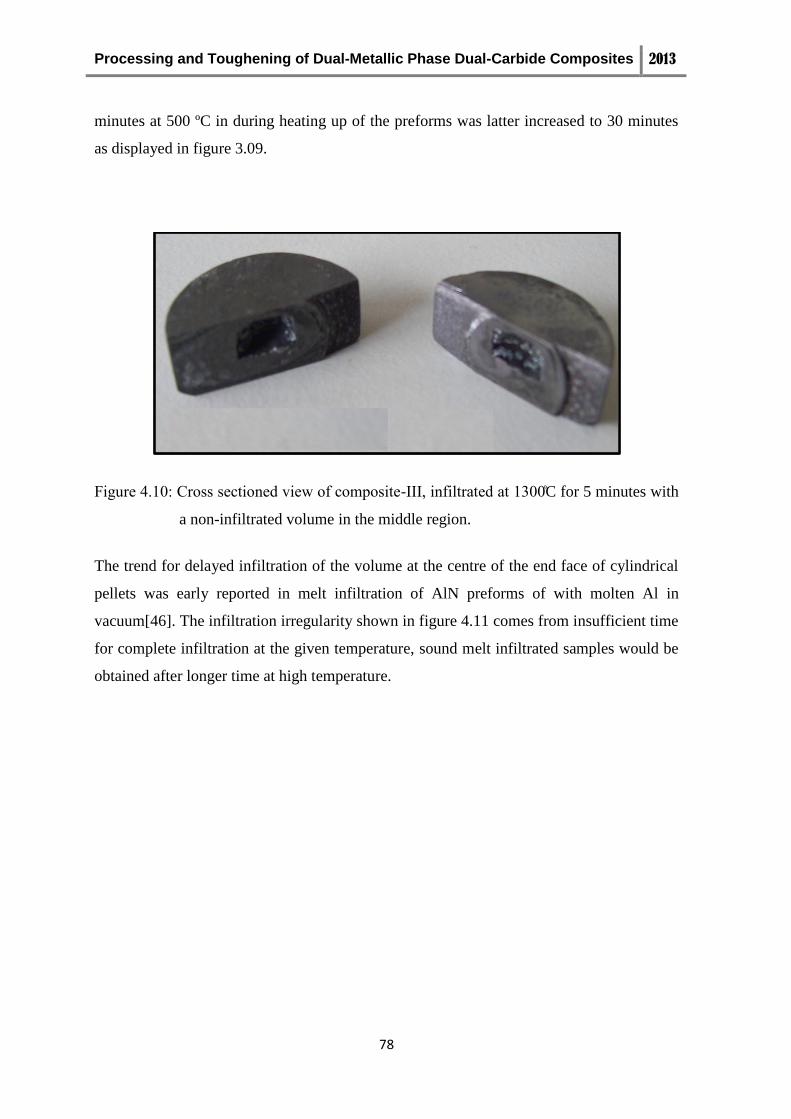
Processing and Toughening of Dual-Metallic Phase Dual-Carbide Composites 2013
78
minutes at 500 ºC in during heating up of the preforms was latter increased to 30 minutes
as displayed in figure 3.09.
i ure 4.10 Cross sectioned iew of composite- , infiltrated at 1300 C for 5 minutes with
a non-infiltrated volume in the middle region.
The trend for delayed infiltration of the volume at the centre of the end face of cylindrical
pellets was early reported in melt infiltration of AlN preforms of with molten Al in
vacuum[46]. The infiltration irregularity shown in figure 4.11 comes from insufficient time
for complete infiltration at the given temperature, sound melt infiltrated samples would be
obtained after longer time at high temperature.
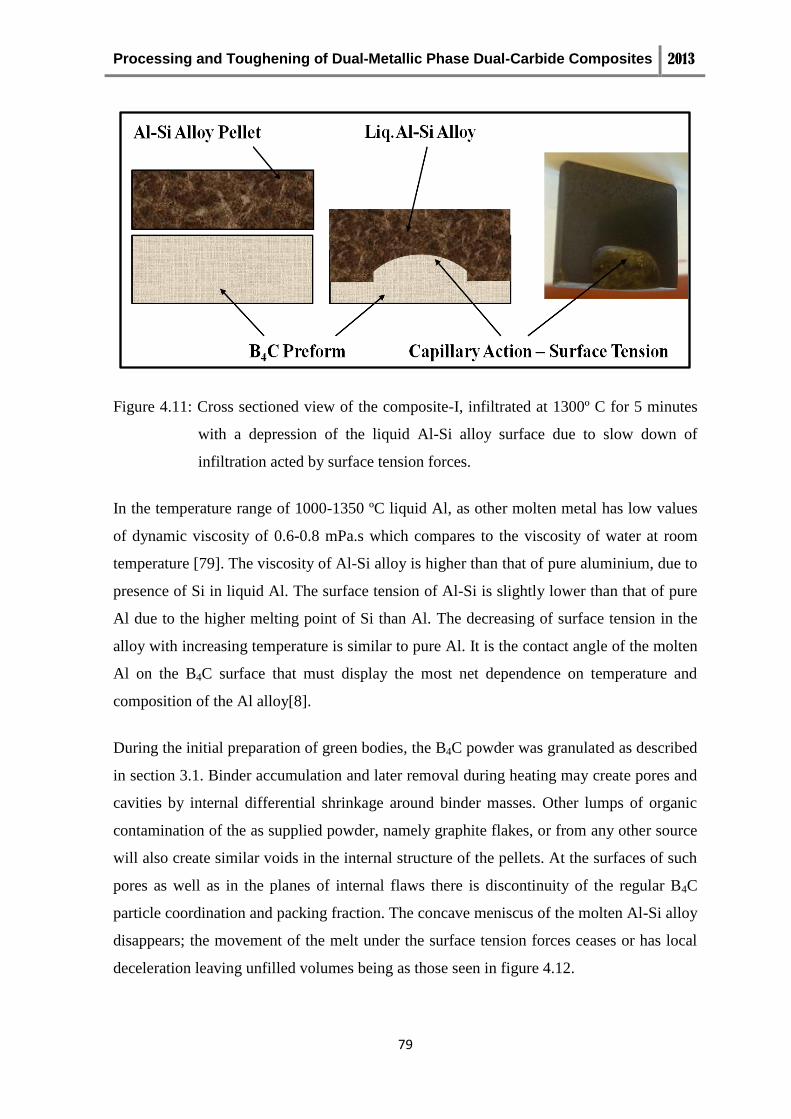
Processing and Toughening of Dual-Metallic Phase Dual-Carbide Composites 2013
79
Figure 4.11: Cross sectioned view of the composite-I, infiltrated at 1300º C for 5 minutes
with a depression of the liquid Al-Si alloy surface due to slow down of
infiltration acted by surface tension forces.
In the temperature range of 1000-1350 ºC liquid Al, as other molten metal has low values
of dynamic viscosity of 0.6-0.8 mPa.s which compares to the viscosity of water at room
temperature [79]. The viscosity of Al-Si alloy is higher than that of pure aluminium, due to
presence of Si in liquid Al. The surface tension of Al-Si is slightly lower than that of pure
Al due to the higher melting point of Si than Al. The decreasing of surface tension in the
alloy with increasing temperature is similar to pure Al. It is the contact angle of the molten
Al on the B4C surface that must display the most net dependence on temperature and
composition of the Al alloy[8].
During the initial preparation of green bodies, the B4C powder was granulated as described
in section 3.1. Binder accumulation and later removal during heating may create pores and
cavities by internal differential shrinkage around binder masses. Other lumps of organic
contamination of the as supplied powder, namely graphite flakes, or from any other source
will also create similar voids in the internal structure of the pellets. At the surfaces of such
pores as well as in the planes of internal flaws there is discontinuity of the regular B4C
particle coordination and packing fraction. The concave meniscus of the molten Al-Si alloy
disappears; the movement of the melt under the surface tension forces ceases or has local
deceleration leaving unfilled volumes being as those seen in figure 4.12.
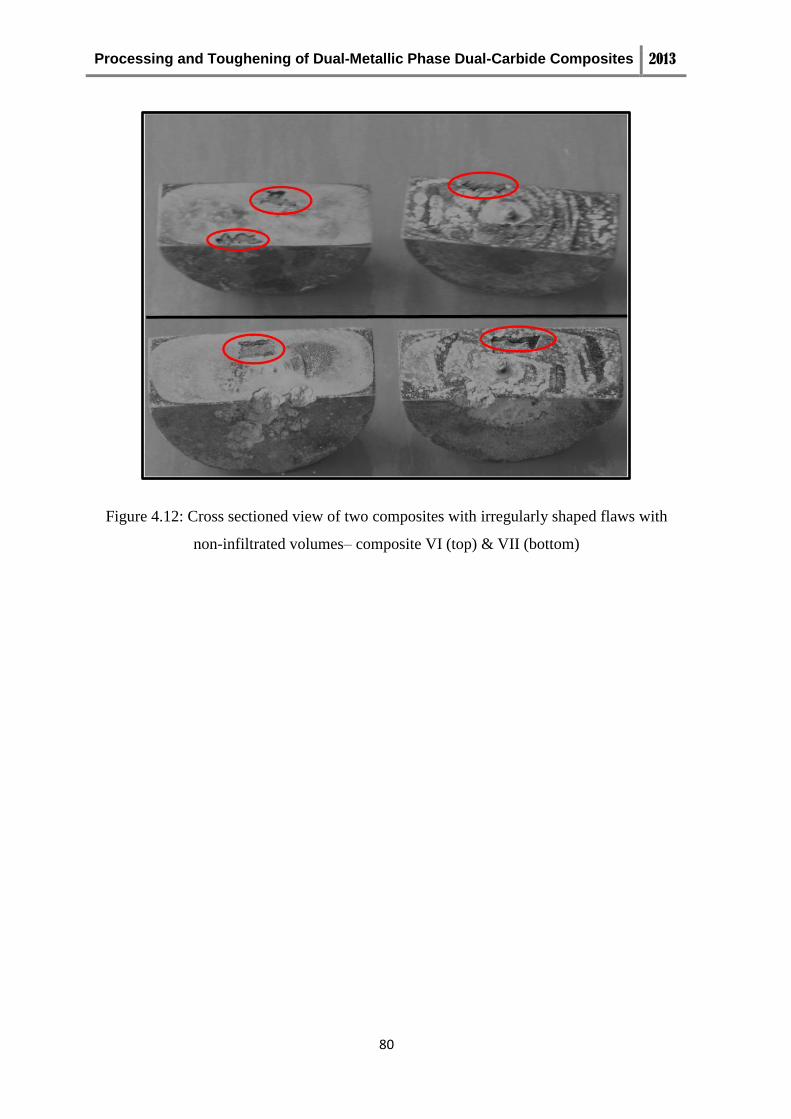
Processing and Toughening of Dual-Metallic Phase Dual-Carbide Composites 2013
80
Figure 4.12: Cross sectioned view of two composites with irregularly shaped flaws with
non-infiltrated volumes– composite VI (top) & VII (bottom)
Processing and Toughening of Dual-Metallic Phase Dual-Carbide Composites 2013
81
4.4. Structural evolution and characterization of the composites
Three fully infiltrated composites of batches II, IV and VIII referred to as A, B, C
respectively, were selected for the microstructural characterization in the following
sections with the aid of XRD results, SEM/EDS, optical microscopy and determination of
mechanical properties of indentation hardness and indentation fracture toughness by
Vickers hardness testing. In this section composites A, B and C are analysed for the
microstructure, formation of phases and the chemical composition of the crystalline
phases. These properties are discussed with graphical representations of the reaction paths
in ternary and quaternary phase diagrams. The preparation methods of the composites had
been presented in chapter 3.
4.4.1 General characterization of the composites
Composites A, B and C were planned to have the estimated porosity of 50% whereas the
actual values of relative density of the composites became 52.9%, 52.9% and 54.1%,
respectively, after the uniaxial and isostatic pressing steps. The composition of the alloy,
density of preforms and infiltration conditions for the preparation of composites were
given before in Tables 4.03 and 4.04.
Composite A was prepared by infiltrating the 47.1% porous B4C preform with the Al-Si
alloy of nominal composition Al-25 wt% Si at 1300 ºC for 5 minutes. The composite
appeared dense with smooth faces. It was easy to rub its faces for cleaning of the surfaces
before performing any measurements. Composite B was prepared by the applying the same
conditions of spontaneous infiltration with the Al-Si alloy of nominal Al-35 wt% Si
composition. This silvery-white composite appeared dense and exhibited micropores on
top and bottom faces where the excess of smelted alloy accumulated due the excess of
about 10% of alloy above the required which was used in this batch. Unlike composite A,
hard rubbing of the faces of composite B was needed for removing of the excess of the
metals before making the measurements of properties of the composite on its surfaces. By
changing the maximum temperature infiltration to 1200 C with the same 5 minutes
infiltration dwell, composite C was produced from a 45.9% porous preform of B4C with
Processing and Toughening of Dual-Metallic Phase Dual-Carbide Composites 2013
82
the twice smelted alloy of nominal Al-25 wt% Si composition. Composite C showed
smooth surfaces without any surface flaws or defects.
The graphical representation of the heating schedules used for infiltrating the three
composites A, B and C was shown before in figure 3.09. When ground by using silicon
carbide grinding paper few minute particles had chipped out (those looked like powder).
After grinding, polishing with diamond pastes and ultrasonic cleaning the cross sectioned
faces of composite A showed small pores easily identified despite being minute and very
shallow. After examination of composite A the dwell time at 500 ºC was increased to 30
minutes to improve the quality of melt infiltrated composites in the following batches.
Observation of composites A, B, and C after the infiltration process confirmed that there
were no noticeable changes of shape neither expansion nor shrinkage observable at the
macroscopic scale. Measurement of the dimensions of pellets of composites A, B, and C
confirmed the low increase in the volume of 0.61 %, 0.06 % and 2.04 %, respectively.
4.4.2 XRD and SEM/EDS analysis of the composites
In this section XRD and SEM/EDS results of composites A, B, and C are presented and
discussed under separate subheadings. Chemical analysis and microstructural analysis of
the composites were made by SEM/EDS. The phase composition of the composites in Al,
Si and B4C phases was plotted in ternary phase diagrams.
In the X-ray diffraction tests, the fractions of the crystalline phases were determined at the
top (T), middle (M) and bottom (B) of the infiltration track after cross sectioning the
pellets along their axis. All composites were composed of the dual metallic phase with Al
and Si and the dual carbide phases, B4C and SiC. The intensity of major XRD peaks of Al,
Si, SiC and B4C phases were measured at the diffraction angles 2 between 38.50° -
39.50°, 28° - 29°, 36° and 38°, respectively. The weight fraction of each of these
crystalline phases in the composite was calculated by applying the quantitative XRD
method with standards previously described in section 3.4. By accounting for the values of
density of the crystalline phases the weight fractions were converted to the corresponding
volume fractions of the phases present in the composites. Volume fractions of phases are
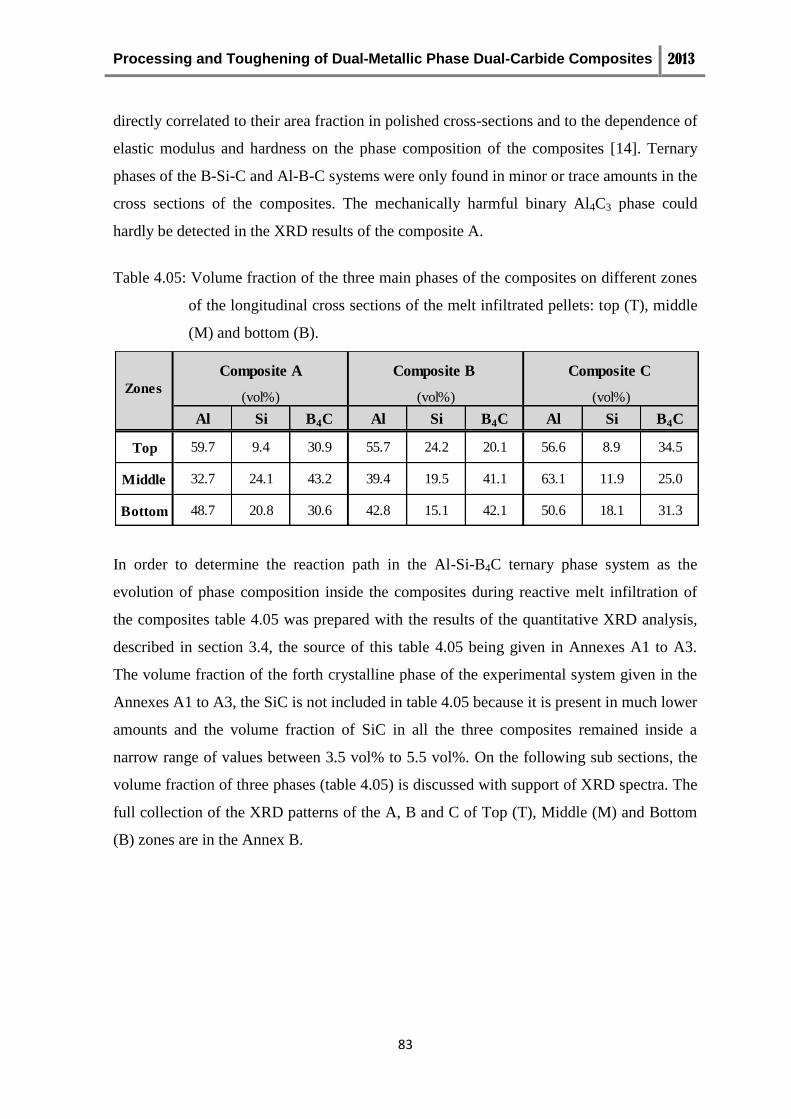
Processing and Toughening of Dual-Metallic Phase Dual-Carbide Composites 2013
83
directly correlated to their area fraction in polished cross-sections and to the dependence of
elastic modulus and hardness on the phase composition of the composites [14]. Ternary
phases of the B-Si-C and Al-B-C systems were only found in minor or trace amounts in the
cross sections of the composites. The mechanically harmful binary Al4C3 phase could
hardly be detected in the XRD results of the composite A.
Table 4.05: Volume fraction of the three main phases of the composites on different zones
of the longitudinal cross sections of the melt infiltrated pellets: top (T), middle
(M) and bottom (B).
In order to determine the reaction path in the Al-Si-B4C ternary phase system as the
evolution of phase composition inside the composites during reactive melt infiltration of
the composites table 4.05 was prepared with the results of the quantitative XRD analysis,
described in section 3.4, the source of this table 4.05 being given in Annexes A1 to A3.
The volume fraction of the forth crystalline phase of the experimental system given in the
Annexes A1 to A3, the SiC is not included in table 4.05 because it is present in much lower
amounts and the volume fraction of SiC in all the three composites remained inside a
narrow range of values between 3.5 vol% to 5.5 vol%. On the following sub sections, the
volume fraction of three phases (table 4.05) is discussed with support of XRD spectra. The
full collection of the XRD patterns of the A, B and C of Top (T), Middle (M) and Bottom
(B) zones are in the Annex B.
(vol%) (vol%) (vol%)
Al Si B4C Al Si B4C Al Si B4C
Top 59.7 9.4 30.9 55.7 24.2 20.1 56.6 8.9 34.5
Middle 32.7 24.1 43.2 39.4 19.5 41.1 63.1 11.9 25.0
Bottom 48.7 20.8 30.6 42.8 15.1 42.1 50.6 18.1 31.3
Composite A Composite B Composite C
Zones
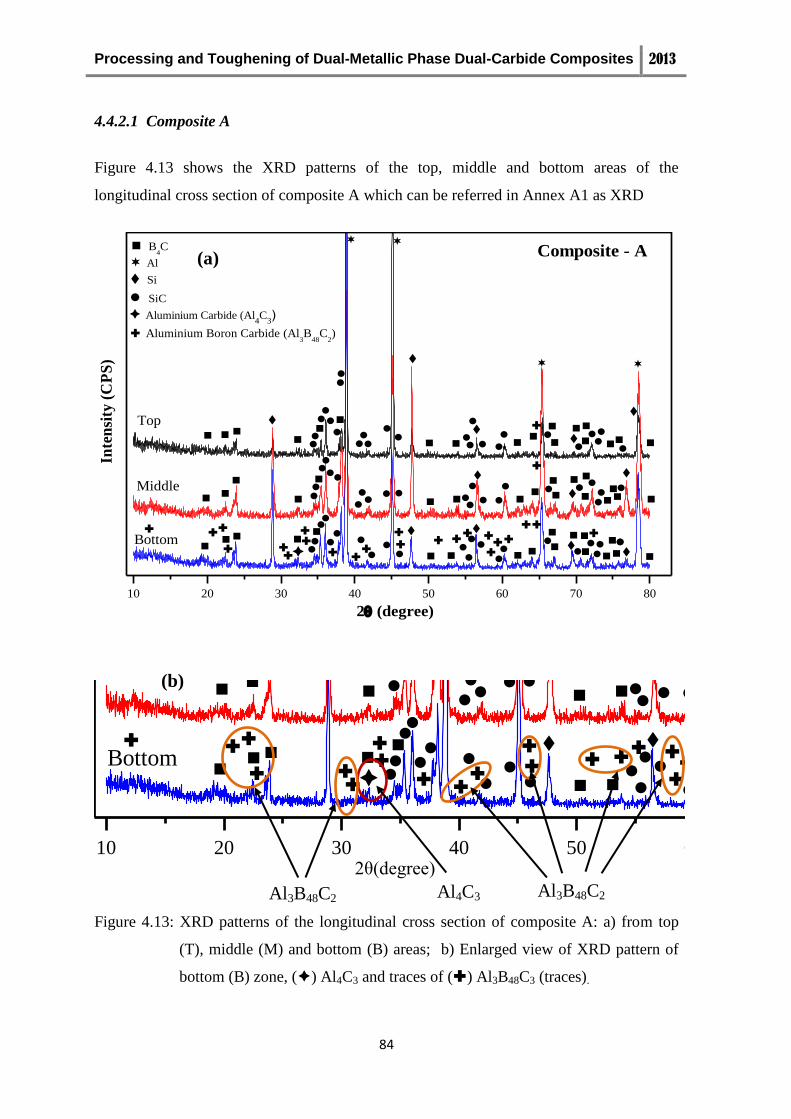
Processing and Toughening of Dual-Metallic Phase Dual-Carbide Composites 2013
84
4.4.2.1 Composite A
Figure 4.13 shows the XRD patterns of the top, middle and bottom areas of the
longitudinal cross section of composite A which can be referred in Annex A1 as XRD
10 20 30 40 50 60 70 80
Middle
Bottom
Top
Inte
nsi
ty (
CP
S)
2 (degree)
Composite - A
SiC
B4C
Si
Al
Aluminium Boron Carbide (Al3B
48C
2)
Aluminium Carbide (Al4C
3)
10 20 30 40 50 60 70 80
Middle
Bottom
Top
Inte
nsi
ty (
CP
S)
2 (degree)
Composite - ´A´
SiC
B4C
Si
Al
Aluminium Boron Carbide (Al3C
48B
2)
Aluminium Carbide (Al4C
3)
Figure 4.13: XRD patterns of the longitudinal cross section of composite A: a) from top
(T), middle (M) and bottom (B) areas; b) Enlarged view of XRD pattern of
bottom (B) zone, () Al4C3 and traces of () Al3B48C3 (traces).
Al4C3 Al3B48C2 Al3B48C2
2 (de ree)
(a)
(b)
Processing and Toughening of Dual-Metallic Phase Dual-Carbide Composites 2013
85
result 1. All major phases of the composites namely the Al, Si, B4C and SiC are observed
in the results of figure 4.13. The presence of ternary phases such as B12.97Si0.3C2 and
aluminium boron-carbide and of traces of the Al4C3 carbide cannot be discharged, but the
main XRD peaks of such phases are found overlapping the XRD peaks of the main
crystalline phases of the composites.
When comparing the intensity of main XRD peaks of Si and B4C from the middle and
bottom zones they are 3 to 4 times more intense than in the top face, which corresponds to
lower concentration of Si and B4C in the top of the pellet, Al having its maximum relative
XRD intensity in the top area. Traces of boron silicon carbide (B12.97Si.03C2) were also
noticed on the bottom region (B) of this composite, but they are faint and are not pointed
on figure 4.13 (b). Also, wherever the boron carbide is found on the bottom zone, the XRD
lines of B12.97Si.03C2 could also be identified. And these kinds of traces were only observed
on the bottom (B) area, not on the other two zones (T) and (B). The analysis of SiC
content in the three areas indicated that the peak intensity of SiC is high and close to that of
B4C despite the amount of SiC carbide being low, the relative fractions of the phases can
only be assigned through the quantitative DRX method with standards.
At cooling state, with constant cooling rate of 50 ºC/min, Si crystallizes out of Al-Si
hypereutectic alloy in the inter-particle spaces. The moving Si solidification interface
separates the solid Si dendrites with low Al content from the liquid melt of composition
increasingly rich in Al, shown in Al-Si phase diagram figure 2.09. At the binary eutectic
point 577 ºC Al and Si metallic phases crystallize together the eutectic mixture of phases of
the local solidification must have the average composition close to the eutectic point.
Depending upon the heating schedule, furnace atmosphere, composition of the alloy
constituents and of the B4C preforms some of the ternary phases of the Al - B - C system
may form. Those phases that can be distinguished in the XRD results in figures 4.13 are
the Al3B48C2 or Al3B12C2 as given by reactions 2.02 and 2.03, respectively. These two
phases may also form by the reaction between B4C and Al2O3. Aluminium oxide or sub-
oxide was present as a thin oxide coating on the bits of the smelted alloy due to
contamination by the residual oxygen in the argon atmosphere of the furnace. However
these reactions are not present in relevant levels as these compounds are found in traces
only on bottom (b) area of composite A.

Processing and Toughening of Dual-Metallic Phase Dual-Carbide Composites 2013
86
The EDS maps in figures 4.14 (a), (b), (c) and (d) give the distributions of the elements Si,
Al, B and C in the phases that compose the microstructure of composite A. The metallic
phases Si and Al in the microstructure are depicted in orange and green colours,
respectively. A thin C coating was applied on the polished surface of the composite to
avoid electrical charging in SEM. Because B and C are elements of low atomic number
they are detected by the light element EDS detector but cannot be accurately quantified by
EDS analysis.
Figure 4.14: EDS maps of the elements of SEM microscopy of bottom zone of
composite of A: (a) Si; (b) Al and Si; (c) B and (d) with all four elements
Al, Si, B and C.
(a) (b)
(c) (d)
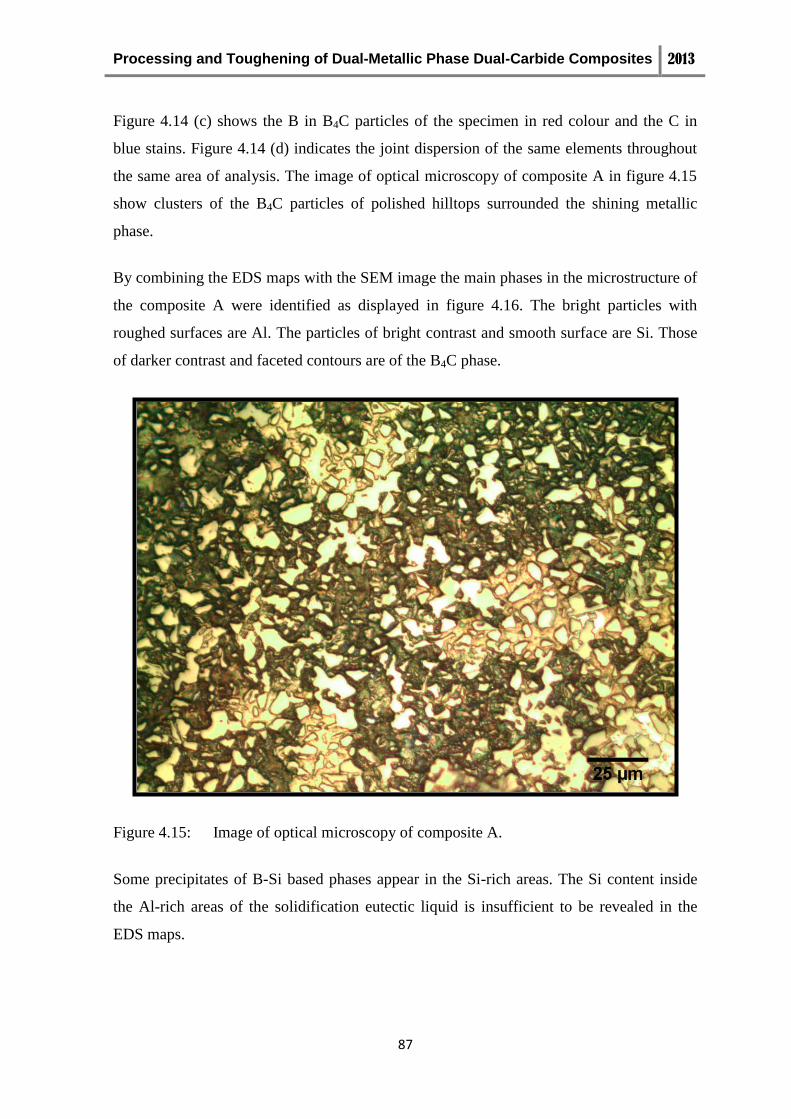
Processing and Toughening of Dual-Metallic Phase Dual-Carbide Composites 2013
87
Figure 4.14 (c) shows the B in B4C particles of the specimen in red colour and the C in
blue stains. Figure 4.14 (d) indicates the joint dispersion of the same elements throughout
the same area of analysis. The image of optical microscopy of composite A in figure 4.15
show clusters of the B4C particles of polished hilltops surrounded the shining metallic
phase.
By combining the EDS maps with the SEM image the main phases in the microstructure of
the composite A were identified as displayed in figure 4.16. The bright particles with
roughed surfaces are Al. The particles of bright contrast and smooth surface are Si. Those
of darker contrast and faceted contours are of the B4C phase.
Figure 4.15: Image of optical microscopy of composite A.
Some precipitates of B-Si based phases appear in the Si-rich areas. The Si content inside
the Al-rich areas of the solidification eutectic liquid is insufficient to be revealed in the
EDS maps.
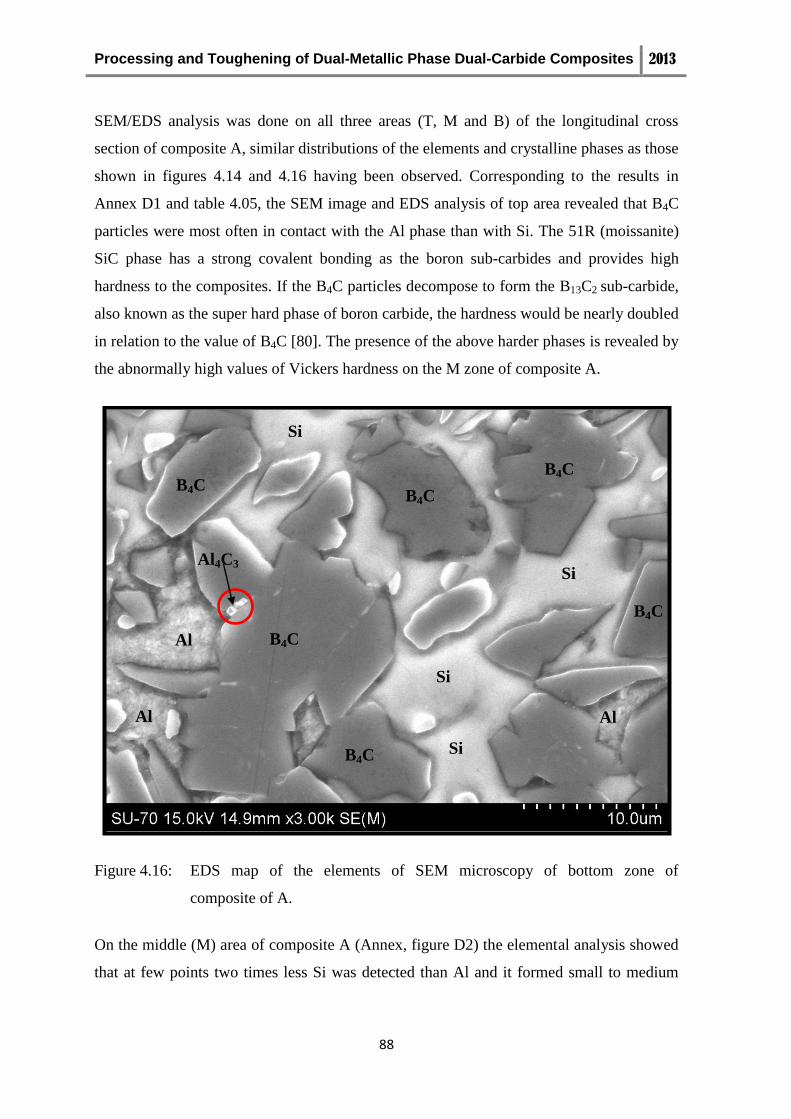
Processing and Toughening of Dual-Metallic Phase Dual-Carbide Composites 2013
88
SEM/EDS analysis was done on all three areas (T, M and B) of the longitudinal cross
section of composite A, similar distributions of the elements and crystalline phases as those
shown in figures 4.14 and 4.16 having been observed. Corresponding to the results in
Annex D1 and table 4.05, the SEM image and EDS analysis of top area revealed that B4C
particles were most often in contact with the Al phase than with Si. The 51R (moissanite)
SiC phase has a strong covalent bonding as the boron sub-carbides and provides high
hardness to the composites. If the B4C particles decompose to form the B13C2 sub-carbide,
also known as the super hard phase of boron carbide, the hardness would be nearly doubled
in relation to the value of B4C [80]. The presence of the above harder phases is revealed by
the abnormally high values of Vickers hardness on the M zone of composite A.
Figure 4.16: EDS map of the elements of SEM microscopy of bottom zone of
composite of A.
On the middle (M) area of composite A (Annex, figure D2) the elemental analysis showed
that at few points two times less Si was detected than Al and it formed small to medium
Al
Si
Si
Al
Si
B4C
B4C
B4C
B4C
Si
Al
B4C
B4C
Al4C3
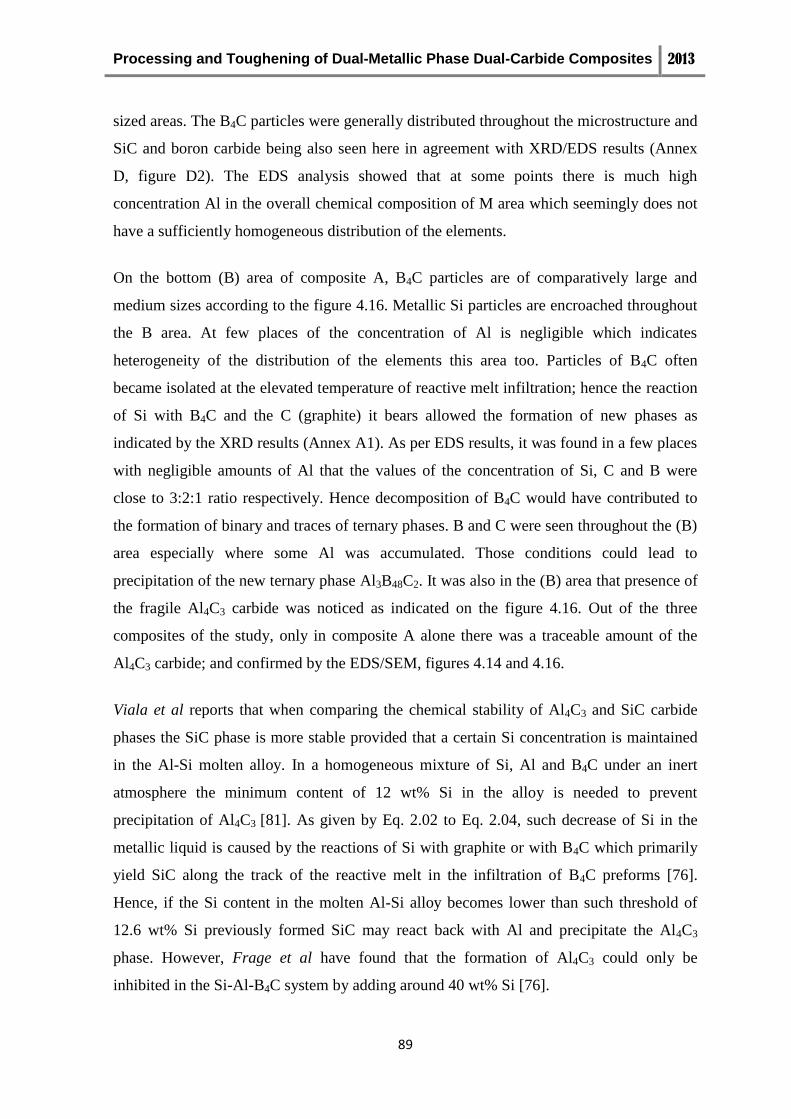
Processing and Toughening of Dual-Metallic Phase Dual-Carbide Composites 2013
89
sized areas. The B4C particles were generally distributed throughout the microstructure and
SiC and boron carbide being also seen here in agreement with XRD/EDS results (Annex
D, figure D2). The EDS analysis showed that at some points there is much high
concentration Al in the overall chemical composition of M area which seemingly does not
have a sufficiently homogeneous distribution of the elements.
On the bottom (B) area of composite A, B4C particles are of comparatively large and
medium sizes according to the figure 4.16. Metallic Si particles are encroached throughout
the B area. At few places of the concentration of Al is negligible which indicates
heterogeneity of the distribution of the elements this area too. Particles of B4C often
became isolated at the elevated temperature of reactive melt infiltration; hence the reaction
of Si with B4C and the C (graphite) it bears allowed the formation of new phases as
indicated by the XRD results (Annex A1). As per EDS results, it was found in a few places
with negligible amounts of Al that the values of the concentration of Si, C and B were
close to 3:2:1 ratio respectively. Hence decomposition of B4C would have contributed to
the formation of binary and traces of ternary phases. B and C were seen throughout the (B)
area especially where some Al was accumulated. Those conditions could lead to
precipitation of the new ternary phase Al3B48C2. It was also in the (B) area that presence of
the fragile Al4C3 carbide was noticed as indicated on the figure 4.16. Out of the three
composites of the study, only in composite A alone there was a traceable amount of the
Al4C3 carbide; and confirmed by the EDS/SEM, figures 4.14 and 4.16.
Viala et al reports that when comparing the chemical stability of Al4C3 and SiC carbide
phases the SiC phase is more stable provided that a certain Si concentration is maintained
in the Al-Si molten alloy. In a homogeneous mixture of Si, Al and B4C under an inert
atmosphere the minimum content of 12 wt% Si in the alloy is needed to prevent
precipitation of Al4C3 [81]. As given by Eq. 2.02 to Eq. 2.04, such decrease of Si in the
metallic liquid is caused by the reactions of Si with graphite or with B4C which primarily
yield SiC along the track of the reactive melt in the infiltration of B4C preforms [76].
Hence, if the Si content in the molten Al-Si alloy becomes lower than such threshold of
12.6 wt% Si previously formed SiC may react back with Al and precipitate the Al4C3
phase. However, Frage et al have found that the formation of Al4C3 could only be
inhibited in the Si-Al-B4C system by adding around 40 wt% Si [76].
Processing and Toughening of Dual-Metallic Phase Dual-Carbide Composites 2013
90
4.4.2.2 Reaction path in the Al-Si-B4C ternary diagram
The evolution of the phase volume fractions from the top (T) to the bottom (B) of the
longitudinal cross section of the pellet of composite A as given in table 4.05 is plotted in
the Al-Si-B4C ternary phase diagram in figure 4.17. In which the two nominal proportions
of Al-Si alloy involving in these composites were indicated by blue lines and the red line
denotes the eutectic limit of 12.6 wt% Si. This figure also includes the corresponding plots
for composites B and C which are discussed further below. B4C is about 31 vol% in (T)
and (B) areas of composite A whereas it rises to about 43 vol% in the middle (M) zone of
the pellet.
100%0%
100%75%50%25%0%
100%
75%
50%
25%75%
50%
25%
0%
B4C
Al
Si
B4C
Figure 4.17: Plot of the phase composition in volume fraction in Al-Si-B4C ternary phase
diagram, at (T) top, (M) middle and (B) bottom areas of the longitudinal
cross section of composites A ( ), B ( ), and C ( ) .
35%
12.6%
T
Composite A
Composite B
Composite C
Locations of B4C
M B T
M
B M
B
T
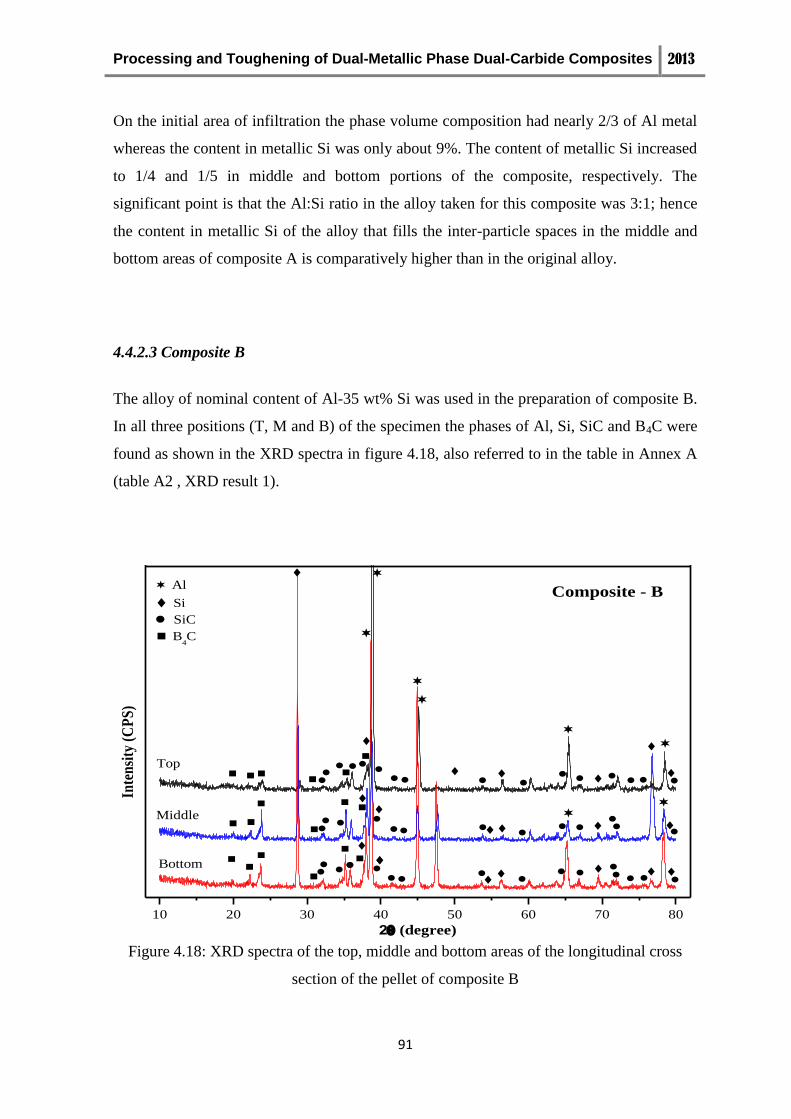
Processing and Toughening of Dual-Metallic Phase Dual-Carbide Composites 2013
91
On the initial area of infiltration the phase volume composition had nearly 2/3 of Al metal
whereas the content in metallic Si was only about 9%. The content of metallic Si increased
to 1/4 and 1/5 in middle and bottom portions of the composite, respectively. The
significant point is that the Al:Si ratio in the alloy taken for this composite was 3:1; hence
the content in metallic Si of the alloy that fills the inter-particle spaces in the middle and
bottom areas of composite A is comparatively higher than in the original alloy.
4.4.2.3 Composite B
The alloy of nominal content of Al-35 wt% Si was used in the preparation of composite B.
In all three positions (T, M and B) of the specimen the phases of Al, Si, SiC and B4C were
found as shown in the XRD spectra in figure 4.18, also referred to in the table in Annex A
(table A2 , XRD result 1).
10 20 30 40 50 60 70 80
10 20 30 40 50 60 70 80
Top
Inte
nsi
ty (
CP
S)
2(degree)
Composite - B
Middle
Bottom
SiC
B4C
Si
Al
0
2
4
6
8
10
Figure 4.18: XRD spectra of the top, middle and bottom areas of the longitudinal cross
section of the pellet of composite B
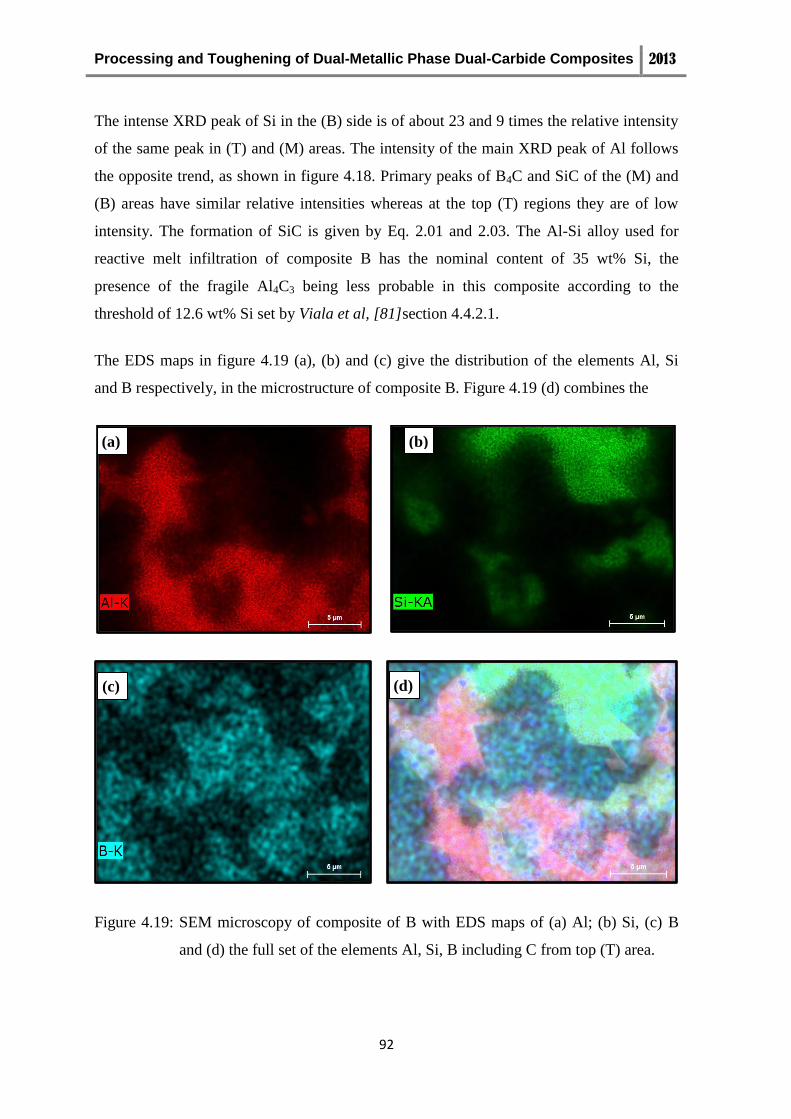
Processing and Toughening of Dual-Metallic Phase Dual-Carbide Composites 2013
92
The intense XRD peak of Si in the (B) side is of about 23 and 9 times the relative intensity
of the same peak in (T) and (M) areas. The intensity of the main XRD peak of Al follows
the opposite trend, as shown in figure 4.18. Primary peaks of B4C and SiC of the (M) and
(B) areas have similar relative intensities whereas at the top (T) regions they are of low
intensity. The formation of SiC is given by Eq. 2.01 and 2.03. The Al-Si alloy used for
reactive melt infiltration of composite B has the nominal content of 35 wt% Si, the
presence of the fragile Al4C3 being less probable in this composite according to the
threshold of 12.6 wt% Si set by Viala et al, [81]section 4.4.2.1.
The EDS maps in figure 4.19 (a), (b) and (c) give the distribution of the elements Al, Si
and B respectively, in the microstructure of composite B. Figure 4.19 (d) combines the
Figure 4.19: SEM microscopy of composite of B with EDS maps of (a) Al; (b) Si, (c) B
and (d) the full set of the elements Al, Si, B including C from top (T) area.
(a) (b)
(c) (d)
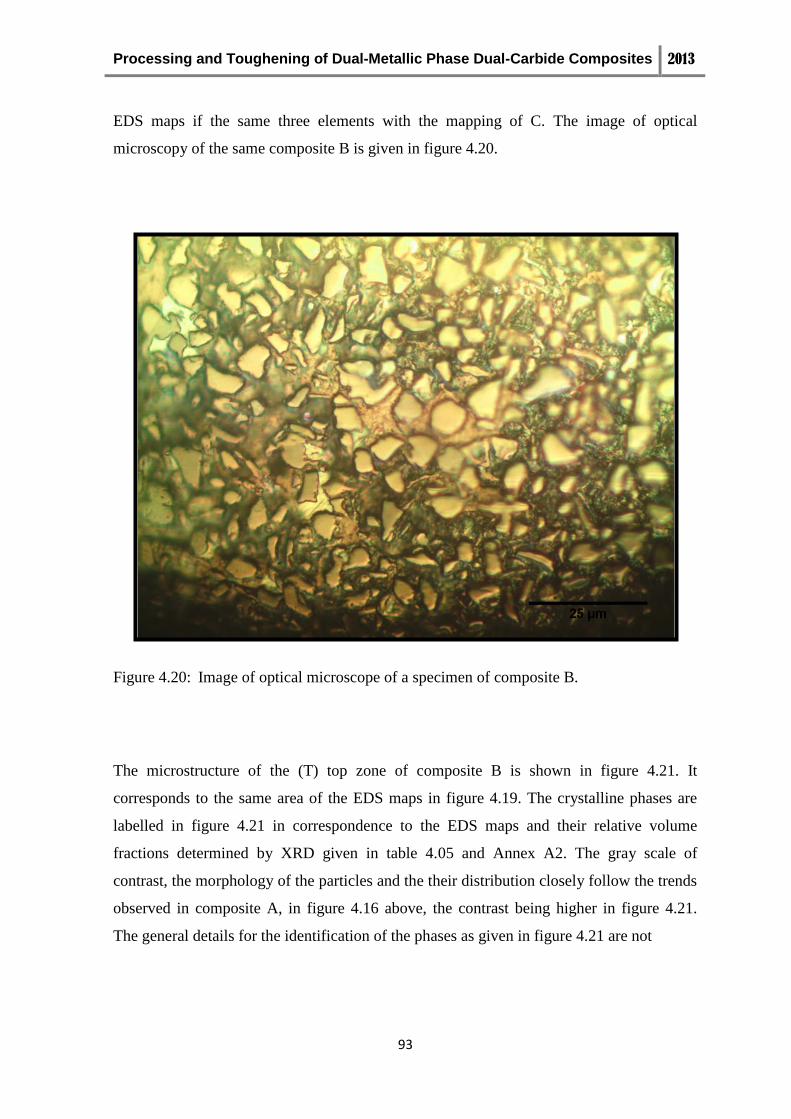
Processing and Toughening of Dual-Metallic Phase Dual-Carbide Composites 2013
93
EDS maps if the same three elements with the mapping of C. The image of optical
microscopy of the same composite B is given in figure 4.20.
Figure 4.20: Image of optical microscope of a specimen of composite B.
The microstructure of the (T) top zone of composite B is shown in figure 4.21. It
corresponds to the same area of the EDS maps in figure 4.19. The crystalline phases are
labelled in figure 4.21 in correspondence to the EDS maps and their relative volume
fractions determined by XRD given in table 4.05 and Annex A2. The gray scale of
contrast, the morphology of the particles and the their distribution closely follow the trends
observed in composite A, in figure 4.16 above, the contrast being higher in figure 4.21.
The general details for the identification of the phases as given in figure 4.21 are not
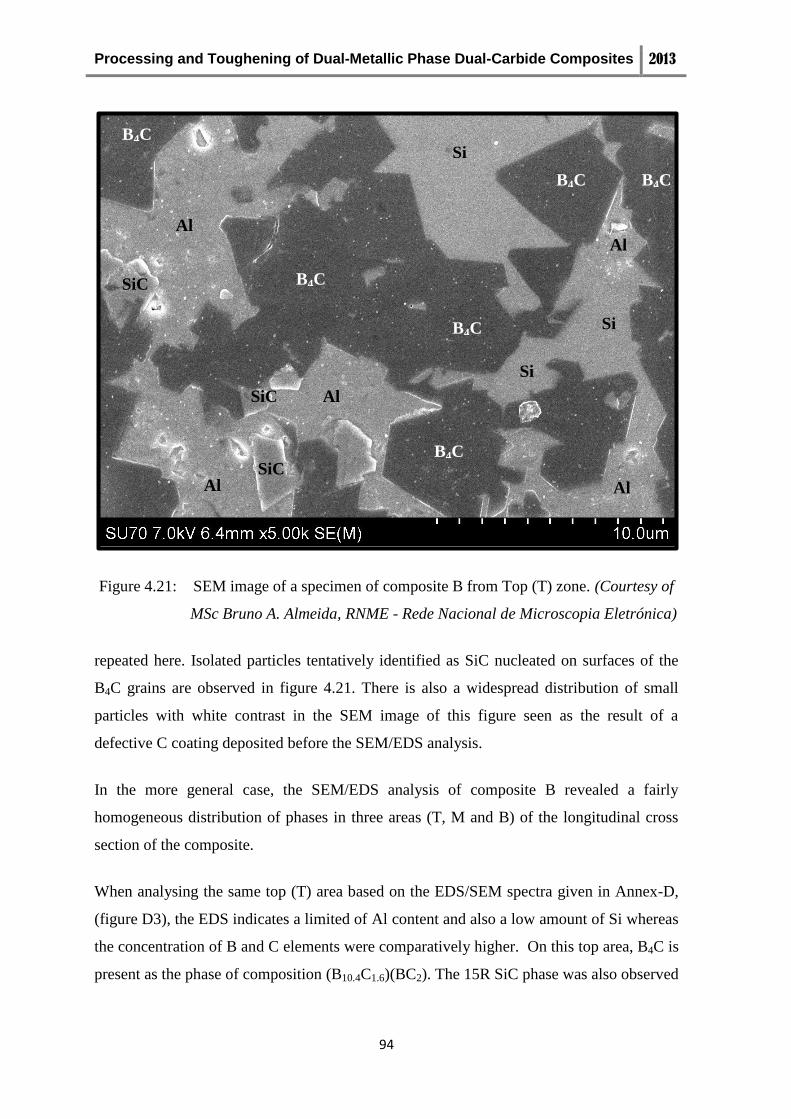
Processing and Toughening of Dual-Metallic Phase Dual-Carbide Composites 2013
94
Figure 4.21: SEM image of a specimen of composite B from Top (T) zone. (Courtesy of
MSc Bruno A. Almeida, RNME - Rede Nacional de Microscopia Eletrónica)
repeated here. Isolated particles tentatively identified as SiC nucleated on surfaces of the
B4C grains are observed in figure 4.21. There is also a widespread distribution of small
particles with white contrast in the SEM image of this figure seen as the result of a
defective C coating deposited before the SEM/EDS analysis.
In the more general case, the SEM/EDS analysis of composite B revealed a fairly
homogeneous distribution of phases in three areas (T, M and B) of the longitudinal cross
section of the composite.
When analysing the same top (T) area based on the EDS/SEM spectra given in Annex-D,
(figure D3), the EDS indicates a limited of Al content and also a low amount of Si whereas
the concentration of B and C elements were comparatively higher. On this top area, B4C is
present as the phase of composition (B10.4C1.6)(BC2). The 15R SiC phase was also observed
Al Al
Al
Al
Si
Si
B4C
B4C
Al
B4C
B4C
B4C
B4C
Si
SiC
SiC
SiC
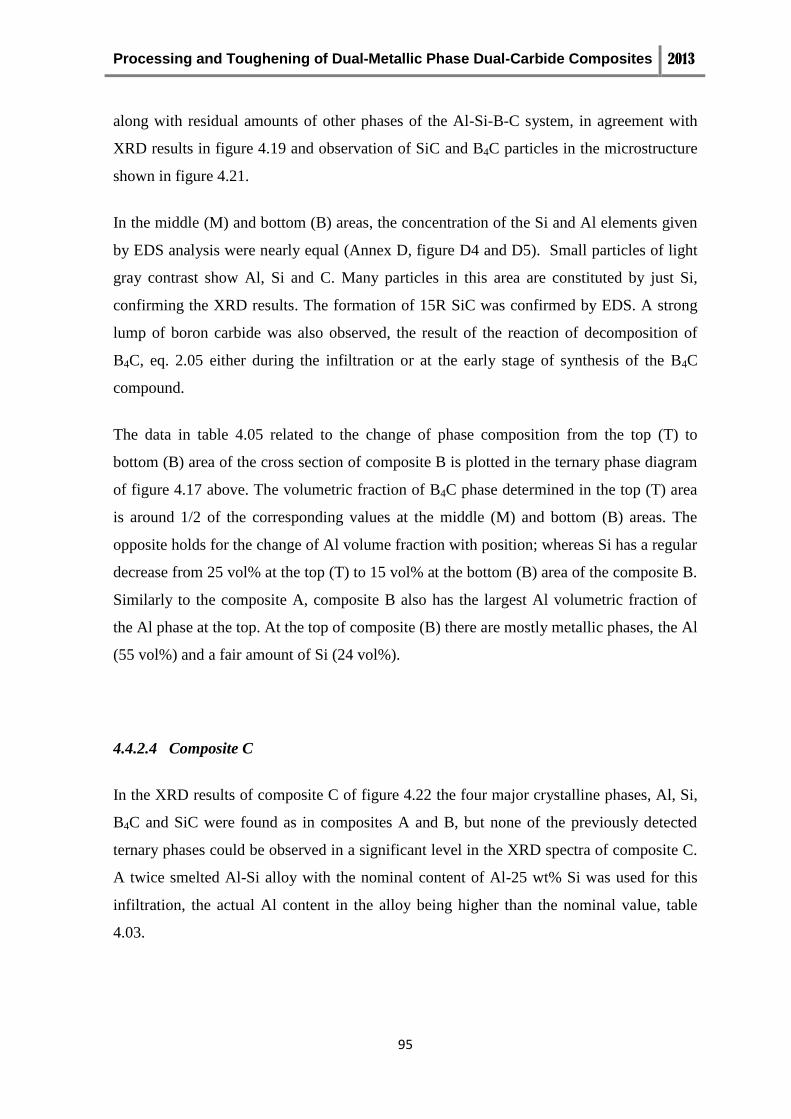
Processing and Toughening of Dual-Metallic Phase Dual-Carbide Composites 2013
95
along with residual amounts of other phases of the Al-Si-B-C system, in agreement with
XRD results in figure 4.19 and observation of SiC and B4C particles in the microstructure
shown in figure 4.21.
In the middle (M) and bottom (B) areas, the concentration of the Si and Al elements given
by EDS analysis were nearly equal (Annex D, figure D4 and D5). Small particles of light
gray contrast show Al, Si and C. Many particles in this area are constituted by just Si,
confirming the XRD results. The formation of 15R SiC was confirmed by EDS. A strong
lump of boron carbide was also observed, the result of the reaction of decomposition of
B4C, eq. 2.05 either during the infiltration or at the early stage of synthesis of the B4C
compound.
The data in table 4.05 related to the change of phase composition from the top (T) to
bottom (B) area of the cross section of composite B is plotted in the ternary phase diagram
of figure 4.17 above. The volumetric fraction of B4C phase determined in the top (T) area
is around 1/2 of the corresponding values at the middle (M) and bottom (B) areas. The
opposite holds for the change of Al volume fraction with position; whereas Si has a regular
decrease from 25 vol% at the top (T) to 15 vol% at the bottom (B) area of the composite B.
Similarly to the composite A, composite B also has the largest Al volumetric fraction of
the Al phase at the top. At the top of composite (B) there are mostly metallic phases, the Al
(55 vol%) and a fair amount of Si (24 vol%).
4.4.2.4 Composite C
In the XRD results of composite C of figure 4.22 the four major crystalline phases, Al, Si,
B4C and SiC were found as in composites A and B, but none of the previously detected
ternary phases could be observed in a significant level in the XRD spectra of composite C.
A twice smelted Al-Si alloy with the nominal content of Al-25 wt% Si was used for this
infiltration, the actual Al content in the alloy being higher than the nominal value, table
4.03.

Processing and Toughening of Dual-Metallic Phase Dual-Carbide Composites 2013
96
10 20 30 40 50 60 70 80
Inte
ns
ity
(C
PS
)
2 (degree)
Top
Middle
Bottom
Composite - ´C´
SiC
Boron carbide
Si
Al
Figure 4.22: XRD patterns of top, middle and bottom areas of the longitudinal cross
section of composite C.
The presence of Al dominates the DRX spectra of composite C in all the three areas (T, M
and B) shown in figure 4.22 and the details on intensity of the DRX lines for the same
phases can be found in the Annex A (table A3 - XRD result 1). Alike the other two
composites, the intensity of Si peaks found on the top area are comparatively lower than in
the following areas. The main XRD peaks of the B4C and SiC phases have gradual
increments in intensity from (T) to the (B) area. All the three areas have formed the regular
15R SiC phase, and the boron carbide phase is present as (B10.4C1.6)(BC2) which is of
stoichiometry close to the chemical formula of the compound B4C.
The infiltration temperature of 1200 ºC allowed the development of a more regular
microstructure where it was hard to find any traces of the Al4C3 carbide. The quality of the
alloy was also improved by twice smelting and it might have provided more homogenous
distribution of the elements in the alloy thus yielding an additional contribute to the
regularity of the structure of composite C, noticed by the homogeneous distribution of
phases in SEM observation. Both, the low temperature and the homogeneity of the alloy
may have prevented the precipitation of the Al4C3 carbide phase which is supported by the
C

Processing and Toughening of Dual-Metallic Phase Dual-Carbide Composites 2013
97
work of Halverson et al, where Al4C3, AlB12, and AlB24C4 begin to form and become
favoured at temperatures above 1200 °C during infiltration [8]. As dissolved Si in the alloy
reacted with C present as the graphite or from reactions of B4C forming the SiC the activity
of C decreased. As the outcome of this interaction a stable, hard SiC carbide phase of low
density was developed instead of Al4C3.
The EDS maps in Figure 4.23 (a), (b), (c) give the distribution of the elements Al, Si and B
respectively, in the microstructure of composite C. The EDS map in figure 4.23 (d) shows
the distribution of the full set of the 4 elements, C included, in the composition of this
composite. The image of optical microscopy in given in figure 4.24 corroborates the
regularity of the microstructure of composite C.
Figure 4.23: EDS maps of the distribution of the elements of composite C done by SEM
microscopy: (a) Al, (b) Si, (c) B and (d) all the chemical elements Al, Si, B,
including C.
(a) (b)
(c) (d)
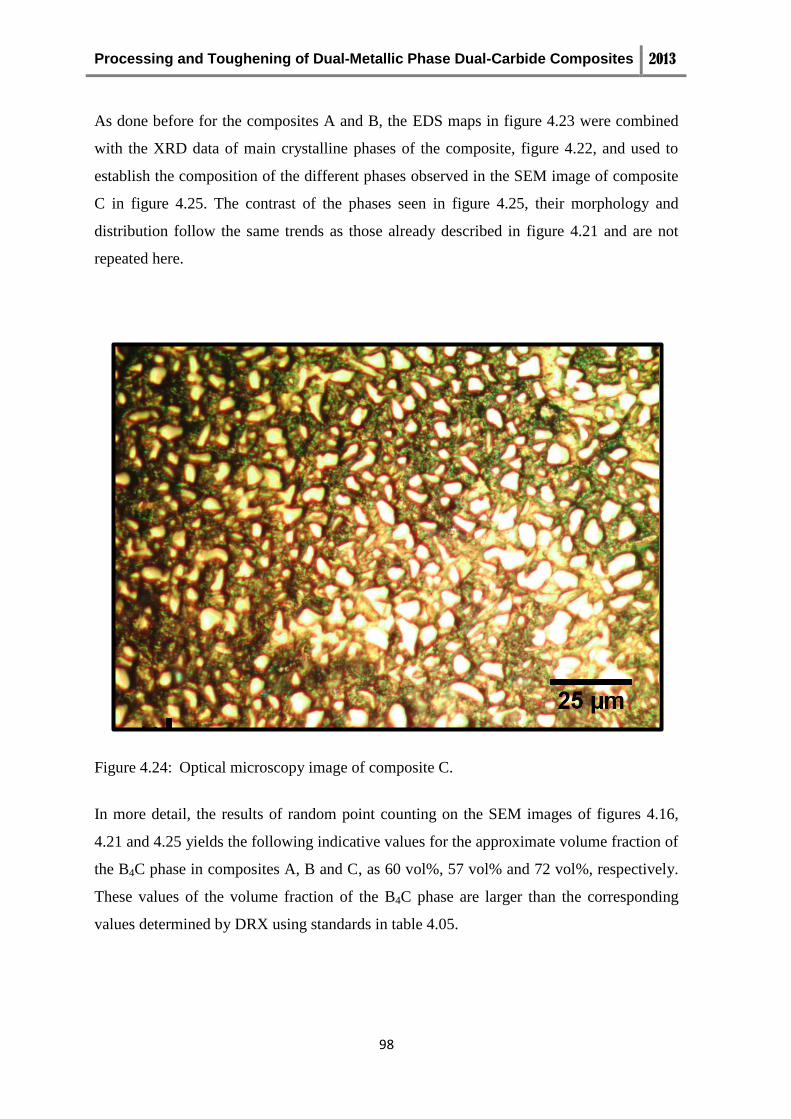
Processing and Toughening of Dual-Metallic Phase Dual-Carbide Composites 2013
98
As done before for the composites A and B, the EDS maps in figure 4.23 were combined
with the XRD data of main crystalline phases of the composite, figure 4.22, and used to
establish the composition of the different phases observed in the SEM image of composite
C in figure 4.25. The contrast of the phases seen in figure 4.25, their morphology and
distribution follow the same trends as those already described in figure 4.21 and are not
repeated here.
Figure 4.24: Optical microscopy image of composite C.
In more detail, the results of random point counting on the SEM images of figures 4.16,
4.21 and 4.25 yields the following indicative values for the approximate volume fraction of
the B4C phase in composites A, B and C, as 60 vol%, 57 vol% and 72 vol%, respectively.
These values of the volume fraction of the B4C phase are larger than the corresponding
values determined by DRX using standards in table 4.05.
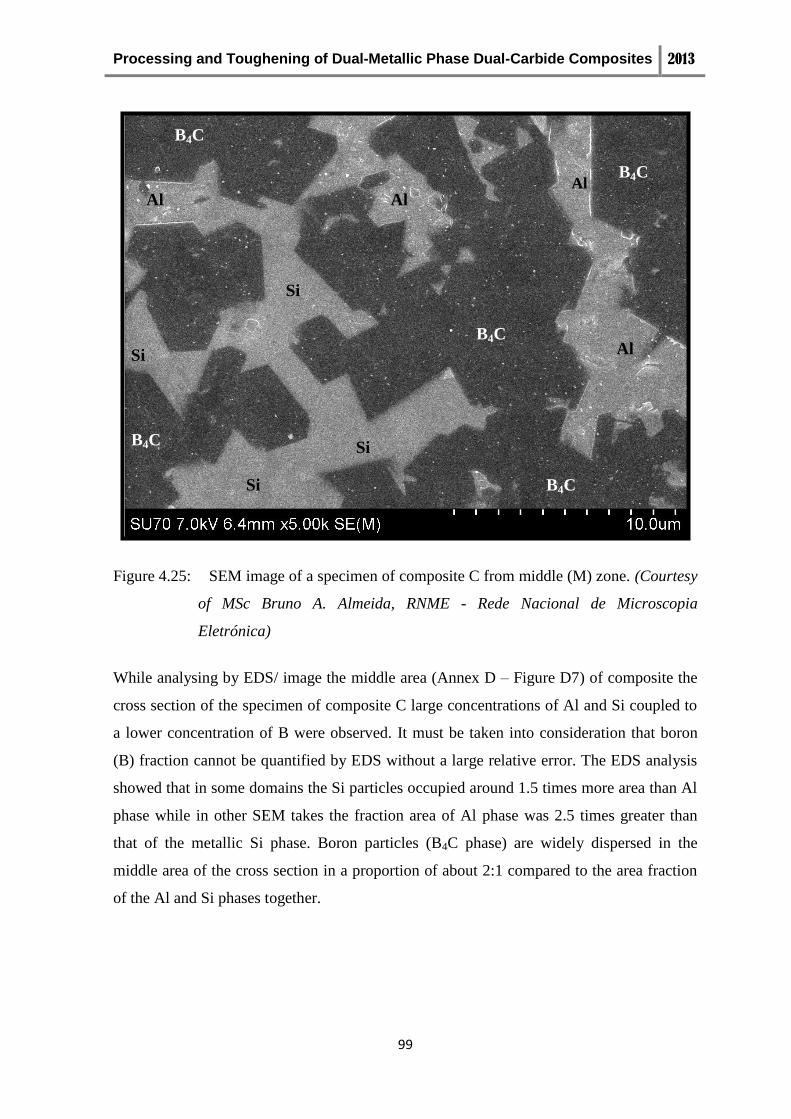
Processing and Toughening of Dual-Metallic Phase Dual-Carbide Composites 2013
99
Figure 4.25: SEM image of a specimen of composite C from middle (M) zone. (Courtesy
of MSc Bruno A. Almeida, RNME - Rede Nacional de Microscopia
Eletrónica)
While analysing by EDS/ image the middle area (Annex D – Figure D7) of composite the
cross section of the specimen of composite C large concentrations of Al and Si coupled to
a lower concentration of B were observed. It must be taken into consideration that boron
(B) fraction cannot be quantified by EDS without a large relative error. The EDS analysis
showed that in some domains the Si particles occupied around 1.5 times more area than Al
phase while in other SEM takes the fraction area of Al phase was 2.5 times greater than
that of the metallic Si phase. Boron particles (B4C phase) are widely dispersed in the
middle area of the cross section in a proportion of about 2:1 compared to the area fraction
of the Al and Si phases together.
Si
Si
Si
Al
B4C
B4C
B4C
B4C
B4C
Si
Al Al Al
Processing and Toughening of Dual-Metallic Phase Dual-Carbide Composites 2013
100
The Al and Si elements also dominate the concentration of the elements in top (T) and
bottom (B) areas. The same trends were observed in the Al and Si volume fractions in the
XRD results of table 4.05 (Annex A3- XRD 1st result and images in Annex D figures D6,
D7 and D8). Due to the comparatively low intensity of the DRX peaks of the B4C phase in
the standards, the volume fraction of B4C determined by the quantitative XRD methods is
seemingly underestimated compared to the area fraction this same phase occupies in the
SEM image of the composites.
Based on the volumetric fraction of the phases of composite C in table 4.05, the change in
phase composition from the top (T) to the bottom (B) areas of the composite are plotted in
the Al-Si–B4C ternary diagram of figure 4.17, above. The nominal composition of alloy
taken for composites A and C was Al-25 wt% Si. A gradual increment of Si is found from
the top to bottom areas of composite C. The maximum content of the Al phase is observed
at the middle of composite C, whereas the converse trend was observed in composite A. In
balance, the relative content of B4C is lower in middle area, figure 4.17. Due to the
accumulation of Al in combination with Si in the middle, the volume fraction of the B4C
was brought down. Hence the reaction of B4C carbide with the Al-Si alloy was reduced.
4.4.3 Comparison of phase composition of the composites
Based on the prepared standards the volumetric fractions of the individual phases were
determined for each composite (A, B and C) at the top (T), middle (M) and bottom (B)
areas of the longitudinal cross section and are tabulated in Annex A. The average phase
composition of each composite is given in table 4.06 together with the values of density
calculated from the density of the phases and the average volumetric fractions of the
phases in this table and the measured densities. The same values of the measured density
were presented in table 4.04, section 4.3, above. The average volumetric phase fractions of
the three composites are also plotted in figure 4.26.
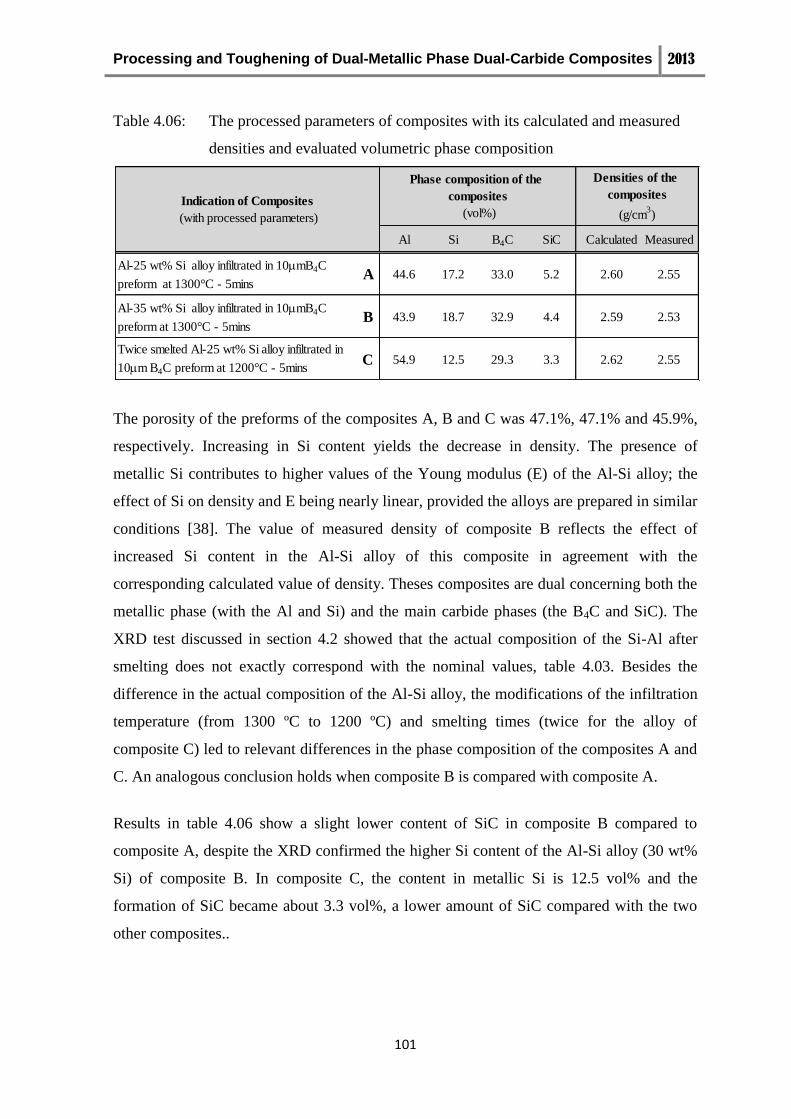
Processing and Toughening of Dual-Metallic Phase Dual-Carbide Composites 2013
101
Table 4.06: The processed parameters of composites with its calculated and measured
densities and evaluated volumetric phase composition
The porosity of the preforms of the composites A, B and C was 47.1%, 47.1% and 45.9%,
respectively. Increasing in Si content yields the decrease in density. The presence of
metallic Si contributes to higher values of the Young modulus (E) of the Al-Si alloy; the
effect of Si on density and E being nearly linear, provided the alloys are prepared in similar
conditions [38]. The value of measured density of composite B reflects the effect of
increased Si content in the Al-Si alloy of this composite in agreement with the
corresponding calculated value of density. Theses composites are dual concerning both the
metallic phase (with the Al and Si) and the main carbide phases (the B4C and SiC). The
XRD test discussed in section 4.2 showed that the actual composition of the Si-Al after
smelting does not exactly correspond with the nominal values, table 4.03. Besides the
difference in the actual composition of the Al-Si alloy, the modifications of the infiltration
temperature (from 1300 ºC to 1200 ºC) and smelting times (twice for the alloy of
composite C) led to relevant differences in the phase composition of the composites A and
C. An analogous conclusion holds when composite B is compared with composite A.
Results in table 4.06 show a slight lower content of SiC in composite B compared to
composite A, despite the XRD confirmed the higher Si content of the Al-Si alloy (30 wt%
Si) of composite B. In composite C, the content in metallic Si is 12.5 vol% and the
formation of SiC became about 3.3 vol%, a lower amount of SiC compared with the two
other composites..
Al Si B4C SiC Calculated Measured
Al-25 wt% Si alloy infiltrated in 10mB4C
preform at 1300°C - 5minsA 44.6 17.2 33.0 5.2 2.60 2.55
Al-35 wt% Si alloy infiltrated in 10mB4C
preform at 1300°C - 5minsB 43.9 18.7 32.9 4.4 2.59 2.53
Twice smelted Al-25 wt% Si alloy infiltrated in
10m B4C preform at 1200°C - 5minsC 54.9 12.5 29.3 3.3 2.62 2.55
Densities of the
composites
(g/cm3)
Indication of Composites
(with processed parameters)
Phase composition of the
composites
(vol%)
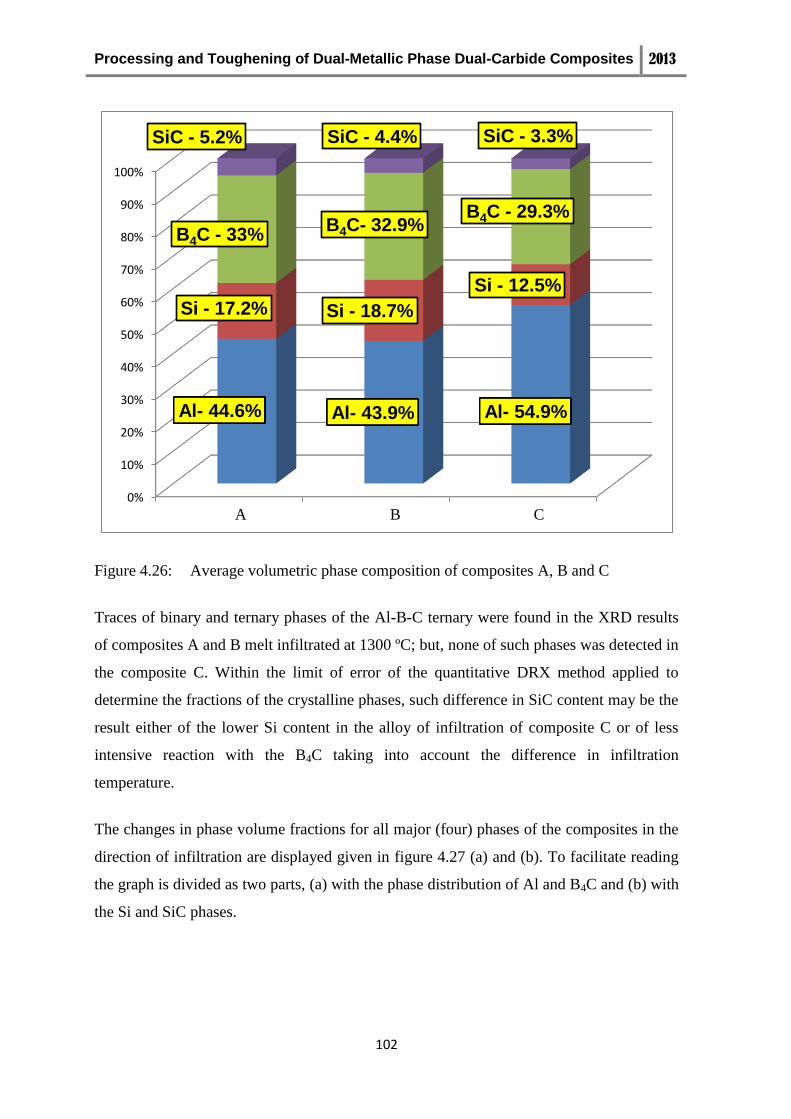
Processing and Toughening of Dual-Metallic Phase Dual-Carbide Composites 2013
102
Figure 4.26: Average volumetric phase composition of composites A, B and C
Traces of binary and ternary phases of the Al-B-C ternary were found in the XRD results
of composites A and B melt infiltrated at 1300 ºC; but, none of such phases was detected in
the composite C. Within the limit of error of the quantitative DRX method applied to
determine the fractions of the crystalline phases, such difference in SiC content may be the
result either of the lower Si content in the alloy of infiltration of composite C or of less
intensive reaction with the B4C taking into account the difference in infiltration
temperature.
The changes in phase volume fractions for all major (four) phases of the composites in the
direction of infiltration are displayed given in figure 4.27 (a) and (b). To facilitate reading
the graph is divided as two parts, (a) with the phase distribution of Al and B4C and (b) with
the Si and SiC phases.
0%
10%
20%
30%
40%
50%
60%
70%
80%
90%
100%
1 2 3
Al- 44.6% Al- 43.9% Al- 54.9%
Si - 17.2% Si - 18.7%
Si - 12.5%
B4C - 33% B4C- 32.9%
B4C - 29.3%
SiC - 5.2% SiC - 4.4% SiC - 3.3%
B A C
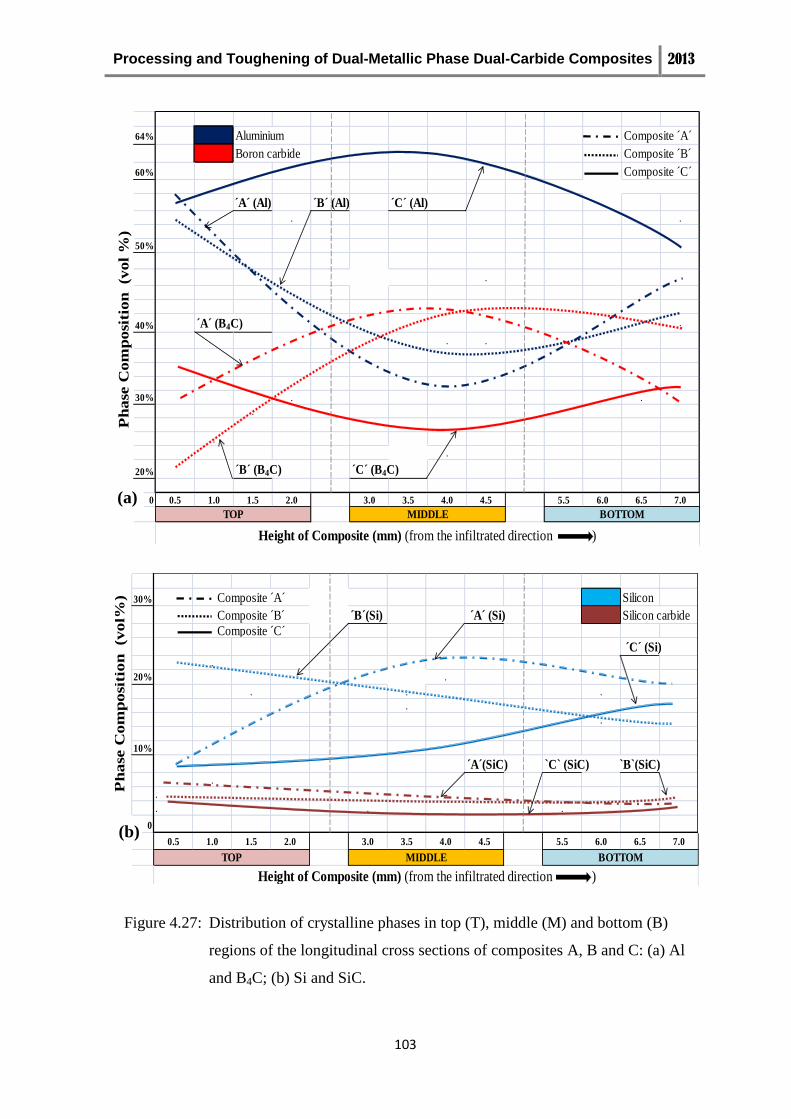
Processing and Toughening of Dual-Metallic Phase Dual-Carbide Composites 2013
103
Figure 4.27: Distribution of crystalline phases in top (T), middle (M) and bottom (B)
regions of the longitudinal cross sections of composites A, B and C: (a) Al
and B4C; (b) Si and SiC.
64% Aluminium Composite ´A´
Boron carbide Composite ´B´
60% Composite ´C´
´A´ (Al) ´B´ (Al) ´C´ (Al). .
50%
.
40% ´A´ (B4C) .
. .
30% . .
.
.
.
20% ´B´ (B4C) ´C´ (B4C)
0 0.5 1.0 1.5 2.0 3.0 3.5 4.0 4.5 5.5 6.0 6.5 7.0
TOP MIDDLE BOTTOM
Height of Composite (mm) (from the infiltrated direction )
Ph
ase
Co
mp
osi
tion
(v
ol
%)
30% Composite ´A´ Silicon
Composite ´B´ ´B´(Si) ´A´ (Si) Silicon carbide
Composite ´C´
´C´ (Si).
20% .
. . .
.
.
10%
´A´(SiC) `C` (SiC) `B`(SiC).
.
. . .
0
0.5 1.0 1.5 2.0 3.0 3.5 4.0 4.5 5.5 6.0 6.5 7.0
TOP MIDDLE BOTTOM
Height of Composite (mm) (from the infiltrated direction )
Ph
ase
Co
mp
osi
tio
n
(vo
l%)
(a)
(b)

Processing and Toughening of Dual-Metallic Phase Dual-Carbide Composites 2013
104
The concavity in the curves of concentration of Al in figure 4.27 (a) clearly indicates the
reduction of Al phase in the (M) area of composites A and B whereas the inverse is
observed for composite C, infiltrated at 1200 ºC. Such changes in the concentration of Al
are symmetrical with the trends observed in the curves of concentration of B4C. A large
volume fraction of metallic Al is accumulated in composite C, especially in the (M) area. It
is almost the double of the Al volume fractions in the corresponding (M) areas of the other
two composites A and B. At the (T) and (B) ends of the composites the values of the Al
volume fraction of the three composites are closer together.
As shown in figure 4.27 (b) the concentration of the Si phase of composite C regularly
increased from (T) to (B), the opposite trend being observed in composite B. Composite A
shows a maximum in Si concentration in the (M) area. Despite the differences in Si content
of the Si-Al alloys used for the infiltration and in infiltration temperature, at the lower end
(B) the volume fractions of metallic Si in the three composites converge to the same range
of values. Within the experimental error of the method used for determination of the phase
fractions, the values of SiC concentration found for all three composites A, B and C
throughout the (T), (M) and (B) areas are very close to each other, a slight descent from
(T) to the end (B) area being observed.
Two times smelted Al-Si alloy was used in composite C which would have provided
higher fluidity to the alloy. In general, recycling the Al alloys reduce the fluidity of the
alloy during smelting [82]. But, due to the Si added, the twice smelted fresh alloy would
display improvement in fluidity from better homogeneity. The infiltration temperature was
reduced from 1300 ºC in composites A and B to 1200 ºC in composite C; such drop in
temperature would have further diminished effective wetting with the accumulation of
some stagnant alloy in the middle of the pellet. The effect would be more visible would the
relative density in the middle of the as pressed pellet be lower than the preform average
density
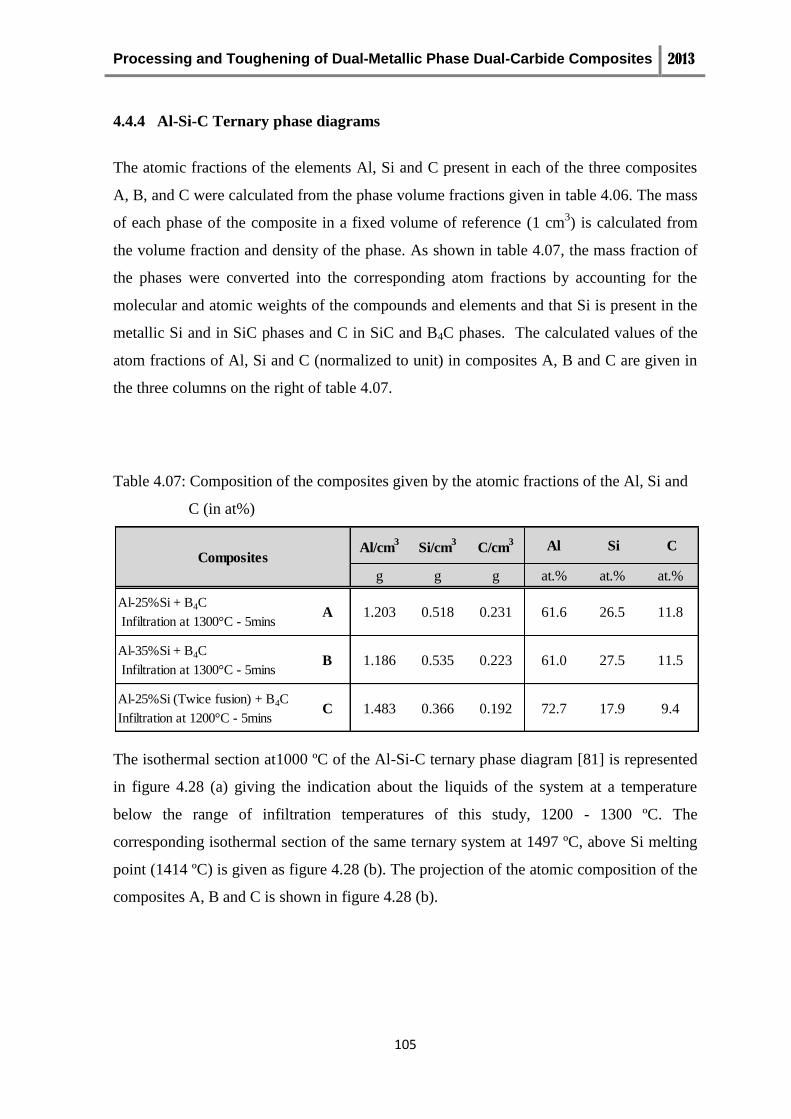
Processing and Toughening of Dual-Metallic Phase Dual-Carbide Composites 2013
105
4.4.4 Al-Si-C Ternary phase diagrams
The atomic fractions of the elements Al, Si and C present in each of the three composites
A, B, and C were calculated from the phase volume fractions given in table 4.06. The mass
of each phase of the composite in a fixed volume of reference (1 cm3) is calculated from
the volume fraction and density of the phase. As shown in table 4.07, the mass fraction of
the phases were converted into the corresponding atom fractions by accounting for the
molecular and atomic weights of the compounds and elements and that Si is present in the
metallic Si and in SiC phases and C in SiC and B4C phases. The calculated values of the
atom fractions of Al, Si and C (normalized to unit) in composites A, B and C are given in
the three columns on the right of table 4.07.
Table 4.07: Composition of the composites given by the atomic fractions of the Al, Si and
C (in at%)
The isothermal section at1000 ºC of the Al-Si-C ternary phase diagram [81] is represented
in figure 4.28 (a) giving the indication about the liquids of the system at a temperature
below the range of infiltration temperatures of this study, 1200 - 1300 ºC. The
corresponding isothermal section of the same ternary system at 1497 ºC, above Si melting
point (1414 ºC) is given as figure 4.28 (b). The projection of the atomic composition of the
composites A, B and C is shown in figure 4.28 (b).
Al/cm3
Si/cm3
C/cm3 Al Si C
g g g at.% at.% at.%
Al-25%Si + B4C
Infiltration at 1300°C - 5minsA 1.203 0.518 0.231 61.6 26.5 11.8
Al-35%Si + B4C
Infiltration at 1300°C - 5minsB 1.186 0.535 0.223 61.0 27.5 11.5
Al-25%Si (Twice fusion) + B4C
Infiltration at 1200°C - 5minsC 1.483 0.366 0.192 72.7 17.9 9.4
Composites
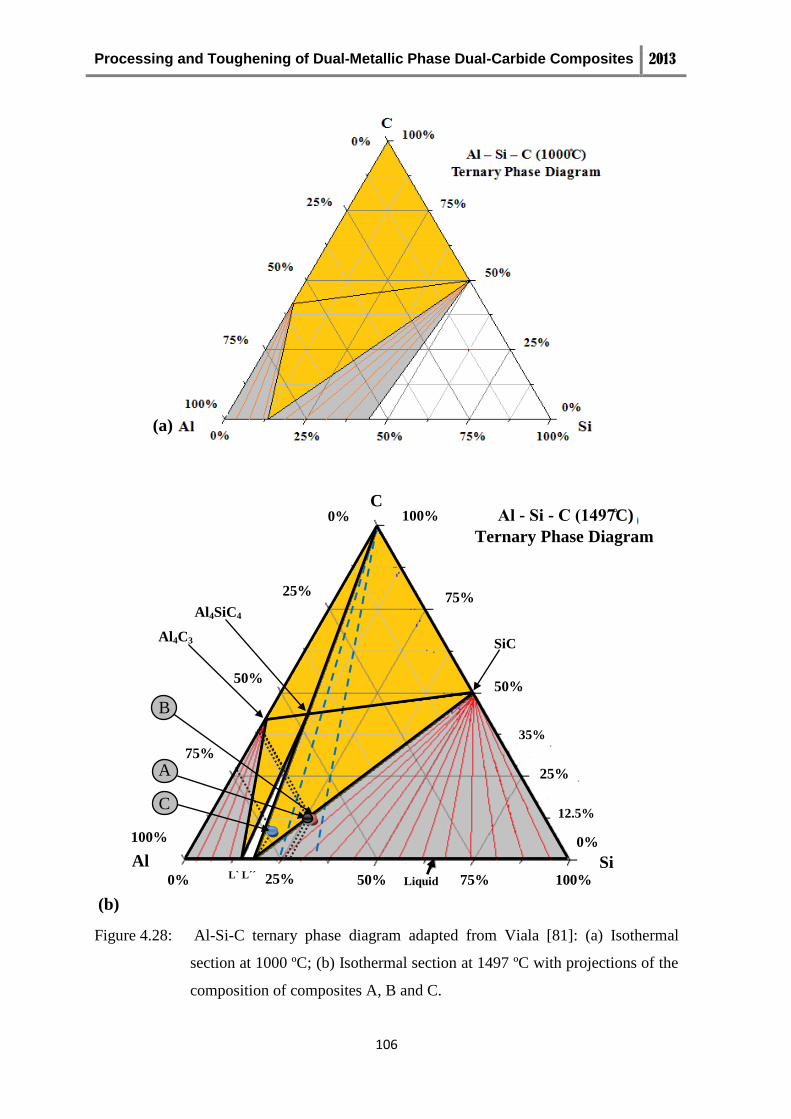
Processing and Toughening of Dual-Metallic Phase Dual-Carbide Composites 2013
106
Figure 4.28: Al-Si-C ternary phase diagram adapted from Viala [81]: (a) Isothermal
section at 1000 ºC; (b) Isothermal section at 1497 ºC with projections of the
composition of composites A, B and C.
(b)
Al4C3
SiC
Al4SiC4
12.5%
35%
35%
A
B
C
50% 100% L` L´´
Liquid 0% 75% 100% 25%
Al
75%
50%
25%
0% 100%
50%
75%
25%
C
100%
- - ( C)
Ternary Phase Diagram
Si
0%
(b)
(a)
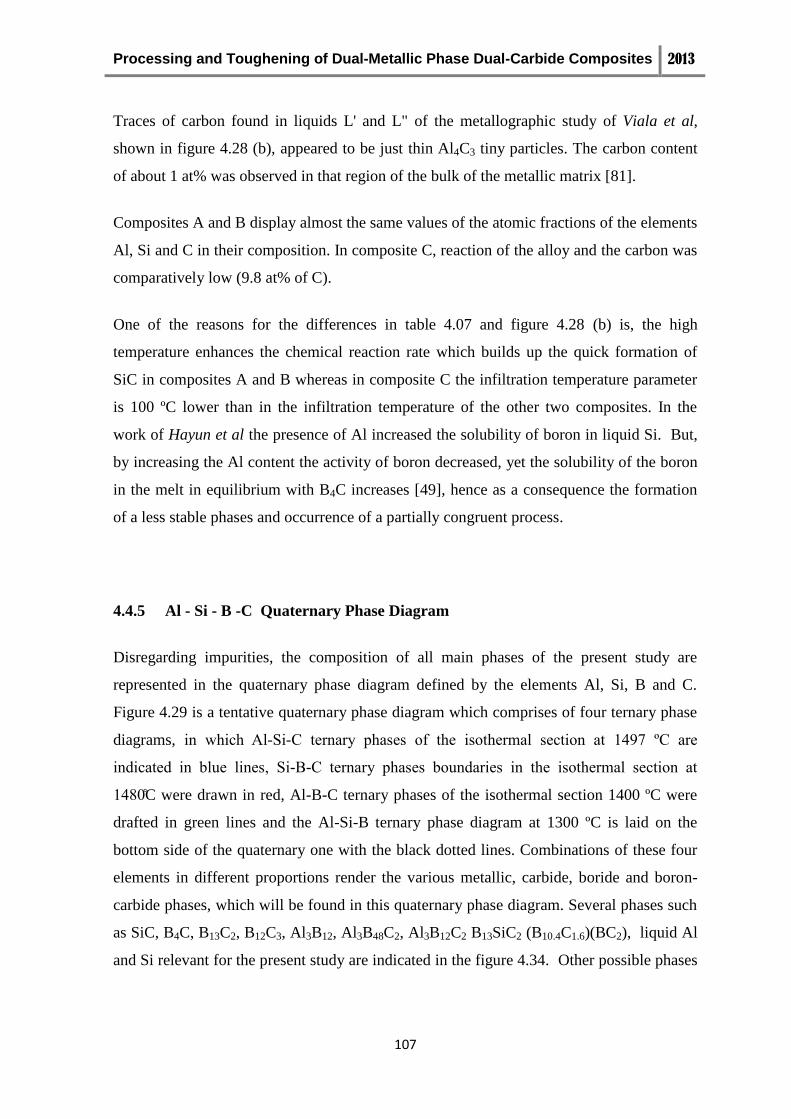
Processing and Toughening of Dual-Metallic Phase Dual-Carbide Composites 2013
107
Traces of carbon found in liquids L' and L" of the metallographic study of Viala et al,
shown in figure 4.28 (b), appeared to be just thin Al4C3 tiny particles. The carbon content
of about 1 at% was observed in that region of the bulk of the metallic matrix [81].
Composites A and B display almost the same values of the atomic fractions of the elements
Al, Si and C in their composition. In composite C, reaction of the alloy and the carbon was
comparatively low (9.8 at% of C).
One of the reasons for the differences in table 4.07 and figure 4.28 (b) is, the high
temperature enhances the chemical reaction rate which builds up the quick formation of
SiC in composites A and B whereas in composite C the infiltration temperature parameter
is 100 ºC lower than in the infiltration temperature of the other two composites. In the
work of Hayun et al the presence of Al increased the solubility of boron in liquid Si. But,
by increasing the Al content the activity of boron decreased, yet the solubility of the boron
in the melt in equilibrium with B4C increases [49], hence as a consequence the formation
of a less stable phases and occurrence of a partially congruent process.
4.4.5 Al - Si - B -C Quaternary Phase Diagram
Disregarding impurities, the composition of all main phases of the present study are
represented in the quaternary phase diagram defined by the elements Al, Si, B and C.
Figure 4.29 is a tentative quaternary phase diagram which comprises of four ternary phase
diagrams, in which Al-Si-C ternary phases of the isothermal section at 1497 C are
indicated in blue lines, Si- -C ternary phases boundaries in the isothermal section at
1480 C were drawn in red, Al-B-C ternary phases of the isothermal section 1400 ºC were
drafted in green lines and the Al-Si-B ternary phase diagram at 1300 ºC is laid on the
bottom side of the quaternary one with the black dotted lines. Combinations of these four
elements in different proportions render the various metallic, carbide, boride and boron-
carbide phases, which will be found in this quaternary phase diagram. Several phases such
as SiC, B4C, B13C2, B12C3, Al3B12, Al3B48C2, Al3B12C2 B13SiC2 (B10.4C1.6)(BC2), liquid Al
and Si relevant for the present study are indicated in the figure 4.34. Other possible phases
Processing and Toughening of Dual-Metallic Phase Dual-Carbide Composites 2013
108
of potential interest in relation to the future work may also be seen in this quaternary phase
diagram.
Figure 4.29: Isothermal section of Al - Si - B- C quaternary phase diagram (in at.%)
between 1300 ºC -1497 ºC[81], [83-85]. (Italic lettering with dotted lined
arrow marks corresponds to the Al-Si-B ternary phase)
During the reaction of molten Al with B4C at elevated temperature some hygroscopic and
mechanically weak phases, the Al4C3, Al3BC and Al3BC3 may form. The bonding between
the boron oxide layer and B4C can be reduced by allowing the reaction of Al with B4C and
avoiding the Al4C3 formation at the interface as much as possible [67]. Between 900 ºC
SiC+Liq+
B12(B,C,Si)3
Liq. + AlB12+(Si)
Al3BC3
SiC+Liq
Liq+SiB6+
B12(B,C,Si)3
SiC+
B12(B,C,Si
3)
SiB6
SiC
Al4C3 SiC+
Graphite+
B4C
Al3B48C2
B4C
AlSiC4
Al
Si
B
C
Liq+(Si)
Liq. Al
Liq. + AlB12
AlB12+(Si)
+SiB6
AlB12
SiB23
Liq.Al+Si
Threshold
C
A
B
Processing and Toughening of Dual-Metallic Phase Dual-Carbide Composites 2013
109
and 1000 ºC, Al alloys have good contact angles with Si, C and SiC; this transition of
temperature would collapse the passive oxide film or hinder the formation of Al4C3, or both
[86].
Si introduced in the Al molten solution reacts with C precipitating SiC reducing the
activity of C to such way that the reactions of formation of Al carbides are either reduced
or even stopped [76]. If the boron reaction is slower in the composite due to the lower
activity of Si and a high concentration of Al is maintained some of the less stable ternary
phases of boron carbide and boron sub-carbides are formed. Hence, the role of Si is
important for the composition of phases of composites made of reactive Al-Si melts and
B4C matrixes, and it should not decrease below the threshold of 12.6 wt% Si in the Al-Si
alloy [81]. The phase B10.4C polymorph of the boron carbide at the boron-rich edge of the
stoichiometry range of this compound is known as a high-boron solid solution of boron
carbide. The relevance of this polymorph comes from the large cross section of B for
neutrons with application in nuclear technology [12]. At room temperature the hardness of
B4C is only lower to diamond and cubic boron nitride.
The atomic fractions of the four elements Al, Si, B and C in the composite were calculated
from the average of the fractions of the phases in table 4.06 by the same method used to
establish the values of the atomic fractions in the previous table 4.07. The resulting values
as the atomic fractions of the 4 elements are given in table 4.08. The values of C content of
composites A and B are close together whereas in composite C it is definitively lower.
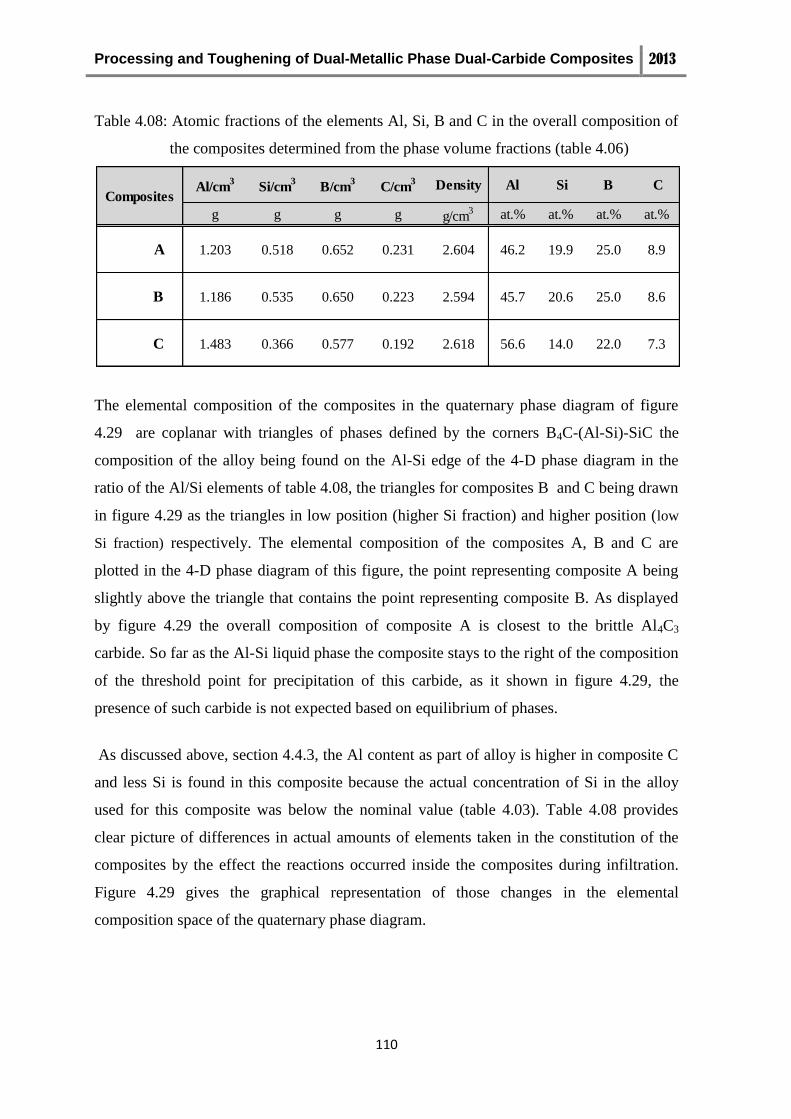
Processing and Toughening of Dual-Metallic Phase Dual-Carbide Composites 2013
110
Table 4.08: Atomic fractions of the elements Al, Si, B and C in the overall composition of
the composites determined from the phase volume fractions (table 4.06)
The elemental composition of the composites in the quaternary phase diagram of figure
4.29 are coplanar with triangles of phases defined by the corners B4C-(Al-Si)-SiC the
composition of the alloy being found on the Al-Si edge of the 4-D phase diagram in the
ratio of the Al/Si elements of table 4.08, the triangles for composites B and C being drawn
in figure 4.29 as the triangles in low position (higher Si fraction) and higher position (low
Si fraction) respectively. The elemental composition of the composites A, B and C are
plotted in the 4-D phase diagram of this figure, the point representing composite A being
slightly above the triangle that contains the point representing composite B. As displayed
by figure 4.29 the overall composition of composite A is closest to the brittle Al4C3
carbide. So far as the Al-Si liquid phase the composite stays to the right of the composition
of the threshold point for precipitation of this carbide, as it shown in figure 4.29, the
presence of such carbide is not expected based on equilibrium of phases.
As discussed above, section 4.4.3, the Al content as part of alloy is higher in composite C
and less Si is found in this composite because the actual concentration of Si in the alloy
used for this composite was below the nominal value (table 4.03). Table 4.08 provides
clear picture of differences in actual amounts of elements taken in the constitution of the
composites by the effect the reactions occurred inside the composites during infiltration.
Figure 4.29 gives the graphical representation of those changes in the elemental
composition space of the quaternary phase diagram.
Al/cm3
Si/cm3
B/cm3
C/cm3 Density Al Si B C
g g g g g/cm3 at.% at.% at.% at.%
Al-
25%S
i &
A 1.203 0.518 0.652 0.231 2.604 46.2 19.9 25.0 8.9
Al-
35%S
i &
B 1.186 0.535 0.650 0.223 2.594 45.7 20.6 25.0 8.6
Al-
25%S
i
C 1.483 0.366 0.577 0.192 2.618 56.6 14.0 22.0 7.3
Composites
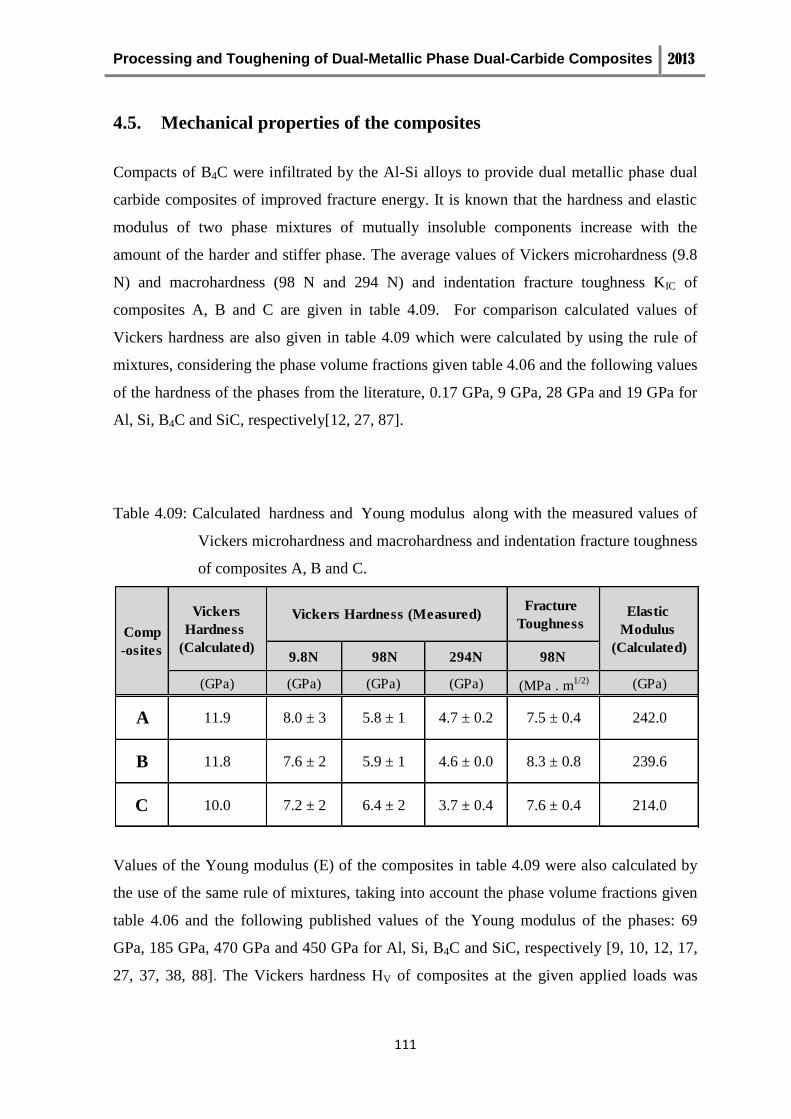
Processing and Toughening of Dual-Metallic Phase Dual-Carbide Composites 2013
111
4.5. Mechanical properties of the composites
Compacts of B4C were infiltrated by the Al-Si alloys to provide dual metallic phase dual
carbide composites of improved fracture energy. It is known that the hardness and elastic
modulus of two phase mixtures of mutually insoluble components increase with the
amount of the harder and stiffer phase. The average values of Vickers microhardness (9.8
N) and macrohardness (98 N and 294 N) and indentation fracture toughness KIC of
composites A, B and C are given in table 4.09. For comparison calculated values of
Vickers hardness are also given in table 4.09 which were calculated by using the rule of
mixtures, considering the phase volume fractions given table 4.06 and the following values
of the hardness of the phases from the literature, 0.17 GPa, 9 GPa, 28 GPa and 19 GPa for
Al, Si, B4C and SiC, respectively[12, 27, 87].
Table 4.09: Calculated hardness and Young modulus along with the measured values of
Vickers microhardness and macrohardness and indentation fracture toughness
of composites A, B and C.
Values of the Young modulus (E) of the composites in table 4.09 were also calculated by
the use of the same rule of mixtures, taking into account the phase volume fractions given
table 4.06 and the following published values of the Young modulus of the phases: 69
GPa, 185 GPa, 470 GPa and 450 GPa for Al, Si, B4C and SiC, respectively [9, 10, 12, 17,
27, 37, 38, 88]. The Vickers hardness HV of composites at the given applied loads was
Fracture
Toughness
9.8N 98N 294N 98N
(GPa) (GPa) (GPa) (GPa) (MPa . m1/2) (GPa)
A 11.9 8.0 ± 3 5.8 ± 1 4.7 ± 0.2 7.5 ± 0.4 242.0
B 11.8 7.6 ± 2 5.9 ± 1 4.6 ± 0.0 8.3 ± 0.8 239.6
C 10.0 7.2 ± 2 6.4 ± 2 3.7 ± 0.4 7.6 ± 0.4 214.0
Comp
-osites
Vickers
Hardness
(Calculated)
Vickers Hardness (Measured) Elastic
Modulus
(Calculated)

Processing and Toughening of Dual-Metallic Phase Dual-Carbide Composites 2013
112
measured as described in section 3.5. The values of E were needed for determining KIC
according to the Anstis equation, Eq (3.09).
4.5.1. Microhardness
The distribution of values of Vickers microhardness HV (9.8 N) along the direction
transverse to the axis of the pellet at the top (T), middle (M) and bottom (B) areas of the
longitudinal cross sections of the composites are shown figures 4.30 (a) to 4.30 (c). The
image of optical microscopy of the microhardness impression of a sampled point of
composite B with local value of HV = 6.7 GPa is shown in figure 4.31. The particles of
bright finishing with white/yellow colours and of positive relief in figure 4.31 are B4C, the
darker particles of roughed surfaces are Al and those of golden yellow tones with polished
finish and negative relief must be Si. The areas of indenter impressions in microhardness
tests with the 9.8 N applied load are small compared to dimensions of the coarse clusters of
hard B4C grains and of the metallic phases in between these clusters. The values of
microhardness drastically changed from very high hardness when the Vickers indenter tip
landed on grains of the hardest phase, the B4C, to the lowest values if it landed on places of
the soft Al phase. There is a larger scatter in the measured values of HV (9.8 N) of the
composites from point to point as seen in figures 4.30 (a) to 4.30 (c). From 26 to 32
indentations were made on each composite in the determination of microhardness. For the
9.8 N applied load of the microhardness measurements no indentation cracks at the corners
or chipping at the edges of the pyramidal shaped impression of indenter on the composites
were found, as shown in figure 4.31.
All the three composites show a few odd values in the readings of microhardness. The
extreme highest and lowest value of each set of measured microhardness values of the
composites were not taken in the calculation of the corresponding average and standard
deviation of microhardness and macrohardness given in table 4.09. However, all measured
points were considered and are plotted in the graphs of microhardness in figure 4.30.
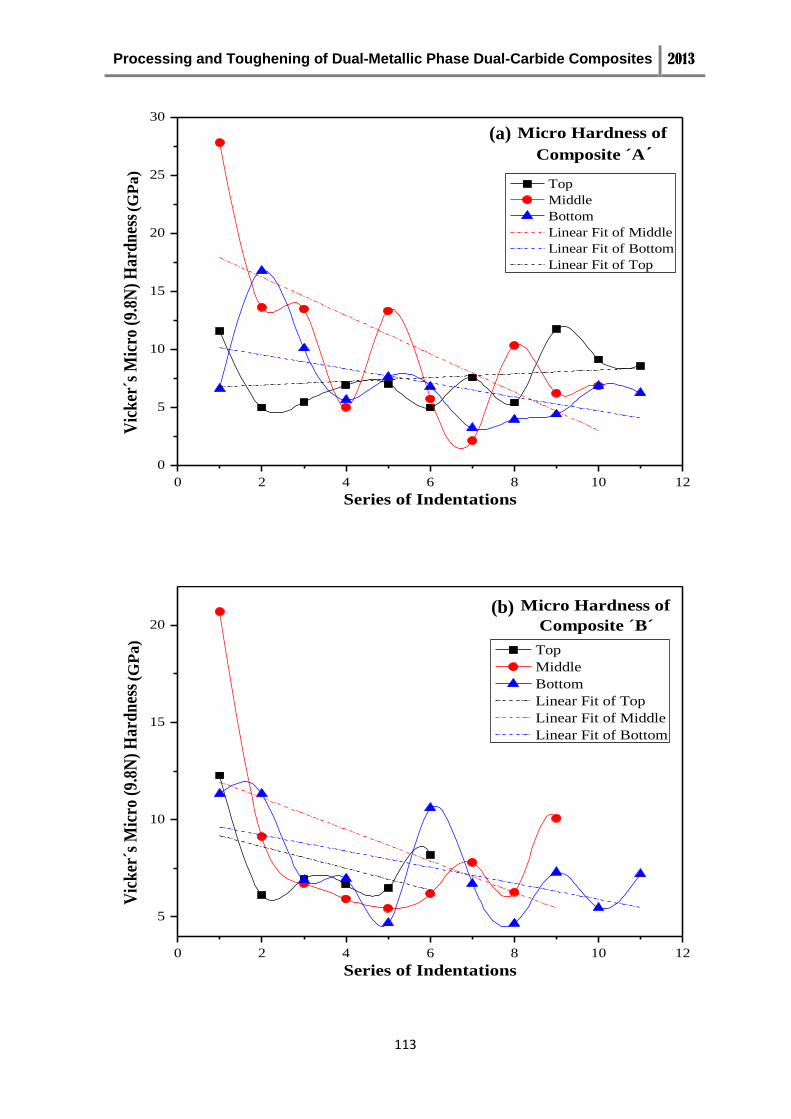
Processing and Toughening of Dual-Metallic Phase Dual-Carbide Composites 2013
113
0 2 4 6 8 10 12
0
5
10
15
20
25
30
Micro Hardness of
Composite ´A´
Vic
ker
´s M
icro
(9.
8N)
Har
dn
ess
(Gp
a)
Series of Indentations
Top
Middle
Bottom
Linear Fit of Middle
Linear Fit of Bottom
Linear Fit of Top
0 2 4 6 8 10 12
5
10
15
20
Vic
ker
´s M
icro
(9.
8N)
Har
dn
ess
(Gp
a)
Series of Indentations
Top
Middle
Bottom
Linear Fit of Top
Linear Fit of Middle
Linear Fit of Bottom
Micro Hardness of
Composite ´B´
(b)
(a) (G
Pa)
(GP
a)
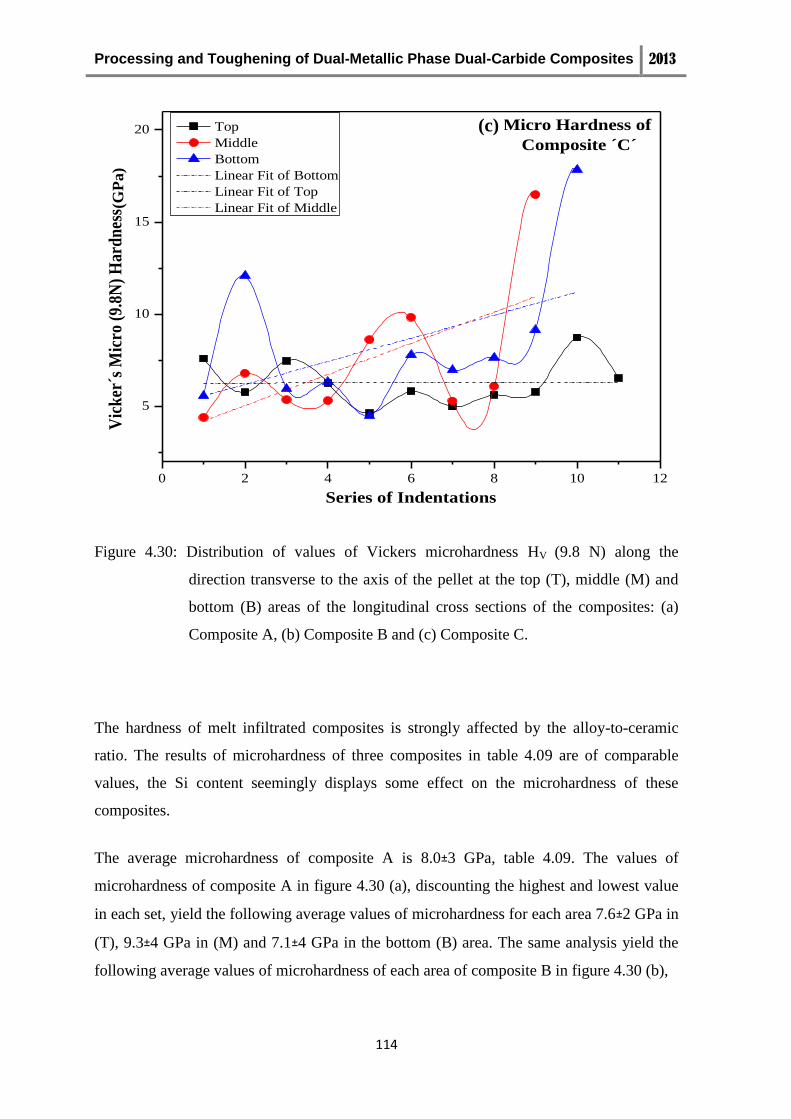
Processing and Toughening of Dual-Metallic Phase Dual-Carbide Composites 2013
114
0 2 4 6 8 10 12
5
10
15
20V
ick
er´s
Mic
ro (
9.8N
) H
ard
nes
s (G
pa)
Series of Indentations
Top
Middle
Bottom
Linear Fit of Bottom
Linear Fit of Top
Linear Fit of Middle
Micro Hardness of
Composite ´C´
Figure 4.30: Distribution of values of Vickers microhardness HV (9.8 N) along the
direction transverse to the axis of the pellet at the top (T), middle (M) and
bottom (B) areas of the longitudinal cross sections of the composites: (a)
Composite A, (b) Composite B and (c) Composite C.
The hardness of melt infiltrated composites is strongly affected by the alloy-to-ceramic
ratio. The results of microhardness of three composites in table 4.09 are of comparable
values, the Si content seemingly displays some effect on the microhardness of these
composites.
The average microhardness of composite A is 8.0±3 GPa, table 4.09. The values of
microhardness of composite A in figure 4.30 (a), discounting the highest and lowest value
in each set, yield the following average values of microhardness for each area 7.6±2 GPa in
(T), 9.3±4 GPa in (M) and 7.1±4 GPa in the bottom (B) area. The same analysis yield the
following average values of microhardness of each area of composite B in figure 4.30 (b),
(c) (G
Pa)

Processing and Toughening of Dual-Metallic Phase Dual-Carbide Composites 2013
115
7.8±3 GPa in (T), 7.2±2 GPa in (B) and 7.9±2 GPa in the bottom (B) area, while for
composite C the following average values of microhardness are calculated from the
distributions of points plotted in figure 4.30 (c), 6.3±1 GPa in (T), 8.0±1 GPa in (M) and
7.3±2 GPa in the bottom (B) area of this composite.
Figure 4.31: Image of optical microscopy of the microhardness indentation impression of a
point with HV = 6.7 GPa, 9.8N applied load on top (T) region of composite B.
The slope of the trend line fitted to the (M) set of microhardness data of composite A in
figure 4.30 (a) shows the net effect of the single point of extreme hardness on the left of
the composite cross section in the middle area. Similar effects of single points of extreme
hardness are observed on the slopes of some trend lines fitted to microhardness data in
figures 4.30 (b) and figure 4.30 (c). The microhardness of the measured points of the top
(T) and bottom (B) areas of composite A plotted in figure 4.30 (a) are in better balance.
The slopes of the corresponding trend lines of (T) and (B) describe some variation of
hardness from one side to the other across the longitudinal cross section of this composite.
The differences in hardness may come from local differences of relative density in the

Processing and Toughening of Dual-Metallic Phase Dual-Carbide Composites 2013
116
preforms or of melt flow and degree of reaction during the RMI stage. Similar fluctuations
of slope of the trend lines fitted to microhardness data plotted in figures 4.30 (b) and 4.30
(c) are observed. Accounting for the limited accuracy and large scatter of these
measurements no interpretation of the observed changes in slope of microhardness of the
plots in figure 4.30 is attempted here.
4.5.2. Macrohardness
Applied loads of 98 N and 294 N were used in the determination of the macrohardness of
the RMI composites of this study, the corresponding average values of HV are given in
table 4.09. The image of optical microscopy of a Vickers indenter impression of
macrohardness measurement of composite B in figure 4.32 shows that the indenter
impressions covers a large area in comparison to the dimensional scale of the main
microstructural features of the composite. Adequate area coverage of the microstructure of
the ceramic composites by the indenter impression with high enough applied loads is need
to rendered the optimal conditions for assessment of hardness and of indentation fracture
toughness too. The applied load of 29.4 N was selected by Wu et al [1] for the
determination of HV and indentation fracture toughness KIC of similar RMI B4C
composites [89]. Preliminary results of the present study confirmed that the applied load of
98 N was need and better suited for clear depicting of the hardness property of the
composites.
General deformation and distortion of the composite structure around the indentation
impression is observed near the edges, figure 4.32. The large area coverage of the indenter
and high load of macrohardness created different mechanical reactions of the
microstructure pressed by the Vickers indenter. Due to the composite structure with metals
and ceramics some corners of indentations do not form any linear cracks, the neighbour
particles simply break in several directions due to the brittleness of Si and ceramic
particles, whereas at other corners (Al) metallic particles dominate and hindered the
nucleation of flaws or larger cracks at the site.

Processing and Toughening of Dual-Metallic Phase Dual-Carbide Composites 2013
117
Figure 4.32: Image of optical microscopy of a Vickers indenter impression of
macrohardness (98N) measurement of composite C.
There is less scatter in the values of HV (98 N) macrohardness of the composites in figures
4.33 (a) to 4.33 (c) than in the corresponding values of microhardness. The average of
hardness on each area of the cross sections of the composites referenced in figure 4.33 was
also calculated.
For comparison with the average values of macrohardness in table 4.09, the values of HV
of composite A for each area shown in distribution of points in figure 4.33 (a) are 5.6±1
GPa in (T), 6.5±1 GPa in (M) and 5.8±1 GPa in the bottom (B) area. The same procedure
yield the following average values of macrohardness of each area of composite B in figure
4.33 (b), 6.0±1 GPa in (T), 5.9±1 GPa in (B) and 5.7±2 GPa in the bottom (B) area, while
for composite C the following average values of macrohardness are calculated from the
distributions of points plotted in figure 4.33 (c), 7.1±2 GPa in (T), 6.2±1 GPa in (B) and
5.9±1 GPa in the bottom (B) area of this composite.
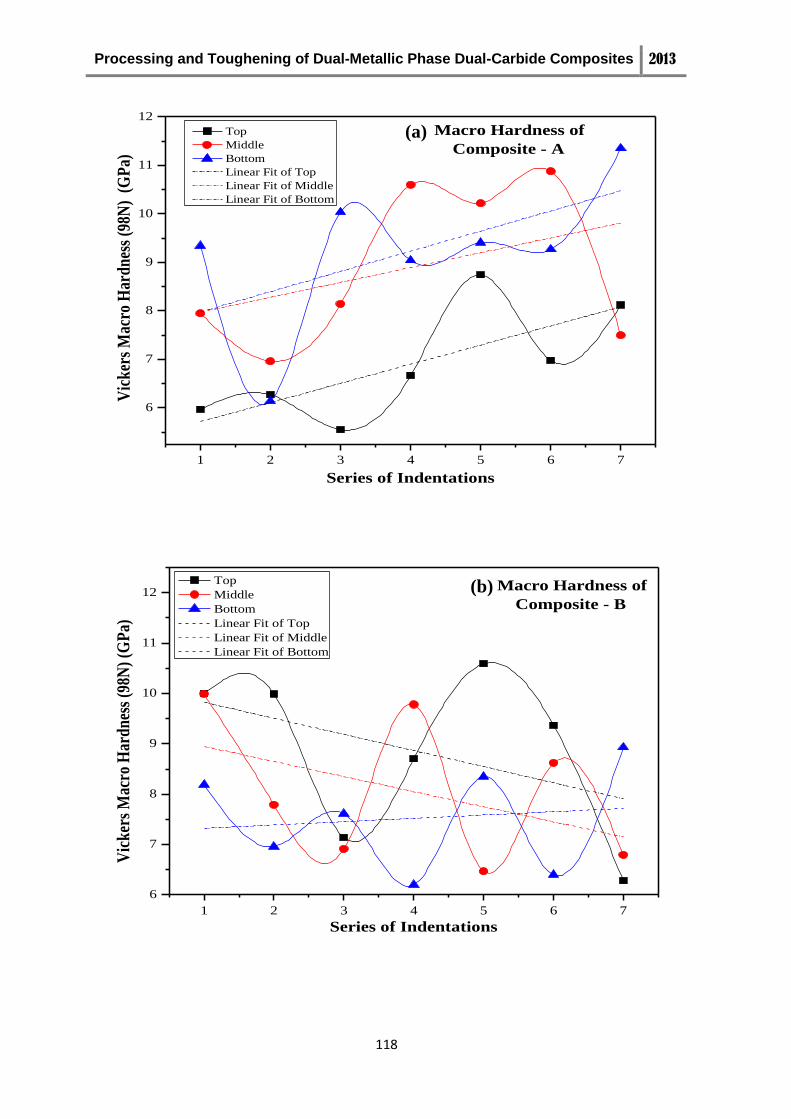
Processing and Toughening of Dual-Metallic Phase Dual-Carbide Composites 2013
118
1 2 3 4 5 6 7
6
7
8
9
10
11
12
Macro Hardness of
Composite - A
Vic
ker
s M
acro
Har
dn
ess
(98N
) (
GP
a)
Series of Indentations
Top
Middle
Bottom
Linear Fit of Top
Linear Fit of Middle
Linear Fit of Bottom
1 2 3 4 5 6 7
6
7
8
9
10
11
12
Vic
ker
s M
acro
Har
dn
ess
(98N
) (G
Pa)
Series of Indentations
Top
Middle
Bottom
Linear Fit of Top
Linear Fit of Middle
Linear Fit of Bottom
Macro Hardness of
Composite - B
(a)
(b)
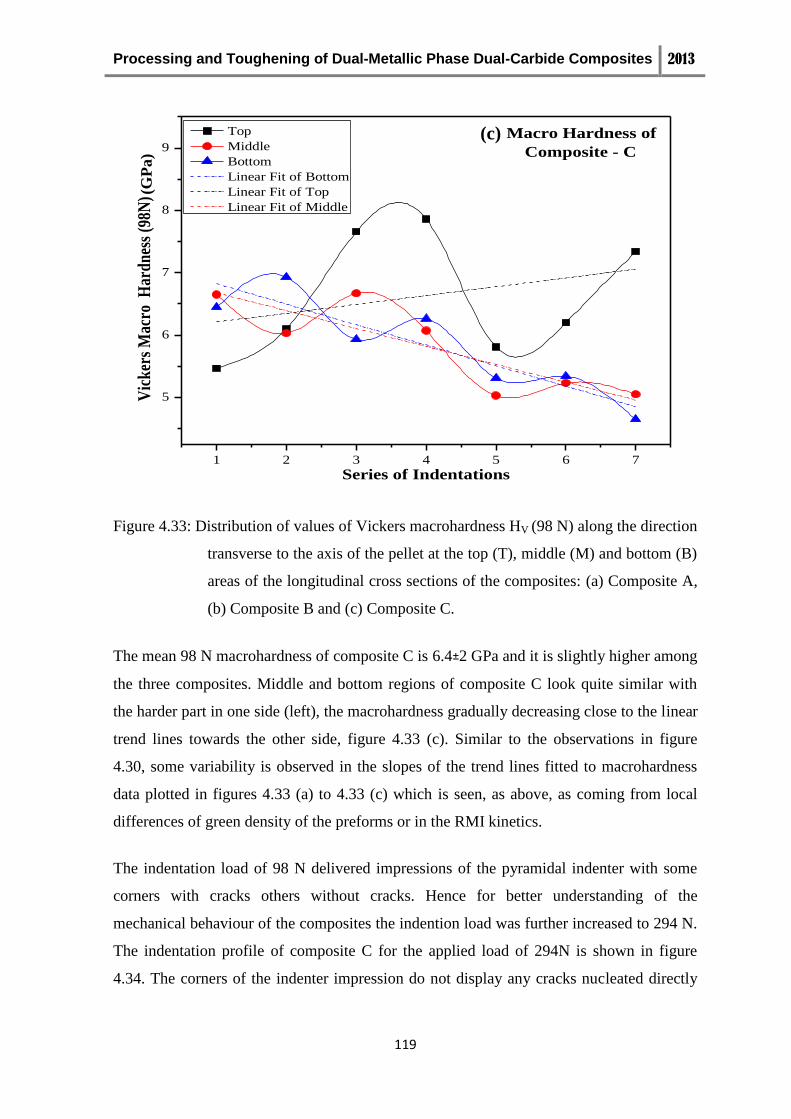
Processing and Toughening of Dual-Metallic Phase Dual-Carbide Composites 2013
119
1 2 3 4 5 6 7
5
6
7
8
9V
ick
ers
Mac
ro H
ard
nes
s (9
8N)
(Gp
a)
Series of Indentations
Top
Middle
Bottom
Linear Fit of Bottom
Linear Fit of Top
Linear Fit of Middle
Macro Hardness of
Composite - C
Figure 4.33: Distribution of values of Vickers macrohardness HV (98 N) along the direction
transverse to the axis of the pellet at the top (T), middle (M) and bottom (B)
areas of the longitudinal cross sections of the composites: (a) Composite A,
(b) Composite B and (c) Composite C.
The mean 98 N macrohardness of composite C is 6.4±2 GPa and it is slightly higher among
the three composites. Middle and bottom regions of composite C look quite similar with
the harder part in one side (left), the macrohardness gradually decreasing close to the linear
trend lines towards the other side, figure 4.33 (c). Similar to the observations in figure
4.30, some variability is observed in the slopes of the trend lines fitted to macrohardness
data plotted in figures 4.33 (a) to 4.33 (c) which is seen, as above, as coming from local
differences of green density of the preforms or in the RMI kinetics.
The indentation load of 98 N delivered impressions of the pyramidal indenter with some
corners with cracks others without cracks. Hence for better understanding of the
mechanical behaviour of the composites the indention load was further increased to 294 N.
The indentation profile of composite C for the applied load of 294N is shown in figure
4.34. The corners of the indenter impression do not display any cracks nucleated directly
(c) (G
Pa)
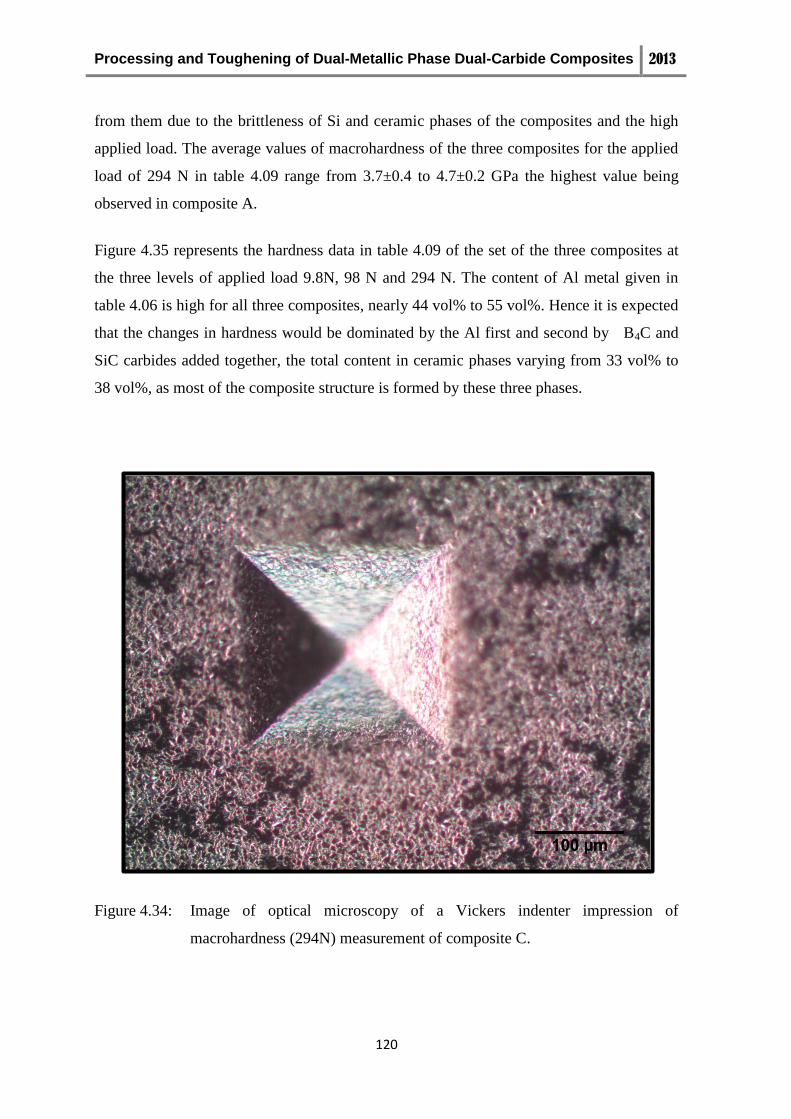
Processing and Toughening of Dual-Metallic Phase Dual-Carbide Composites 2013
120
from them due to the brittleness of Si and ceramic phases of the composites and the high
applied load. The average values of macrohardness of the three composites for the applied
load of 294 N in table 4.09 range from 3.7±0.4 to 4.7±0.2 GPa the highest value being
observed in composite A.
Figure 4.35 represents the hardness data in table 4.09 of the set of the three composites at
the three levels of applied load 9.8N, 98 N and 294 N. The content of Al metal given in
table 4.06 is high for all three composites, nearly 44 vol% to 55 vol%. Hence it is expected
that the changes in hardness would be dominated by the Al first and second by B4C and
SiC carbides added together, the total content in ceramic phases varying from 33 vol% to
38 vol%, as most of the composite structure is formed by these three phases.
Figure 4.34: Image of optical microscopy of a Vickers indenter impression of
macrohardness (294N) measurement of composite C.
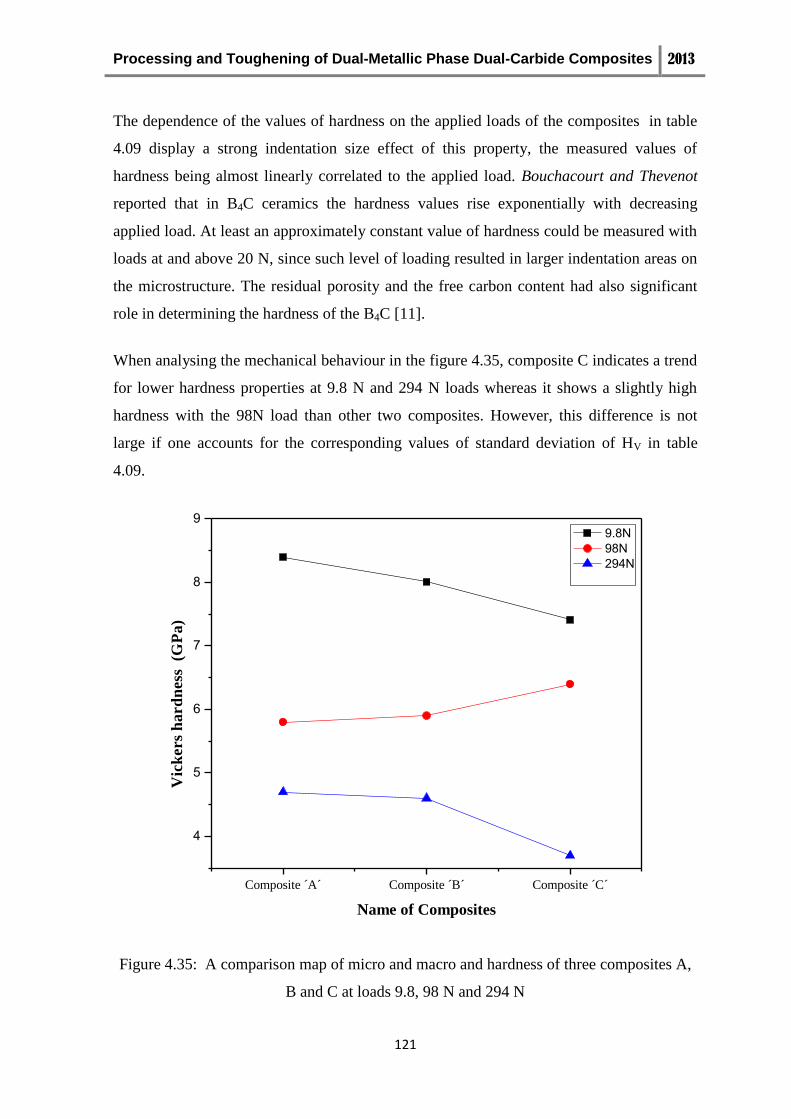
Processing and Toughening of Dual-Metallic Phase Dual-Carbide Composites 2013
121
The dependence of the values of hardness on the applied loads of the composites in table
4.09 display a strong indentation size effect of this property, the measured values of
hardness being almost linearly correlated to the applied load. Bouchacourt and Thevenot
reported that in B4C ceramics the hardness values rise exponentially with decreasing
applied load. At least an approximately constant value of hardness could be measured with
loads at and above 20 N, since such level of loading resulted in larger indentation areas on
the microstructure. The residual porosity and the free carbon content had also significant
role in determining the hardness of the B4C [11].
When analysing the mechanical behaviour in the figure 4.35, composite C indicates a trend
for lower hardness properties at 9.8 N and 294 N loads whereas it shows a slightly high
hardness with the 98N load than other two composites. However, this difference is not
large if one accounts for the corresponding values of standard deviation of HV in table
4.09.
Composite ´A´ Composite ´B´ Composite ´C´
4
5
6
7
8
9
Vic
kers
ha
rd
ness
(G
Pa
)
Name of Composites
9.8N
98N
294N
Figure 4.35: A comparison map of micro and macro and hardness of three composites A,
B and C at loads 9.8, 98 N and 294 N
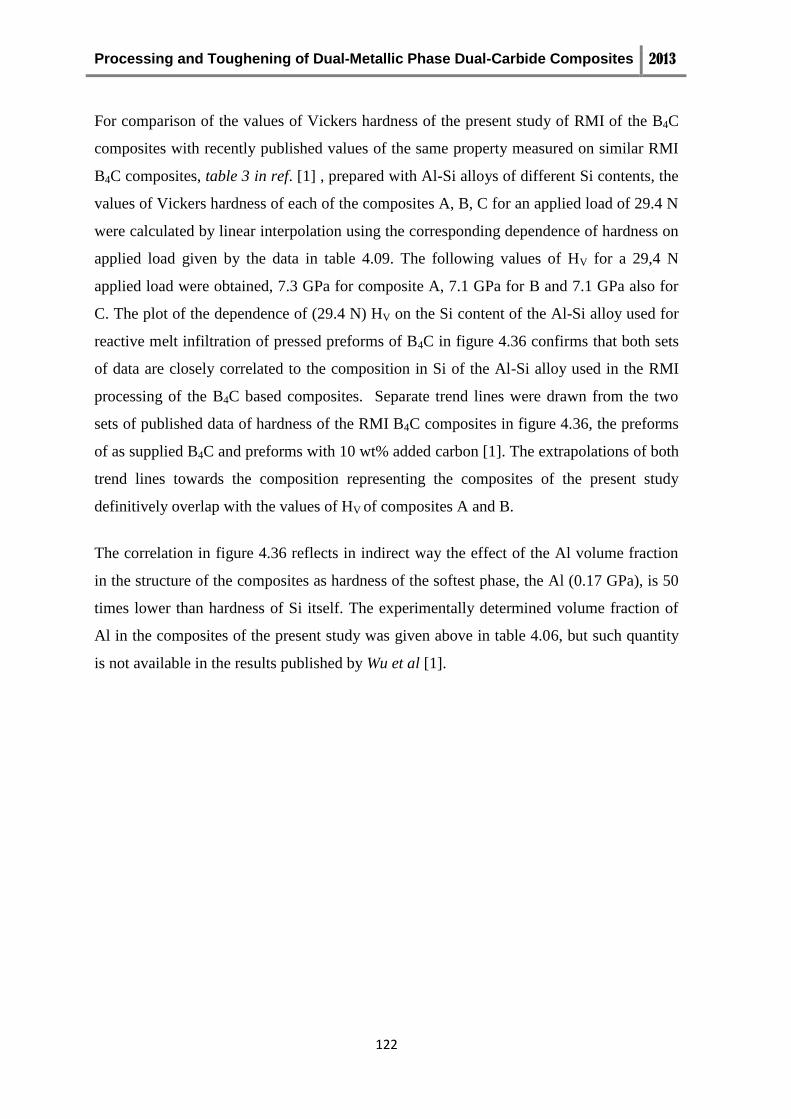
Processing and Toughening of Dual-Metallic Phase Dual-Carbide Composites 2013
122
For comparison of the values of Vickers hardness of the present study of RMI of the B4C
composites with recently published values of the same property measured on similar RMI
B4C composites, table 3 in ref. [1] , prepared with Al-Si alloys of different Si contents, the
values of Vickers hardness of each of the composites A, B, C for an applied load of 29.4 N
were calculated by linear interpolation using the corresponding dependence of hardness on
applied load given by the data in table 4.09. The following values of HV for a 29,4 N
applied load were obtained, 7.3 GPa for composite A, 7.1 GPa for B and 7.1 GPa also for
C. The plot of the dependence of (29.4 N) HV on the Si content of the Al-Si alloy used for
reactive melt infiltration of pressed preforms of B4C in figure 4.36 confirms that both sets
of data are closely correlated to the composition in Si of the Al-Si alloy used in the RMI
processing of the B4C based composites. Separate trend lines were drawn from the two
sets of published data of hardness of the RMI B4C composites in figure 4.36, the preforms
of as supplied B4C and preforms with 10 wt% added carbon [1]. The extrapolations of both
trend lines towards the composition representing the composites of the present study
definitively overlap with the values of HV of composites A and B.
The correlation in figure 4.36 reflects in indirect way the effect of the Al volume fraction
in the structure of the composites as hardness of the softest phase, the Al (0.17 GPa), is 50
times lower than hardness of Si itself. The experimentally determined volume fraction of
Al in the composites of the present study was given above in table 4.06, but such quantity
is not available in the results published by Wu et al [1].
Processing and Toughening of Dual-Metallic Phase Dual-Carbide Composites 2013
123
Figure 4.36: Dependence of Vickers hardness the composites on the Si fraction in the Al-
Si alloy used for reactive melt infiltration of B4C preforms, 29.4 N applied
load (Wu et al [1]).
4.5.3 Indentation fracture toughness
The values of indentation fracture toughness of composites A and C in table 4.09
determined from Vickers indentation at the applied load of 98 N are almost equal
accounting for corresponding values of the standard deviation. Composite B has a slightly
higher value of KIC. The experimental work was planned under the assumption that in
order to obtain a tougher composite the metallic Si content in the RMI composite should be
kept to a minimum favouring the maximum volume fraction of the ductile metal Al [1],
provided that the Si content would be maintained above the threshold of Si in the Al-Si
alloy that inhibits the formation of Al4C3 carbide (section 4.4.2). Nevertheless, lowering
0
5
10
15
20
25
10 100
Vic
ker
s h
ard
nes
s, H
v (
GP
a)
Si fraction in Al-Si allloy, Si (wt%)
B4C, H. Wu et al 2012
B4C-10%C, H. Wu et al 2012
This Study
Processing and Toughening of Dual-Metallic Phase Dual-Carbide Composites 2013
124
the Si content in the alloy would also lead to poor infiltration behaviour. Composite B of
higher Si content displays the higher value of KIC in the set of the three composites in table
4.09.
In the process of evaluating KIC, the actual measurement of the crack lengths by optical
microscopy was difficult, section 3.5. Only by using indentation loads close to 98 N could
the values of KIC be approximately established from indentation fracture results in the
present study. Analogous difficulties in determining the values KIC of two MRI B4C
composites prepared with 36 wt% Si alloy from HV3 (29.4 N) indentation results were
recently reported [1]. Whereas in HV1 no indentation cracks formed due high toughness of
the composites, table 4.09, at the highest applied load of 294 N the HV30 indentation
impressions developed complex damage patterns and no definitive cracks propagating
from the indentation corners could ultimately be identified. Differently, with the 98N
applied load formation of different types of cracks was witnessed. The maximum
extensions of those cracks propagating close to the radial direction defined by the
indentation corners were determined with recurs to SEM microscopy and the indentation
fracture toughness calculated by using Anstis equation (Eq 3.09). Under such context
errors in observation of the crack tips could not be avoided, the values of KIC in table 4.09
must be seen as crude first time estimation of the fracture toughness of these composites
with the techniques made available in the laboratory.
The values of Young modulus E of the composites in table 4.09 were calculated by the rule
of mixtures. The values of indentation fracture toughness determined by using Anstis
equation (Eq 3.09) are dependent on the values taken for E. In a different way, slightly
different values of E of the composites would have been obtained if results of the elastic
properties Al-Si at the particular Si ratio were taken instead [90]. Microstructural
differences in the ceramics often have opposite effects on fracture toughness and strength,
such as the observed decrease in strength in parallel with increased toughness with the
coarse grains sizes [89]. Mean grain size of B4C plays a significant role in the fracture
toughness of the B4C ceramics where higher free C content (5 wt%) and low mean grain
size (2 µm) reduces fracture toughness. At the same time, the increasing in average grain
size up to 10 µm with the same graphite content increased fracture toughness [73]. The
Processing and Toughening of Dual-Metallic Phase Dual-Carbide Composites 2013
125
formation of other structures of B4C resulted in and increased of up to 60% of the fracture
toughness; at temperatures above 1200°C hardness is also improved [91].
Details on crack nucleation and propagation from indentation marks of the 98 N
indentation test are given in figures 4.37 and 4.38. The radial crack nucleated at the corner
of the indentation mark is marked (A) in figure 4.37. Radial cracks formed in the
indentation marks of all three composites at 98 N applied load, but rarely in all four
corners of the same indentation impression. In the image of a pyramidal profile of Vickers
indentation of composite B in figure 4.39 no radial cracks or crack branches were
nucleated at the indentation corner, rather instead grain dislodging with matrix
microcraking is observed at the indentation edge. A counting was run on the indentation
marks of all three composites to estimate the proportion of blunt corners without detectable
cracks. Out of all 98 N indentation marks of composite A 22% did not show developed
cracks in the corners, the corresponding rates being 15% in composite B and 10% in
composite C. Nearly 50% to 60% of the radial cracks of all composites display crack
branching in a visible way.
Mark (B) in same figure 4.37 points to cracks normal to surface (as radial cracks) that
developed from the edges of the indentation mark. These crack found their path through
the white phase (eventually Si). Mark (C) on the right side of the figure indicates the
formation of a lateral crack, the round contour of the delaminated chip being delineated on
the surface. Such kind of cracks has been observed by SEM at outdistances from the
indentation impressions. The corner of the indentation profile to the near right cannot be
viewed in figure 4.38 where features of radial and lateral cracks can also be observed.
The Vickers indentation of composite A in figure 4.40 displays the nucleation sites of the
radial crack at the indentation corner and of a lateral crack underneath the surface at the
indenter-piece interface. It was found that when the maximum contact force of indentation
is low, the lateral crack is confined within the shallow surface layer, whereas when the
maximum indentation force is higher, the crack tends to nucleate at deep beneath the
surface at the indenter-piece interface[92].

Processing and Toughening of Dual-Metallic Phase Dual-Carbide Composites 2013
126
Figure 4.37: SEM image of the pyramidal profile a 98 N Vickers indentation of
composite C.
Transgranular fracture and crack bridging are indicated by arrows in the enlarged view of
the indentation fracture of composite C in figure 4.38. When analysing figures 4.38 to 4.40
isolated particles of different phases are viewed on the deflected path of the cracks
showing cleavage with different aspects according to the crystalline structure of the phases.
Crack deflection increases the fracture toughness of the composites. Figures 4.37 and 4.38
show that small particles (of SiC or B4C) stopped crack propagation, at the same time
others thought to be the Al phase acted as bridges in the crack wake zones. It was often
seen that wherever the radial or other cracks branch there are strained bridge ridges nearby,
may be due to more abundant Al phase at the place. The usage of more Al would lead to
higher energy consumption in fracture. De-bonding at the interface of the phases is seen at
few places in figures 4.38 to 4.40. Transgranular fracture of B4C particles was mostly
observed near the indentation corners.
Crack branches
A
B
B
C
B
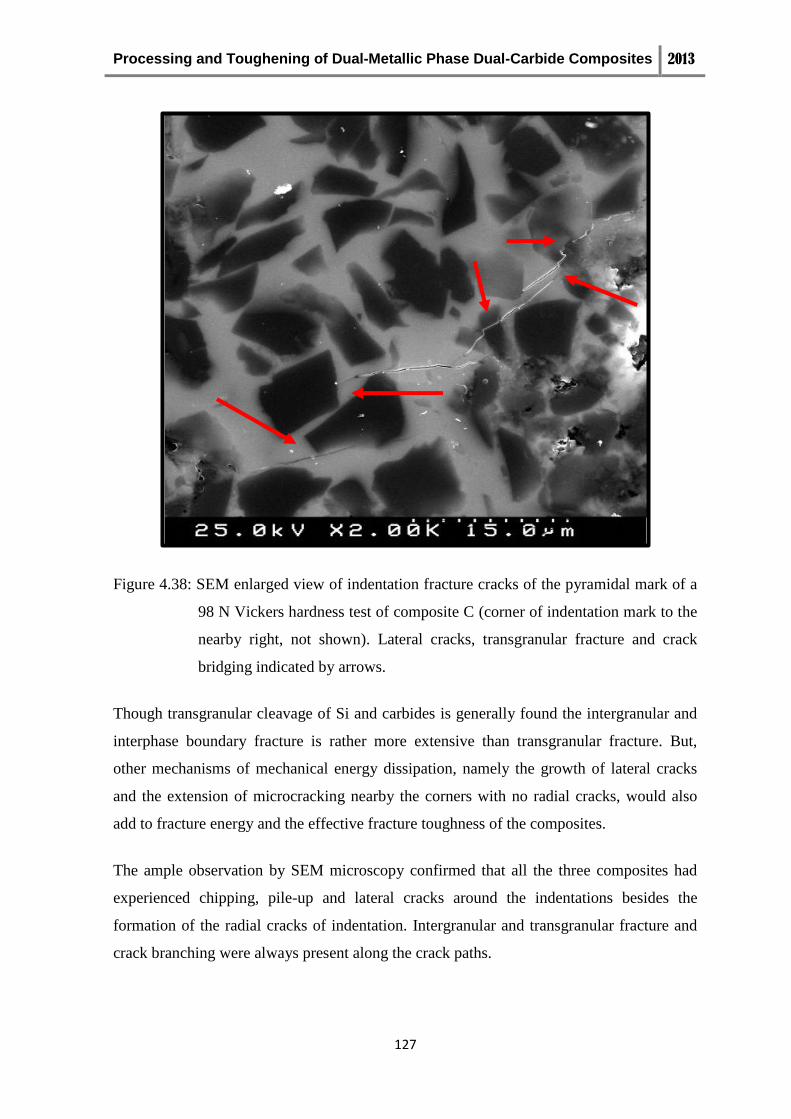
Processing and Toughening of Dual-Metallic Phase Dual-Carbide Composites 2013
127
Figure 4.38: SEM enlarged view of indentation fracture cracks of the pyramidal mark of a
98 N Vickers hardness test of composite C (corner of indentation mark to the
nearby right, not shown). Lateral cracks, transgranular fracture and crack
bridging indicated by arrows.
Though transgranular cleavage of Si and carbides is generally found the intergranular and
interphase boundary fracture is rather more extensive than transgranular fracture. But,
other mechanisms of mechanical energy dissipation, namely the growth of lateral cracks
and the extension of microcracking nearby the corners with no radial cracks, would also
add to fracture energy and the effective fracture toughness of the composites.
The ample observation by SEM microscopy confirmed that all the three composites had
experienced chipping, pile-up and lateral cracks around the indentations besides the
formation of the radial cracks of indentation. Intergranular and transgranular fracture and
crack branching were always present along the crack paths.
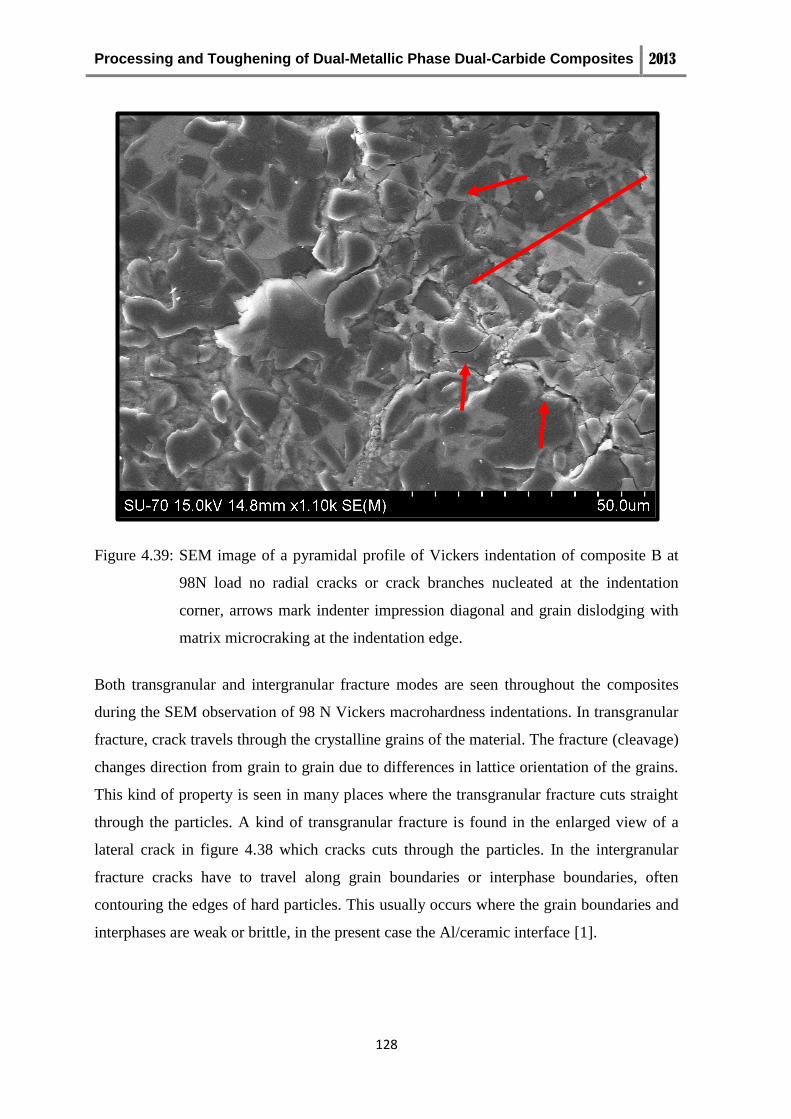
Processing and Toughening of Dual-Metallic Phase Dual-Carbide Composites 2013
128
Figure 4.39: SEM image of a pyramidal profile of Vickers indentation of composite B at
98N load no radial cracks or crack branches nucleated at the indentation
corner, arrows mark indenter impression diagonal and grain dislodging with
matrix microcraking at the indentation edge.
Both transgranular and intergranular fracture modes are seen throughout the composites
during the SEM observation of 98 N Vickers macrohardness indentations. In transgranular
fracture, crack travels through the crystalline grains of the material. The fracture (cleavage)
changes direction from grain to grain due to differences in lattice orientation of the grains.
This kind of property is seen in many places where the transgranular fracture cuts straight
through the particles. A kind of transgranular fracture is found in the enlarged view of a
lateral crack in figure 4.38 which cracks cuts through the particles. In the intergranular
fracture cracks have to travel along grain boundaries or interphase boundaries, often
contouring the edges of hard particles. This usually occurs where the grain boundaries and
interphases are weak or brittle, in the present case the Al/ceramic interface [1].
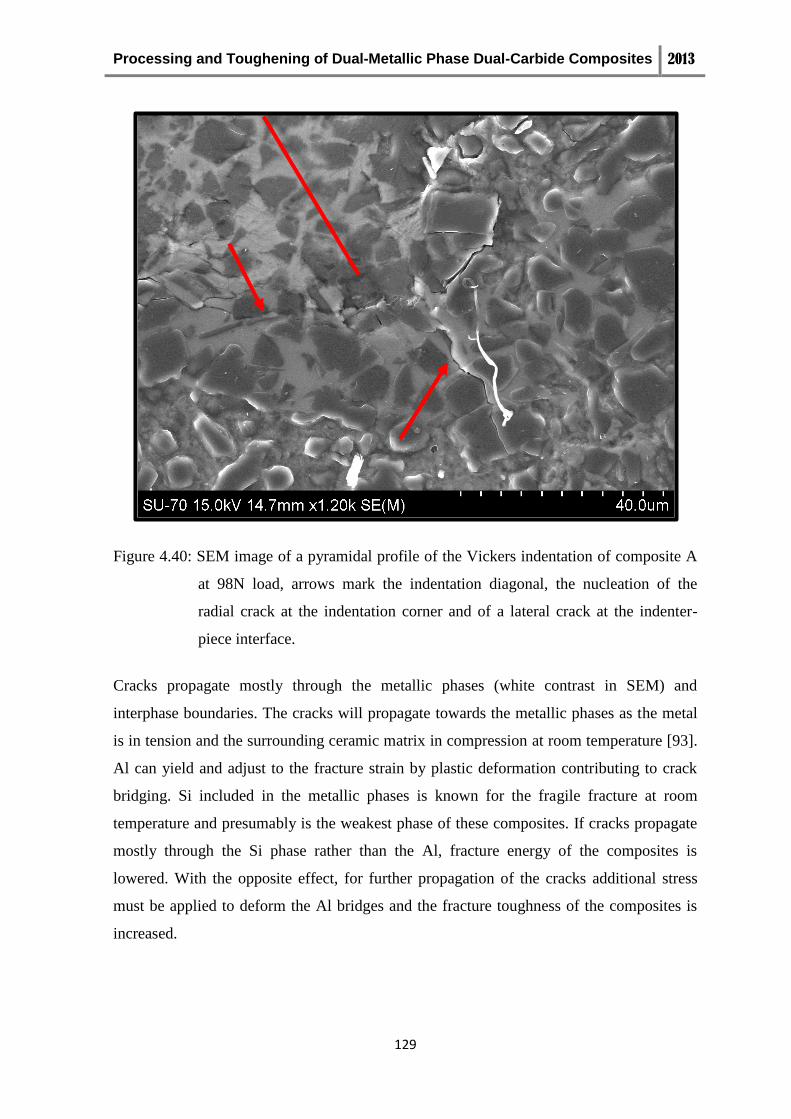
Processing and Toughening of Dual-Metallic Phase Dual-Carbide Composites 2013
129
Figure 4.40: SEM image of a pyramidal profile of the Vickers indentation of composite A
at 98N load, arrows mark the indentation diagonal, the nucleation of the
radial crack at the indentation corner and of a lateral crack at the indenter-
piece interface.
Cracks propagate mostly through the metallic phases (white contrast in SEM) and
interphase boundaries. The cracks will propagate towards the metallic phases as the metal
is in tension and the surrounding ceramic matrix in compression at room temperature [93].
Al can yield and adjust to the fracture strain by plastic deformation contributing to crack
bridging. Si included in the metallic phases is known for the fragile fracture at room
temperature and presumably is the weakest phase of these composites. If cracks propagate
mostly through the Si phase rather than the Al, fracture energy of the composites is
lowered. With the opposite effect, for further propagation of the cracks additional stress
must be applied to deform the Al bridges and the fracture toughness of the composites is
increased.
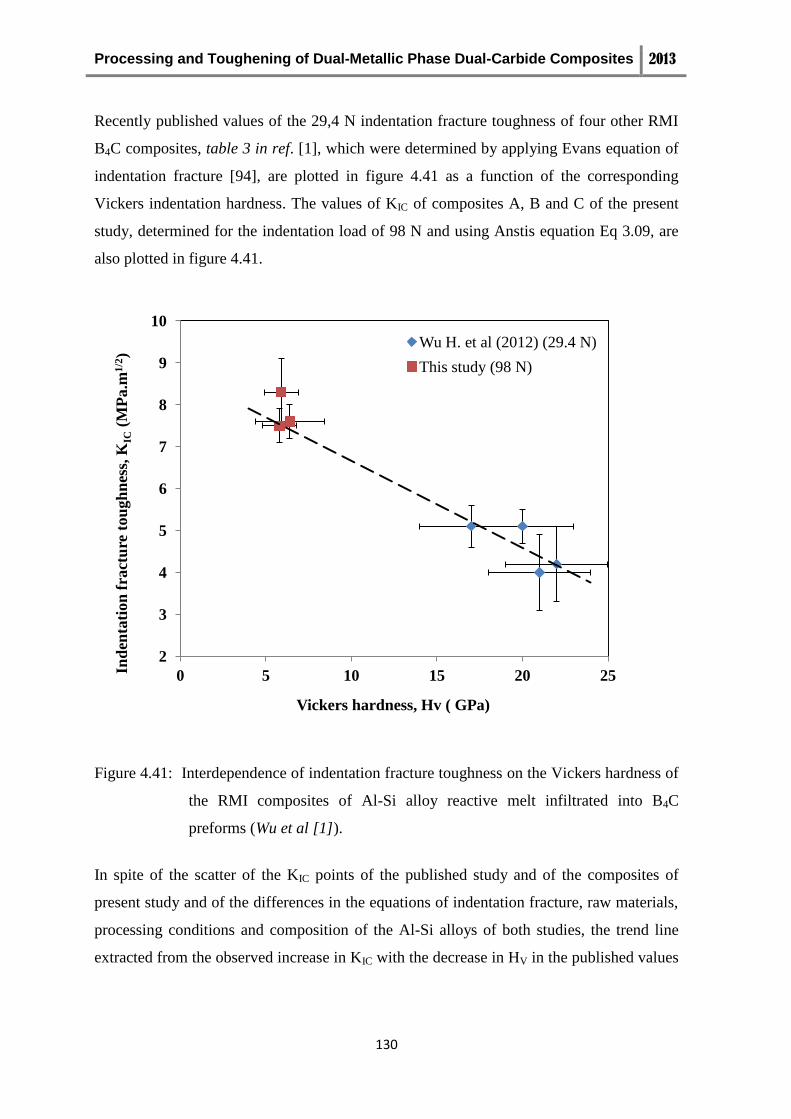
Processing and Toughening of Dual-Metallic Phase Dual-Carbide Composites 2013
130
Recently published values of the 29,4 N indentation fracture toughness of four other RMI
B4C composites, table 3 in ref. [1], which were determined by applying Evans equation of
indentation fracture [94], are plotted in figure 4.41 as a function of the corresponding
Vickers indentation hardness. The values of KIC of composites A, B and C of the present
study, determined for the indentation load of 98 N and using Anstis equation Eq 3.09, are
also plotted in figure 4.41.
Figure 4.41: Interdependence of indentation fracture toughness on the Vickers hardness of
the RMI composites of Al-Si alloy reactive melt infiltrated into B4C
preforms (Wu et al [1]).
In spite of the scatter of the KIC points of the published study and of the composites of
present study and of the differences in the equations of indentation fracture, raw materials,
processing conditions and composition of the Al-Si alloys of both studies, the trend line
extracted from the observed increase in KIC with the decrease in HV in the published values
2
3
4
5
6
7
8
9
10
0 5 10 15 20 25 Ind
enta
tion
fra
ctu
re t
ou
gh
nes
s, K
IC (
MP
a.m
1/2
)
Vickers hardness, Hv ( GPa)
Wu H. et al (2012) (29.4 N)
This study (98 N)
Processing and Toughening of Dual-Metallic Phase Dual-Carbide Composites 2013
131
of Wu et al [1], meets the points of the present study when extrapolated to the
corresponding range of values of HV of the composites A to C.
The Si content of the Al-Si alloy used for the reactive melt infiltration of B4C preforms
plays an important role both in setting the hardness as well the fracture toughness of the
RMI composites of the B4C-SiC ceramic matrix. It is beyond the objectives of this study to
solve the intricate complexity of the toughening mechanisms active in these composites.
Anyhow, as incipiently discussed above in this section, the crack path is not blocked by the
presence of Si which has fragile fracture and seemingly is the mechanically weakest phase
of the composites. Al does not bind with equally strength to the different phases of the
composite [1]. If the Si content increases, there is a more complex network of continuous
breaking and bridging points which tend to divert the propagating cracks. At the same time
it is anticipated that if the Si content exceeds a certain level the KIC will decrease by further
increasing Si content while Si will positively contribute to increase in hardness as shown in
figure 4.36.

Processing and Toughening of Dual-Metallic Phase Dual-Carbide Composites 2013
132
உऔऔ ंश्री गुरवे सरणं
Processing and Toughening of Dual-Metallic Phase Dual-Carbide Composites 2013
133
5.0 CONCLUSIONS
Several batches of the Al-Si alloy were prepared by smelting in a graphite furnace in two
nominal concentrations of 25 wt% Si and 35% wt Si. In order to improve the homogeneity
of the final alloy twice smelting of two batches was also done. A 10 m B4C powder with
carbon (graphite) as impurity was used in this study. Porous preforms the 10 m B4C with
52-55 % relative density prepared by uniaxial pressing followed by cold isostatic were
pressure-less melt infiltrated by hypereutectic Al-Si alloys in argon atmosphere. The
analysis of the results of the reactive melt infiltration of as pressed B4C preforms by the
Al-Si hypereutectic alloys leads to the following conclusions:
1) Complete infiltration of B4C cylindrical preforms of 7.5 mm height was feasible in
short cycles of heating at 20 ºC/min with isothermal holds for 5 minutes at the
maximum temperature of melt infiltration of 1300 ºC as well of 1200 ºC, but not
when maximum temperature is limited to 1100 ºC.
2) During the melt infiltration process a few preforms presented partial infiltration of
their volumes or did not infiltrate at all due to poor wetting or oxidation problems
related with the presence of oxygen containing gaseous species in the atmosphere
of the furnace. Repeated argon flushing of the furnace atmosphere prior to the
infiltration runs improved the stability of infiltration.
3) The analysis by a quantitative X-ray diffraction method yielded a concentration of
8 wt% of carbon determined as graphite in the 10 m B4C powder. No graphite is
detected by XRD in the phase composition of the reactive melt infiltrated
composites in the three areas analysed along the longitudinal cross-sections of
composites in the downward direction of infiltration, at the top, middle and at the
end, near the bottom face of the pellet.
4) Sound composites which were produced from different combinations of the Al-Si
alloy and different smelting processes and infiltration conditions possessed
measured densities of 2.53-2.55 g/cm3, corresponding to values of the relative
density close to 99%; and they were used in the investigation of the structure and
mechanical properties.
Processing and Toughening of Dual-Metallic Phase Dual-Carbide Composites 2013
134
5) The considerable amount of residual free carbon in B4C powder influenced the
phase composition as it was converted mostly to SiC which was heterogeneously
nucleated on the surfaces of the B4C particles as revealed by SEM microscopy
coupled to EDS mapping of the elements.
6) The volume fraction of the SiC phase was evaluated by XRD analysis with
standards as 3.3 vol% to 5.2 vol% in composites made of dual carbide phases of
B4C and SiC and dual metallic phases of Al and Si.
7) Traces of ternary B-Al-C compounds and a minor fraction fragile Al4C3 carbide
were detected by XRD in the composite that was melt infiltrated at 1300 ºC with
the Al-Si alloy of 25 wt% Si nominal composition from single smelting, but these
compounds could not be found in the composite produced under equal conditions
from the alloy with 35 wt% Si nominal composition, or form a twice smelted alloy
of 25 wt % Si nominal composition in a composite melt infiltrated at 1200 ºC
maximum temperature.
8) The evaluation of the structural evolution and phase composition of the composites
by quantitative XRD analysis with standards and SEM/EDS showed that the Al
metallic phase is present in the composites with the highest volume fraction at 44
vol% to 55 vol%, in a balance with the B4C phase in the range of 29 vol% to 33
vol% and the metallic Si phase in the range of 13 vol% to 19 vol%, the highest Al
content in the composites being correlated to the lowest Si concentration of the Al-
Si alloy used to prepare the corresponding composite.
9) The projections of the reaction paths in the Al-Si-B4C ternary phase diagram from
top to bottom of the pellets along the infiltration direction show that the volume
fraction of B4C at the middle area can be significantly distinct from the
corresponding values at areas close to the top or bottom faces of the composite, the
change in the B4C fraction being primarily balanced by the Al phase.
10) Plotting of the average composition of the composites in Al-Si-B4C ternary and Al-
Si-B-C quaternary phase diagrams indicates that the composition of the two
composites from reactive melt infiltration at 1300 ºC is closer to each other than to

Processing and Toughening of Dual-Metallic Phase Dual-Carbide Composites 2013
135
that of the composite made of the twice smelted Al-Si and infiltrated temperature at
1200 ºC maximum temperature, all composites displaying Si content in the molten
Al-Si alloy above threshold of 12.6 wt% Si needed to inhibit the precipitation of the
Al4C3 phase.
As for the structural characterization for the investigation of the mechanical behaviour as
determined by the Vickers indentation hardness and fracture toughness each composite
was divided into the same three zones as above (top, middle and bottom with respect to the
infiltration direction). The hardness was evaluated as the microhardness and
marcohardness with applied loads of 9.8 N, 98 N and 294 N. The following conclusions
were established in the study of the mechanical behaviour of the reactive melt infiltrate
B4C composites:
1) The dependences of the values of HV of all three composites on the applied loads
display a strong indentation size effect of this property, the measured values of
hardness being almost linearly correlated to the applied load with a decrease from
HV1 in the rage of 7.2 - 8.0 GPa to HV30 at 3.7 - 4.7 GPa.
2) Comparison of the values HV of the present study, interpolated to 29.4 N load, with
recently published values of the same property measured on similar reactive melt
infiltrated B4C composites prepared with Al-Si alloys of different Si contents
indicates that both sets of HV data are generally correlated to the Si content of the
Al-Si alloy used for reactive melt infiltration of pressed preforms of B4C, such
correlation reflecting in indirect way the effect of the Al volume fraction in the
structure of the composites because it is the softest phase, with ≈ 0.17 GPa, 50
times lower than hardness of Si itself.
3) Due to complex structure of these composites some corners of the indentations do
not form any linear cracks of the radial type, the neighbour particles simply break
in several directions with grain dislodging and microcracking due to the brittleness
of Si and ceramic particles, whereas at other corners the plastically deforming (Al)
metallic particles dominate and hindered the nucleation of flaws or larger cracks at
the site. On the overall, nearly 1/4 of the corners of the indentation marks do not
have any radial cracks or crack branching on edges at 98N Load.

Processing and Toughening of Dual-Metallic Phase Dual-Carbide Composites 2013
136
4) No measurable indentation cracks formed in the 9.8 N tests due high toughness of
the composites, while at the highest applied load of 294 N indentation impressions
developed such complex damage patterns that no definitive cracks propagating
from the indentation corners could ultimately be identified. In all the three
composites, lateral cracks emanating from the indentation sides are very common
irrespective of the composites.
5) In the present study, only at the indentation loads of 98 N was possible to find
approximate values of toughness of the composites from indentation fracture
results, KIC being in the range 7.6 – 8.3 MPam1/2
but with large scatter. Analogous
difficulties in determining the values KIC of reactive melt infiltrate composites
prepared with 36 wt% Si alloy at HV3 (29.4 N) indentation fracture results were
recently reported.
6) It was found, in spite of the scatter of the KIC values, that the high values
indentation toughness of KIC of the composites in the present study are correlated to
the comparatively low values of Vickers hardness in the same way as observed in
similar reactive melt infiltrated B4C composites prepared with Al-Si alloys of high
Si content reported in the literature.
The Si content of the Al-Si alloy plays an important role both in setting the hardness as
well the fracture toughness of reactive melt infiltrated composites of the B4C-SiC ceramic
matrix. Along with transgranular and intergranular fracture modes, crack branching of
main cracks in sensible level of about 60% of the radial cracks was found. Though
transgranular cleavage of Si and carbides is generally found the intergranular and
interphase boundary fracture is rather more extensive than transgranular fracture. But,
other mechanisms of mechanical energy dissipation, namely growth of lateral cracks,
microcracking and bridging by Al ligaments in the crack wake zone would also add to
fracture energy and the effective fracture toughness of the composites. When concerning
the three composites, the two composites melt infiltrated to 1300 ºC provided similar
mechanical performance except in fracture of toughness because of different composition
of the alloy used for infiltration. The other composite of melt infiltration at 1200 ºC
presents wider variation of the mechanical parameters.
Processing and Toughening of Dual-Metallic Phase Dual-Carbide Composites 2013
137
The present study planned under the assumption that in order to obtain a tougher composite
the metallic Si content in reactive melt infiltrated composites made from B4C preforms
should be kept to a minimum favouring the maximum volume fraction of tough metallic
Al, extended to the low Si and low hardness side the main findings of the recently
published similar work on the same type of composites, but here with shorter infiltration
time and higher fracture toughness at the expense of lower hardness. From the outcomes of
this study and previous published works some suggestions for continuation of the works
can be done:
a) In the attempted to avoid the expensive step of pre-sintering of B4C preforms,
optimization of the green density of preforms for reactive melts infiltration is
needed as a way to obtain higher hardness of the composites in simultaneous with
the minimum safe content of Si in the alloy. Such would imply optimization of the
particle size distribution and more efficient forming techniques.
b) Fine pore sizes of the B4C form the use of powders of finer particle sizes would
imply a reduction in the scale of the Si inclusions of the finished composites and
large concentration of Al inclusions of smaller sizes bridging the crack wakes, a
condition for improved toughness;
c) Faster cooling rates in the final step of the reactive melt infiltration and post-
annealing below the eutectic point may lead to refined dendrite sizes and improved
ductility of the Al ligaments;
d) The use of wetting dopants in the formulation of the Al-Si alloy may improve the
regularity of the infiltration dynamics and decrease sensitivity of the process
towards the oxygen contamination in the furnace atmosphere.

Processing and Toughening of Dual-Metallic Phase Dual-Carbide Composites 2013
138
உऔऔ ंश्री गुरवे सरणं
Processing and Toughening of Dual-Metallic Phase Dual-Carbide Composites 2013
139
BIBLIOGRAPHY
1. Wu, Hongyan, Sengcai Zhang, Mingxia Gao, Dan Zhu, Yi Pan, Yongfeng Liu,
Hongge Pan, Filipe J. Oliveira, Joaquim M. Vieira, Microstructure and mechanical
properties of multi-carbides/(Al, Si) composites derived from porous B4C preforms
by reactive melt infiltration. Materials Science and Engineering, 2012. A 551: p.
200-208.
2. Thevenot, F., Boron Carbide A Comprehensive Review. Journal of the European
Ceramic Society, 1990. 6: p. 205-225.
3. Morosin, B., Kwei G.H., Lawson A.C., Aselage T.L., Emin D., Neutron powder
diffraction refinement of boron carbides Nature of intericosahedral chains. Journal
of Alloys and Compounds, 1995. 226: p. 121-125.
4. Shibo, L., Guangwu, W., Yong, G., Baosheng, Z., The Crystal Structure of Boron
Carbide. Journal of Harbin University of Civil Engineering and Architecture, 1998.
31(4): p. 61-65.
5. Lukas, H.L., In Constitution of Ternary Alloys 3. Ed. G.A.E. Petzow, G.1990,
Weinheim: VCH. 140-146.
6. Schwetz, K.A., Karduc, P., Investigations in the boron-carbon system with the aid
of electron probe microanalysis. Journal of The Less-Common Metals, 1991.
175(1): p. 1-11.
7. Elliott, R.P., Constitution of Binary Alloys, First Supplement. 1965, New York:
McGraw-Hill.
8. Halverson D.C., Pysik,.A.J., Akzay, I.A., Processing of Boron Carbide Aluminum
Composites. Journal of American Ceramic Society, 1989. 72(5): p. 775-780.
9. Frantsevich, I.N., Voronov, F. F., and Bokuta, S.A., Elastic Constants and Elastic
Moduli of Metals and Insulators: Handbook, ed. I. N. Frantsevich (Naukova
Dumka, Kiev, 1982), pp. 60–180.
Processing and Toughening of Dual-Metallic Phase Dual-Carbide Composites 2013
140
10. Rey, J. G. M., Ph. Kapsa and J. L. Loubet, Boron carbide coatings : correlation
between mechanical properties and LPCVD parameters values. Journal de
Physique, 1989. 5(5): p. 311-321.
11. Bouchacourt, M., and Thevenot, F., The melting of boron carbide and the
homogeneity range of the boron carbide phase. Journal of the Less Common
Metals, 1979. 67: p. 327.
12. Telle, R., Sigl, L.S., and K. Takagi, Boride based hard materials. Handbook of
Ceramic Hard Materials, ed. R. Reidel. Vol. 2. 2000, Weinheim: Wiley-VCH. p.
802-945.
13. Evans, A.G., Cannon, R.M., Toughening of Brittle Solids by Martesitic
Transformations. Acta Metall, 1986. 34: p. 761-800.
14. Larker, H. T., Hermansson, L., Adelborn, J., Hot isostatic pressing and its
applicability to silicon carbide and boron carbide. Industrial Ceramics 1988. 8(1):
p. 17-20.
15. Kolsky, H. The role of stress waves in penetration processes. in Ballistic materials
and penetration mechanics. ed. Labile R.C., Elsevier: New York; 1980. p. 185–223.
16. Wilkins, M.L., Computer simulation of penetration phenomenon, in Ballistic
materials and penetration mechanics. ed. Labile R.C., Elsevier: New York; 1980. p.
225-252.
17. Telle, R., Structure and Properties of Si-Doped Boron Carbide. in The Physics and
Chemistry of Carbides. Nitrides, and Borides. ed. R. Freer, NATO AS1 SERIES E,
Kluwer. Vol. 185. 1990, Dordrecht, The Netherlands. p. 249-258.
18. Litz, L. M., Mercuri, R.A., Oxidation of Boron Carbide by Air, Water, and Air-
Water Mixtures at Elevated Temperatures. Journal of Electrochemical Society,
1963. 110(8): p. 921-925.
Processing and Toughening of Dual-Metallic Phase Dual-Carbide Composites 2013
141
19. Matje, P., Schwetz, K. A., Surface oxygen pick-up in submicron SiC and B4C
sintering powders and room temperature. In Proceedings of the Second
International conference: on Ceramic Powder Processing Science,, H. Hausner,
Messing, G. L., and Hirano, S., Editor 1989, Deutsche Keramische Gesellschaft:
Koln. p. 377-384.
20. Heuberger, M., Telle, R., Petzow, G., Modification of Ceramic Powders by Ion
Beam Treatment. Powder Metallurgy, 1992. 35(2): p. 125-132.
21. Lebedev, A. .A., Heterojunctions and super lattices based on silicon carbide, in
Semiconductor Science and Technology 2006, Institute of Physics Publishing. p.
R17–R34.
22. Yamada, K., Mohri, M., Properties and Applications of Silicon Carbide Ceramics,
in Silicon Carbite Ceramics. S. Somiya, Y. Inomata (Ed.), Ceramic Research and
Development in Japan Series, Vol. 1. 1991, Essex: Elsevier Science Pub. Ltd. p.
13-44.
23. Verma, A.R., Krishna, P., Polymorphism and Polytypism in Crystals. 1966, John
Wiley & Sons Inc.
24. Kordina, O., Growth and Characterisation of Silicon Carbide Power Device
Material, in Science and Technology. Vol. 352 Linköping studies in science and
technology: Dissertations, Linköping University, 1994 (140 pages)
25. Heinz K Henisch; R Roy, Silicon Carbide - 1968, Proceedings of the International
Conference on Silicon Carbide, University Park, Pa., October 20-23, 1968.
Materials research bulletin, special issue. Ed. Heinz K. Henisch, R. Roy. Pergamon
Press, 1969 (372 pages)
26. Ching, W. Y., Xu, Y. N., P. Rulis, L.Z. Ouyang,, The Eletronic Structure and
Spectroscopic properties of 3C, 2H, 4H, 6H, 15R and 21R polymorphs of SiC.
Materials Science and Engineering A 2006 422(1-2): p. 147-156.
Processing and Toughening of Dual-Metallic Phase Dual-Carbide Composites 2013
142
27. Schwetz, K.A., Silicon carbide based hard materials. Handbook of ceramic hard
materials, ed. R. Reidel. Vol. 2. 2000, Weinheim: WILEY-VCH GmpH. p. 683–
748
28. Adamsky, R.F., Merz, K. M., Synthesis and crystallography of the wurtzite form of
silicon carbide. Zeitschrift für Kristallographie 1959. 111(1-6): p. 350-361.
29. Krishna, P., Marshall, R.C, Direct transformation from the 2H to the 6H structure
in single-crystal silicon carbide. Journal of Crystal Growth, 1971. 11(2): p. 147-
150.
30. Inomata, Y., Inoue, Z., M. Mitomo, and H. Suzuki, Relation between the growth
temperature and the structure of silicon carbide crystals grown by the sublimation
method. Yogyo-kyokai-Shi, 1968. 76: p. 313-319.
31. Munch, W. V., Silicon carbide, Landolt-Bornstein: Numerical Data and Functional
Relationships in Science and Technology, New Series, group III, vol. 17c, M.
Schultz, O. Madelung, and H. Weiss, Eds. Berlin, Germany: Springer-Verlag,
1984.
32. Kleykamp, H. and Schumacher, G., The constitution of the silicon-carbon system.
Reports of the Bunsen Society for Physical Chemistry, 1993. 97: p. 799-805.
33. Frisch, B., Thiele, W.R., Drumm, R. and Münnich, B., On the Oxidation
Mechanisms of Silicon Carbide in the 300 to 1300°C Temperature Range,CFI/Ber.
Dtsch. Keram. Ges, 1988. 65: p. 277-284.
34. Shaffer, P.T.B., SiC Wishkers - Part II. Ceramic Age, 1966. 82: p. 42-44.
35. Fickel, A., SiC Materials. Refractory Materials - Pocket Manual, ed. G.
Routschka1997, Essen: Vulkan Verlag. 74-80.
Processing and Toughening of Dual-Metallic Phase Dual-Carbide Composites 2013
143
36. Wu, Hongyan, MingXia Gao, Dan Zhu, Shengcai Zhang, Yi Pan, Hongge Pan,
Yongfeng Liu, Filipe J. Oliveira, Joaquim M. Vieira, SiC whisker reinforced multi-
carbides composites prepared from B4C and pyrolyzed rice husks via reactive
infiltration. Ceramics International, 2012. 38: p. 3519–3527.
37. Gupta, M.. Ling, S., Microstructure and mechanical properties of hypo/ hyper-
eutectic Al–Si alloys synthesized using a near-net shape forming technique. Journal
of Alloys and Compounds, 1999. 287: p. 287 - 294.
38. Nikanorov, S.P., Volkov, M.P., V.N. Gurin, Yu.A. Burenkov, L.I. Derkachenko,
B.K. Kardashev, L.L. Regel, W.R. Wilcox, Structural and mechanical properties of
Al–Si alloys obtained by fast cooling of a levitated melt. Materials Science and
Engineering, 2005. A 390 p. 63–69.
39. Richard, M., J.C. Mercier, J. C. and Jacob, S., Fractography of the Aluminum
Casting Alloys. Fonderie Fondeur d'Aujourd'hui, 1984. 36: p. 13-19.
40. Warmuzek, M., Aluminum-Silicon Casting Alloys : Atlas of Microfractographs
2004, United States of America: ASM International
41. Askeland, D.R., The Science and Engineering of Materials, 2d edition, Boston,
1989: PWS-Kent Publishing Co., p. 245-247
42. Lu, S. Z., Hellawell, A., Modification of Al-Si Alloys: Microstructure, Thermal
Analysis and Mechanics. Journal of Materials, 1995. 47(2): p. 38 - 40.
43. Davis, J. R., Aluminum and AluminFum Alloys. ASM Specialty Handbook:, ed.
A.I.H.C. J.R. Davis & Associates1993: ASM International. 784.
44. Stroganov, G.B., V.A. Rotenberg, G.B. Gershman, Aluminum–Silicon Alloys.
Metallurgiya 1977, Moscow.
45. Hillig, W. B., Melt infiltration approach to ceramic matrix composites. Journal of
the American Ceramic Society, 1988. 71(2): p. C-96-C-99.
Processing and Toughening of Dual-Metallic Phase Dual-Carbide Composites 2013
144
46. Toy, C. and Scott, W., Ceramic-Metal composite produced by melt infiltration.
Journal of the American Ceramic Society, 1990. 73(1): p. 97-101.
47. Chadam, D.H. J., E. Merino, P. Ortoleva, A. Sen, Reactive Infiltration Instabilities.
Journal of Applied Mathematics, 1986. 36: p. 207-221.
48. Pan, Y., and Sun, K., Preparation of TiC/Ni3Al composites by upward melt
infiltration. Journal of Materials Science and Technology, 2000. 16(4): p. 387-392.
49. Hayun, S., A. Weizmann, H. Dilman, M. P. Dariel, and N. Frage. Rim region
growth and its composition in reaction bonded boron carbide composites with
core-rim structure. in 16th International Symposium on Boron, Borides and
Related Materials. IOP Journal of Physics: Conference Series 2009. 176: 012009
50. Toptan, F., A. Kilicarslan and I. Kerti, The Effect of Ti Addition on the Properties
of Al-B4C Interface: A Microstructural Study. Materials Science Forum, 2010. 636-
637: p. 192-197.
51. Mortensen, A., Jin, I., Solidification Processing of Metal Matrix Composites.
International Materials Reviews, 1992. 37: p. 101-128.
52. Darcy, H.P.G., Les Fontaines Publiques de la Ville de Dijon, Victor Dalmont,
Paris,1856, in The Flow of Homogeneous Fluids through Porous Media, M.
Muskat, Editor 1937, McGraw-Hill: New York. p. 653.
53. Carman, P.C., Capillary rise and capillary movement of moisture in fine sands. Soil
Science, 1941. 52: p. 1-14.
54. Morrow, N., Physics and thermodynamics of capillary action in porous media.
Industrial and Engineering Chemistry, 1970. 62: p. 32–56.
55. Li, J.-G., Wetting of Ceramic Materials by Liquid Silicon, Aluminium and Metallic
Melts Containing Titanium and Other Reactive Elements: A Review. Ceramics
International 1994. 20: p. 391-412.
Processing and Toughening of Dual-Metallic Phase Dual-Carbide Composites 2013
145
56. Young, T., A Essay on the cohesion of fIuids. Philosophical Transactions of the
Royal Society, 1805. 95: p. 65-87.
57. ’Souzae, J. . Pharmaceutical powder material contains void volume of empty
space, distributed within the solid mass in the form of pores, cavities, and cracks of
various shapes and sizes. Mercury Intrusion Porosimetry : A Tool for
Pharmaceutical Particle Characterization, 2008. 6.
58. Gibbs, J.W., The Collected Works of J. Willard Gibbs. Thermodynamics. Vol. I.
1928, New Haven: Yale University Press.
59. Batchelor, G. K., An Introduction to Fluid Dynamics.1967, New York: Cambridge
University Press. 615.
60. Gibbs, J.W., The Collected Works of J. Willard Gibbs Thermodynamics. Vol. I.
1928, New Haven: Yale Universlty Press.
61. Dunstan, D., White, L.R., A Capillary Pressure Method for Measurement of
Contact Angles in Powders and Porous Media. Journal of Colloid and Interface
Science, 1986. 111(1): p. 60-64.
62. Colin, C., Marchal, Y., F. Boland, and F. Delannay, Stainless steel fibres
reinforced aluminium matrix composites processed by squeeze casting: relationship
between processing conditions and interface microstructure. Journal de Physique
IV, 1993. 3: p. 1749-1752.
63. Fukunaga, H., X. Wang, and Y. Aramaki, Preparation of Intermetallic Compound
Matrix Composites By Reaction Squeeze Casting. Journal of Materials Science
Letters, 1990. 9: p. 23-25.
64. Pastukhov, E.A., V.P. Chentsov, A.V. Kiselev, L.E. Bodrova, A.V. Dolmatov, E.A.
Popova, S.A. Petrova, R.G. Zacharov Wetting of Graphite Surface by the
Aluminium Alloys Melts. 2006. p. 1-178 - 1-181.
Processing and Toughening of Dual-Metallic Phase Dual-Carbide Composites 2013
146
65. Li, J.G., Hausner, H., Wetting and adhesion in liquid silicon/ceramic systems.
Materials Letters, 1992. 14: p. 329-332.
66. Bergeron, C. G. and Risbud, S.H., Introduction to Phase Equilibria in Ceramics.
The American Ceramic Society 1984, Ohio.
67. Grytsiv, A. and Rogl, P.,, Aluminium-Boron-Carbon. Vol. IV. MSIT Landolt-
Börnstein New Series. 2004. 11A1: p. 29-51.
68. Lim, S.-K., Lukas, H. L., Thermodynamische Optimierung des Systems B-C-Si und
seiner Randsysteme, in Hochleistungskeramiken - Herstellung, Aufbau,
Eigenschaften. ed. G. Petzow, J. Tobolski, and R. Telle, ed., Deutsche
Forschungsgemeinschaft 1996, Verlag Chemie, Weinheim: VCH. p. 606-616.
69. Kieffer, R., Gugel, E., Leimer, G., Ettmayer, P., Investigations on the system
boron-carbon-silicon. Beritch der Deutschen Keramischen Gesellschaft, 1972.
49(2): p. 44.
70. Werheit, H., Kuhlmann, U., Laux, M., Telle, R., Solid solutions of silicon in boron-
carbide-type crystals. Journal of Alloys and Compounds 1994. 209: p. 181.
71. Smith, R.L. and Sandland, G.E., An Accurate Method of Determining the Hardness
of Metals, with Particular Reference to Those of a High Degree of Hardness.
Proceedings of the Institution of Mechanical Engineers. London, IMechE. 1922. I:
p. 623–641.
72. Anstis, G.R., Chantikul, P., Lawn, B.R., Marshall, D.B., 1981. A critical evaluation
of indentation techniques for measuring fracture toughness. I. Direct crack
measurements. Journal of the American Ceramic Society, 1981. 64 (9): p. 533–538.
73. Schwetz, K.A., Sigl, L. S., and Pfau, L. J. , Mechanical properties of injection
molded B4C-C ceramics. Journal of Solid State Chemistry 1997. 133 (1): p. 68-76.

Processing and Toughening of Dual-Metallic Phase Dual-Carbide Composites 2013
147
74. Telle, R., Oxidation behavior of B4C-SiC composites with various microstructures
Proceedings of 10th International Symposium on Boron, Borides and Related
Compounds, Ed. D. Emin, Aselage, T. L., Switendick, A. C, Morosin, B., and
Beekel, C. L, New York. Boron Rich Solids, AIP Conference Proceedings 1991.
231: p. 553-560.
75. Burminskaya, L. N., V.V. Zaboleev-Zotov,, Yu. M. Nikulin, and P. O. Pashkov,
Strength of two-phase aluminum-base mixtures. Translated from Metallovedenie i
Termicheskaya Obrabotka Metallov, 1967. No. 6, p. 27-30.
76. Frage, N., L.Levin, N. Frumin, M. Gelbstein, M.P. Dariel, Manufacturing B4C–
(Al,Si) composite materials by metal alloy infiltration. Journal of Materials
Processing Technology, 2003. 143-144: p. 486–490.
77. Panasyuk, A.D., V.D. Oreshkin., V. R. Maslennikova, Kinetics of the reactions of
boron carbide with liquid aluminium, silicon, nickel and iron. Translated from
Poroshkovaya Metallurgica 1979. Nº 7 (199): p. 79-83.
78. Ribes, H., Dasilva, R., Suery, M. and Bretau, Effect of interfacial oxide layer in
aluminium–silicon carbide particle composites on bond strength and mechanical
behavior Material Science Technology, 1990. 6: p. 621–628.
79. Assael M.J., K. Kakosimos, Bannish R. M., Brillo J., Egry I., Brooks R., Quested
P.N., Mills K.C., Nagashima A., Sato Y., and Wakeham W.A, Reference Data for
the Density and Viscosity of Liquid Aluminium and Liquid Iron. Journal of Physical
and Chemical Reference Data, 2006. 35: p. 285-300.
80. Xie SS, S.L., Guo J, Vasylkiv O, Borodianska H, Xi Z, Krishnan GM, Su H, Tokl
AI, Non-catalytic facile synthesis of superhard phase of boron carbide (B13C2)
nanoflakes and nanoparticles. Journal of Nanoscience and Nanotechnology, 2012.
12(1): p. 596-603.
Processing and Toughening of Dual-Metallic Phase Dual-Carbide Composites 2013
148
81. Viala, J.C, Fortier, P., Bouix, J., Stable and metastable phase equilibria in the
chemical interaction between aluminium and silicon carbide. Journal Material
Science, 1990. 25(3): p. 1842 -1850.
82. Birru, A.K., Karunakar, D.B., Mahapatra, M.M., Fluidity of A713 Cast Alloy with
and without Scrap Addition using Double Spiral Fluidity Test: A Comparison.
World Academy of Science, Engineering and Technology 2012. 61: p. 474 – 478.
83. Hayun, S., H. Dilman, M. P. Dariel, and N. Frage The effect of aluminum on the
microstructure and phase composition of boron carbide infiltrated with silicon.
Materials Chemistry and Physics, 2009. 118: p. 490–495
84. Grytsiv, A., and Rogl, P., Al-B-C (Aluminium - Boron - Carbon). ed. G. Effenberg,
Ilyenko, S. . Vol. IV 11A: Light Metal Systems. Part 1. Germany: Springer
Materials - The Landolt-Börnstein Database. p. 29–51.
85. Raghavan, V., Al-B-Si (Aluminum-Boron-Silicon). Journal of Phase Equilibria and
Diffusion 2008. 29(1): p. 44–45.
86. Kohler, W., Untersuchungen zur Benetzung von Al2O3-und SiC-Kristallen durch
Aluminium und Aluminiumlegierungen. Aluminium, 1975. 51(7): p. 443–447
87. Dowling, N.E., Mechanical behavior of materials: engineering methods for
deformation, fracture, and fatigue 1993, United States: Prentice-Hall International.
773.
88. Zhao, X. J., Zhang,N., Ru, H. Q., Liang, B., Chen, D.L., Mechanical properties
and toughening mechanisms of silicon carbide nano-particulate reinforced Alon
composites. Materials Science and Engineering, 2012. A 538: p. 118– 124.
89. Chen, D., Sixta, M. E., Zhang X. F., De Jonghe, L. C., Ritchie, R. O., Role of the
grain boundary phase elevated temperature strength, toughness fatigue and creep
resistance of Silicon carbide sintered with Al, B, and C. Acta Materialia, 2000. 48:
p. 4599–4608.
Processing and Toughening of Dual-Metallic Phase Dual-Carbide Composites 2013
149
90. Sorarù, G.D., and Colombo, P., Polymer to Ceramic Transformation: Processing of
Ceramic Bodies and Thin Films. in Handbbook of Ceramic Hard Materials, ed. R.
Riedel. Vol. 2. 2000, Weinheim: Wiley-VCH Verlag GmbH. 446-478.
91. Telle, D.R., Boride - eine neue Hartstoffgeneration? Chemie in unserer Zeit, 1988.
3: p. 93 - 99.
92. Yonezu, A., Xu, B. X., Chen, X., Indentation induced lateral crack in ceramics
with surface hardening. Materials Science and Engineering A, 2009. 507( (1-2)): p.
226-235.
93. Rice, R.W., Mechanisms of Toughening in Ceramic Matrix Composites. Ceramic
Engineering Science Proc, 1981. 2: p. 661-701.
94. Evans, A. G., Fracture toughness: The role of indentation techniques. in:
S.W.reiman (Ed.), Fracture Mechanic Applied to Brittle Materials, ASTM STP
678, part 2, American Society for Testing and Materials, Philadelphia, 1979, pp.
112–135.

Processing and Toughening of Dual-Metallic Phase Dual-Carbide Composites 2013
150

Processing and Toughening of Dual-Metallic Phase Dual-Carbide Composites 2013
151
Annexes

Processing and Toughening of Dual-Metallic Phase Dual-Carbide Composites 2013
152
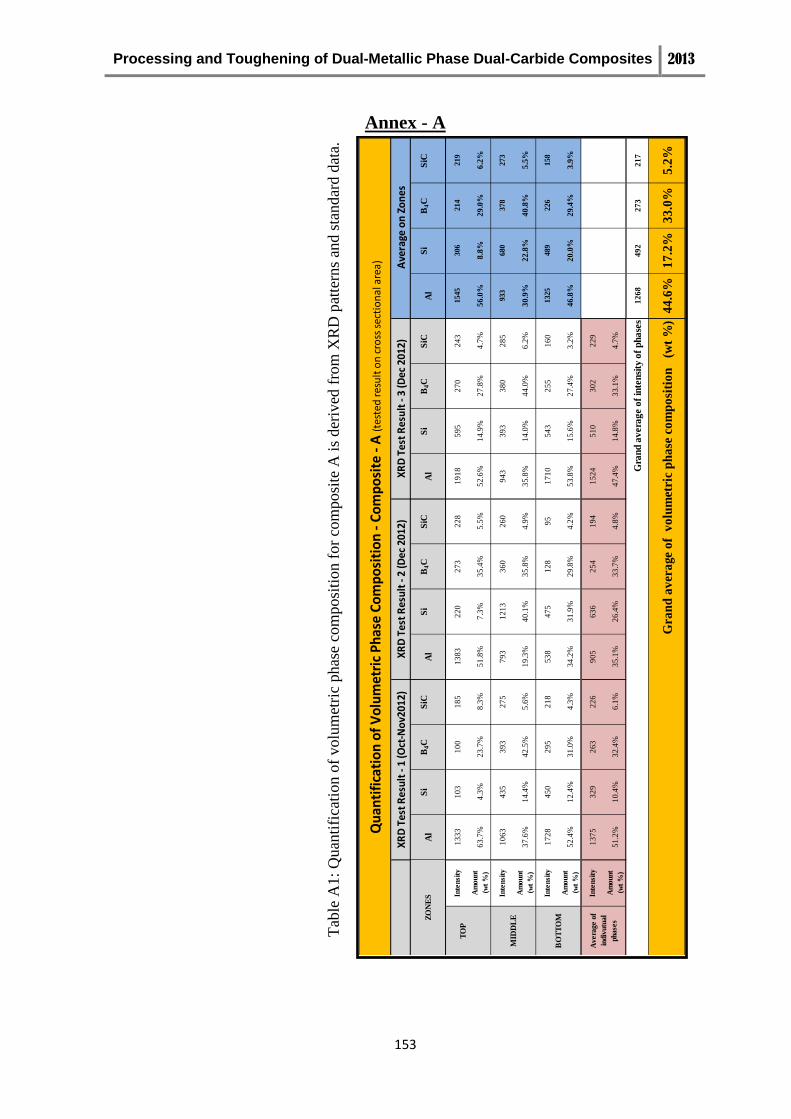
Processing and Toughening of Dual-Metallic Phase Dual-Carbide Composites 2013
153
Annex - A
Al
Si
B4C
S
iC
Al
Si
B4C
S
iC
Al
Si
B4C
S
iC
Al
Si
B4C
S
iC
Inte
nsi
ty1
33
31
03
10
01
85
13
83
22
02
73
22
81
91
85
95
27
02
43
1545
306
214
219
Am
ount
(wt
%)
63
.7%
4.3
%2
3.7
%8
.3%
51
.8%
7.3
%3
5.4
%5
.5%
52
.6%
14
.9%
27
.8%
4.7
%5
6.0
%8
.8%
29
.0%
6.2
%
Inte
nsi
ty1
06
34
35
39
32
75
79
31
21
33
60
26
09
43
39
33
80
28
5933
680
378
273
Am
ount
(wt
%)
37
.6%
14
.4%
42
.5%
5.6
%1
9.3
%4
0.1
%3
5.8
%4
.9%
35
.8%
14
.0%
44
.0%
6.2
%3
0.9
%2
2.8
%4
0.8
%5
.5%
Inte
nsi
ty1
72
84
50
29
52
18
53
84
75
12
89
51
71
05
43
25
51
60
1325
489
226
158
Am
ount
(wt
%)
52
.4%
12
.4%
31
.0%
4.3
%3
4.2
%3
1.9
%2
9.8
%4
.2%
53
.8%
15
.6%
27
.4%
3.2
%4
6.8
%2
0.0
%2
9.4
%3
.9%
Inte
nsi
ty1
37
53
29
26
32
26
90
56
36
25
41
94
15
24
51
03
02
22
9
Am
ount
(wt
%)
51
.2%
10
.4%
32
.4%
6.1
%3
5.1
%2
6.4
%3
3.7
%4
.8%
47
.4%
14
.8%
33
.1%
4.7
%
12
68
49
22
73
21
7
44
.6%
17
.2%
33
.0%
5.2
%
Gra
nd
av
era
ge o
f in
ten
sity
of
ph
ase
s
Qu
anti
fica
tio
n o
f V
olu
met
ric
Ph
ase
Co
mp
osi
tio
n -
Co
mp
osi
te -
A (t
este
d r
esu
lt o
n c
ross
sec
tio
nal
are
a)
XR
D T
est
Res
ult
- 1
(Oct
-No
v201
2)X
RD
Tes
t R
esu
lt -
2 (D
ec 2
012)
XR
D T
est
Res
ult
- 3
(Dec
201
2) A
vera
ge o
n Z
on
es
ZO
NE
S
TO
P
MID
DL
E
BO
TT
OM
Avera
ge o
f
indiv
utu
al
phase
s
Gra
nd
av
era
ge
of
vo
lum
etri
c p
ha
se c
om
po
siti
on
(
wt
%)
Tab
le A
1:
Quan
tifi
cati
on o
f volu
met
ric
phas
e co
mposi
tion f
or
com
posi
te A
is
der
ived
fro
m X
RD
pat
tern
s an
d s
tand
ard d
ata.
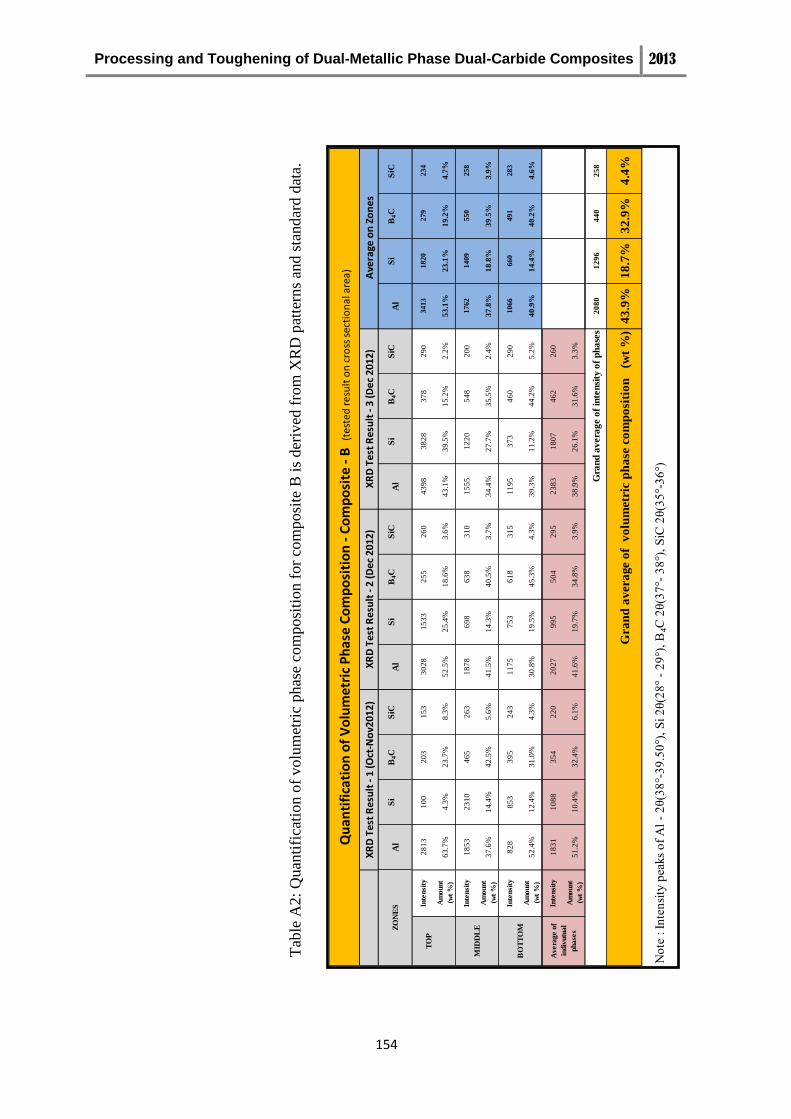
Processing and Toughening of Dual-Metallic Phase Dual-Carbide Composites 2013
154
Al
Si
B4C
S
iC
Al
Si
B4C
S
iC
Al
Si
B4C
S
iC
Al
Si
B4C
S
iC
Inte
nsi
ty2
81
31
00
20
31
53
30
28
15
33
25
52
60
43
98
38
28
37
82
90
3413
1820
279
234
Am
ount
(wt
%)
63
.7%
4.3
%2
3.7
%8
.3%
52
.5%
25
.4%
18
.6%
3.6
%4
3.1
%3
9.5
%1
5.2
%2
.2%
53
.1%
23
.1%
19
.2%
4.7
%
Inte
nsi
ty1
85
32
31
04
65
26
31
87
86
98
63
83
10
15
55
12
20
54
82
00
1762
1409
550
258
Am
ount
(wt
%)
37
.6%
14
.4%
42
.5%
5.6
%4
1.5
%1
4.3
%4
0.5
%3
.7%
34
.4%
27
.7%
35
.5%
2.4
%3
7.8
%1
8.8
%3
9.5
%3
.9%
Inte
nsi
ty8
28
85
33
95
24
31
17
57
53
61
83
15
11
95
37
34
60
29
01066
660
491
283
Am
ount
(wt
%)
52
.4%
12
.4%
31
.0%
4.3
%3
0.8
%1
9.5
%4
5.3
%4
.3%
39
.3%
11
.2%
44
.2%
5.2
%4
0.9
%1
4.4
%4
0.2
%4
.6%
Inte
nsi
ty1
83
11
08
83
54
22
02
02
79
95
50
42
95
23
83
18
07
46
22
60
Am
ount
(wt
%)
51
.2%
10
.4%
32
.4%
6.1
%4
1.6
%1
9.7
%3
4.8
%3
.9%
38
.9%
26
.1%
31
.6%
3.3
%
20
80
12
96
44
02
58
43
.9%
18
.7%
32
.9%
4.4
%
Gra
nd
av
era
ge o
f in
ten
sity
of
ph
ase
s
Qu
anti
fica
tio
n o
f V
olu
met
ric
Ph
ase
Co
mp
osi
tio
n -
Co
mp
osi
te -
B (
test
ed r
esu
lt o
n c
ross
sec
tio
nal
are
a)
XR
D T
est
Res
ult
- 1
(Oct
-No
v201
2)X
RD
Tes
t R
esu
lt -
2 (D
ec 2
012)
XR
D T
est
Res
ult
- 3
(Dec
201
2) A
vera
ge o
n Z
on
es
ZO
NE
S
TO
P
MID
DL
E
BO
TT
OM
Avera
ge o
f
indiv
utu
al
phase
s
Gra
nd
av
era
ge
of
vo
lum
etri
c p
ha
se c
om
po
siti
on
(
wt
%)
Note ntensity peaks of Al - 2 (38°-39.50°), Si 2 (28° - 29°),
4C 2 (37°- 38°), SiC 2 (35°-36°)
Tab
le A
2:
Quan
tifi
cati
on o
f volu
met
ric
phas
e co
mposi
tion f
or
com
posi
te B
is
der
ived
fro
m X
RD
pat
tern
s an
d s
tand
ard d
ata.
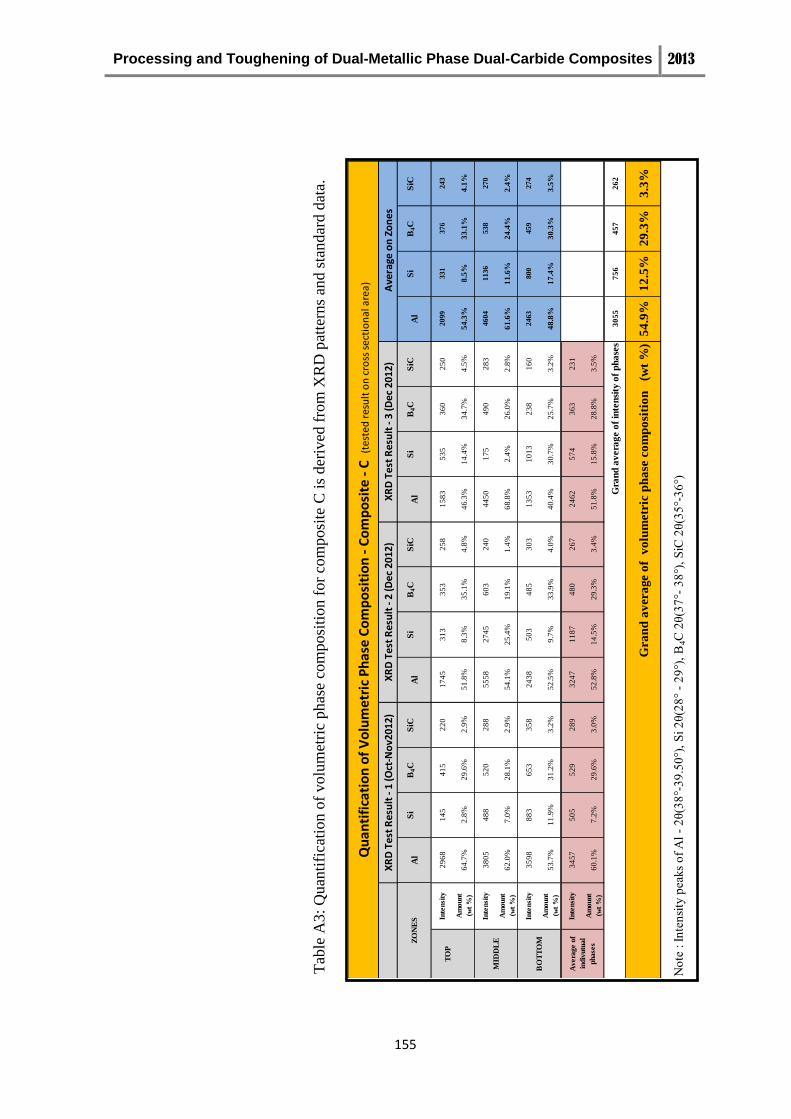
Processing and Toughening of Dual-Metallic Phase Dual-Carbide Composites 2013
155
Al
Si
B4C
S
iC
Al
Si
B4C
S
iC
Al
Si
B4C
S
iC
Al
Si
B4C
S
iC
Inte
nsi
ty2
96
81
45
41
52
20
17
45
31
33
53
25
81
58
35
35
36
02
50
2099
331
376
243
Am
ount
(wt
%)
64
.7%
2.8
%2
9.6
%2
.9%
51
.8%
8.3
%3
5.1
%4
.8%
46
.3%
14
.4%
34
.7%
4.5
%5
4.3
%8
.5%
33
.1%
4.1
%
Inte
nsi
ty3
80
54
88
52
02
88
55
58
27
45
60
32
40
44
50
17
54
90
28
34604
1136
538
270
Am
ount
(wt
%)
62
.0%
7.0
%2
8.1
%2
.9%
54
.1%
25
.4%
19
.1%
1.4
%6
8.8
%2
.4%
26
.0%
2.8
%6
1.6
%1
1.6
%2
4.4
%2
.4%
Inte
nsi
ty3
59
88
83
65
33
58
24
38
50
34
85
30
31
35
31
01
32
38
16
02463
800
459
274
Am
ount
(wt
%)
53
.7%
11
.9%
31
.2%
3.2
%5
2.5
%9
.7%
33
.9%
4.0
%4
0.4
%3
0.7
%2
5.7
%3
.2%
48
.8%
17
.4%
30
.3%
3.5
%
Inte
nsi
ty3
45
75
05
52
92
89
32
47
11
87
48
02
67
24
62
57
43
63
23
1
Am
ount
(wt
%)
60
.1%
7.2
%2
9.6
%3
.0%
52
.8%
14
.5%
29
.3%
3.4
%5
1.8
%1
5.8
%2
8.8
%3
.5%
30
55
75
64
57
26
2
54
.9%
12
.5%
29
.3%
3.3
%
Gra
nd
av
era
ge o
f in
ten
sity
of
ph
ase
s
Qu
anti
fica
tio
n o
f V
olu
met
ric
Ph
ase
Co
mp
osi
tio
n -
Co
mp
osi
te -
C (
test
ed r
esu
lt o
n c
ross
sec
tio
nal
are
a)
XR
D T
est
Res
ult
- 1
(Oct
-No
v201
2)X
RD
Tes
t R
esu
lt -
2 (D
ec 2
012)
XR
D T
est
Res
ult
- 3
(Dec
201
2) A
vera
ge o
n Z
on
es
ZO
NE
S
TO
P
MID
DL
E
BO
TT
OM
Avera
ge o
f
indiv
utu
al
phase
s
Gra
nd
av
era
ge
of
vo
lum
etri
c p
ha
se c
om
po
siti
on
(
wt
%)
Note ntensity peaks of Al - 2 (38°-39.50°), Si 2 (28° - 29°),
4C 2 (37°- 38°), SiC 2 (35°-36°)
Tab
le A
3:
Quan
tifi
cati
on o
f volu
met
ric
phas
e co
mposi
tion f
or
com
posi
te C
is
der
ived
fro
m X
RD
pat
tern
s an
d s
tand
ard d
ata.

Processing and Toughening of Dual-Metallic Phase Dual-Carbide Composites 2013
156
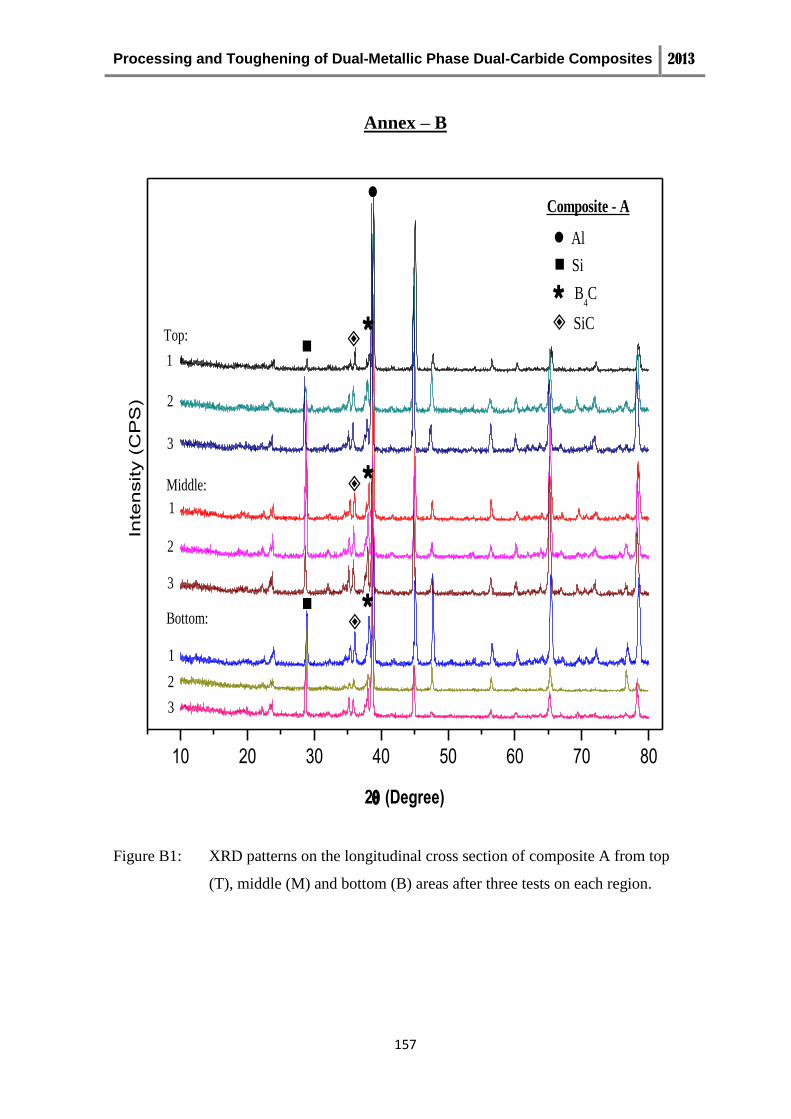
Processing and Toughening of Dual-Metallic Phase Dual-Carbide Composites 2013
157
Annex – B
10 20 30 40 50 60 70 80
Composite - A
B4C
SiC
Si
Al
Top:
Middle:
3
2
Inte
nsity (
CP
S)
2(Degree)
Bottom:
1
1
2
3
1
2
3
Figure B1: XRD patterns on the longitudinal cross section of composite A from top
(T), middle (M) and bottom (B) areas after three tests on each region.
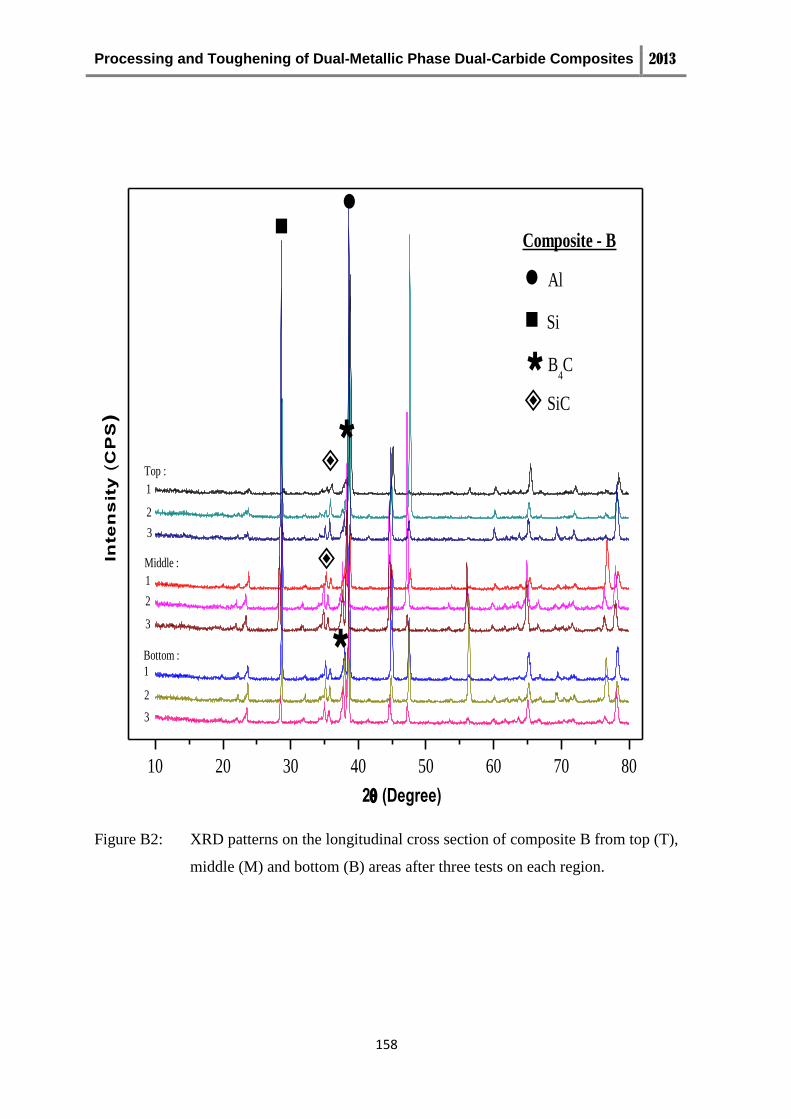
Processing and Toughening of Dual-Metallic Phase Dual-Carbide Composites 2013
158
10 20 30 40 50 60 70 80
Composite - B
B4C
SiC
Si
Al
2
3
1
Top :
Middle :Inte
ns
ity
(C
PS
)
2 (Degree)
Bottom :
1
2
3
1
2
3
Figure B2: XRD patterns on the longitudinal cross section of composite B from top (T),
middle (M) and bottom (B) areas after three tests on each region.
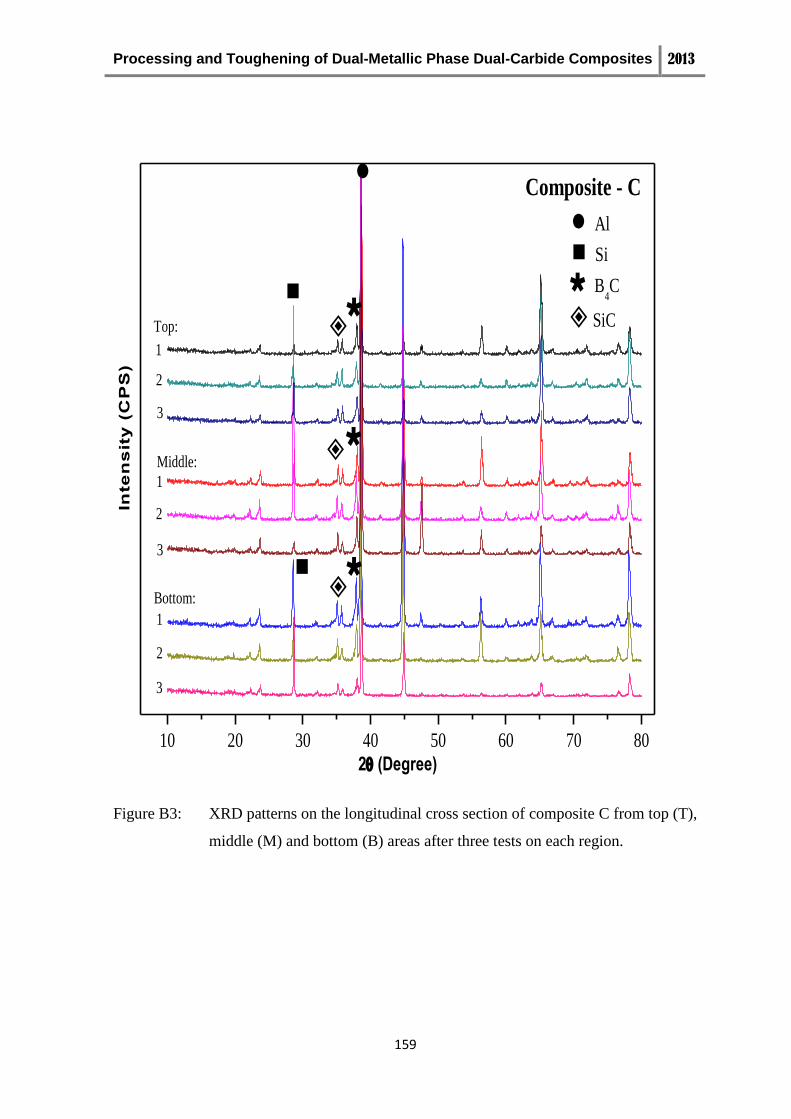
Processing and Toughening of Dual-Metallic Phase Dual-Carbide Composites 2013
159
10 20 30 40 50 60 70 80
Si
B4C
SiC
Al
3
1
2
Top:
Middle:
Inte
ns
ity
(C
PS
)
2(Degree)
Bottom:
1
2
3
1
2
3
Composite - C
Figure B3: XRD patterns on the longitudinal cross section of composite C from top (T),
middle (M) and bottom (B) areas after three tests on each region.

Processing and Toughening of Dual-Metallic Phase Dual-Carbide Composites 2013
160
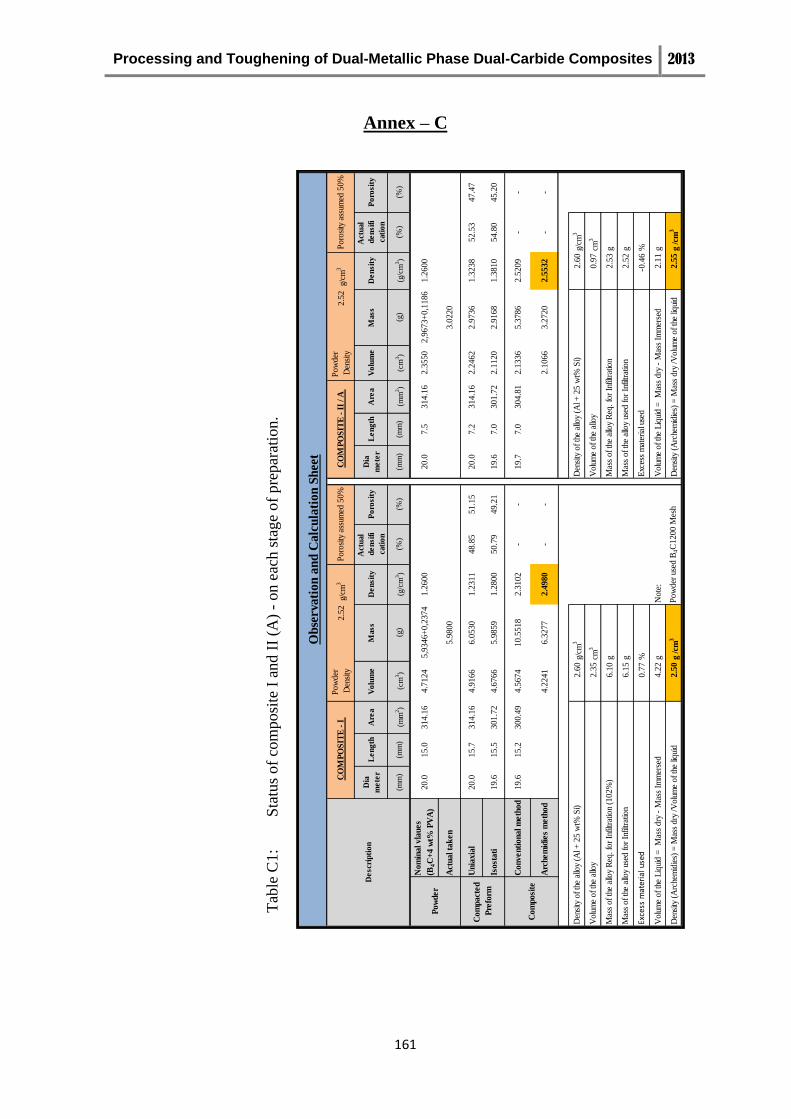
Processing and Toughening of Dual-Metallic Phase Dual-Carbide Composites 2013
161
Annex – C
Po
wd
er
Den
sity
2.5
2 g
/cm
3P
ow
der
Den
sity
2.5
2 g
/cm
3
Dia
me
ter
Le
ng
thA
rea
Vo
lum
eM
ass
De
nsi
ty
Act
ual
de
nsi
fi
cati
on
Po
rosi
tyD
ia
me
ter
Le
ng
thA
rea
Vo
lum
eM
ass
De
nsi
ty
Act
ual
de
nsi
fi
cati
on
Po
rosi
ty
(mm
)(m
m)
(mm
2)
(cm
3)
(g)
(g/c
m3)
(%)
(%)
(mm
)(m
m)
(mm
2)
(cm
3)
(g)
(g/c
m3)
(%)
(%)
No
min
al v
laues
(B4C
+4
wt%
PV
A)
20.0
15.0
314.1
64.7
124
5,9
34
6+
0,2
37
41.2
600
20.0
7.5
314.1
62.3
550
2,9
67
3+
0,1
18
61.2
600
Act
ua
l ta
ken
5.9
800
3.0
220
Unia
xia
l20.0
15.7
314.1
64.9
166
6.0
530
1.2
311
48.8
551.1
520.0
7.2
314.1
62.2
462
2.9
736
1.3
238
52.5
347.4
7
Iso
sta
ti19.6
15.5
301.7
24.6
766
5.9
859
1.2
800
50.7
949.2
119.6
7.0
301.7
22.1
120
2.9
168
1.3
810
54.8
045.2
0
Co
nv
enti
ona
l m
eth
od
19.6
15.2
300.4
94.5
674
10.5
518
2.3
102
--
19.7
7.0
304.8
12.1
336
5.3
786
2.5
209
--
Arc
hem
idie
s m
eth
od
4.2
241
6.3
277
2.4
980
--
2.1
066
3.2
720
2.5
532
--
2.6
0g/
cm3
2.6
0g/
cm3
2.3
5cm
30.9
7cm
3
6.1
0g
2.5
3g
6.1
5g
2.5
2g
0.7
7%
-0.4
6%
Vo
lum
e o
f th
e L
iqui
d =
M
ass
dry
- M
ass
Imm
erse
d4.2
2g
No
te:
Vo
lum
e o
f th
e L
iqui
d =
M
ass
dry
- M
ass
Imm
erse
d2.1
1g
Den
sity
(A
rche
mid
ies)
= M
ass
dry
/V
olu
me
of th
e liq
uid
2.5
0g
/cm
3P
ow
der
use
d B
4C
12
00
Mes
hD
ensi
ty (
Arc
hem
idie
s) =
Mas
s d
ry /V
olu
me
of th
e liq
uid
2.5
5g
/cm
3
Exce
ss m
ater
ial u
sed
Exc
ess
mat
eria
l use
d
Mas
s o
f th
e al
loy
used
fo
r In
filtr
atio
nM
ass
of th
e al
loy
used
fo
r In
filtr
atio
n
Den
sity
of th
e al
loy
(Al +
25
wt%
Si)
Den
sity
of th
e al
loy
(Al +
25
wt%
Si)
Vo
lum
e o
f th
e al
loy
Vo
lum
e o
f th
e al
loy
Mas
s o
f th
e al
loy
Req
. fo
r In
filtr
atio
n (1
02%
)M
ass
of th
e al
loy
Req
. fo
r In
filtr
atio
n
Ob
serv
ati
on
an
d C
alc
ula
tion
Sh
eet
CO
MP
OS
ITE
- I
C
OM
PO
SIT
E -
II
/ A
P
oro
sity
ass
umed
50%
Po
rosi
ty a
ssum
ed 5
0%
De
scri
pti
on
Po
wder
Co
mpa
cted
Pre
form
Co
mpo
site
Tab
le C
1:
S
tatu
s of
com
posi
te I
and
II
(A)
- on e
ach s
tage
of
pre
par
atio
n.

Processing and Toughening of Dual-Metallic Phase Dual-Carbide Composites 2013
162
Po
wd
er
Den
sity
2.5
2 g
/cm
3P
ow
der
Den
sity
2.5
2 g
/cm
3
Dia
me
ter
Le
ng
thA
rea
Vo
lum
eM
ass
De
nsi
ty
Act
ual
de
nsi
fi
cati
on
Po
rosi
tyD
ia
me
ter
Le
ng
thA
rea
Vo
lum
eM
ass
De
nsi
ty
Act
ual
de
nsi
fi
cati
on
Po
rosi
ty
(mm
)(m
m)
(mm
2)
(cm
3)
(g)
(g/c
m3)
(%)
(%)
(mm
)(m
m)
(mm
2)
(cm
3)
(g)
(g/c
m3)
(%)
(%)
No
min
al v
laues
(B4C
+4
wt%
PV
A)
20.0
7.5
314.1
62.3
550
2,9
67
3+
0,1
18
61.2
600
20.0
7.5
314.1
62.3
550
2,9
67
3+
0,1
18
61.2
600
Act
ua
l ta
ken
3.0
746
3.0
800
Unia
xia
l20.0
7.3
314.1
62.2
777
3.0
203
1.3
261
52.6
247.3
820.0
7.2
314.1
62.2
619
3.0
718
1.3
580
53.8
946.1
1
Iso
sta
ti19.7
7.2
304.8
12.1
885
2.9
84
1.3
635
54.1
145.8
919.5
7.1
299.8
72.1
291
2.9
596
1.3
901
55.1
644.8
4
Co
nv
enti
ona
l m
eth
od
19.7
7.3
303.2
62.1
986
4.9
000
2.2
287
88.4
411.5
619.6
7.1
300.8
82.1
376
5.3
908
2.5
219
--
Arc
hem
idie
s m
eth
od
2.0
100
2.8
900
2.4
378
96.7
43.2
62.1
303
3.2
605
2.5
305
--
2.6
0g/
cm3
2.5
6g/
cm3
1.0
2cm
30.9
5cm
3
2.6
7g
2.4
5g
2.7
0g
2.5
2g
1.0
8%
2.7
1%
Vo
lum
e o
f th
e L
iqui
d =
M
ass
dry
- M
ass
Imm
erse
d2.0
1g
Vo
lum
e o
f th
e L
iqui
d =
M
ass
dry
- M
ass
Imm
erse
d2.1
3g
Den
sity
(A
rche
mid
ies)
= M
ass
dry
/V
olu
me
of th
e liq
uid
2.4
4g
/cm
3D
ensi
ty (
Arc
hem
idie
s) =
Mas
s d
ry /V
olu
me
of th
e liq
uid
2.5
3g
/cm
3
Exce
ss m
ater
ial u
sed
Exc
ess
mat
eria
l use
d
Vo
lum
e o
f th
e al
loy
Vo
lum
e o
f th
e al
loy
Mas
s o
f th
e al
loy
Req
. fo
r In
filtr
atio
n (1
02%
)M
ass
of th
e al
loy
Req
. fo
r In
filtr
atio
n
Mas
s o
f th
e al
loy
used
fo
r In
filtr
atio
nM
ass
of th
e al
loy
used
fo
r In
filtr
atio
n
Po
wder
Co
mpa
cted
Pre
form
Co
mpo
site
Den
sity
of th
e al
loy
(Al +
25
wt%
Si)
Den
sity
of th
e al
loy
(Al +
35
w
t%
Si)
Ob
serv
ati
on
an
d C
alc
ula
tion
Sh
eet
De
scri
pti
on
CO
MP
OS
ITE
- I
II
Po
rosi
ty a
ssum
ed 5
0%
CO
MP
OS
ITE
- I
V / B
P
oro
sity
ass
umed
50%
Tab
le C
2:
S
tatu
s of
com
posi
te I
II a
nd I
V (
B)
- on e
ach s
tag
e of
pre
par
atio
n.
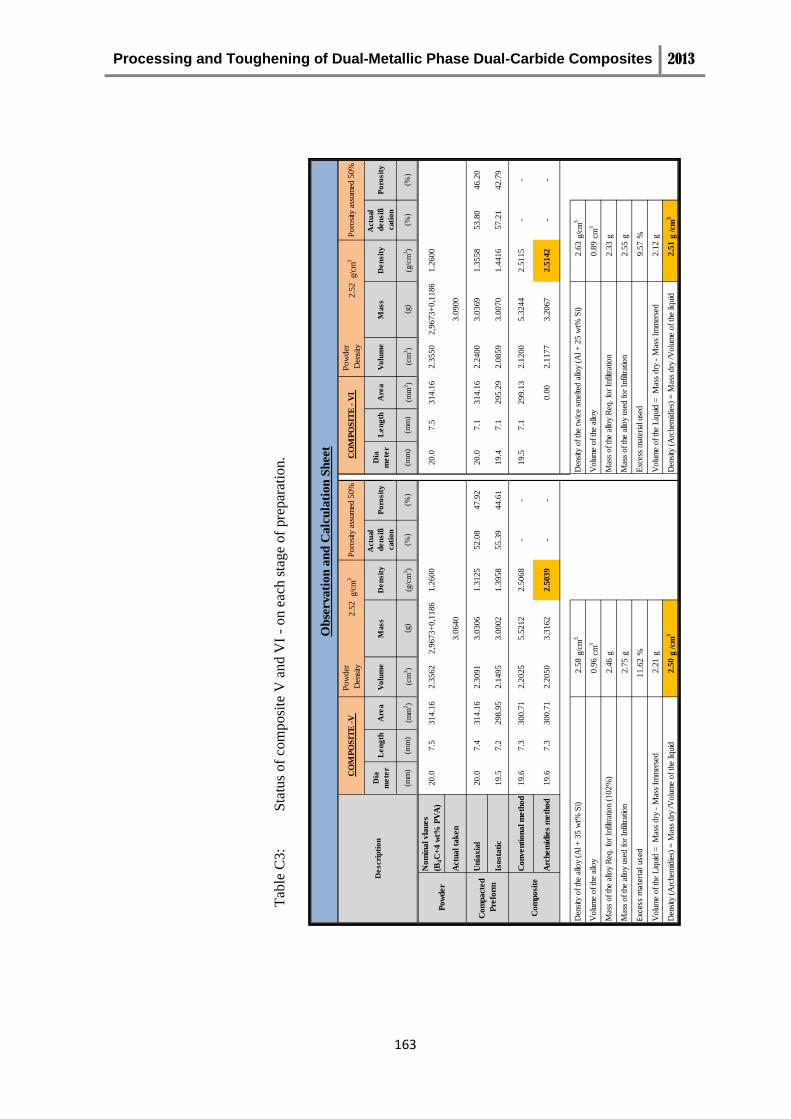
Processing and Toughening of Dual-Metallic Phase Dual-Carbide Composites 2013
163
Po
wd
er
Den
sity
2.5
2 g
/cm
3P
ow
der
Den
sity
2.5
2 g
/cm
3
Dia
me
ter
Le
ng
thA
rea
Vo
lum
eM
ass
De
nsit
y
Actu
al
de
nsif
i
cati
on
Po
rosit
yD
ia
me
ter
Le
ng
thA
rea
Vo
lum
eM
ass
De
nsit
y
Actu
al
de
nsif
i
cati
on
Po
rosit
y
(mm
)(m
m)
(mm
2)
(cm
3)
(g)
(g/c
m3)
(%)
(%)
(mm
)(m
m)
(mm
2)
(cm
3)
(g)
(g/c
m3)
(%)
(%)
No
min
al v
laues
(B4C
+4
wt%
PV
A)
20.0
7.5
314.1
62.3
562
2,9
67
3+
0,1
18
61.2
600
20.0
7.5
314.1
62.3
550
2,9
67
3+
0,1
18
61.2
600
Act
ua
l ta
ken
3.0
640
3.0
900
Unia
xia
l20.0
7.4
314.1
62.3
091
3.0
306
1.3
125
52.0
847.9
220.0
7.1
314.1
62.2
400
3.0
369
1.3
558
53.8
046.2
0
Iso
sta
tic
19.5
7.2
298.9
52.1
495
3.0
002
1.3
958
55.3
944.6
119.4
7.1
295.2
92.0
859
3.0
070
1.4
416
57.2
142.7
9
Co
nv
enti
ona
l m
eth
od
19.6
7.3
300.7
12.2
025
5.5
212
2.5
068
--
19.5
7.1
299.1
32.1
200
5.3
244
2.5
115
--
Arc
hem
idie
s m
eth
od
19.6
7.3
300.7
12.2
050
3.3
162
2.5
039
--
0.0
02.1
177
3.2
067
2.5
142
--
2.5
8g/
cm3
2.6
3g/
cm3
0.9
6cm
30.8
9cm
3
2.4
6g
2.3
3g
2.7
5g
2.5
5g
11.6
2%
9.5
7%
Vo
lum
e o
f th
e L
iqui
d =
M
ass
dry
- M
ass
Imm
erse
d2.2
1g
Vo
lum
e o
f th
e L
iqui
d =
M
ass
dry
- M
ass
Imm
erse
d2.1
2g
Den
sity
(A
rche
mid
ies)
= M
ass
dry
/V
olu
me
of th
e liq
uid
2.5
0g
/cm
3D
ensi
ty (
Arc
hem
idie
s) =
Mas
s d
ry /V
olu
me
of th
e liq
uid
2.5
1g
/cm
3
Exce
ss m
ater
ial u
sed
Exc
ess
mat
eria
l use
d
Vo
lum
e o
f th
e al
loy
Vo
lum
e o
f th
e al
loy
Mas
s o
f th
e al
loy
Req
. fo
r In
filtr
atio
n (1
02%
)M
ass
of th
e al
loy
Req
. fo
r In
filtr
atio
n
Mas
s o
f th
e al
loy
used
fo
r In
filtr
atio
nM
ass
of th
e al
loy
used
fo
r In
filtr
atio
n
Po
wder
Co
mpa
cted
Pre
form
Co
mpo
site
Den
sity
of th
e al
loy
(Al +
35
wt%
Si)
Den
sity
of th
e tw
ice
smel
ted
allo
y (A
l + 2
5 w
t% S
i)
Ob
servati
on
an
d C
alc
ula
tion
Sh
eet
De
scri
pti
on
CO
MP
OS
ITE
-V
P
oro
sity
ass
umed
50%
CO
MP
OS
ITE
- V
I P
oro
sity
ass
umed
50%
Tab
le C
3:
S
tatu
s of
com
posi
te V
and V
I -
on e
ach s
tage
of
pre
par
atio
n.
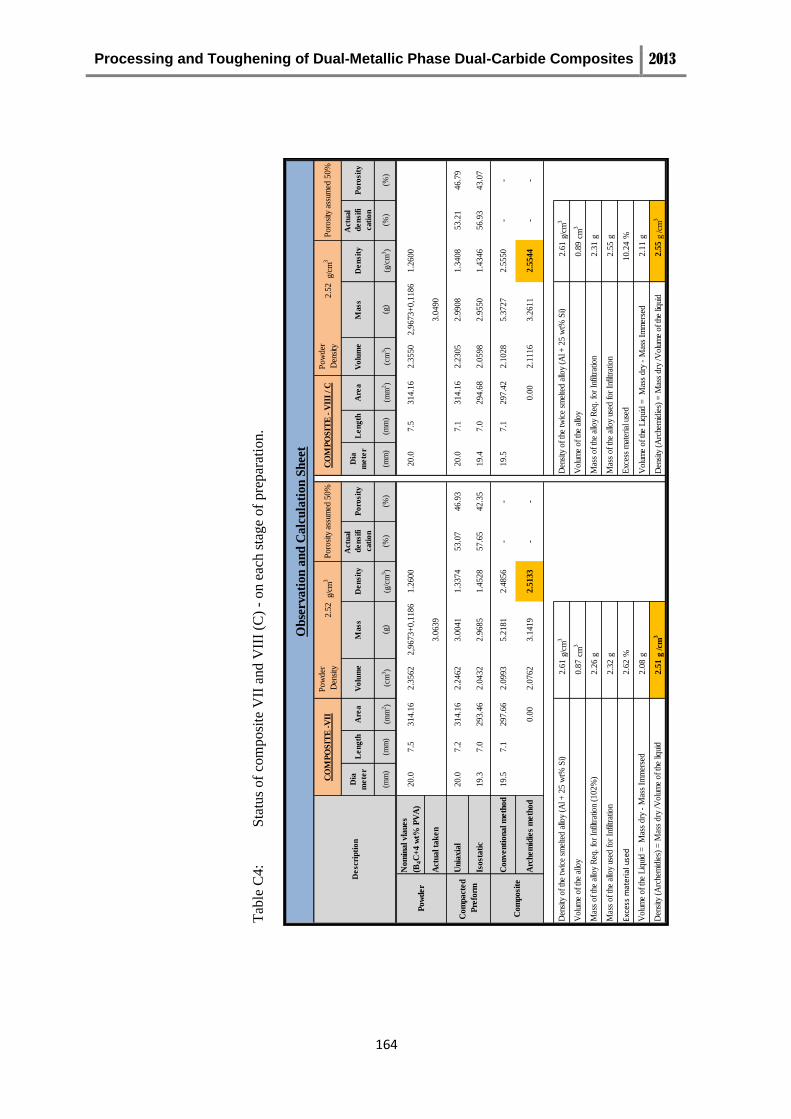
Processing and Toughening of Dual-Metallic Phase Dual-Carbide Composites 2013
164
Po
wd
er
Den
sity
2.5
2 g
/cm
3P
ow
der
Den
sity
2.5
2 g
/cm
3
Dia
me
ter
Le
ng
thA
rea
Vo
lum
eM
ass
De
nsit
y
Actu
al
de
nsif
i
cati
on
Po
rosit
yD
ia
me
ter
Le
ng
thA
rea
Vo
lum
eM
ass
De
nsit
y
Actu
al
de
nsif
i
cati
on
Po
rosit
y
(mm
)(m
m)
(mm
2)
(cm
3)
(g)
(g/c
m3)
(%)
(%)
(mm
)(m
m)
(mm
2)
(cm
3)
(g)
(g/c
m3)
(%)
(%)
No
min
al v
laues
(B4C
+4
wt%
PV
A)
20.0
7.5
314.1
62.3
562
2,9
67
3+
0,1
18
61.2
600
20.0
7.5
314.1
62.3
550
2,9
67
3+
0,1
18
61.2
600
Act
ua
l ta
ken
3.0
639
3.0
490
Unia
xia
l20.0
7.2
314.1
62.2
462
3.0
041
1.3
374
53.0
746.9
320.0
7.1
314.1
62.2
305
2.9
908
1.3
408
53.2
146.7
9
Iso
sta
tic
19.3
7.0
293.4
62.0
432
2.9
685
1.4
528
57.6
542.3
519.4
7.0
294.6
82.0
598
2.9
550
1.4
346
56.9
343.0
7
Co
nv
enti
ona
l m
eth
od
19.5
7.1
297.6
62.0
993
5.2
181
2.4
856
--
19.5
7.1
297.4
22.1
028
5.3
727
2.5
550
--
Arc
hem
idie
s m
eth
od
0.0
02.0
762
3.1
419
2.5
133
--
0.0
02.1
116
3.2
611
2.5
544
--
2.6
1g/
cm3
2.6
1g/
cm3
0.8
7cm
30.8
9cm
3
2.2
6g
2.3
1g
2.3
2g
2.5
5g
Exce
ss m
ater
ial u
sed
2.6
2%
10.2
4%
2.0
8g
Vo
lum
e o
f th
e L
iqui
d =
M
ass
dry
- M
ass
Imm
erse
d2.1
1g
2.5
1g
/cm
3D
ensi
ty (
Arc
hem
idie
s) =
Mas
s d
ry /V
olu
me
of th
e liq
uid
2.5
5g
/cm
3
Exc
ess
mat
eria
l use
d
Vo
lum
e o
f th
e L
iqui
d =
M
ass
dry
- M
ass
Imm
erse
d
Den
sity
(A
rche
mid
ies)
= M
ass
dry
/V
olu
me
of th
e liq
uid
Vo
lum
e o
f th
e al
loy
Vo
lum
e o
f th
e al
loy
Mas
s o
f th
e al
loy
Req
. fo
r In
filtr
atio
n (1
02%
)M
ass
of th
e al
loy
Req
. fo
r In
filtr
atio
n
Mas
s o
f th
e al
loy
used
fo
r In
filtr
atio
nM
ass
of th
e al
loy
used
fo
r In
filtr
atio
n
Po
wder
Co
mpa
cted
Pre
form
Co
mpo
site
Den
sity
of th
e tw
ice
smel
ted
allo
y (A
l + 2
5 w
t% S
i)D
ensi
ty o
f th
e tw
ice
smel
ted
allo
y (A
l + 2
5 w
t% S
i)
Ob
serv
ati
on
an
d C
alc
ula
tion
Sh
eet
De
scri
pti
on
CO
MP
OS
ITE
-V
IIP
oro
sity
ass
umed
50%
CO
MP
OS
ITE
- V
III
/ C
Po
rosi
ty a
ssum
ed 5
0%
Tab
le C
4:
S
tatu
s of
com
posi
te V
II a
nd V
III
(C)
- on e
ach s
tage
of
pre
par
atio
n.
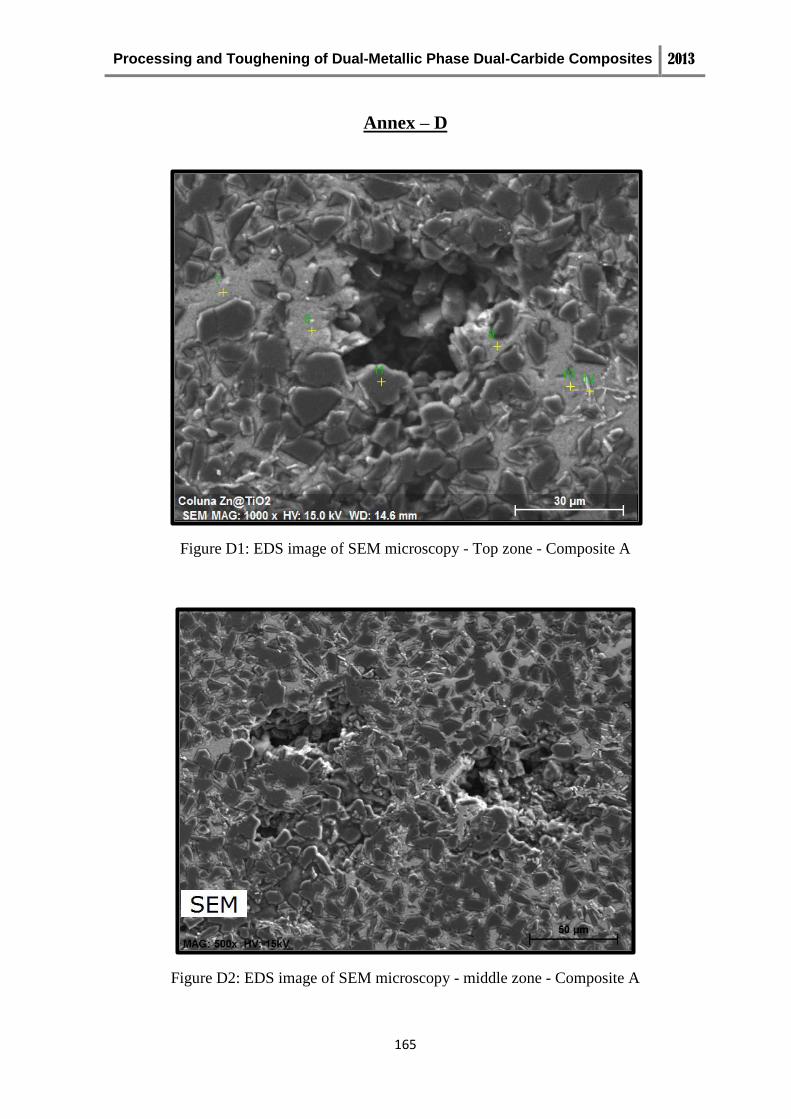
Processing and Toughening of Dual-Metallic Phase Dual-Carbide Composites 2013
165
Annex – D
Figure D1: EDS image of SEM microscopy - Top zone - Composite A
Figure D2: EDS image of SEM microscopy - middle zone - Composite A
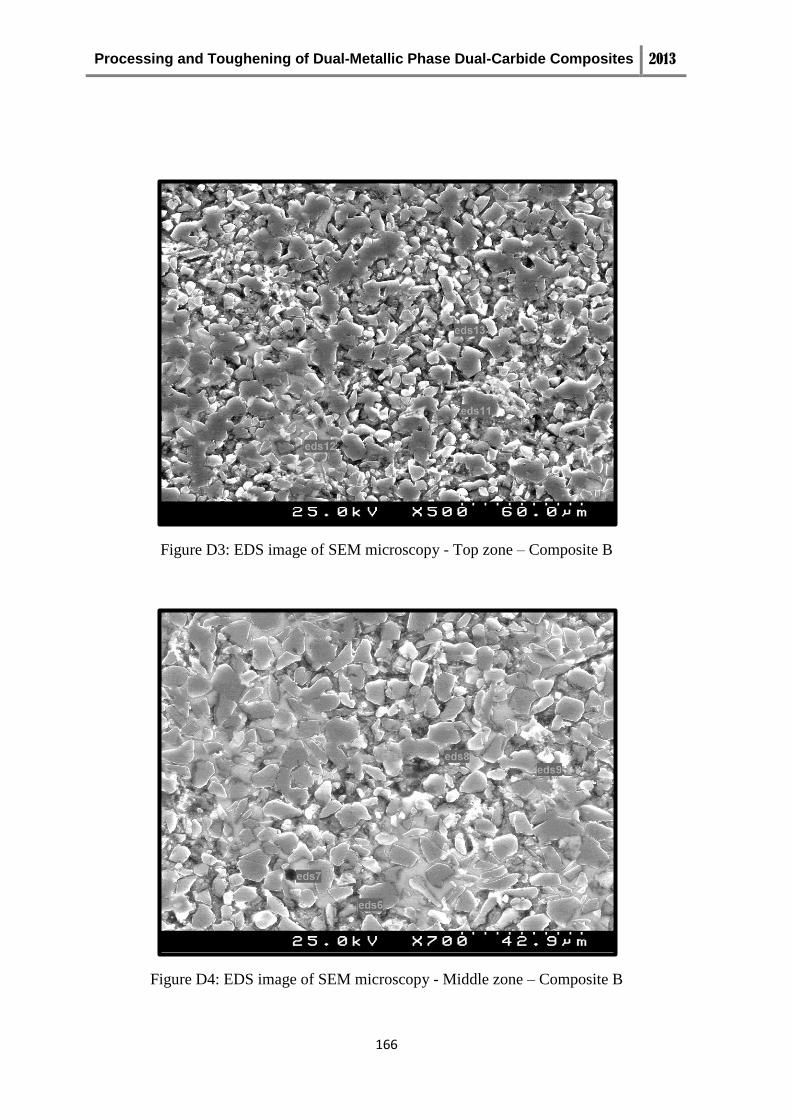
Processing and Toughening of Dual-Metallic Phase Dual-Carbide Composites 2013
166
Figure D3: EDS image of SEM microscopy - Top zone – Composite B
Figure D4: EDS image of SEM microscopy - Middle zone – Composite B
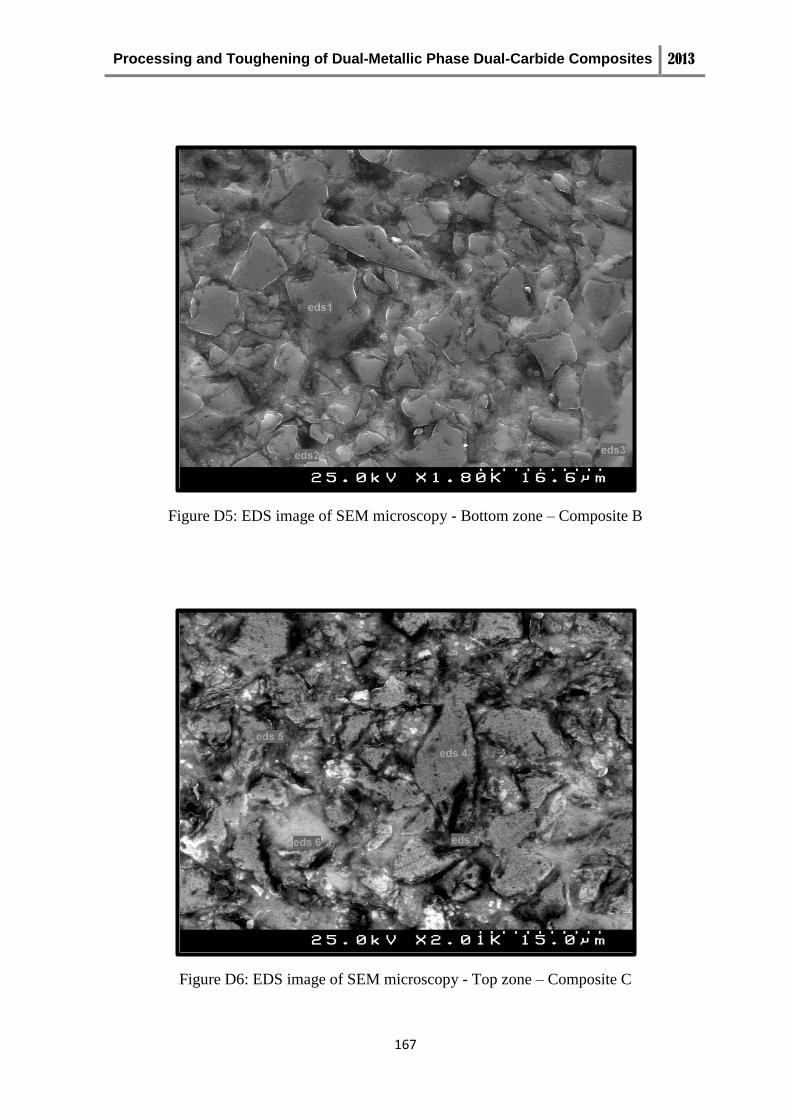
Processing and Toughening of Dual-Metallic Phase Dual-Carbide Composites 2013
167
Figure D5: EDS image of SEM microscopy - Bottom zone – Composite B
Figure D6: EDS image of SEM microscopy - Top zone – Composite C
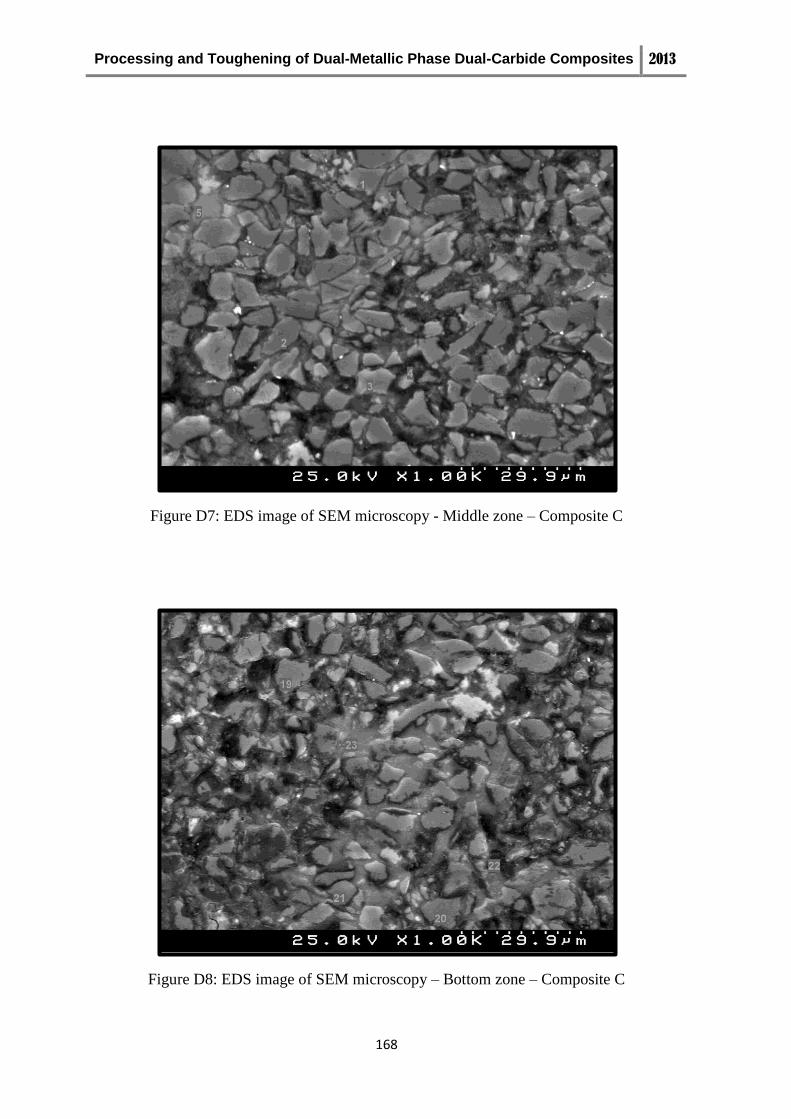
Processing and Toughening of Dual-Metallic Phase Dual-Carbide Composites 2013
168
Figure D7: EDS image of SEM microscopy - Middle zone – Composite C
Figure D8: EDS image of SEM microscopy – Bottom zone – Composite C
Recommended