1
Banco do Brasil S.A.Banco do Brasil S.A.
3Q073Q07

2
Economic EnvironmentEconomic EnvironmentEconomic EnvironmentEconomic Environment
Interest Rate - Selic Price Index - IPCA
Ratio - %
Source: Central Bank and Brazilian Institute of Geography and Statistics - IBGE
2003
16.5
9.3
2004
17.8
7.6
2005
18.0
5.7
2006
13.3
3.1
9M07
11.2
3.0
14.2
2.0
9M06
3
Trade BalanceInternational Reserves
Economic EnvironmentEconomic EnvironmentEconomic EnvironmentEconomic Environment
Sovereign Risk – basis points
Source: Agência Estado, Ministry of Development, Industry and Foreign Trade and Central Bank
USD billion
463383
303
192
2003
24.8
49.3
2004
33.6
52.9
2005
44.753.8
2006
46.1
85.8
3Q07
30.9
163.0
34.0
73.3
3Q06
231177

4
Banking IndustryBanking IndustryBanking IndustryBanking Industry
2003 2004 2005 2006
Businesses Individuals
Loan Segments – Free Resources %Loan / GDP - %
Source: Central Bank
39.543.6
47.2 47.8
60.556.4
52.8 52.2
Sep/07
49.2 50.8
26.2 26.928.1
30.833.1
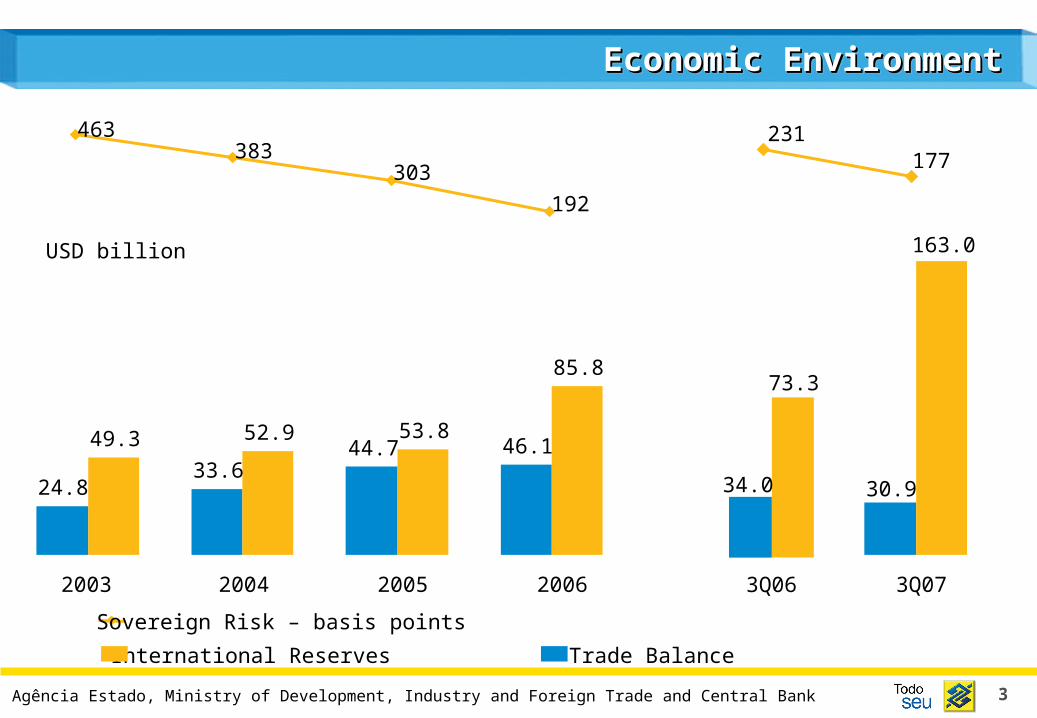
5
Loan SegmentsLoan SegmentsLoan SegmentsLoan Segments
2003 2005 20062004
Payroll Loan Credit Card / Overdraft AccountCars Others
Individual Loan Segments - %
Source: Central Bank
45.1
26.6
11.7
16.6
42.5
26.7
10.6
20.2
47.2
27.5
13.0
12.4
55.1
29.7
15.2
Sep/07
43.2
25.8
10.4
20.6

6
Banco do Brasil StructureBanco do Brasil StructureBanco do Brasil StructureBanco do Brasil Structure
COBRABB-99.36% ON
99.34% TotalBI-0.03% ON
0.03% Total
BB LEASINGBB - 100% ON
100% Total
BB VIENA BB -100% ON
100% Total
BBCARTÕESBB - 100% ON
100% Total
BB LEASING Co. LTD
BB - 100% ON 100% Total
BB DTVM BB -100% ON
100% Total
BBCORRETORA
BB - 100%ON 100% Total
BAMBBB -100% ON
100% Total
BBCONSÓRCIOS
BB - 100% ON 100% Total
BB BIBB - 100% ON
100% Total
BANCO DO BRASIL SECURITIES LLC
BB - 100% ON 100% Total
BBSECURITIESBAMB -100% ON
100% Total
BB TURISMO
BAMB - 99% ONBB LEASING – 1%ON
100%Total
ATIVOS S.A. BB BI - 49% ON
74.50 % TotalBAMB - 51% ON 25.50% Total
ALIANÇADO BRASIL
BB-BI 40% ON 70% Total
BRASILPREV
BB-BI 49.99% ON 49.99% Total
CIBRASEC
BB-BI 9.09% ON 9.09% Total
SBCE
BB-BI 12.08% ON 12.08% Total
BRASILSAÚDE
BB-BI 49.92%ON 49.92% Total
VISANET
BB BI Classe A 35% Classe B 28.75%
31.99% Total
ITAPEBI
BB-BI 19% ON 19% Total
BRASILCAP
BB-BI 49.99% ON 49.99% Total
KEPLER WEBER
BB-BI 24.38% ON 24.38% TotalDTVM 0.30% ON
0.30% Total
VISA VALE
BB BI 35% ON 40.35% Total
PRONORBB 0% ON
1.05% TotalBI 0% ON
3.27% TotalDTVM 29.5% ON
12.02% Total
Strategic Partnerships
Non-Strategic Partnerships
BRASIL VEÍCULOS
BB-BI 40% ON 70% Total
NEOENERGIA
BB-BI 8.81% ON 8.81% Total
TECBAN
BB BI 8.96% ON 8.96% Total
CLEARINGS
CIP BB 9.78% ON 9.78% TotalCBLC BB 2.45% ON 2.45% Total
B B
Strategic Partnerships
CADAM
BB 0% ON 21.64% Total
Non-Strategic Partnerships
Banco do BrasilBanco do Brasil
Other Partnerships
Affiliated Companies
BB BI
Wholly Owned Subsidiaries
BANCO POPULAR DO BRASIL BB -100% ON
100% Total
7
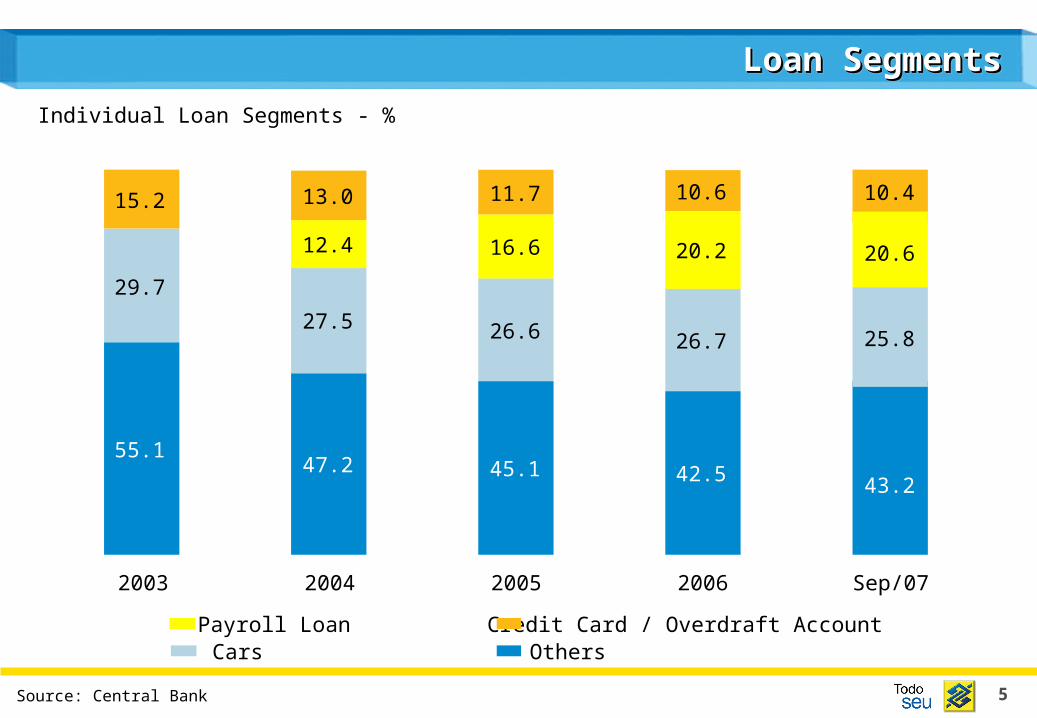
Organizational StructureOrganizational StructureOrganizational StructureOrganizational Structure
Board of Officers
International Business and
Wholesale
Retail Serviceand
Distribution
GovernmentAffairs
Technology and Logistic
Finance,Capital Market andInvestor Relations
CEO
Human Resourcesand Social-
EnvironmentalResponsibility
Credit,Controlling and
Risk Management
Vice-Presidents
Credit and DebitCards andNew RetailBusiness
Agribusinesses
Board of Directors
General Shareholders Meeting
Board of Auditors
Audit Committee
Internal Audit

8
Banco do Brasil’s SharesBanco do Brasil’s SharesBanco do Brasil’s SharesBanco do Brasil’s Shares
National Treasury
PREVI
BNDESPar
Foreign Investors
Others
68.7
11.4
5.0
7.3
7.5
Free Float: 14.8
Participation - %
As of June 2007
9
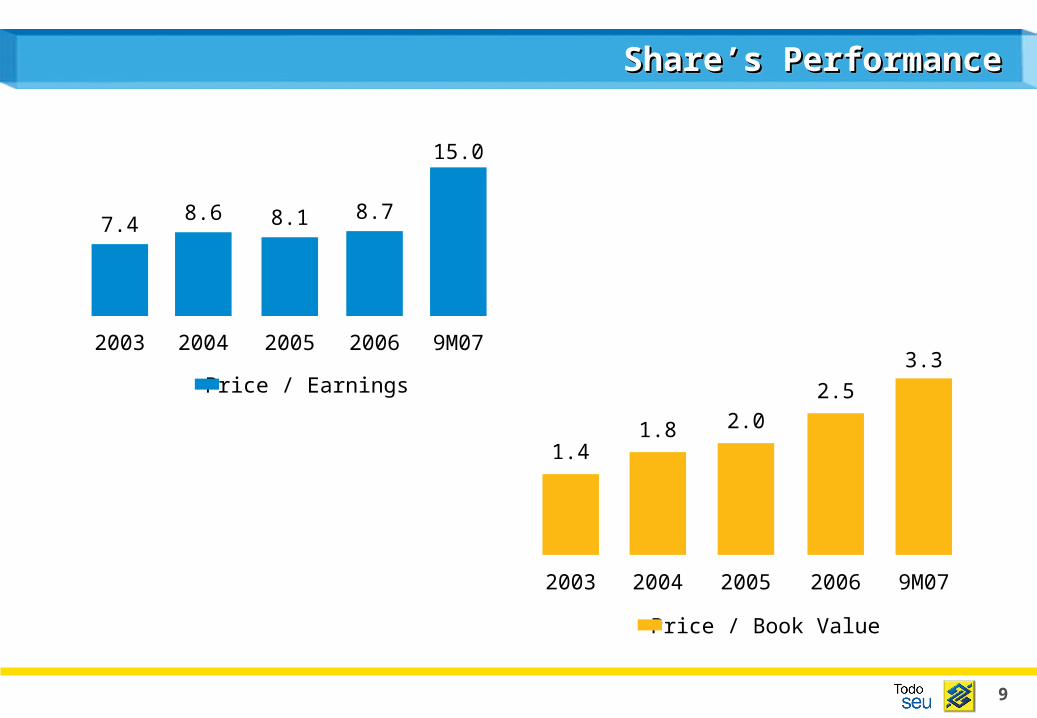
Share’s PerformanceShare’s PerformanceShare’s PerformanceShare’s Performance
2003 2004 2005 2006
Price / Book Value
2003 2004 2005 2006
Price / Earnings
7.48.6 8.1 8.7
1.41.8 2.0
2.5
9M07
9M07
15.0
3.3

10
Share’s PerformanceShare’s PerformanceShare’s PerformanceShare’s Performance
31.3
2003
31.5
2004
36.1
2005
40.0
2006
Payout - %
2003 2004 2005 2006
Dividend Yield - %
4.23.7
4.4 4.6
40.0
9M07
9M07
2.0

11
Share’s PerformanceShare’s PerformanceShare’s PerformanceShare’s Performance
Ibovespa Banco do Brasil
Sep/03 Sep/04 Sep/05 Sep/06 Sep/07
612.8%
277.7%

12
PerformancePerformancePerformancePerformance
Net Income - R$ million
ROE - %
Market Capitalization - R$ billion
Dividends / Interest on Capital - R$ million
2003
2,381
2004
3,024
2005
4,154
2006
6,044
22.3 23.0 26.832.1
2003
17.6
2004
26.0
2005
33.7
2006
52.8746
954
1,498
2,418
9M06 9M07
3,841
24.0
35.9
1H06
52.8
2S06
41.3
862
1,5361,555
76.5
9M07
4,796

13
Capital StructureCapital StructureCapital StructureCapital Structure
Shareholder’s Equity - R$ billion Tier I - %
BIS Ratio -%
Tier II - %
12.2
2003
14.1
2004
16.8
2005
20.8
2006 2003 2004 2005 2006
9.7
4.0
10.6
4.6
11.7
5.4
11.7
5.6
17.317.115.2
13.7
20.2
3Q06 3Q07 3Q06 3Q07
23.1
11.9
5.8
10.5
5.2
15.717.7

14
118.3
150.2
281.6
342.4
3Q06 3Q07 3Q06 3Q07
HighlightsHighlightsHighlightsHighlights
Market Share¹ - %
Loan Portfolio - R$ billion
Market Share - %
Assets - R$ billion
2003 2004 2005 2006
230.1 239.0253.0
296.4
77.6
2003
88.6
2004
101.8
2005
133.2
2006
16.3 16.515.315.9
14.815.1
16.517.3
CAGR: 11.2%
(1) Domestic Portfolio
CAGR: 19.3%

15
HighlightsHighlightsHighlightsHighlights
Market Share - %
Assets Under Management - R$ billion
Market Share - %
Deposits - R$ billion
110.0
2003
115.5
2004
137.7
2005
158.8
2006
102.7
2003
124.0
2004
153.5
2005
182.7
2006
19.1
20.219.7
19.020.320.220.2
22.4
CAGR: 12.7% CAGR: 20.5%
206.9
3Q06 3Q07 3Q06 3Q07
144.9
172.2
180.6
16
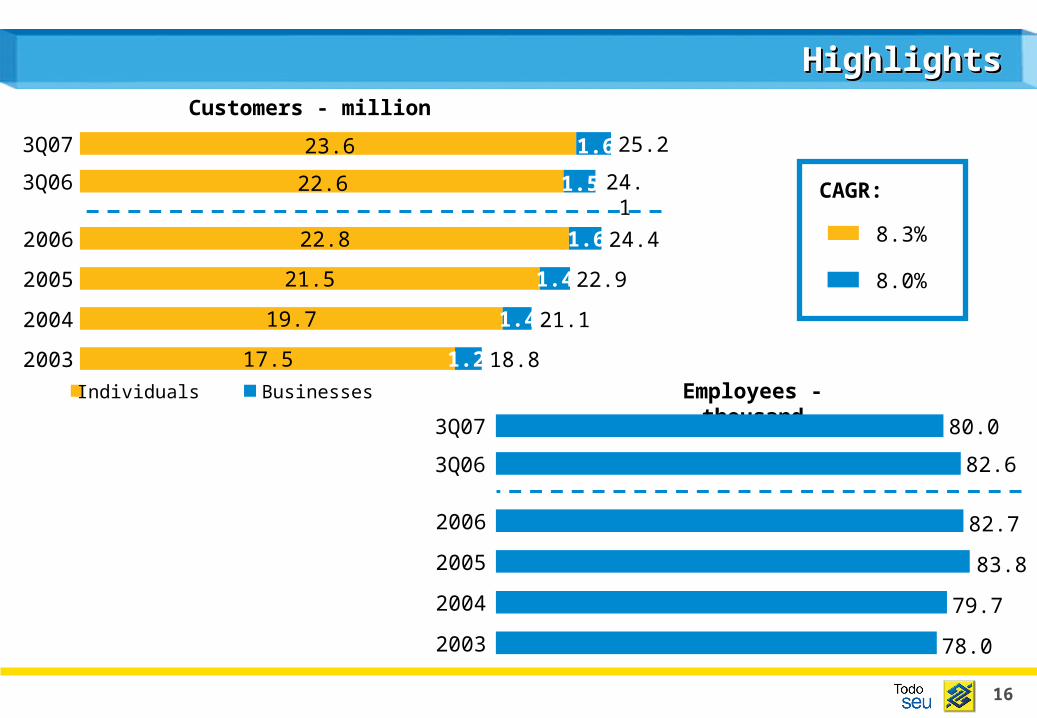
Customers - million
HighlightsHighlightsHighlightsHighlights
Individuals Businesses Employees - thousand
2003 18.817.5 1.2
2004 21.119.7 1.4
2005 22.921.5 1.4
2006 24.422.8 1.6
2003 78.0
2004 79.7
2005 83.8
2006 82.7
CAGR:
8.3%
8.0%
3Q07 25.2
3Q06 24.1
3Q07
3Q06
23.6 1.6
22.6 1.5
80.0
82.6

17
Infrastructure and TechnologyInfrastructure and TechnologyInfrastructure and TechnologyInfrastructure and TechnologyDistribution Network
Northeast
Branches 998Others 2,892Total 3,890
Branches 1,541Others 3,913Total 5,454
Branches 812Others 2,168Total 2,980
Branches 391Others 1,332Total 1,723
Branches 242Others 921Total 1,163
North
Midwest
South
Southeast
7.6%
11.3%
25.6%
35.9%
19.6%

18
Infrastructure and TechnologyInfrastructure and TechnologyInfrastructure and TechnologyInfrastructure and Technology
Branches Others
Points of Service - thousand
Automated Teller Machine (ATM) - thousand2003 13.23.2 10.0
2004 14.43.7 10.7
2005 14.83.9 10.9
2006 15.14.0 11.1
37.02003
39.02004
40.22005
39.72006
3.9 11.03Q06 15.0
4.0 11.23Q07 15.2
3Q07
3Q06
39.4
42.6

19
Infrastructure and TechnologyInfrastructure and TechnologyInfrastructure and TechnologyInfrastructure and Technology
Transaction in Automated Channels - %
ATM
Internet BankingCashier
POS
Others
Breakdown of Transactions - %
3Q06 3Q07
2004 88.4
2005 89.2
2006 90.0
86.42003
3Q06 89.4
3Q07 90.7
48.2
30.2
10.6
7.1 4.0
46.4
32.1
9.3
8.14.1

20
Administrative Expenses - R$ billion Operational Income - R$ billion
ProductivityProductivityProductivityProductivity
Efficiency Ratio - %
11.3
20.3
12.6
23.2
13.1
27.3
13.7
28.9
2003 2004 2005 2006
55.8 54.248.1 47.5
9M06 9M07
6.7
19.0
9.7
22.1
53.548.2

21
Fee Income - R$ billionPersonnel Expenses - R$ billion
Coverage Ratio - %
ProductivityProductivityProductivityProductivity
2003 2004 2005 2006
6.8
5.5
7.16.6
7.5 7.6 7.9
8.9
112.9102.3
93.180.6
9M06 9M07
5.4
6.6
5.2
7.3
128.8113.4

22
Net Interest IncomeNet Interest IncomeNet Interest IncomeNet Interest Income
2004 2005 2006
17.1
11.3
2.9
15.8 19.2
12.4
2.0
16.8 21.6
13.5
1.6
18.7
R$ billion
Security Revenues
Loan Revenues
Other Interest RevenuesInterest Expense
Net Interest Income
15.516.7
18.0
10.2
15.8
1.2
13.9
9.6
18.7
1.7
14.6
9M06 9M07
13.3
15.3

23
FundingFundingFundingFunding
R$ billion
Demand Deposits Saving Deposits
Time Deposits Others¹
2003
150.1
2004
160.1
2005
168.2
2006
208.1
(1) Include Interbank Deposits, Investment Deposits and Money Market Borrowing
48.2
47.3
27.4
27.1
49.7
50.3
31.1
29.0
63.5
36.0
32.8
35.8
76.9
54.4
36.7
40.1
3Q06
189.2
3Q07
247.0
72.3
50.1
34.4
32.4
83.6
80.9
43.8
38.7

24
Loan PortfolioLoan PortfolioLoan PortfolioLoan Portfolio
16.1
33.4
30.0
9.0 18.4
38.5
35.7
9.224.0
51.9
45.1
12.2
2004 2005 2006
IndividualsBusinesses Agribusiness Abroad
R$ billion
88.6101.8
133.2
3Q06 3Q07
59.7
48.4
29.5
12.6
150.2
44.4
40.3
23.2
10.4
118.3

25
DelinquencyDelinquencyDelinquencyDelinquency
Allowance / Loan Portfolio - %
Past Due Loans + 15 days / Loan Portfolio - %
Past Due Loans + 60 days / Loan Portfolio - %
5.6
6.4 6.3
7.4
6.4
4.8
5.45.9 5.2
4.7
3.2 3.2
3.9 3.83.4
Sep/03 Sep/04 Sep/05 Sep/06 Sep/07

26
Loan Portfolio - IndividualsLoan Portfolio - IndividualsLoan Portfolio - IndividualsLoan Portfolio - Individuals
2004 2005 2006
Cars
Payroll Loan
Overdraft Account Credit Cards
Others
16.1
18.4
24.0
R$ billion
0.3 2.2
2.01.5
10.0
0.2 2.2
2.5
3.8
9.7
0.92.2
3.1
8.3
9.5
3Q06 3Q07
3.6
2.6
11.0
2.2
29.5
10.1
2.8
2.4
7.4
9.9
23.2
0.6

27
Loan Portfolio - BusinessesLoan Portfolio - BusinessesLoan Portfolio - BusinessesLoan Portfolio - Businesses
2004 2005 2006
13.2
20.2
15.4
23.1
18.3
33.6
Middle and Large EnterprisesSmall and Micro Enterprises
33.4
38.5
51.9
R$ billion
3Q06 3Q07
44.4
59.7
18.1
26.3
20.7
39.0

28
Loan Portfolio - AgribusinessLoan Portfolio - AgribusinessLoan Portfolio - AgribusinessLoan Portfolio - Agribusiness
Mini-Sized Farmers
Small-Sized Farmers
Other Farmers
Cooperative
2004 2005 2006
1.3 3.1
6.0
19.6
1.83.8
7.4
22.8
2.05.3
8.6
29.230.0
35.7
45.1
R$ billion
3Q06 3Q07
40.3
48.4
1.8 1.74.7
7.6
26.2
5.9
9.0
31.8

29
RetailRetailRetailRetail
Credit Card Revenue - R$ billion¹
Issued Credit Cards - million
(1) Debt cards included
18.1
2003
24.3
2004
31.6
2005 2006
14.1
9.3
6.95.3 37.9
9M06 9M07
27.1
35.0
11.4
17.8

30
InsuranceInsuranceInsuranceInsurance
Managed Portfolio - R$ millionInsured Cars - thousand
Car Insurance
171.8
238.7
318.5
367.0
2003 2004 2005 2006
676625
578500
3Q06 3Q07
366.7
423.3
726647

31
InsuranceInsuranceInsuranceInsurance
Managed Portfolio - R$ millionInsured Lives - thousand
Life Insurance
2003 2004 2005 2006
570.5
680.6717.1
820.1
1,2631,351 1,417
1,748
3Q06 3Q07
728.2
880.9
1,8031,697

32
InsuranceInsuranceInsuranceInsurance
Managed Portfolio - R$ millionParticipants - thousand
Pension Fund
2003 2004 2005 2006
5,586
7,781
9,659
12,480
1,1781,365
1,5761,760
3Q06 3Q07
11,634
14,662
1,9601,713

33
InsuranceInsuranceInsuranceInsurance
Managed Portfolio - R$ millionsQuantity of Plans - thousand
Capitalization (Annuity Plans)
2003 2004 2005 2006
2,0602,264
2,875 2,886
2,661
2,792
2,949
2,851
2,834 2,629
2,782
2,840
3Q06 3Q07

34
Investor Relations UnitSBS - Quadra 1 - Bloco C - Ed. Sede III - 5° floor
70073-901 - Brasília (DF)Phone: 55 (61) 3310.3980
Fax: 55 (61) 3310.3735
DisclaimerDisclaimer - This presentation contains references and statements, planned synergies, increasing estimates, projections of results and future strategy for Banco do Brasil, it’s Associated and Affiliated Companies and Subsidiaries. Although these references and statements reflect the
management’s belief, it also involves imprecision and high difficult risks to be foreseen, consequently, it may conduct to a different result than the one anticipated here. These expectations are highly depended on market conditions, on the Brazilian economic performance, on the sector and the
international market. Banco do Brasil is not responsible for bringing up to date any estimate in this presentation.
For further information access www.bb.com.br/ri

35
Sustainable Regional DevelopmentSustainable Regional DevelopmentSustainable Regional DevelopmentSustainable Regional Development
Strategy for job and income generation in a sustainable way which began in 2003.
Support to environmentally correct, socially fair, economically viable and culturally diversified productive activities.
2004 2005 2006 1H06 1H07
Contracted Amount - R$ million 13.6 105.4 313.8 230.0 477.6 Benefited Families (thousand) 16.8 70.6 230.9 149.1 307.3 Involved Branches 428 1,482 2,502 1,693 3,586 Skilled Employees 1,370 4,062 6,052 5,469 9,788 Served Municipalities 642 1,503 2,788 1,830 3,343 Approved Business Plans 120 375 1,020 710 1,529 Productive Activities 40 70 70 70 70
Recommended