13Lymphoma
Lymphomas originate in lymphatic cells of the lymphoid system. The main types ofcells are T lymphocytes and B lymphocytes (see Figure 12.1). The lymphomas aredivided into Hodgkin lymphoma and non-Hodgkin lymphoma. This division is forhistorical reasons; Hodgkin lymphoma is caused by an abnormal B lymphocyte thatis easily recognized under a microscope. These cells are called Reed–Sternberg cells.There are several subtypes of Hodgkin lymphoma, but they are all malignant.
All other lymphomas are referred to as non-Hodgkin lymphomas. A large number ofdifferent non-Hodgkin lymphomas exist. The most common types are diffuse large B-cell lymphoma (DLBCL), which constitutes about 31% of all lymphomas, and follicularlymphoma (FL), which constitutes about 22% of all lymphomas. The two related dis-eases, chronic lymphocytic leukemia (CLL) and small lymphocytic lymphoma (SLL),together account for 7% of all lymphomas.
DLBCL is curable in less than 50% of patients.Lymphoma is diagnosed by histopathological examination of the cells from a biopsy.
Immunohistochemistry may be required to distinguish between the individual types ofnon-Hodgkin lymphoma. Non-Hodgkin lymphomas are staged according to Ann ArborStaging Systems that divides the lymphomas into four stages according to how muchthey have spread in the body.
The Ann Arbor Staging System describes the spreading of the disease in stagesI–IV. An International Prognostic Index has been developed that takes into accountclinical observations—age, stage, spreading, performance status, and serum lactatedehydrogenase levels. It adds one point for each of the five poor prognostic factors:0–1 means low, 2–3 means medium, and 4–5 means high risk.
The treatment of non-Hodgkin lymphoma follows the standard cancer therapies likeradiation therapy, chemotherapy, immunotherapy, and bone marrow transplantation.
Cancer Diagnostics with DNA Microarrays, By Steen KnudsenCopyright c© 2006 John Wiley & Sons, Inc.
104
MICROARRAY STUDIES OF LYMPHOMA 105
13.1 MICROARRAY STUDIES OF LYMPHOMA
13.1.1 The Stanford Group
Alizadeh et al. (2000) published a Nature paper on microarray analysis of the threemost common types of lymphoma. A special “Lymphochip” was designed, contain-ing 12,069 genes from germinal B-cell library, additional genes from libraries createdfrom specific lymphomas, and genes known to be involved in cancer. In total, 17,856cDNA clones were included on the Lymphochip. This chip was applied to 96 nor-mal and malignant samples including the three most common types of non-Hodgkinlymphomas: diffuse large B-cell lymphoma (DLBCL), follicular lymphoma (FL), andchronic lymphocytic leukemia (CLL). Hierarchical clustering revealed two distinct sub-types of DLBCL, hitherto unrecognized in clinical practice. One subtype was referredto as germinal center B-like DLBCL, the other activated B-like DLBCL. Patients withthe former subtype had a significantly better overall survival than patients with thelatter subtype.
In 2001 the same group published results with a reduced set of six genes measuredby quantitative real-time PCR (Lossos et al., 2001). The performance of the six genesfor classification was validated in a test set and was found to be independent of theInternational Prognostic Index and added to its power.
13.1.2 The Boston Group
Shipp et al. (2002) published a Nature Medicine paper detailing the study of 58 DLBCLand 19 FL patients using the Affymetrix HuGeneFL GeneChip. They built a weighted-voting classifier to classify outcome. In cross-validation tests the classifier produced twogroups of patients with very different five-year overall survival rates (70% versus 12%).The performance was distinct from the International Prognostic Index. They comparedtheir findings to the Alizadeh results. Hierarchical clustering based on some of thesame genes that Alizadeh had used on their Lymphochip resulted in similar divisioninto germinal center B-like and activated B-like clusters. These clusters however, didnot have any significant difference in outcome, suggesting that the association betweenclusters and outcome in the Alizadeh cohort may have been indirect or incidental.Going the other way, however, using the classifier built on the Shipp data to predictoutcome in the Alizadeh data was more successful.
13.1.3 The NIH Group
Rosenwald et al. (2003a) published a large study of 240 DLBCL patients studied withthe Lymphochip. In addition to the previously identified subgroups of DLBCL, theydiscovered a third group and called it type 3 DLBCL. Seventeen genes were selectedfor a classifier of outcome that was shown to be independent of the InternationalPrognostic Index.
In 2003 the group published an update (Wright et al., 2003), where they used aBayes rule predictor of membership of one of the two major DLBCL subgroups. Theyapplied this predictor to the Boston group dataset and found that, with this subgrouping,the two clusters had significant difference in outcome.
106 LYMPHOMA
13.1.4 The NCI Group
Dave et al. (2004) published a study of 191 follicular lymphoma patients using Affy-metrix HG-U133A arrays. An expression pattern associated with the length of survivalwas determined in a training set of 95 specimens. A molecular predictor of survival wasconstructed from these genes and validated in an independent test set of 96 specimens.
The predictor was later criticized by Robert Tibshirani (2005) as being a “fragileresult.” He was not able to find any association between gene expression and survivalin the dataset using standard methods.
13.2 META-CLASSIFICATION OF LYMPHOMA
In the review of breast cancer studies, a meta-classifier based on principal componentswas shown. Joining datasets via their principal components is a supervised process:the class labels of the samples are used both for gene selection and for adjusting thesigns of the components. It is possible, however, to extract and join components in acompletely unsupervised manner, independent of the class relationships of the samples.Independent component analysis (ICA) is very well suited for this. The main differencebetween ICA and PCA is that ICA extracts statistically independent components thatare non-Gaussian, whereas components extracted by PCA can be pure noise (Gaussian).One advantage of ICA in this context is that it is possible to skip the gene selectionstep that is often used before PCA to reduce noise or uninteresting variation. Insteadwe can just eliminate genes that have no variation at all, either because they are notexpressed in any of the samples, or because their expression is constant.
Independent component analysis is computationally much more complex than PCA:it uses iteration from a random starting point to arrive at the final components.
As an example, an ICA-based MetaClassifier was built for predicting how welllymphoma patients respond to chemotherapy.
Three studies have made their raw data available: NIH, Stanford, and Boston. Alldatasets were normalized with logit. For each study the 500 genes with the maximumvariance were extracted and 7 independent components were extracted using the Rimplementation of fastICA (Hyvarinen, 1999), without row normalization. The perfor-mance is not influenced significantly whether 500 or 1000 genes are used or whether5 or 10 components are extracted.
For each sample, the projections on the 7 components were extracted from theestimated mixing matrix A:
X = SA,
where X is the transposed expression matrix of genes versus samples, S contains theindependent components, and A is a linear mixing matrix. We assume that independentcomponents correspond to fundamental biological processes or pathways, and that eachcomponent describes all the genes that participate in one such process or pathway. Theadvantage is that not all genes from that pathway or process are necessary to measurethe activity of the component, making it possible to extract components from differentarray platforms with different subsets of genes and to compare them afterwards.
META-CLASSIFICATION OF LYMPHOMA 107
13.2.1 Matching of Components
The order and sign of the independent components are arbitrary and have to be matchedacross the three datasets. We perform this matching based on the above assumptionthat each component describes the genes that participate in some biological process orpathway, or describes genes that are coordinately expressed. Thus, despite the severelimitations in matching genes between platforms, we should be able to identify similarcomponents because they have more genes in common than dissimilar components. Thegenes for each platform are converted to their RefSeq IDs and matched to the genes onthe other platforms based on this. Now we are able to calculate a correlation coefficientbetween components, because each component is merely a weighted sum of genes. Wecalculate the Pearson correlation coefficient between the weights for those genes thathave been matched across platforms using RefSeq. Those components that have thehighest correlation coefficient are matched. The sign of one component is adjusted ifits highest correlation coefficient to another component is negative. Components thatcannot be matched to components extracted from other platforms with a correlationcoefficient higher than 0.3 or below −0.3 are discarded.
It is important to realize that while the many false negatives and false positivesobtained when matching genes across platforms make it difficult to build a gene-basedclassifier, they do not prevent us from matching components, because all we needis a difference in correlation coefficient. This difference can be detected even in thepresence of false negatives and false positives.
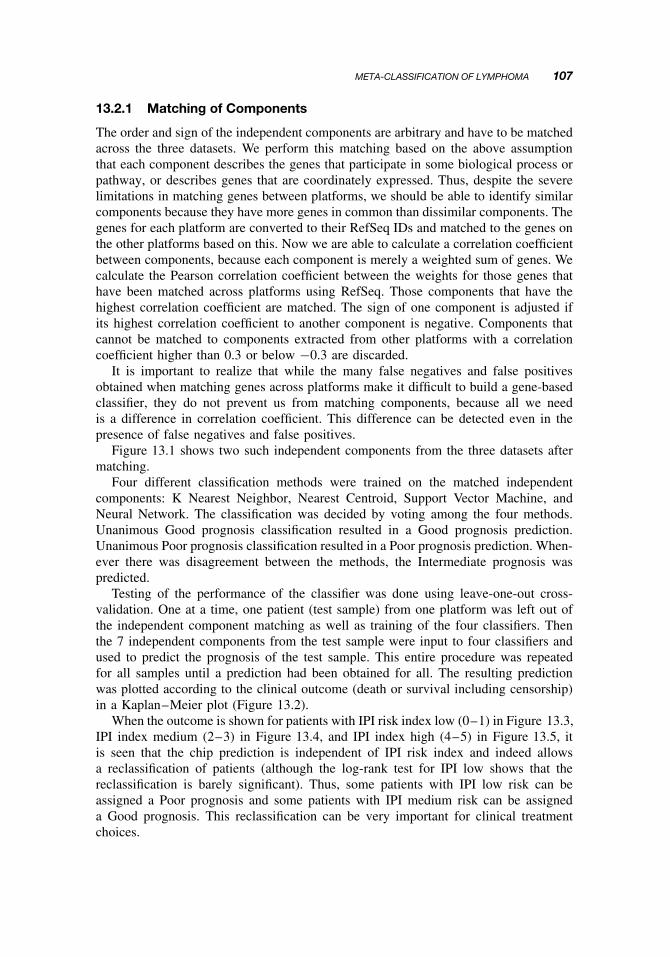
Figure 13.1 shows two such independent components from the three datasets aftermatching.
Four different classification methods were trained on the matched independentcomponents: K Nearest Neighbor, Nearest Centroid, Support Vector Machine, andNeural Network. The classification was decided by voting among the four methods.Unanimous Good prognosis classification resulted in a Good prognosis prediction.Unanimous Poor prognosis classification resulted in a Poor prognosis prediction. When-ever there was disagreement between the methods, the Intermediate prognosis waspredicted.
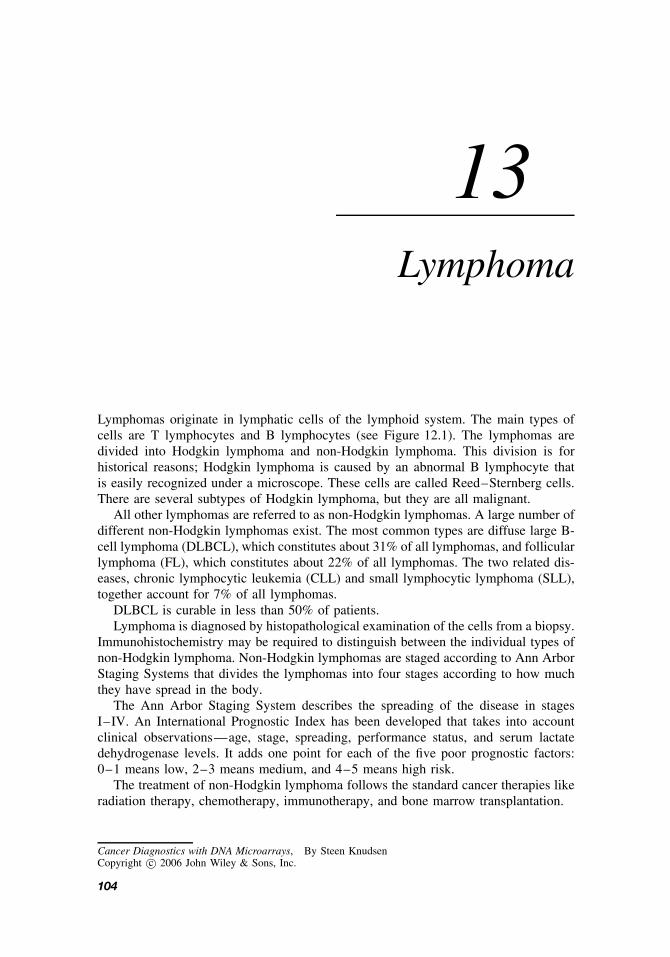
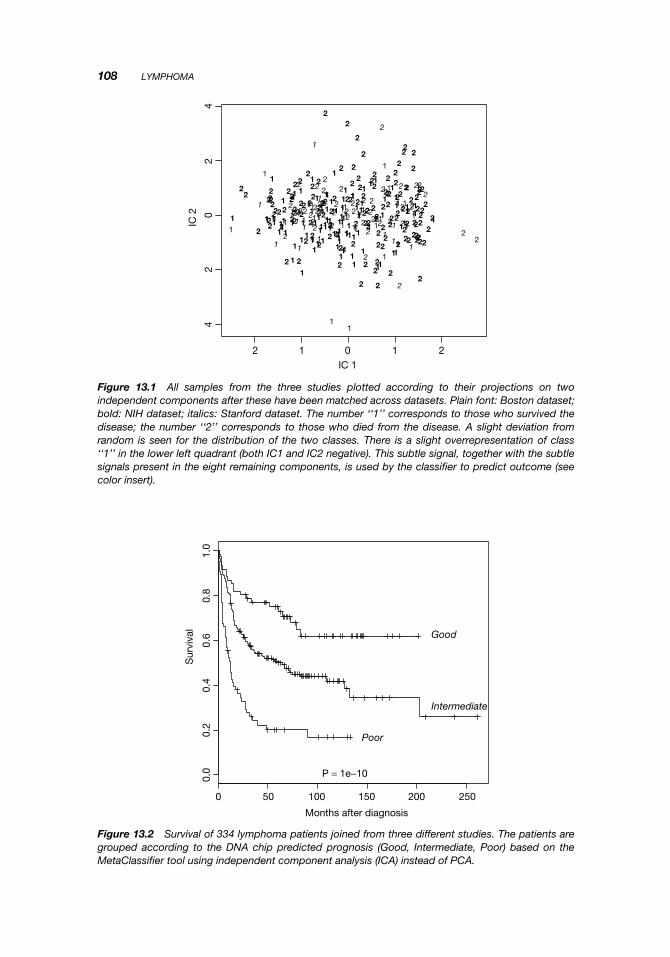
Testing of the performance of the classifier was done using leave-one-out cross-validation. One at a time, one patient (test sample) from one platform was left out ofthe independent component matching as well as training of the four classifiers. Thenthe 7 independent components from the test sample were input to four classifiers andused to predict the prognosis of the test sample. This entire procedure was repeatedfor all samples until a prediction had been obtained for all. The resulting predictionwas plotted according to the clinical outcome (death or survival including censorship)in a Kaplan–Meier plot (Figure 13.2).
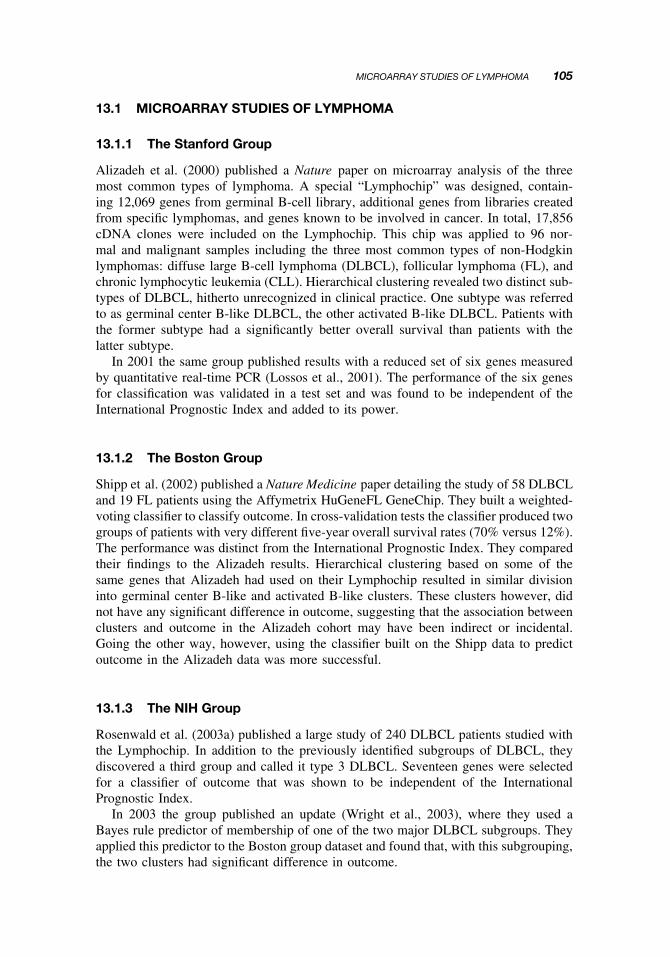
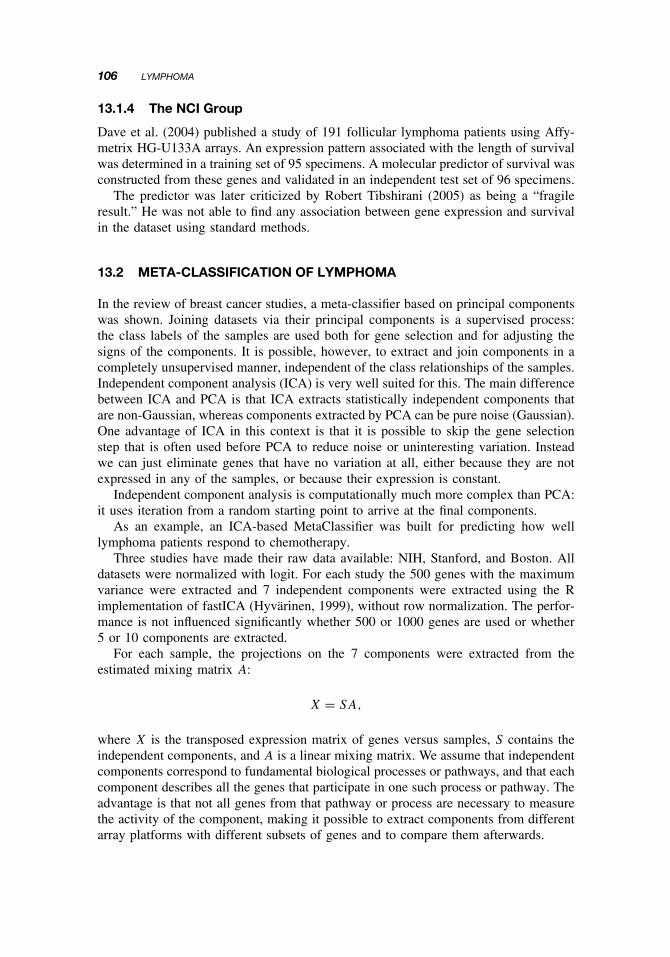
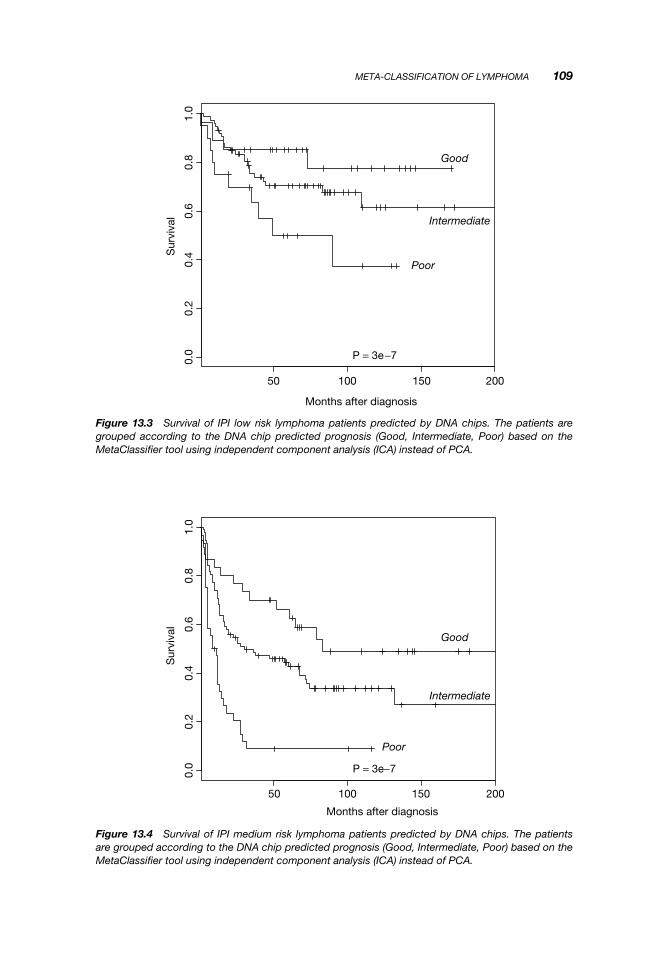
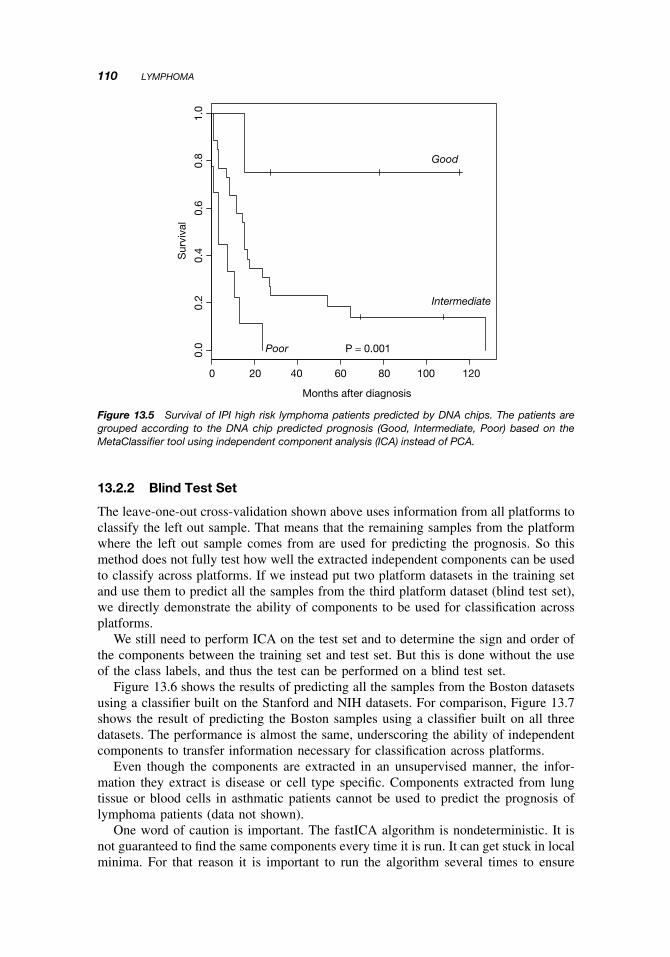
When the outcome is shown for patients with IPI risk index low (0–1) in Figure 13.3,IPI index medium (2–3) in Figure 13.4, and IPI index high (4–5) in Figure 13.5, itis seen that the chip prediction is independent of IPI risk index and indeed allowsa reclassification of patients (although the log-rank test for IPI low shows that thereclassification is barely significant). Thus, some patients with IPI low risk can beassigned a Poor prognosis and some patients with IPI medium risk can be assigneda Good prognosis. This reclassification can be very important for clinical treatmentchoices.
108 LYMPHOMA
1
1
1 1
1
1
1
1
1
1
1
111
1
1
1
11 1
1
1
1
11
1
11
11
2
22
2
22
2
2
222
2
2
22
2
2
2
2
22
2
22
2
22
11
1
1
1
1
1
1
11
1
1
1 1
1
1
1
1
1
111
1 1
11
1
11
1
1
1
1
1
11
1
1
11
11
1
1
111
11
1
1
1
11
1
1
1
1
1
1
1
1
1
1
1
1
1
1
11
1
1
1
11
1
1
11
11
1
1
1
1
11
1
1
1 1
1
1
1
1 1
11
11 1
12
22
22
2
22
22
2
2
2
2
2
22
2
22
22
2
2
22
2
2
2
2222
2
2
2
22
2
22
2
2
2
2
22 2
2
2
2
2
2 2
22
2
2
2
2
2
22
2
2
2
2
2
2
2
22
2
22
22
2
2
2 2
22
22
2
2
2
2
2
2
2
2 2
22
222
22
2
2
2
2
2
22
22
2
2
2
2
2
2
2
2
22
2
2
2 2
2
22
2
2
2
2
2
2
2
2
2
2
22
2
2 22
1
11
1
22
1
2
2
11
2
1
1
1 2
1
2 2
1
2
2
212
12
1
2
1
212
2
42
02
4
2 1 0IC 1
IC 2
1 2
Figure 13.1 All samples from the three studies plotted according to their projections on twoindependent components after these have been matched across datasets. Plain font: Boston dataset;bold: NIH dataset; italics: Stanford dataset. The number ‘‘1’’ corresponds to those who survived thedisease; the number ‘‘2’’ corresponds to those who died from the disease. A slight deviation fromrandom is seen for the distribution of the two classes. There is a slight overrepresentation of class‘‘1’’ in the lower left quadrant (both IC1 and IC2 negative). This subtle signal, together with the subtlesignals present in the eight remaining components, is used by the classifier to predict outcome (seecolor insert).
0 50 100 150 200 250
0.0
0.2
0.4
0.6
0.8
1.0
Months after diagnosis
Sur
viva
l
Good
Intermediate
Poor
P = 1e−10
Figure 13.2 Survival of 334 lymphoma patients joined from three different studies. The patients aregrouped according to the DNA chip predicted prognosis (Good, Intermediate, Poor) based on theMetaClassifier tool using independent component analysis (ICA) instead of PCA.
META-CLASSIFICATION OF LYMPHOMA 109
50 100 150 200
0.0
0.2
0.4
0.6
0.8
1.0
Months after diagnosis
Sur
viva
lGood
Intermediate
Poor
P = 3e−7
Figure 13.3 Survival of IPI low risk lymphoma patients predicted by DNA chips. The patients aregrouped according to the DNA chip predicted prognosis (Good, Intermediate, Poor) based on theMetaClassifier tool using independent component analysis (ICA) instead of PCA.
50 100 150 200
0.0
0.2
0.4
0.6
0.8
1.0
Months after diagnosis
Sur
viva
l
Good
Intermediate
Poor
P = 3e−7
Figure 13.4 Survival of IPI medium risk lymphoma patients predicted by DNA chips. The patientsare grouped according to the DNA chip predicted prognosis (Good, Intermediate, Poor) based on theMetaClassifier tool using independent component analysis (ICA) instead of PCA.
110 LYMPHOMA
0 20 40 60 80 100 120
0.0
0.2
0.4
0.6
0.8
1.0
Months after diagnosis
Sur
viva
l
Good
Intermediate
Poor P = 0.001
Figure 13.5 Survival of IPI high risk lymphoma patients predicted by DNA chips. The patients aregrouped according to the DNA chip predicted prognosis (Good, Intermediate, Poor) based on theMetaClassifier tool using independent component analysis (ICA) instead of PCA.
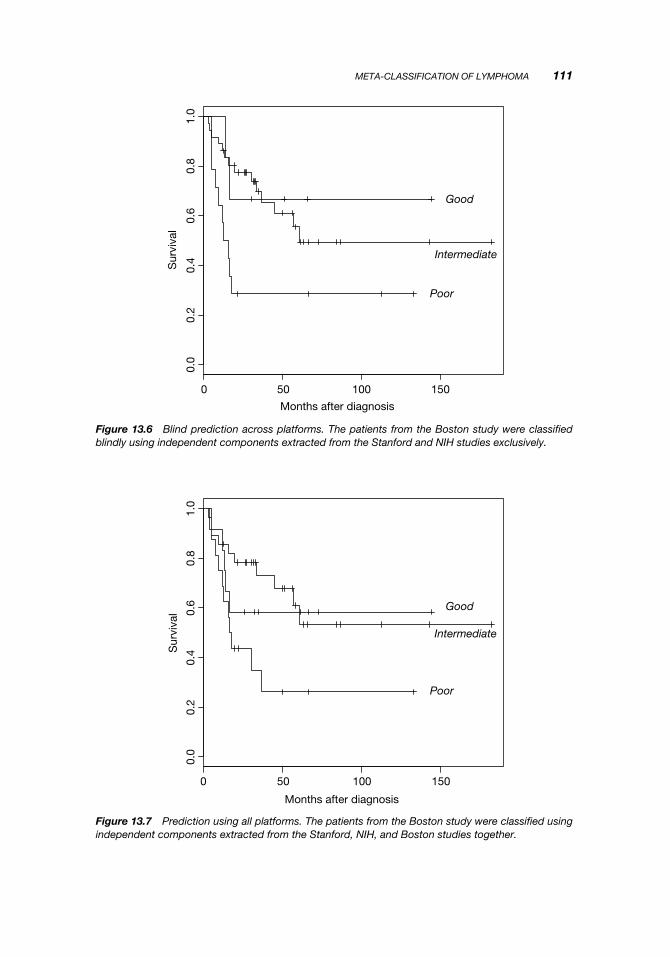
13.2.2 Blind Test Set
The leave-one-out cross-validation shown above uses information from all platforms toclassify the left out sample. That means that the remaining samples from the platformwhere the left out sample comes from are used for predicting the prognosis. So thismethod does not fully test how well the extracted independent components can be usedto classify across platforms. If we instead put two platform datasets in the training setand use them to predict all the samples from the third platform dataset (blind test set),we directly demonstrate the ability of components to be used for classification acrossplatforms.
We still need to perform ICA on the test set and to determine the sign and order ofthe components between the training set and test set. But this is done without the useof the class labels, and thus the test can be performed on a blind test set.
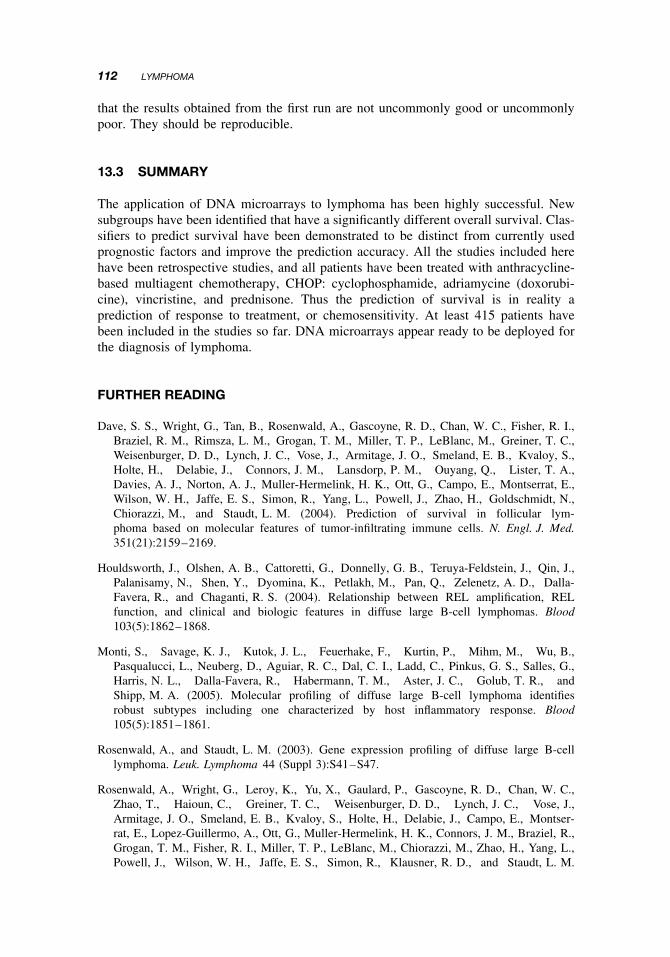
Figure 13.6 shows the results of predicting all the samples from the Boston datasetsusing a classifier built on the Stanford and NIH datasets. For comparison, Figure 13.7shows the result of predicting the Boston samples using a classifier built on all threedatasets. The performance is almost the same, underscoring the ability of independentcomponents to transfer information necessary for classification across platforms.
Even though the components are extracted in an unsupervised manner, the infor-mation they extract is disease or cell type specific. Components extracted from lungtissue or blood cells in asthmatic patients cannot be used to predict the prognosis oflymphoma patients (data not shown).
One word of caution is important. The fastICA algorithm is nondeterministic. It isnot guaranteed to find the same components every time it is run. It can get stuck in localminima. For that reason it is important to run the algorithm several times to ensure
META-CLASSIFICATION OF LYMPHOMA 111
0 50 100 150
0.0
0.2
0.4
0.6
0.8
1.0
Months after diagnosis
Sur
viva
l
Good
Intermediate
Poor
Figure 13.6 Blind prediction across platforms. The patients from the Boston study were classifiedblindly using independent components extracted from the Stanford and NIH studies exclusively.
0 50 100 150
0.0
0.2
0.4
0.6
0.8
1.0
Months after diagnosis
Sur
viva
l Good
Intermediate
Poor
Figure 13.7 Prediction using all platforms. The patients from the Boston study were classified usingindependent components extracted from the Stanford, NIH, and Boston studies together.
112 LYMPHOMA
that the results obtained from the first run are not uncommonly good or uncommonlypoor. They should be reproducible.
13.3 SUMMARY
The application of DNA microarrays to lymphoma has been highly successful. Newsubgroups have been identified that have a significantly different overall survival. Clas-sifiers to predict survival have been demonstrated to be distinct from currently usedprognostic factors and improve the prediction accuracy. All the studies included herehave been retrospective studies, and all patients have been treated with anthracycline-based multiagent chemotherapy, CHOP: cyclophosphamide, adriamycine (doxorubi-cine), vincristine, and prednisone. Thus the prediction of survival is in reality aprediction of response to treatment, or chemosensitivity. At least 415 patients havebeen included in the studies so far. DNA microarrays appear ready to be deployed forthe diagnosis of lymphoma.
FURTHER READING
Dave, S. S., Wright, G., Tan, B., Rosenwald, A., Gascoyne, R. D., Chan, W. C., Fisher, R. I.,Braziel, R. M., Rimsza, L. M., Grogan, T. M., Miller, T. P., LeBlanc, M., Greiner, T. C.,Weisenburger, D. D., Lynch, J. C., Vose, J., Armitage, J. O., Smeland, E. B., Kvaloy, S.,Holte, H., Delabie, J., Connors, J. M., Lansdorp, P. M., Ouyang, Q., Lister, T. A.,Davies, A. J., Norton, A. J., Muller-Hermelink, H. K., Ott, G., Campo, E., Montserrat, E.,Wilson, W. H., Jaffe, E. S., Simon, R., Yang, L., Powell, J., Zhao, H., Goldschmidt, N.,Chiorazzi, M., and Staudt, L. M. (2004). Prediction of survival in follicular lym-phoma based on molecular features of tumor-infiltrating immune cells. N. Engl. J. Med.351(21):2159–2169.
Houldsworth, J., Olshen, A. B., Cattoretti, G., Donnelly, G. B., Teruya-Feldstein, J., Qin, J.,Palanisamy, N., Shen, Y., Dyomina, K., Petlakh, M., Pan, Q., Zelenetz, A. D., Dalla-Favera, R., and Chaganti, R. S. (2004). Relationship between REL amplification, RELfunction, and clinical and biologic features in diffuse large B-cell lymphomas. Blood103(5):1862–1868.
Monti, S., Savage, K. J., Kutok, J. L., Feuerhake, F., Kurtin, P., Mihm, M., Wu, B.,Pasqualucci, L., Neuberg, D., Aguiar, R. C., Dal, C. I., Ladd, C., Pinkus, G. S., Salles, G.,Harris, N. L., Dalla-Favera, R., Habermann, T. M., Aster, J. C., Golub, T. R., andShipp, M. A. (2005). Molecular profiling of diffuse large B-cell lymphoma identifiesrobust subtypes including one characterized by host inflammatory response. Blood105(5):1851–1861.
Rosenwald, A., and Staudt, L. M. (2003). Gene expression profiling of diffuse large B-celllymphoma. Leuk. Lymphoma 44 (Suppl 3):S41–S47.
Rosenwald, A., Wright, G., Leroy, K., Yu, X., Gaulard, P., Gascoyne, R. D., Chan, W. C.,Zhao, T., Haioun, C., Greiner, T. C., Weisenburger, D. D., Lynch, J. C., Vose, J.,Armitage, J. O., Smeland, E. B., Kvaloy, S., Holte, H., Delabie, J., Campo, E., Montser-rat, E., Lopez-Guillermo, A., Ott, G., Muller-Hermelink, H. K., Connors, J. M., Braziel, R.,Grogan, T. M., Fisher, R. I., Miller, T. P., LeBlanc, M., Chiorazzi, M., Zhao, H., Yang, L.,Powell, J., Wilson, W. H., Jaffe, E. S., Simon, R., Klausner, R. D., and Staudt, L. M.

FURTHER READING 113
(2003). Molecular diagnosis of primary mediastinal B cell lymphoma identifies a clinicallyfavorable subgroup of diffuse large B cell lymphoma related to Hodgkin lymphoma. J. Exp.Med. 198(6):851–862.
Rosenwald, A., Wright, G., Wiestner, A., Chan, W. C., Connors, J. M., Campo, E., Gas-coyne, R. D., Grogan, T. M., Muller-Hermelink, H. K., Smeland, E. B., Chiorazzi, M.,Giltnane, J. M., Hurt, E. M., Zhao, H., Averett, L., Henrickson, S., Yang, L., Pow-ell, J., Wilson, W. H., Jaffe, E. S., Simon, R., Klausner, R. D., Montserrat, E., Bosch, F.,Greiner, T. C., Weisenburger, D. D., Sanger, W. G., Dave, B. J., Lynch, J. C., Vose, J.,Armitage, J. O., Fisher, R. I., Miller, T. P., LeBlanc, M., Ott, G., Kvaloy, S., Holte, H.,Delabie, J., and Staudt, L. M. (2003). The proliferation gene expression signature is a quan-titative integrator of oncogenic events that predicts survival in mantle cell lymphoma. CancerCell 3(2):185–197.
Savage, K. J., Monti, S., Kutok, J. L., Cattoretti, G., Neuberg, D., De Leval L., Kurtin, P.,Dal Cin P., Ladd, C., Feuerhake, F., Aguiar, R. C., Li, S., Salles, G., Berger, F., Jing, W.,Pinkus, G. S., Habermann, T., Dalla-Favera, R., Harris, N. L., Aster, J. C., Golub, T. R., andShipp, M. A. (2003). The molecular signature of mediastinal large B-cell lymphoma differsfrom that of other diffuse large B-cell lymphomas and shares features with classical Hodgkinlymphoma. Blood 102(12):3871–3879.
Valet, G. K., and Hoeffkes, H. G. (2004). Data pattern analysis for the individualised prether-apeutic identification of high-risk diffuse large B-cell lymphoma (DLBCL) patients bycytomics. Cytometry 59A(2):232–236.
Recommended