CCJ-123-DASAR PENGEMBANGAN PERANGKAT
LUNAK (PERTEMUAN-4)
Dosen Pengampu :
5165-Kundang K Juman,Prodi Teknik Informatika Fakultas Ilmu Komputer

ChapterWriting and PresentingThe Systems Proposal
Systems Analysis and Design
Kendall and Kendall
Fifth Edition
Kendall & Kendall Copyright © 2002 by Prentice Hall, Inc. 14-3
Major Topics
Systems proposal
Using tables
Using graphs
Types of graphs
Using figures
Guidelines for presenting
Oral presenting

Kendall & Kendall Copyright © 2002 by Prentice Hall, Inc. 14-4
The Systems Proposal
Through the use of effectively organizing the content, writing in a professional style, and orally presenting the proposal in an informative way, the analyst can create a successful systems proposal

Kendall & Kendall Copyright © 2002 by Prentice Hall, Inc. 14-5
Items in the Systems Proposal Part 1
When preparing a systems proposal, systems analysts should arrange the following items in order:
Cover letter
Title page of project
Table of contents
Executive summary (including recommendation)
Kendall & Kendall Copyright © 2002 by Prentice Hall, Inc. 14-6
Items in the Systems Proposal Part 2
Outline of systems study with appropriate documentation
Detailed results of the systems study
Systems alternatives (three or four possible solutions)
Systems analysts' recommendations
Summary
Kendall & Kendall Copyright © 2002 by Prentice Hall, Inc. 14-7
Items in the Systems Proposal Part 3
Appendices
Assorted documentation
Summary of phases
Correspondence
Other material as needed
Kendall & Kendall Copyright © 2002 by Prentice Hall, Inc. 14-8
References
When writing a systems proposal, keep references to a minimum and do not use footnotes
Use examples, illustrations, diagrams, tables, figures, and graphs to support main points of the proposal, where appropriate
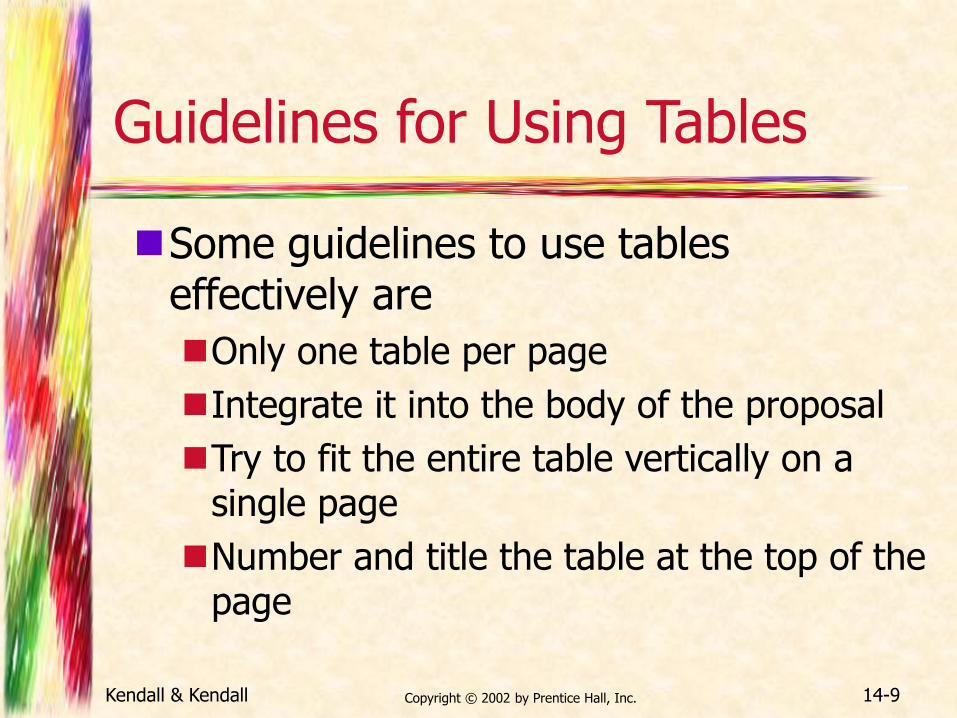
Kendall & Kendall Copyright © 2002 by Prentice Hall, Inc. 14-9
Guidelines for Using Tables
Some guidelines to use tables effectively are
Only one table per page
Integrate it into the body of the proposal
Try to fit the entire table vertically on a single page
Number and title the table at the top of the page
Kendall & Kendall Copyright © 2002 by Prentice Hall, Inc. 14-10
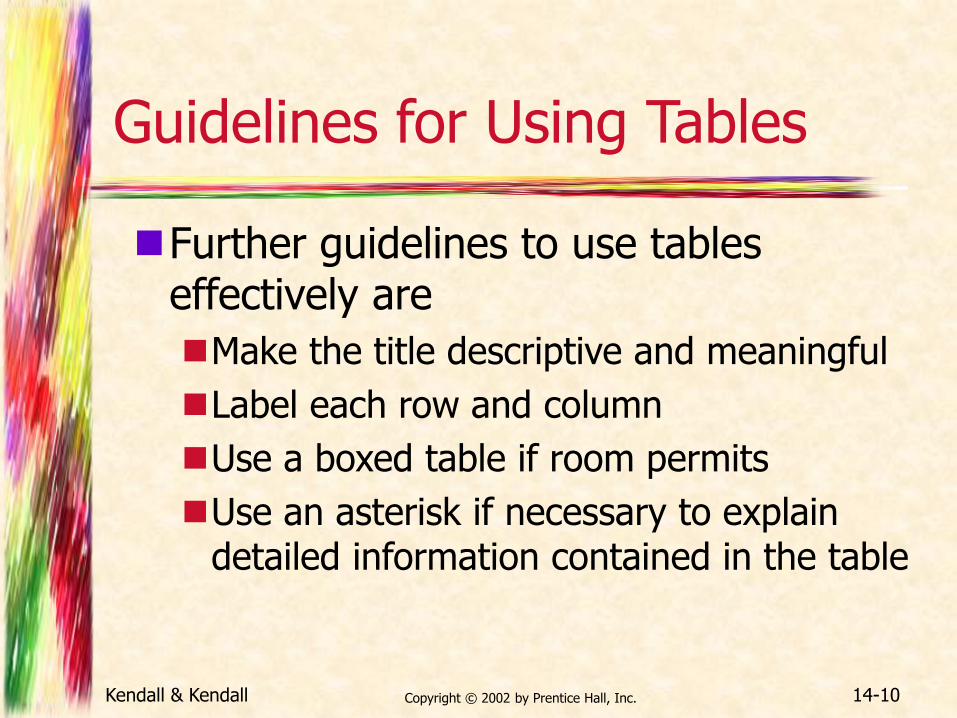
Guidelines for Using Tables
Further guidelines to use tables effectively are
Make the title descriptive and meaningful
Label each row and column
Use a boxed table if room permits
Use an asterisk if necessary to explain detailed information contained in the table
Kendall & Kendall Copyright © 2002 by Prentice Hall, Inc. 14-11
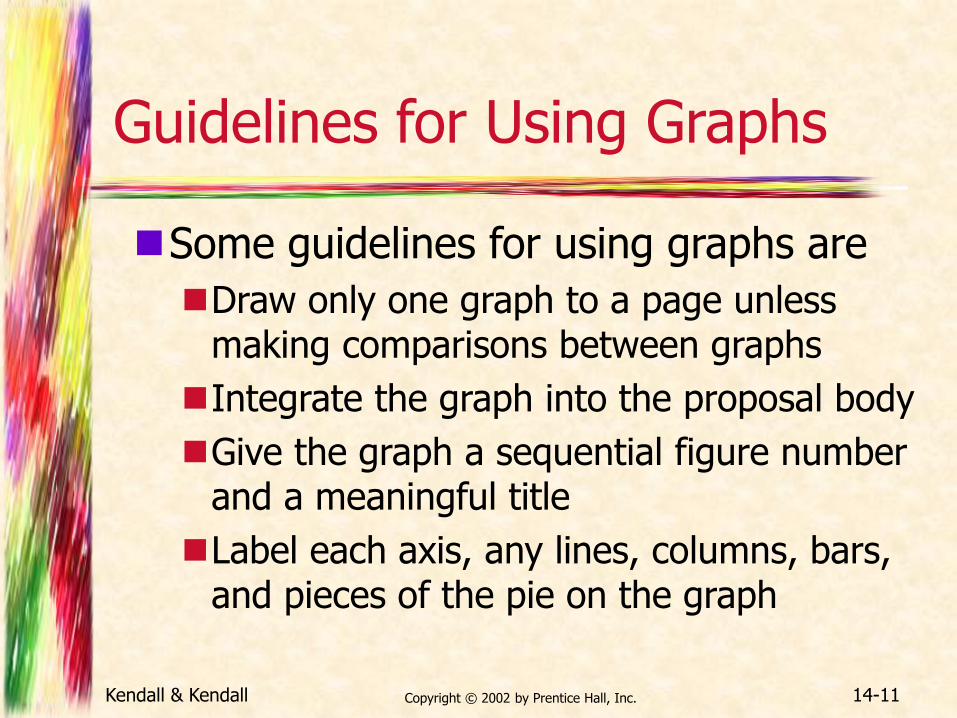
Guidelines for Using Graphs
Some guidelines for using graphs are
Draw only one graph to a page unless making comparisons between graphs
Integrate the graph into the proposal body
Give the graph a sequential figure number and a meaningful title
Label each axis, any lines, columns, bars, and pieces of the pie on the graph
Kendall & Kendall Copyright © 2002 by Prentice Hall, Inc. 14-12
Guidelines for Using Graphs
Further guidelines for using graphs are
Include a key to indicate differently colored lines, shaded bars, or crosshatched areas
Kendall & Kendall Copyright © 2002 by Prentice Hall, Inc. 14-13
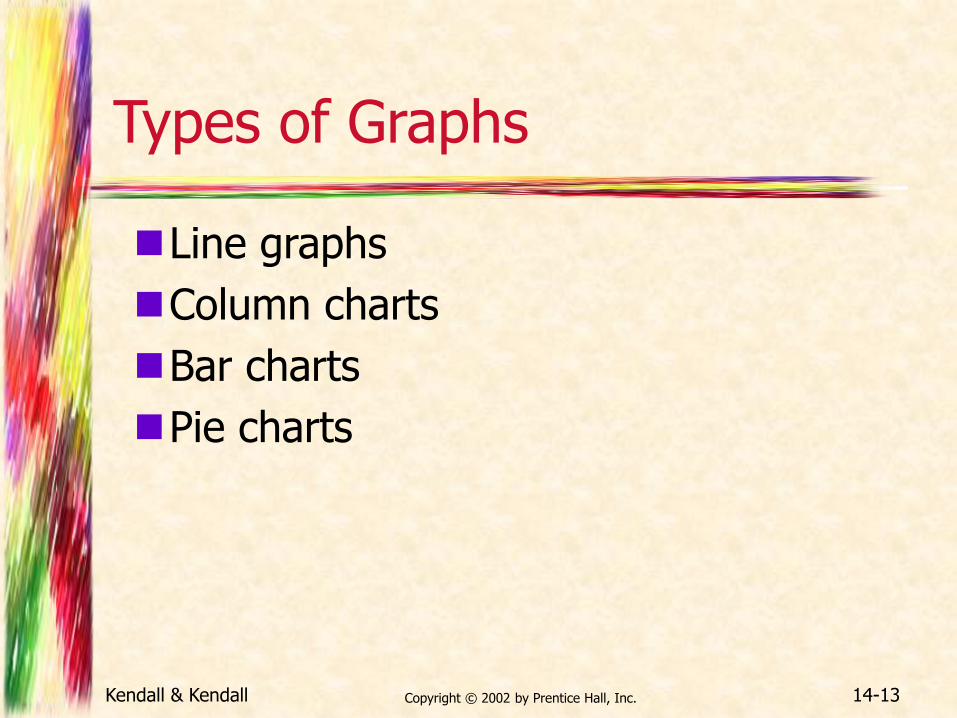
Types of Graphs
Line graphs
Column charts
Bar charts
Pie charts
Kendall & Kendall Copyright © 2002 by Prentice Hall, Inc. 14-14
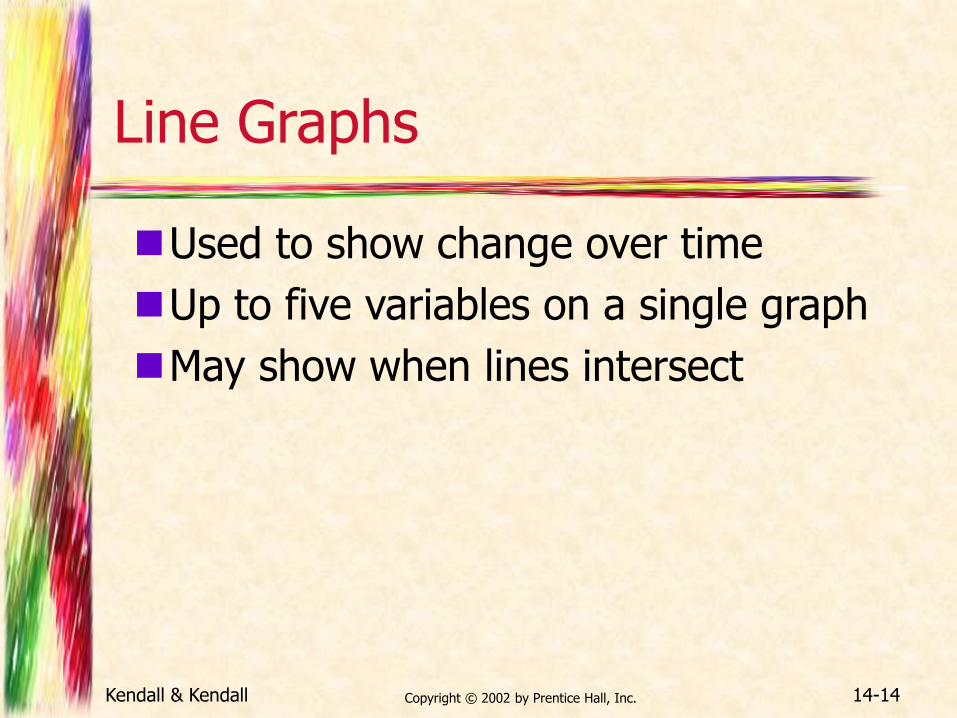
Line Graphs
Used to show change over time
Up to five variables on a single graph
May show when lines intersect
Kendall & Kendall Copyright © 2002 by Prentice Hall, Inc. 14-15
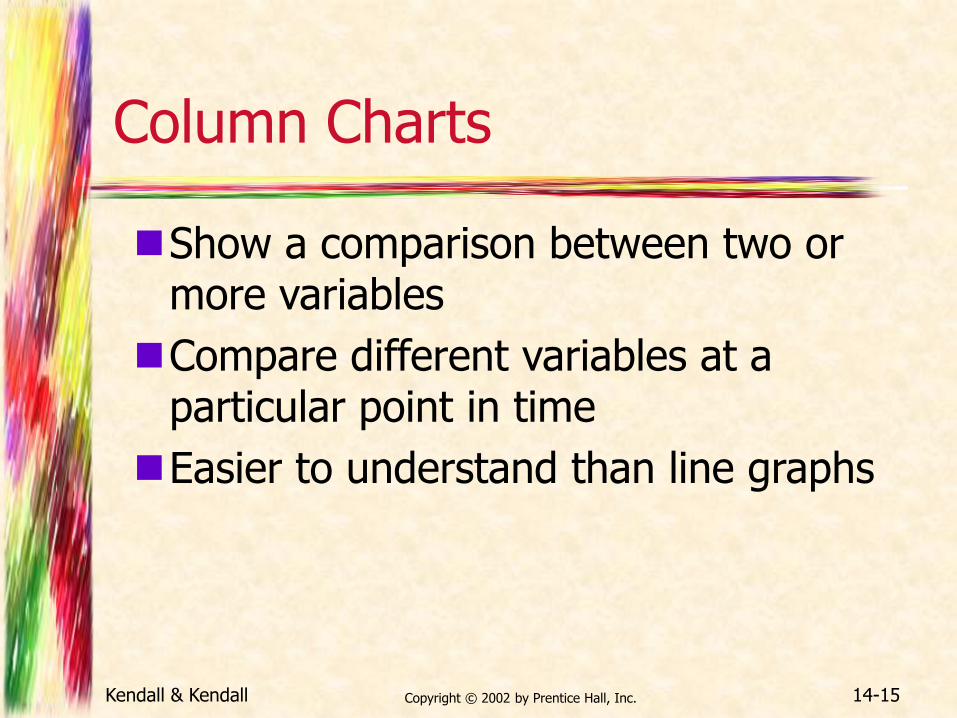
Column Charts
Show a comparison between two or more variables
Compare different variables at a particular point in time
Easier to understand than line graphs
Kendall & Kendall Copyright © 2002 by Prentice Hall, Inc. 14-16
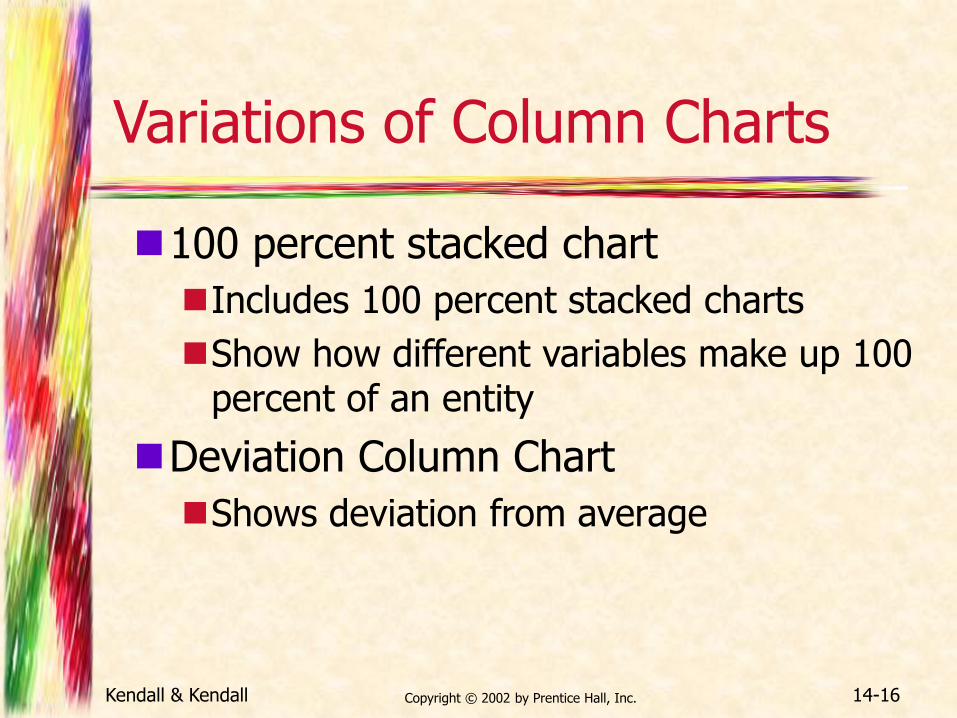
Variations of Column Charts
100 percent stacked chart
Includes 100 percent stacked charts
Show how different variables make up 100 percent of an entity
Deviation Column Chart
Shows deviation from average
Kendall & Kendall Copyright © 2002 by Prentice Hall, Inc. 14-17
Bar Charts
Used to show one or more variables within certain classes or categories during a specific time period
May be sorted or organized by
Alphabetical
Numerical
Geographical or
Progressive order
Kendall & Kendall Copyright © 2002 by Prentice Hall, Inc. 14-18
Pie Charts
Used to show how 100 percent of a commodity is divided at a particular point in time
Easier to read than 100 percent stacked column charts or 100 percent subdivided bar charts
Disadvantage is they take a lot of room on the page

Kendall & Kendall Copyright © 2002 by Prentice Hall, Inc. 14-19
Guidelines for Using Figures
Guidelines to use figures effectively are
Whenever possible integrate the figure into the body of the proposal itself
Always introduce figures in the text before they appear
Always interpret figures in words
Title all figures, label each axis, provide legends where necessary
Kendall & Kendall Copyright © 2002 by Prentice Hall, Inc. 14-20
Guidelines for Using Figures
Further guidelines for using figures are
Use more than one figure if necessary
The visual should not become cluttered

Kendall & Kendall Copyright © 2002 by Prentice Hall, Inc. 14-21
Format of the Presentation
To make presentations more persuasive, the systems analysts may use
White space
Headings and subheadings
Relevant references
Appendices
Kendall & Kendall Copyright © 2002 by Prentice Hall, Inc. 14-22
Presentation Software
Presentation software allows the analyst to use a microcomputer for a slide show
Enhance the presentation by using
Clip art
Video clips
Sound
Adding or deleting presentation slides for the audience and length of time available
Kendall & Kendall Copyright © 2002 by Prentice Hall, Inc. 14-23
Guidelines for the Use of Presentation Software
Guidelines for the use of presentation software are
Use software templates
Use a combination of graphics and text to communicate
Keep each slide clean and simple
Use color in a meaningful way
Use clip art to enhance the text and add humor
Kendall & Kendall Copyright © 2002 by Prentice Hall, Inc. 14-24
Guidelines for the Use of Presentation Software
Further guidelines for the use of presentation software are
Use sound to reinforce the presentation
Use a multimedia approach
Plug in a laptop computer to avoid the computer going into ‘sleep mode’
Avoid too many contrasting transitions
Kendall & Kendall Copyright © 2002 by Prentice Hall, Inc. 14-25
Oral Presentations
When delivering the oral presentation, keep in mind the following facts:
Project loudly enough so that the audience can hear you
Look at each person in the audience as you speak
Make visuals large enough so that the audience can see them

Kendall & Kendall Copyright © 2002 by Prentice Hall, Inc. 14-26
Oral Presentations
Principles of delivery, continued
Use gestures that are natural to your conversational style
Introduce and conclude your talk confidently

Kendall & Kendall Copyright © 2002 by Prentice Hall, Inc. 14-27
Overcoming Anxiety and Nervousness
To overcome anxiety and nervousness
Be yourself
Be prepared
Speak naturally
Breathe deeply before your presentation
Recommended