China in the Global Economy:The last ten years and the next
Ted H. ChuChief Economist
General Motors CompanyMay 12, 2010
GIC Annual Monetary & Trade Conference
Ted Chu, China Next Decade 5‐12‐2010 1
2
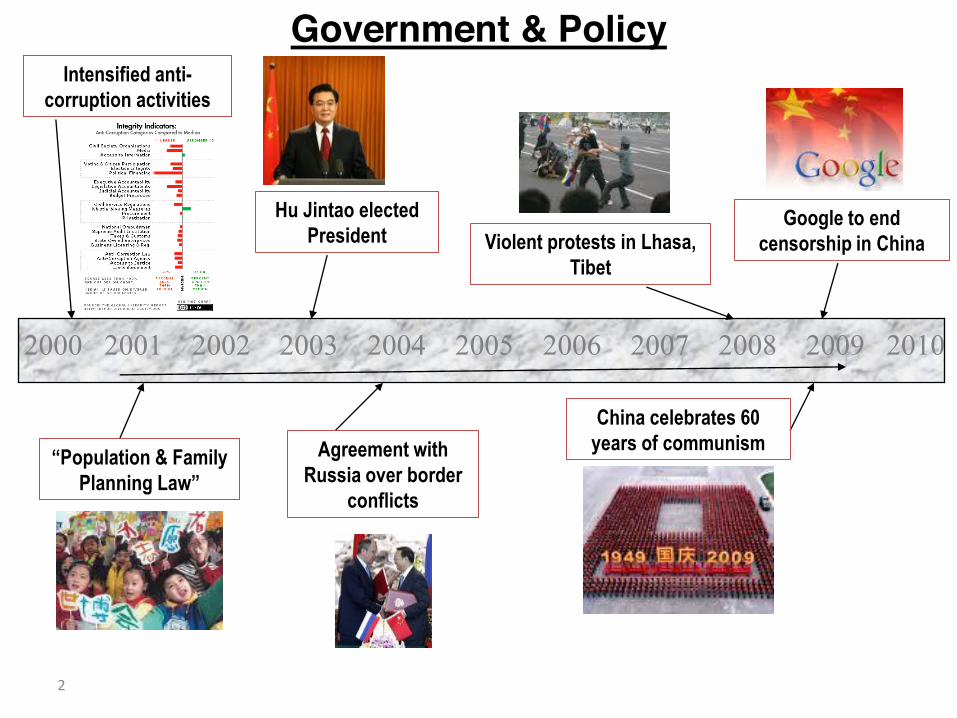
Government & PolicyIntensified anti
corruption activities
2000 2001 2002 2003 2004 2005 2006 2007 2008 2009 2010
“Population & Family Planning Law”
Hu Jintao elected President
Agreement with Russia over border
conflicts
Violent protests in Lhasa, Tibet
China celebrates 60 years of communism
Google to end censorship in China
3
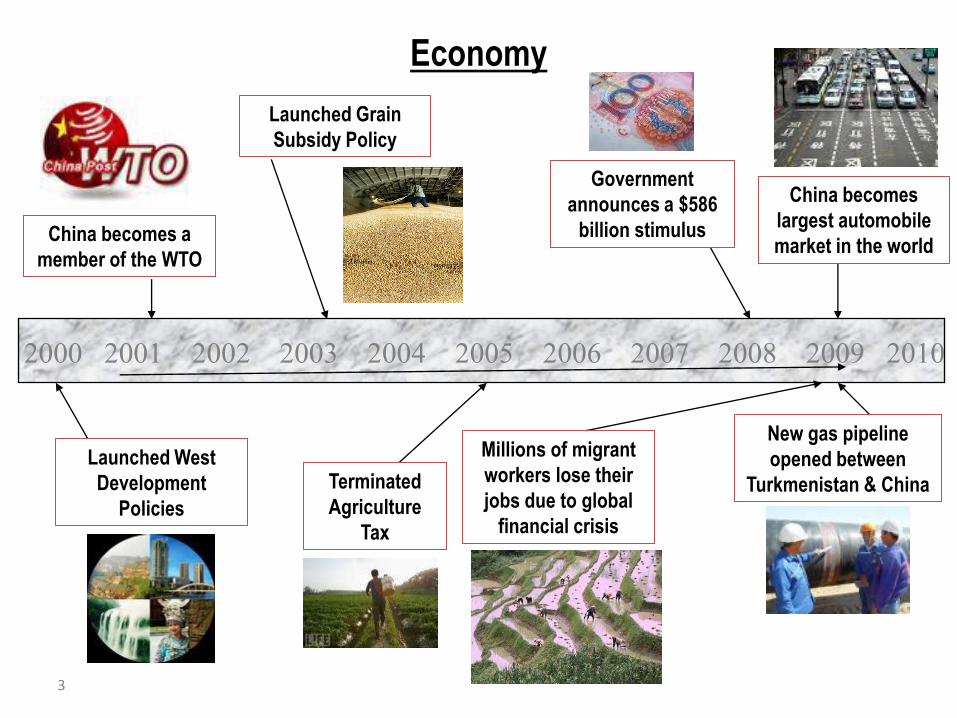
Economy
China becomes a member of the WTO
New gas pipeline opened between
Turkmenistan & China
China becomes largest automobile market in the world
Millions of migrant workers lose their jobs due to global
financial crisis
Government announces a $586
billion stimulus
2000 2001 2002 2003 2004 2005 2006 2007 2008 2009 2010
Launched Grain Subsidy Policy
Terminated Agriculture
Tax
Launched West Development
Policies
4
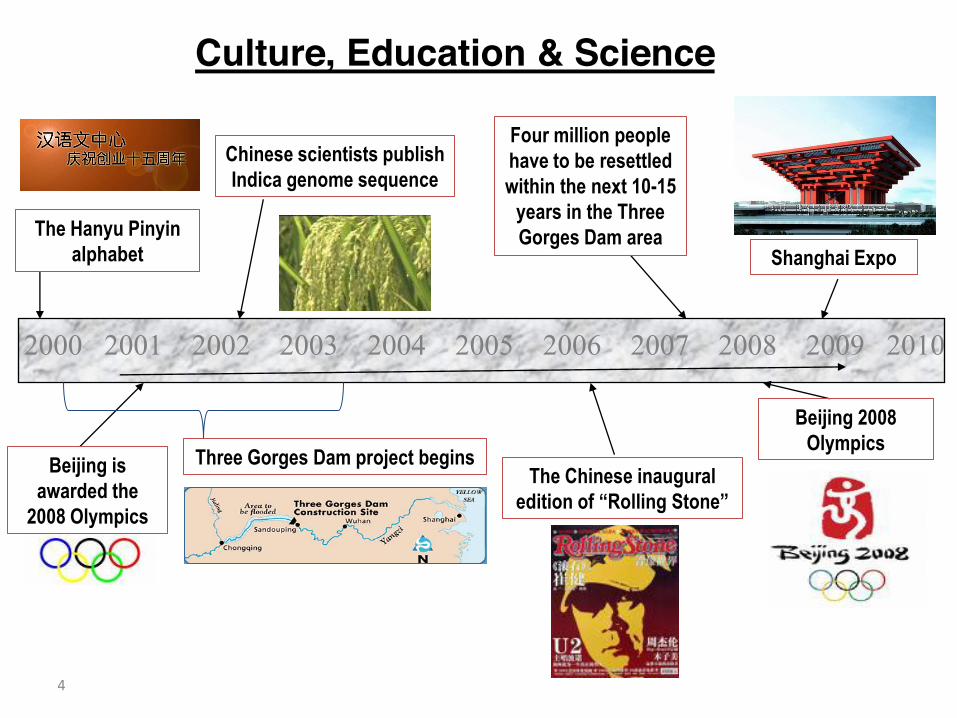
Culture, Education & Science
Shanghai ExpoThe Hanyu Pinyin
alphabet
Chinese scientists publish Indica genome sequence
Beijing is awarded the
2008 Olympics
Beijing 2008 Olympics
The Chinese inaugural edition of “Rolling Stone”
Three Gorges Dam project begins
Four million people have to be resettled within the next 1015
years in the Three Gorges Dam area
2000 2001 2002 2003 2004 2005 2006 2007 2008 2009 2010
5
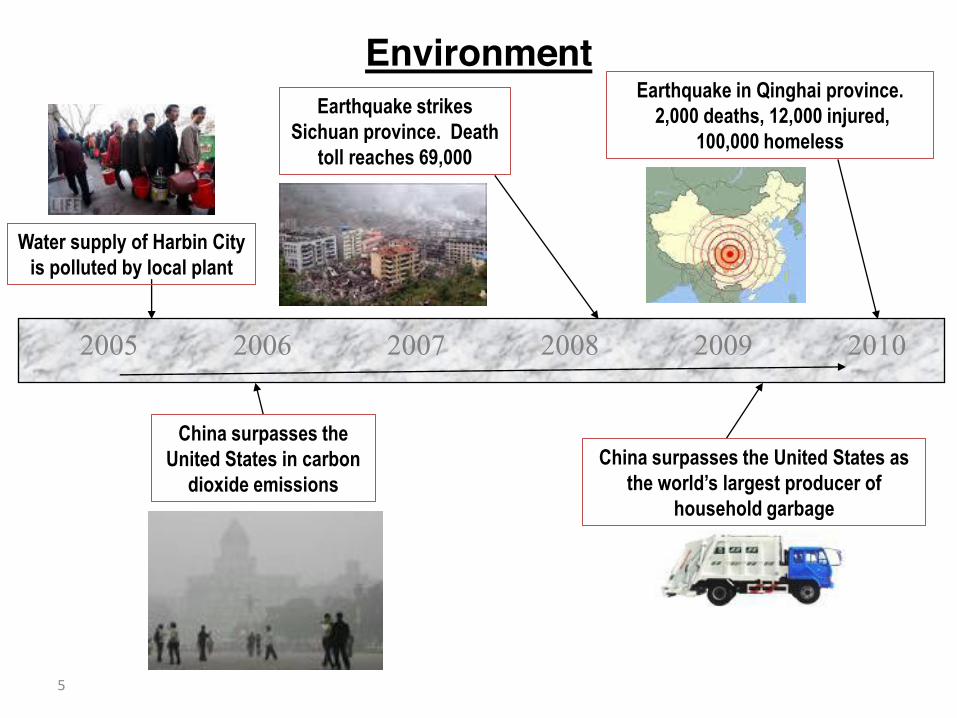
Environment
Water supply of Harbin City is polluted by local plant
China surpasses the United States in carbon
dioxide emissions
Earthquake strikes Sichuan province. Death
toll reaches 69,000
China surpasses the United States as the world’s largest producer of
household garbage
Earthquake in Qinghai province. 2,000 deaths, 12,000 injured,
100,000 homeless
2005 2006 2007 2008 2009 2010
6
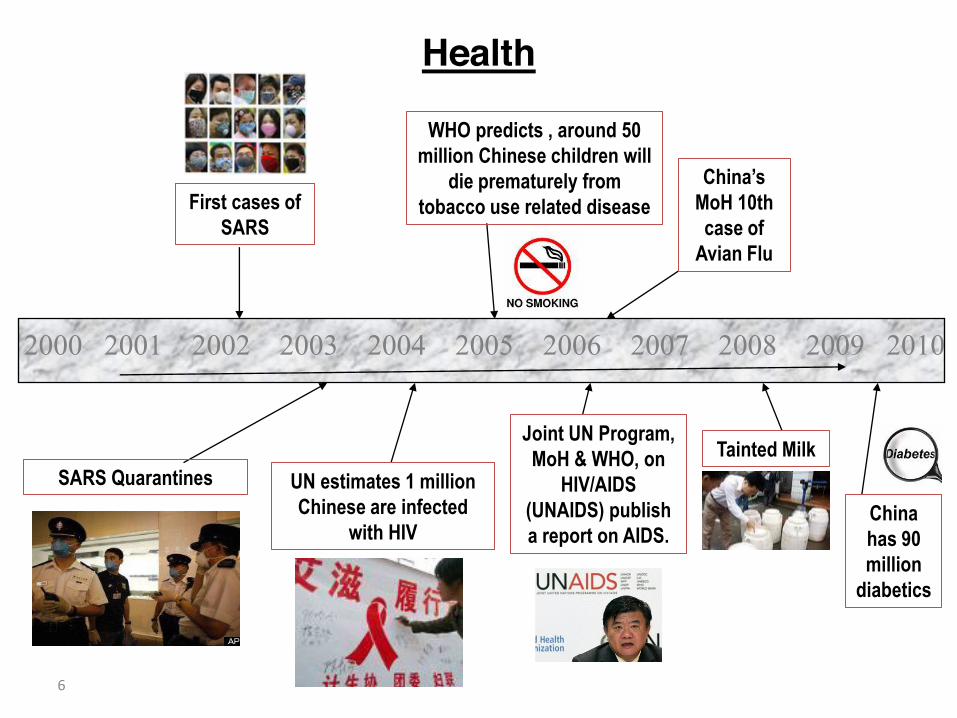
Health
First cases of SARS
SARS Quarantines UN estimates 1 million Chinese are infected
with HIV
WHO predicts , around 50 million Chinese children will
die prematurely from tobacco use related disease
Joint UN Program, MoH & WHO, on
HIV/AIDS (UNAIDS) publish a report on AIDS.
China’s MoH 10th case of
Avian Flu
Tainted Milk
China has 90 million
diabetics
2000 2001 2002 2003 2004 2005 2006 2007 2008 2009 2010
7
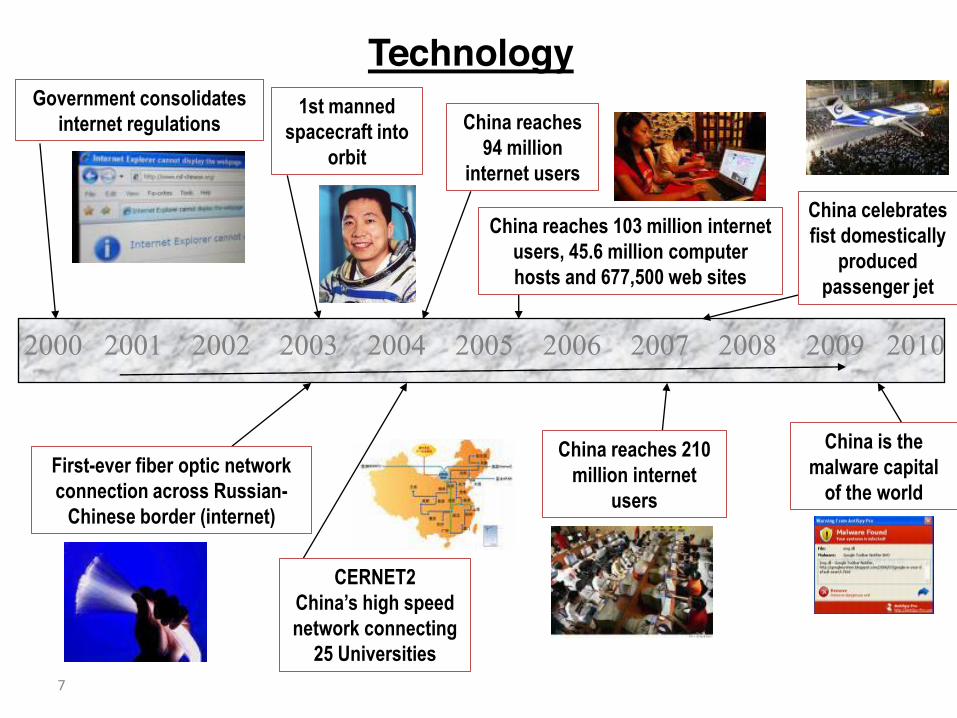
TechnologyGovernment consolidates
internet regulations
Firstever fiber optic network connection across Russian
Chinese border (internet)
1st manned spacecraft into
orbit
CERNET2 China’s high speed network connecting
25 Universities
China reaches 94 million
internet users
China reaches 103 million internet users, 45.6 million computer hosts and 677,500 web sites
China reaches 210 million internet
users
China is the malware capital
of the world
China celebrates fist domestically
produced passenger jet
2000 2001 2002 2003 2004 2005 2006 2007 2008 2009 2010
8
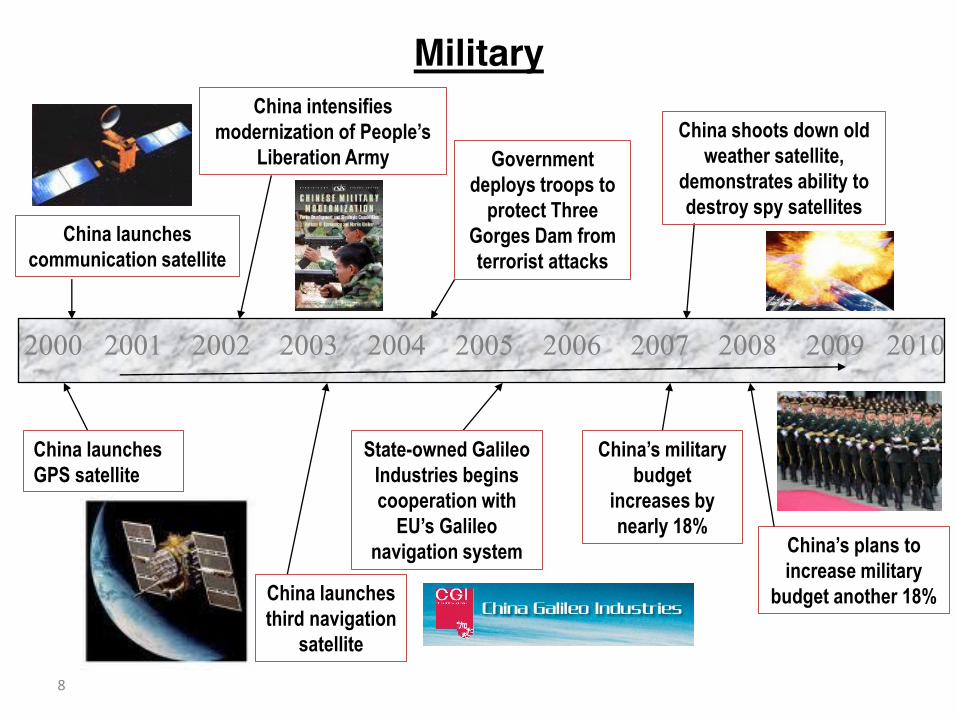
Military
China launches communication satellite
China launches GPS satellite
China intensifies modernization of People’s
Liberation Army
China launches third navigation
satellite
Government deploys troops to
protect Three Gorges Dam from terrorist attacks
Stateowned Galileo Industries begins cooperation with
EU’s Galileo navigation system
China shoots down old weather satellite,
demonstrates ability to destroy spy satellites
China’s military budget
increases by nearly 18%
China’s plans to increase military
budget another 18%
2000 2001 2002 2003 2004 2005 2006 2007 2008 2009 2010
9
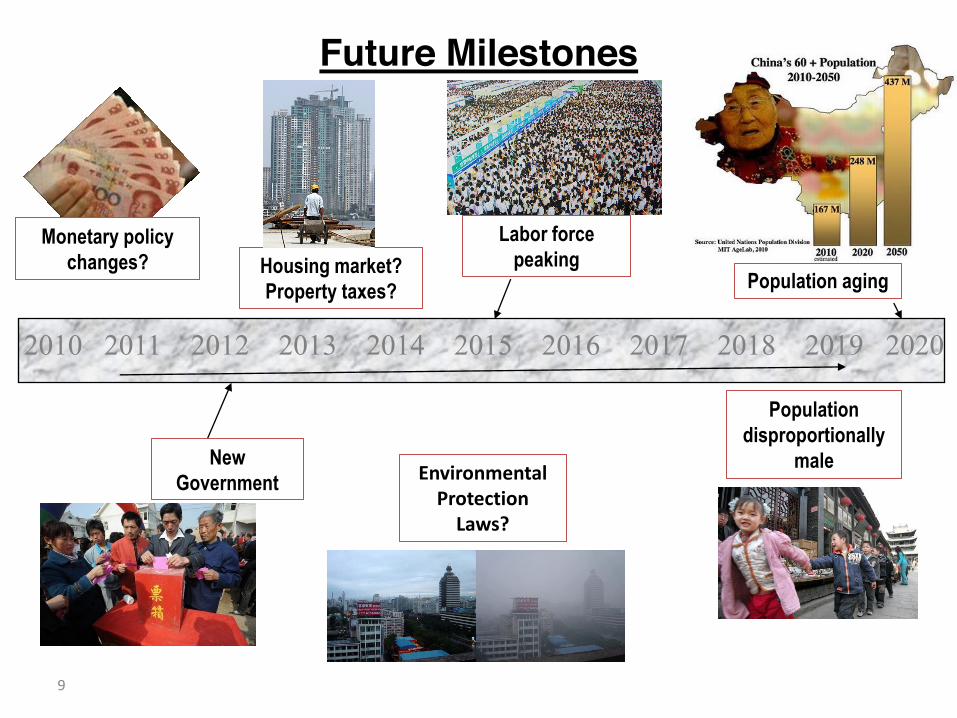
Future Milestones
Monetary policy changes?
2010 2011 2012 2013 2014 2015 2016 2017 2018 2019 2020
New Government
Housing market?Property taxes? Population aging
Population disproportionally
maleEnvironmental Protection Laws?
Labor forcepeaking
0
5,000
10,000
15,000
20,000
25,000
30,000
35,000
1980
1981
1982
1983
1984
1985
1986
1987
1988
1989
1990
1991
1992
1993
1994
1995
1996
1997
1998
1999
2000
2001
2002
2003
2004
2005
2006
2007
2008
2009
2010
GDP
per
Cap
ita (P
PP in
200
9$)
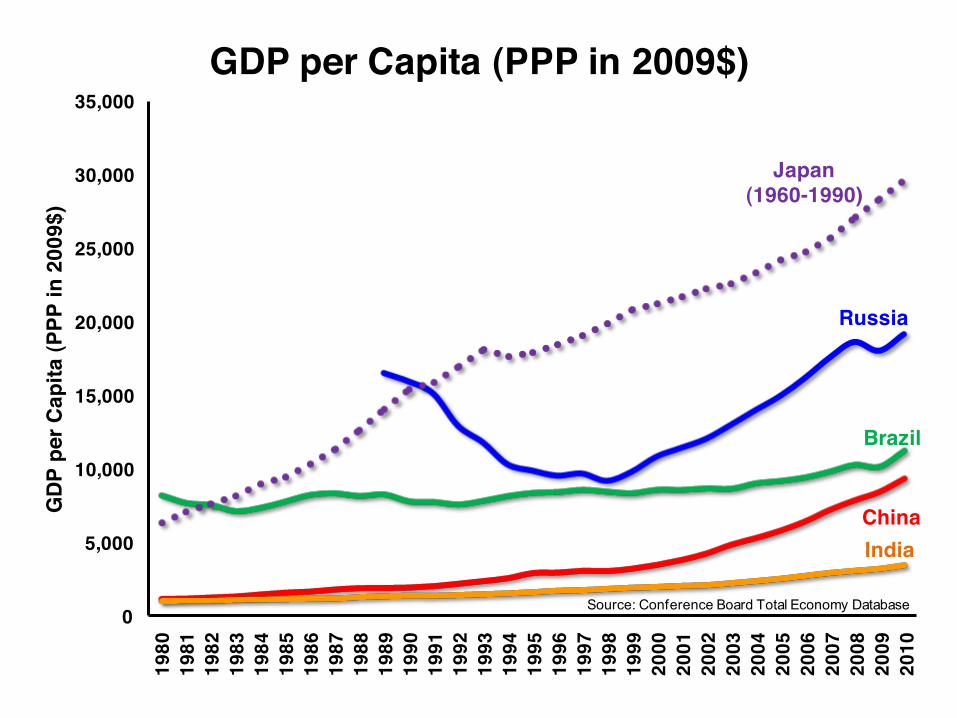
GDP per Capita (PPP in 2009$)
Brazil
IndiaChina
Russia
Source: Conference Board Total Economy Database
Japan (1960-1990)
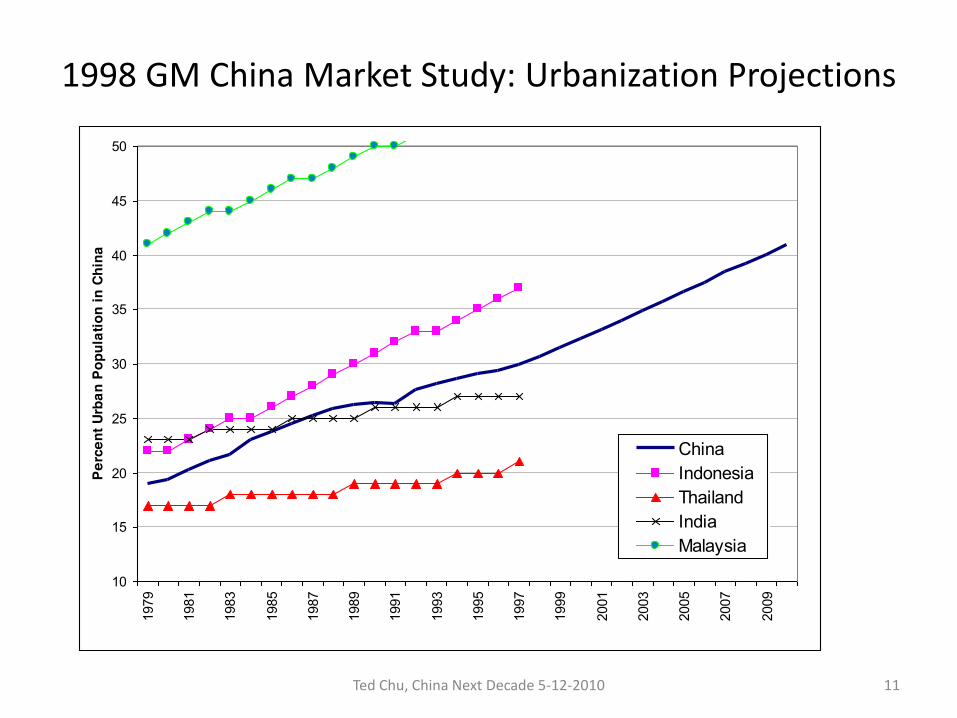
1998 GM China Market Study: Urbanization Projections
Ted Chu, China Next Decade 5‐12‐2010 11
10
15
20
25
30
35
40
45
5019
79
1981
1983
1985
1987
1989
1991
1993
1995
1997
1999
2001
2003
2005
2007
2009
Perc
ent U
rban
Pop
ulat
ion
in C
hina
ChinaIndonesiaThailandIndiaMalaysia
0
200
400
600
800
1,000
1,200
1,400
1,600
1978
1979
1980
1981
1982
1983
1984
1985
1986
1987
1988
1989
1990
1991
1992
1993
1994
1995
1996
1997
1998
1999
2000
2001
2002
2003
2004
2005
2006
2007
2008
2009
Popu
latio
n (in
Mill
ions
)
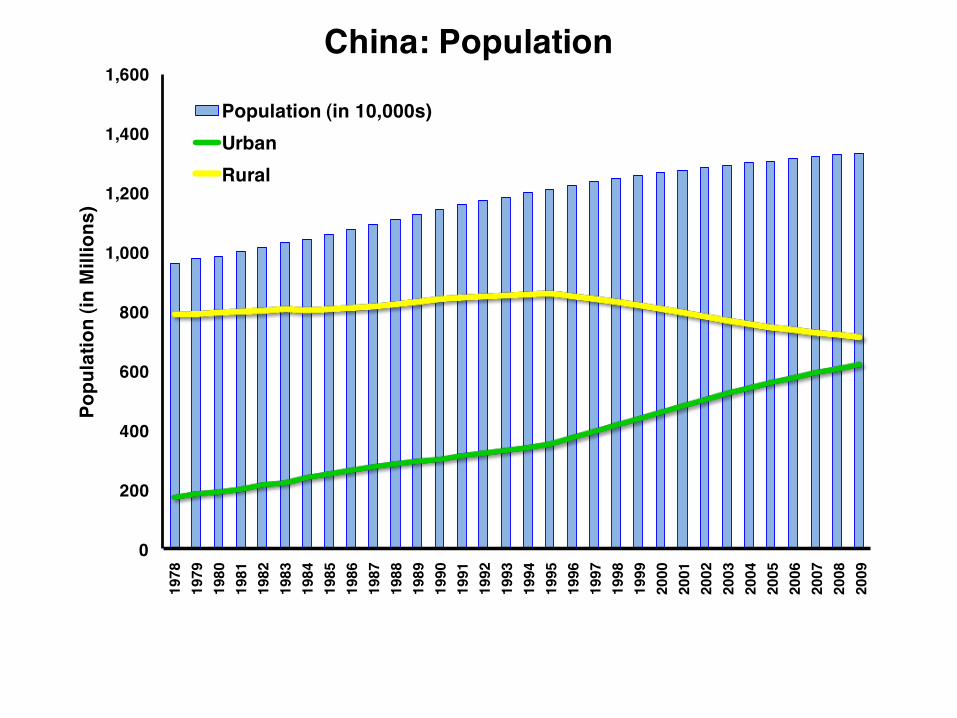
China: Population
Population (in 10,000s)UrbanRural
13
0
10
20
30
40
50
60
70
80
90
10019
90
1991
1992
1993
1994
1995
1996
1997
1998
1999
2000
2001
2002
2003
2004
2005
2006
2007
2008
2009
Perc
ent (
%) o
f Tot
al P
opul
atio
n
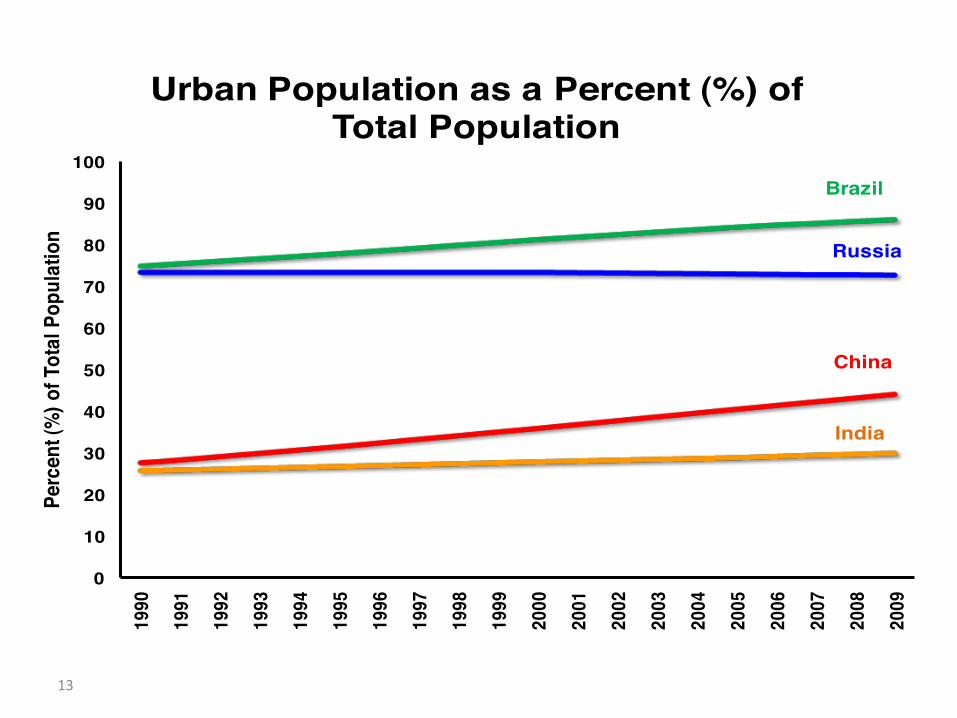
Urban Population as a Percent (%) of Total Population
Brazil
India
China
Russia
14
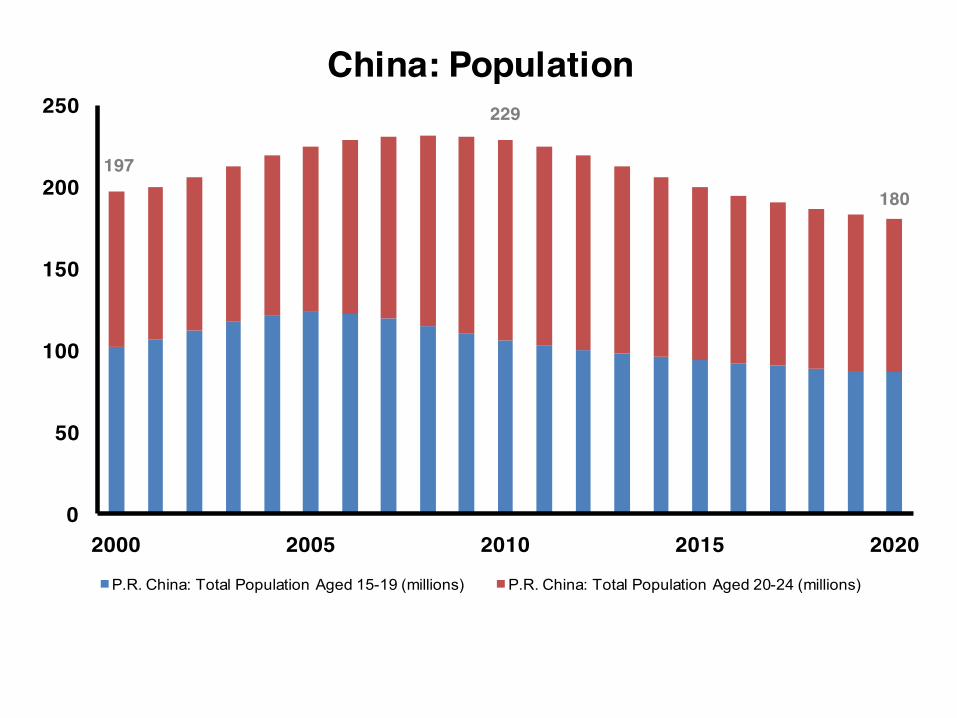
197
229
180
0
50
100
150
200
250
2000 2005 2010 2015 2020
China: Population
P.R. China: Total Population Aged 15-19 (millions) P.R. China: Total Population Aged 20-24 (millions)
0
5,000
10,000
15,000
20,000
25,000
30,000
35,000
1997 1998 1999 2000 2001 2002 2003 2004 2005 2006 2007 2008 2009
In T
hous
ands
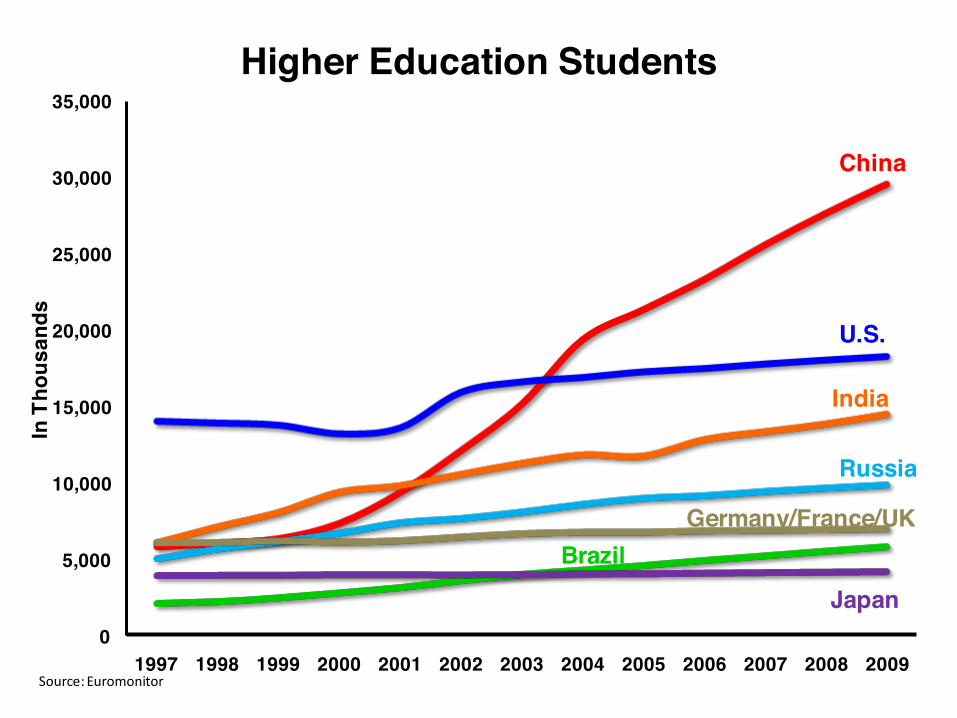
Higher Education Students
China
Brazil
Japan
Germany/France/UK
Russia
India
U.S.
Source: Euromonitor
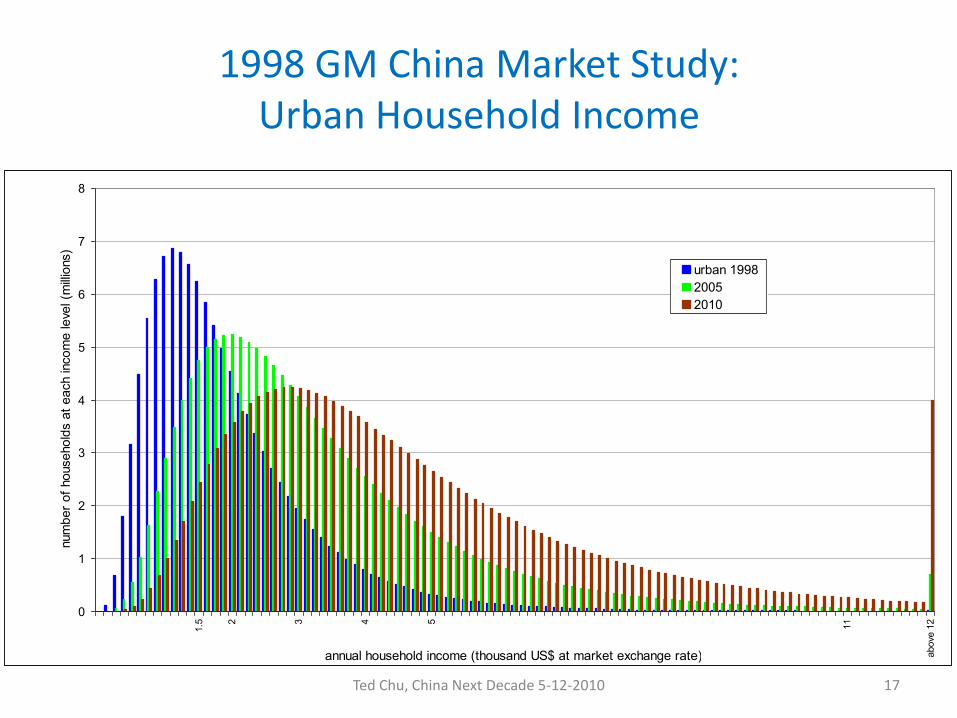
1998 GM China Market Study: Urban Household Income
Ted Chu, China Next Decade 5‐12‐2010 17
0
1
2
3
4
5
6
7
81.
5 2 3 4 5 11
abov
e 12
annual household income (thousand US$ at market exchange rate)
num
ber o
f hou
seho
lds
at e
ach
inco
me
leve
l (m
illion
s)
urban 199820052010
18
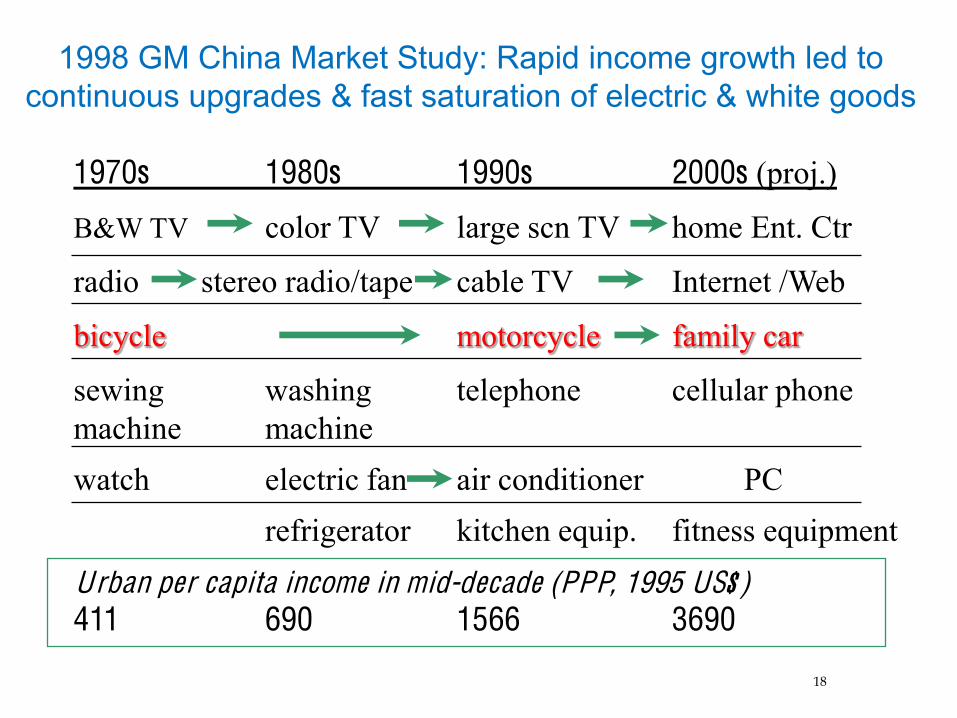
1998 GM China Market Study: Rapid income growth led to continuous upgrades & fast saturation of electric & white goods
1970s 1980s 1990s 2000s (proj.)
B&W TV color TV large scn TV home Ent. Ctr
radio stereo radio/tape cable TV Internet /Web
bicycle motorcycle family car
sewing washing telephone cellular phonemachine machinewatch electric fan air conditioner PC
refrigerator kitchen equip. fitness equipmentUrban per capita income in mid-decade (PPP, 1995 US$)411 690 1566 3690
19
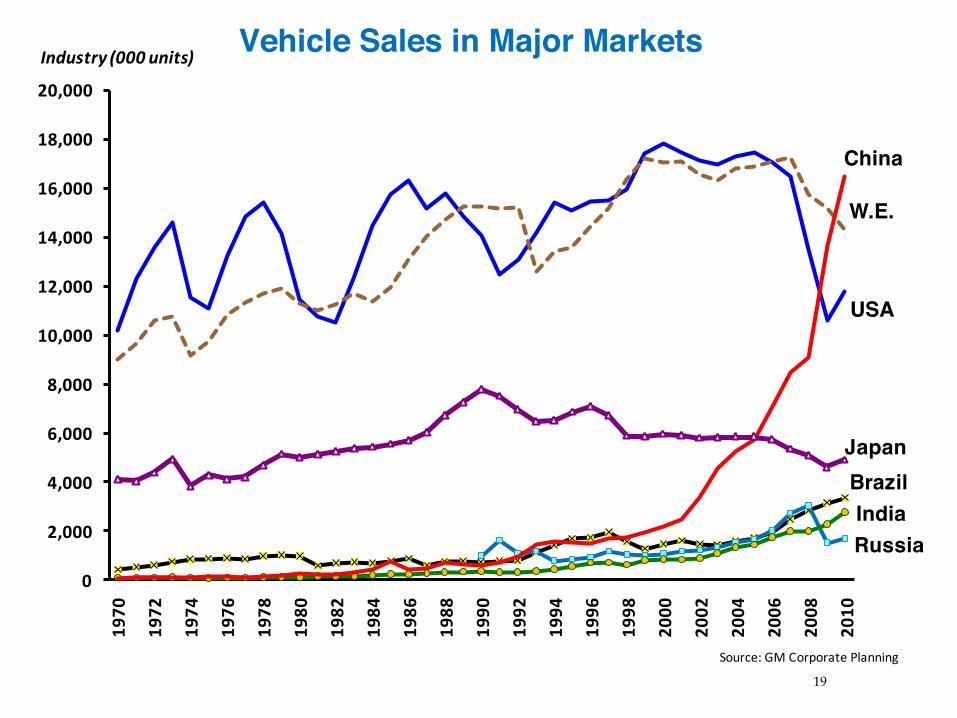
USA
W.E.
Brazil
RussiaIndia
China
Japan
0
2,000
4,000
6,000
8,000
10,000
12,000
14,000
16,000
18,000
20,000
1970
1972
1974
1976
1978
1980
1982
1984
1986
1988
1990
1992
1994
1996
1998
2000
2002
2004
2006
2008
2010
Industry (000 units)
Source: GM Corporate Planning
Vehicle Sales in Major Markets
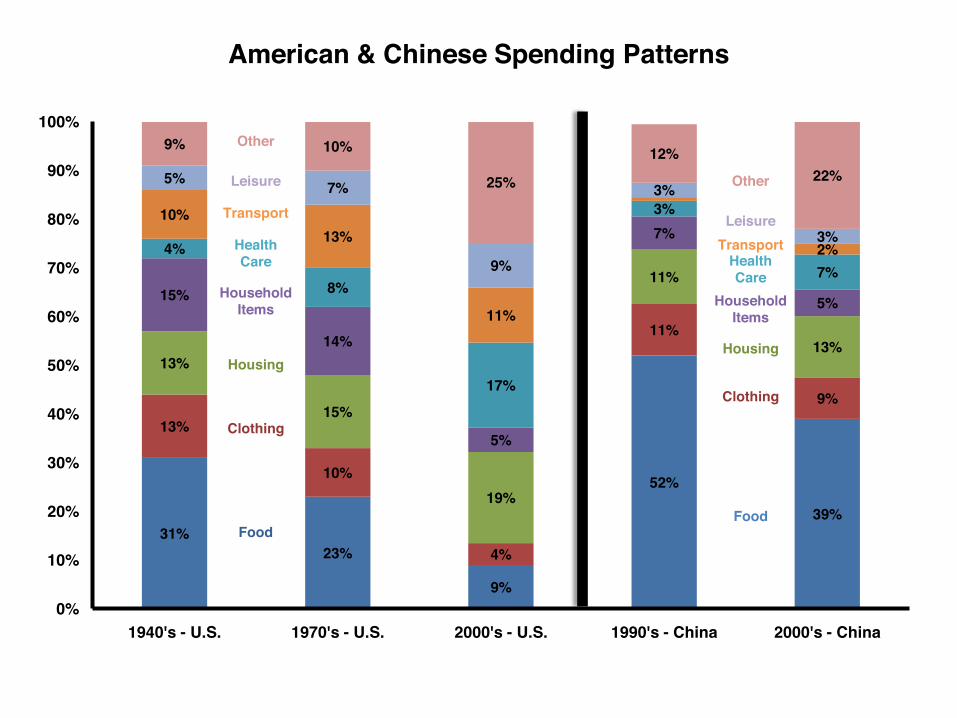
American & Chinese Spending Patterns
31%23%
9%
52%
39%
13%
10%
4%
11%
9%
13%
15%
19%
11%
13%
15%
14%
5%
7%
5%
4%
8%
17%
3%
7%
10%13%
11%
2%
5% 7%
9%
3%
3%
9% 10%
25%
12%22%
0%
10%
20%
30%
40%
50%
60%
70%
80%
90%
100%
1940's - U.S. 1970's - U.S. 2000's - U.S. 1990's - China 2000's - China
Food
Clothing
Food
Clothing
HousingHousing
HouseholdItems
Health Care Health
Care
Transport
Transport
Leisure
Leisure
Other
Other
HouseholdItems
21
0
1000
2000
3000
4000
5000
6000
7000
8000
9000
1965
1967
1969
1971
1973
1975
1977
1979
1981
1983
1985
1987
1989
1991
1993
1995
1997
1999
2001
2003
2005
2007
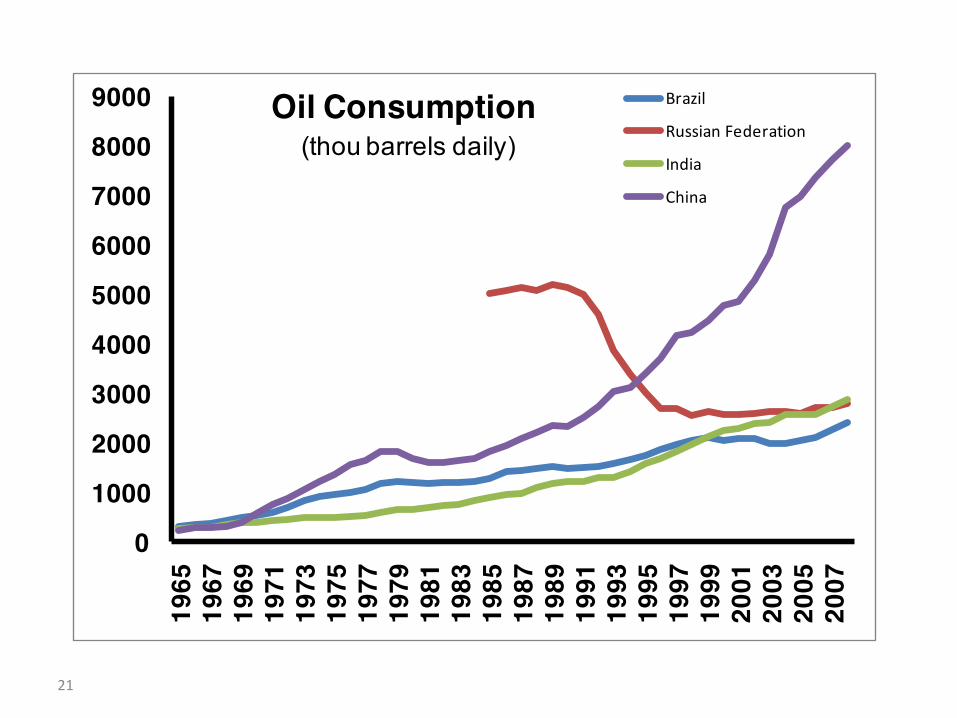
Oil Consumption(thou barrels daily)
Brazil
Russian Federation
India
China
22
0.0%
5.0%
10.0%
15.0%
20.0%
25.0%
30.0%
35.0%
40.0%
1990
1991
1992
1993
1994
1995
1996
1997
1998
1999
2000
2001
2002
2003
2004
2005
2006
2007
2008
2009
Shar
e of G
DP (%
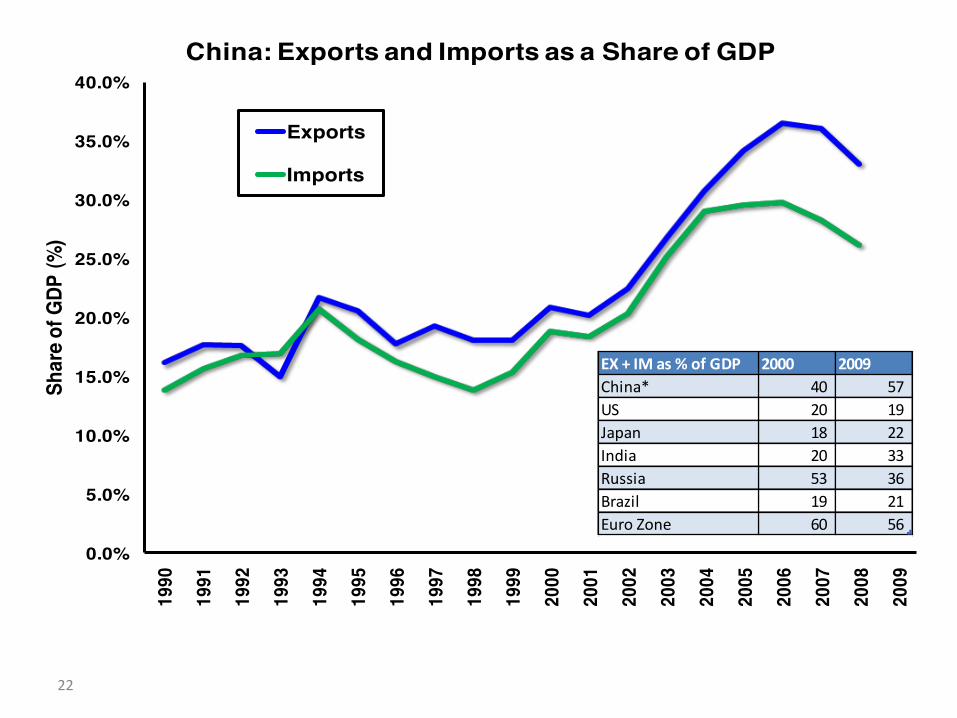
)China: Exports and Imports as a Share of GDP
Exports
Imports
EX + IM as % of GDP 2000 2009China* 40 57 US 20 19 Japan 18 22 India 20 33 Russia 53 36 Brazil 19 21 Euro Zone 60 56
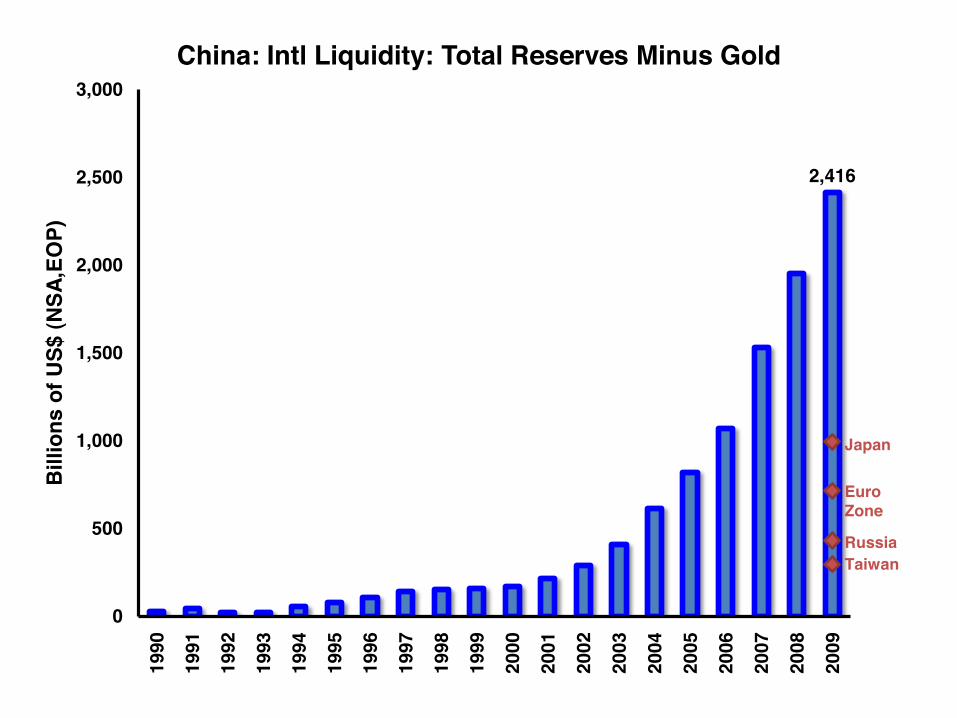
2,416
0
500
1,000
1,500
2,000
2,500
3,000
1990
1991
1992
1993
1994
1995
1996
1997
1998
1999
2000
2001
2002
2003
2004
2005
2006
2007
2008
2009
Billi
ons
of U
S$ (N
SA,E
OP)
China: Intl Liquidity: Total Reserves Minus Gold
Japan
Euro Zone
RussiaTaiwan
0
200
400
600
800
1000
1200
140019
70
1972
1974
1976
1978
1980
1982
1984
1986
1988
1990
1992
1994
1996
1998
2000
2002
2004
2006
2008
2010
2012
2014
2016
2018
2020
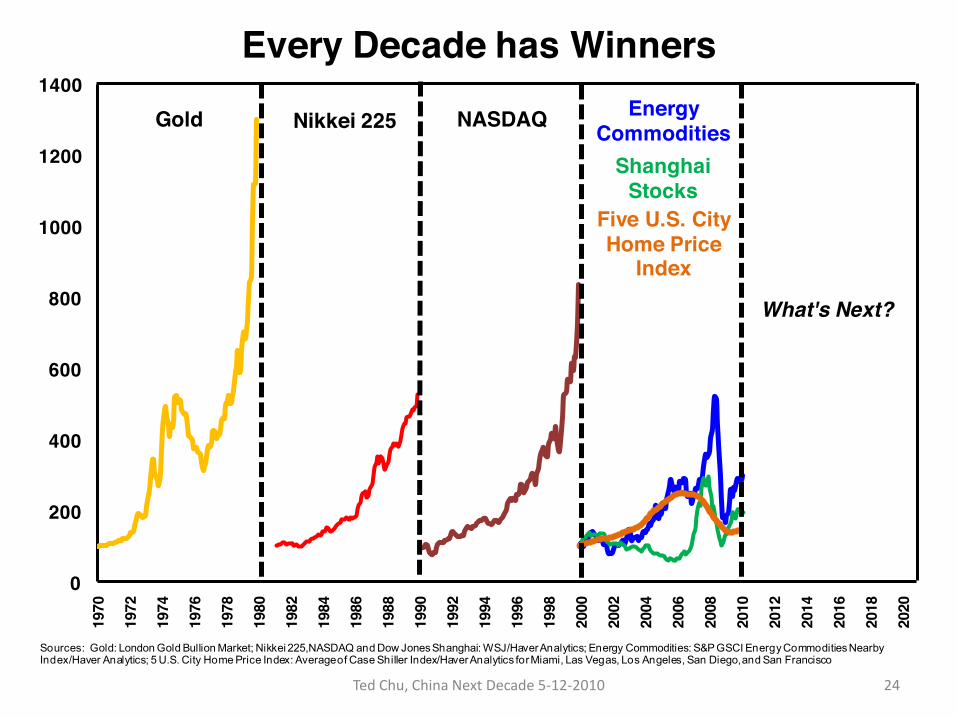
Every Decade has Winners
Gold Nikkei 225 NASDAQ Energy Commodities
Five U.S. City Home Price
Index
Shanghai Stocks
What's Next?
Sources: Gold: London Gold Bullion Market; Nikkei 225,NASDAQ and Dow Jones Shanghai: WSJ/Haver Analytics; Energy Commodities: S&P GSCI Energy Commodities Nearby Index/Haver Analytics; 5 U.S. City Home Price Index: Average of Case Shiller Index/Haver Analytics for Miami, Las Vegas, Los Angeles, San Diego, and San Francisco
24Ted Chu, China Next Decade 5‐12‐2010
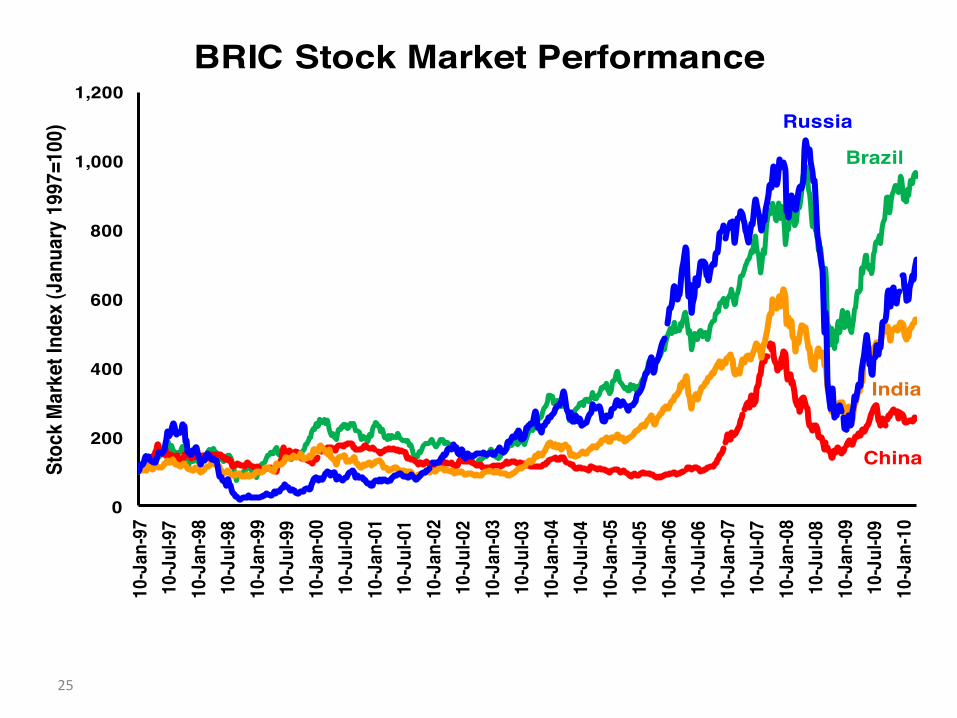
25
0
200
400
600
800
1,000
1,200
10-J
an-9
710
-Jul
-97
10-J
an-9
810
-Jul
-98
10-J
an-9
910
-Jul
-99
10-J
an-0
010
-Jul
-00
10-J
an-0
110
-Jul
-01
10-J
an-0
210
-Jul
-02
10-J
an-0
310
-Jul
-03
10-J
an-0
410
-Jul
-04
10-J
an-0
510
-Jul
-05
10-J
an-0
610
-Jul
-06
10-J
an-0
710
-Jul
-07
10-J
an-0
810
-Jul
-08
10-J
an-0
910
-Jul
-09
10-J
an-1
0
Stoc
k Mar
ket I
ndex
(Jan
uary
199
7=10
0)BRIC Stock Market Performance
Brazil
India
China
Russia
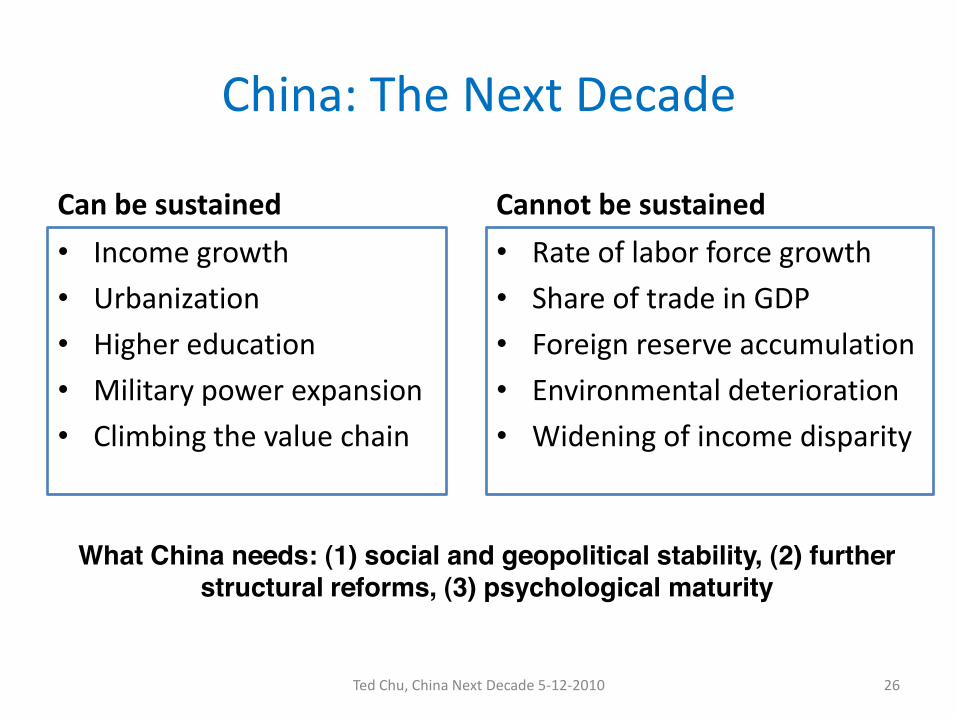
China: The Next Decade
Can be sustained
• Income growth
• Urbanization
• Higher education
• Military power expansion
• Climbing the value chain
Cannot be sustained
• Rate of labor force growth
• Share of trade in GDP
• Foreign reserve accumulation
• Environmental deterioration
• Widening of income disparity
Ted Chu, China Next Decade 5‐12‐2010 26
What China needs: (1) social and geopolitical stability, (2) furtherstructural reforms, (3) psychological maturity
Recommended