econstor www.econstor.eu
Der Open-Access-Publikationsserver der ZBW – Leibniz-Informationszentrum WirtschaftThe Open Access Publication Server of the ZBW – Leibniz Information Centre for Economics
Standard-Nutzungsbedingungen:
Die Dokumente auf EconStor dürfen zu eigenen wissenschaftlichenZwecken und zum Privatgebrauch gespeichert und kopiert werden.
Sie dürfen die Dokumente nicht für öffentliche oder kommerzielleZwecke vervielfältigen, öffentlich ausstellen, öffentlich zugänglichmachen, vertreiben oder anderweitig nutzen.
Sofern die Verfasser die Dokumente unter Open-Content-Lizenzen(insbesondere CC-Lizenzen) zur Verfügung gestellt haben sollten,gelten abweichend von diesen Nutzungsbedingungen die in der dortgenannten Lizenz gewährten Nutzungsrechte.
Terms of use:
Documents in EconStor may be saved and copied for yourpersonal and scholarly purposes.
You are not to copy documents for public or commercialpurposes, to exhibit the documents publicly, to make thempublicly available on the internet, or to distribute or otherwiseuse the documents in public.
If the documents have been made available under an OpenContent Licence (especially Creative Commons Licences), youmay exercise further usage rights as specified in the indicatedlicence.
zbw Leibniz-Informationszentrum WirtschaftLeibniz Information Centre for Economics
Schneider, Andrea
Conference Paper
Redistributive taxation vs. educationsubsidies:fostering equality and social mobility in anintergenerational model
Beiträge zur Jahrestagung des Vereins für Socialpolitik 2010: Ökonomie der Familie -Session: Education, Taxation and the Labor Market, No. A10-V3
Provided in Cooperation with:Verein für Socialpolitik / German Economic Association
Suggested Citation: Schneider, Andrea (2010) : Redistributive taxation vs. educationsubsidies:fostering equality and social mobility in an intergenerational model, Beiträge zurJahrestagung des Vereins für Socialpolitik 2010: Ökonomie der Familie - Session: Education,Taxation and the Labor Market, No. A10-V3
This Version is available at:http://hdl.handle.net/10419/37228
Redistributive taxation vs. education subsidies:fostering equality and social mobility in an
intergenerational model∗
Andrea Schneider†Helmut Schmidt University, 22043 Hamburg, Germany
AbstractRedistributive taxation and education subsidies are common policies intendedto foster education attendance of poor children. However, this paper shows thatin an intergenerational framework, these policies can raise social mobility onlyfor some investment situations but not in general. I also study the impact ofboth policies on the aggregate skill ratio and inequality. While redistributivetaxation can raise social mobility but at the same time never reduces inequality,education subsidies can, under some conditions, achieve both simultaneously.Unfortunately, these conditions necessarily require a population in which theskill ratio is already quite high.
Keywords: Redistributive taxation; Education subsidies; Intergenerational mobility;Inequality
JEL classification: D91; H23; H24; I21; J24; J62; O15
1. Introduction
Educational decisions determine a great part of future income1 and therefore po-tential inequality within and across generations. The wage gap, needed to induceinvestment, implies that it is easier for rich parents than for poor ones to invest in theeducation of their children. Recently, Rumberger (2009) has found a strong effect ofadult economic status on college completion and children’s earnings. In this context,several policy interventions that foster investment incentives of the poor and thereforeequalize the distribution of human capital are possible. The present paper analyzesthe impact of two of them - redistributive taxation and education subsidies2 - on the
∗I thank two anonymous referees for their helpful comments.†Corresponding author. Phone: +49-40-6541-3409; Fax: +49-40-6541-2618; E-mail:
[email protected] of the earliest studies that shows a positive effect of schooling on earning is by Mincer
(1958). A critical discussion on the Mincer equation and its assumptions is given by Bjorklundand Kjellstrom (2002). There is also evidence that the return to schooling has increased overthe last decades (OECD, 2009, Indicator A7).
2In the present context, subsidies are transfer payments to the households that invest ineducation.
1
aggregate proportion of educated people as well as on social mobility and inequality.3
The paper is related to a great number of intergenerational models focusing onpotential multiplicity of steady states (SS), inequality, and social mobility. This bodyof literature starts with Gary S. Becker. In a paper with Nigel Tomes, he shows thatthere is a unique equilibrium which is characterized by social immobility and inequality(Becker and Tomes, 1979). Here, wages of the skilled and unskilled are exogenous andnot determined by the measures of both occupation types. Inequality in this model ismainly driven by luck. Some other papers, assuming endogenously determined wagesand homogenous agents, find a continuum of SSs which mostly are also characterizedby inequality and the absence of social mobility (Banerjee and Newman, 1993; Galorand Zeira, 1993; Freeman, 1996; Mookherjee and Ray, 2003).4 In these models theequilibrium outcome is determined by initial conditions, i.e., there is great historydependence. But according to Maoz and Moav (1999), Mookherjee and Napel (2007),and Napel and Schneider (2008), these results are strongly connected to the assumptionof homogenous agents.5 If children are heterogenous with respect to their inherenttalent it becomes possible that a poor parent invests in his highly talented child andalso that a rich parent rejects investment in his low-talented child. Thus, steady stateswith social mobility (SSM) are fostered by heterogeneity. In Mookherjee and Napel(2007), steady states are characterized by inequality and social mobility. They arelocally unique; and under some conditions, global uniqueness is provided.
Although there are many intergenerational models of human capital investment, Iam aware of only one paper that investigates the impact of different policy interventionson long-run output. Mookherjee and Ray (2008) compare the effects of unconditionaland conditional transfers on per capita outcome and welfare. However, using thesimplifying assumption of homogenous education costs, they do not find any socialmobility in equilibrium. Therefore, I analyze the workings of a redistributive tax andeducation subsidies in a model where education costs are heterogenous and a child’stalent depends on his parent’s talent. Instead of per capita outcome and welfare thefocus is on the aggregate skill level, inequality, and social mobility.
It can be shown that generally, neither redistributive taxation nor education subsi-dies can both decrease inequality and increase social mobility. Depending on the typeof SSM, i.e., the equilibrium investment decisions of all parents without any publicintervention, the impact of both policies on inequality and social mobility is analyzed.While redistributive taxation and subsidization have similar outcomes for some typesof SSMs, they have different effects on the skill ratio for other types. Under mostcircumstances there is a trade-off between the reduction of inequality and the increaseof social mobility. However, the paper shows that in a situation where unskilled par-ents are indifferent in their investment decision for a child with low costs, educationsubsidies can reach both targets at the same time. Unfortunately, this result onlyholds for a population with a high initial aggregate skill ratio.
3A higher degree of social mobility benefits intergenerational equity. Inequality within ageneration is measured as the difference between skilled and unskilled wages.
4Galor and Zeira (1993) and Mookherjee and Ray (2003) find equal and unequal SSs.5While Mookherjee and Napel (2007) assume that talent is independently and identically
distributed, Napel and Schneider (2008) show that the results are robust if the child’s talentdepends on the talent of the parent. Maoz and Moav (1999) focus on the qualitative features ofthe convergency process that leads to a steady state. They also find that redistributive policyhas a negative effect on growth in developed economies but a positive effect in developingcountries.
2
The paper is organized as follows: the basic intergenerational model without policyintervention is presented in section 2. Section 3 studies the impact of redistributivetaxation on the skill ratio as well as on inequality and social mobility. Section 4 doesthe same for education subsidies. Conclusions are discussed in section 5.
2. Model
Assume an overlapping generations model that involves a unit mass of families.At each point in time, a family consists of a parent and a child. The parent can workas a skilled (s) or an unskilled (n) worker. The aggregate skill ratio of the populationat time t is denoted by λt. Skilled work requires a costly education while unskilledwork does not. Education costs, i.e., any kind of monetary costs like tuition fees, pri-vate lessons, expenditures for books, etc., depend on the talent6 of the child and mustbe financed out of the parent’s current income. The latter assumption goes back toLoury (1981). One can argue that this is an unrealistic assumption, but qualitative re-sults are robust as long as capital markets are imperfect. Empirical evidence suggeststhe importance of borrowing constraints on the determination of intergenerational in-equality (Gaviria, 2002). Heckman and Krueger (2003) give a detailed discussion oncredit constraints. For simplicity, I assume that there are only two possible types oftalent, with corresponding education costs xl for a highly talented child and xh for alow-talented child, respectively; the child’s talent is private information of the parent.The fractions of both types of talent are exogenously given and fixed over time. Thetalent of a child depends on the talent of his parent in a Markovian way. Thus, fori, j ∈ {l, h} the conditional probability pi→j denotes the probability that a parent witheducation costs xi has a child with education costs xj . Although the model assumesa restrictive talent distribution, the qualitative results persist if there are r discreteability types. In such a setup, xl and xh would refer to the costs of the respectivemarginal unskilled investor and skilled non-investor at a local point λt. The modelwith r discrete cost types can then be used to approximate a model with a continuousdistribution of talents (Mookherjee and Napel, 2007).The economy produces a single consumption good with a Cobb-Douglas productionfunction H = λγt (1−λt)1−γ with γ ∈ (0, 1). Wages are given by the marginal produc-tivities. Thus, in equilibrium, wages are
wst ≡ γ(1− λtλt
)1−γ (1)
and
wnt ≡ (1− γ)(λt
1− λt)γ . (2)
Clearly there are interdependencies between families’ investment decisions via λt.These interdependencies crucially drive the results for the policy implications.7 Invest-ment in education requires wst > wnt and therefore λt < γ in equilibrium. Empirical
6Here, ‘talent’ should be perceived as ‘potential to benefit from education’ as, e.g., in DeFraja (2005).
7The following results are not robust against the assumption of a linear technology andcontinuously distributed talents. In this case, the investment decisions would not depend onthe aggregate skill ratio but would mainly be driven by the conditional probabilities pi→j ,i, j ∈ {l, h}, and the fixed difference between skilled and unskilled wages.
3
evidence for the described wage structure is given by Katz and Murphy (1992). Theyespecially show that skilled wage premia decrease if the supply of skilled work in-creases.Parents’ bequest motive is assumed to be altruistic. In particular, parents maximize
U(ct, wkt+1) = ln(wkt −Dx) + δ ln(wkt+1) (3)
where ct ≡ wkt − Dx denotes the parent’s own consumption; wkt and wkt+1 with k ∈{s, n} are the incomes of the parent and the child, respectively; x denotes the child’seducation costs; and the parameter δ ∈ (0, 1) states the altruism motive. The binaryvariable D is 1 in the case of investment, and 0 otherwise. Thus, in the case of non-investment the parent can consume his whole income while his child only gets thelower wage of an unskilled worker. In the case of investment, the parent can onlyconsume his income minus education costs x, but the child’s income is given by theskilled wage.The remaining analysis concentrates on the utility function given in equation (3), butthe results also hold as long as the set of the aggregate skill level λ for that unskilledparents invest in a child with low costs xl is a closed interval or a singleton. Thus,a utility function with constant elasticity and relative risk aversion of at least oneinstead of the logarithmical function would lead to the same results.8
Given the utility function (3) the subjective benefit B(·) and the subjective costs Ck(·)from investment are
B(λt+1) ≡ δ“
lnwst+1 − lnwnt+1
”(4)
and
Ck(λt, x) ≡ lnwkt − ln(wkt − x). (5)
The subjective benefit from investment is influenced by the skill ratio in the child’sworking period t + 1 and is independent of the occupation type, whereas subjectivecosts depend on the skill ratio in the parent’s working period t, on the occupation typeof the parent and on the child’s talent. It is clear that a parent invests (does not invest)in the education of his child with education costs x whenever the subjective benefit ishigher (lower) than the subjective costs. If subjective benefit equals subjective costs,skilled (unskilled) parents are assumed to invest with market clearing probability α(β).Let us define xk(λ), k ∈ {s, n} as the critical cost function of the skilled and unskilled,respectively, i.e.,
xk(λ) ≡“
1−“wn(λ)
ws(λ)
”δ”wk(λ). (6)
Thus, xk(λ) denotes the education costs of a child that makes his parent withoccupation k just indifferent in his investment decision. Depending on the aggregateskill ratio λ, parents with occupation k invest (do not invest) in a child if his education
8This condition is already mentioned in Mookherjee and Napel (2007) as double crossingproperty (DCP). Taking the results of Mookherjee and Ray (2009) into account, the resultsare, in general, not stable with respect to all kinds of bequest motives, i.e., if parents arepaternalistic, partly paternalistic or non-paternalistic.
4
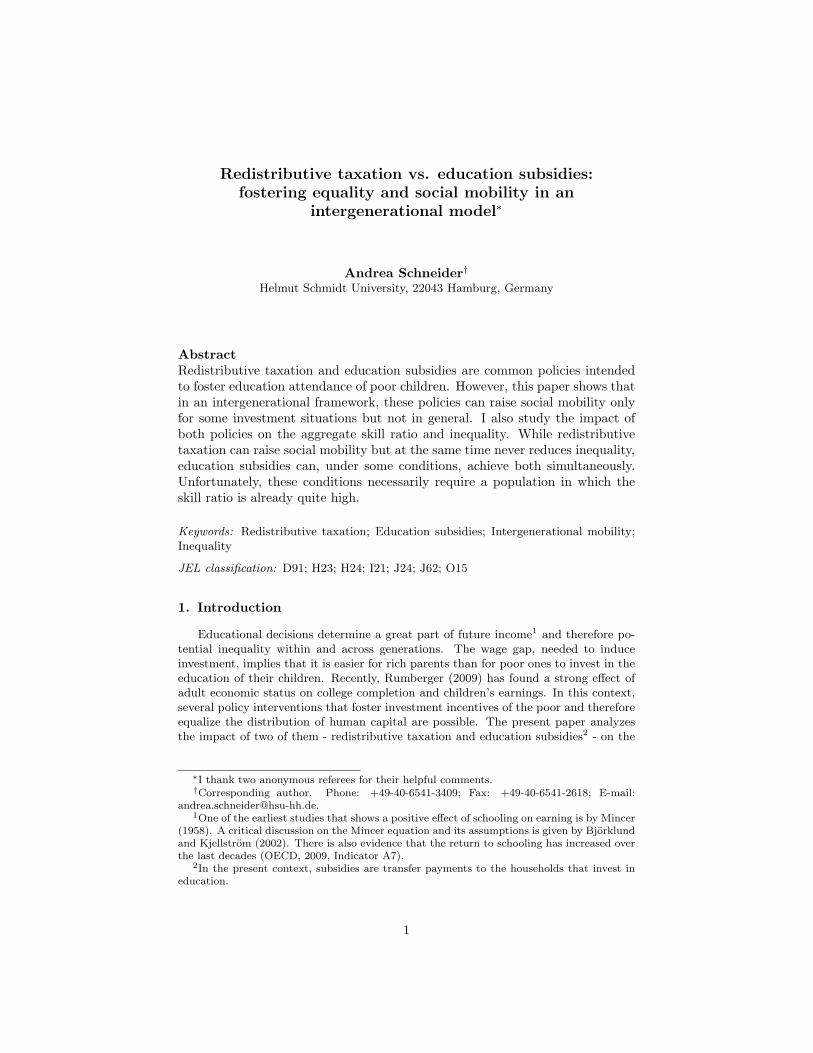
x x s
λ1 λ2 λ3 λ4 λ
x n
xh
xl ⌃
⌃
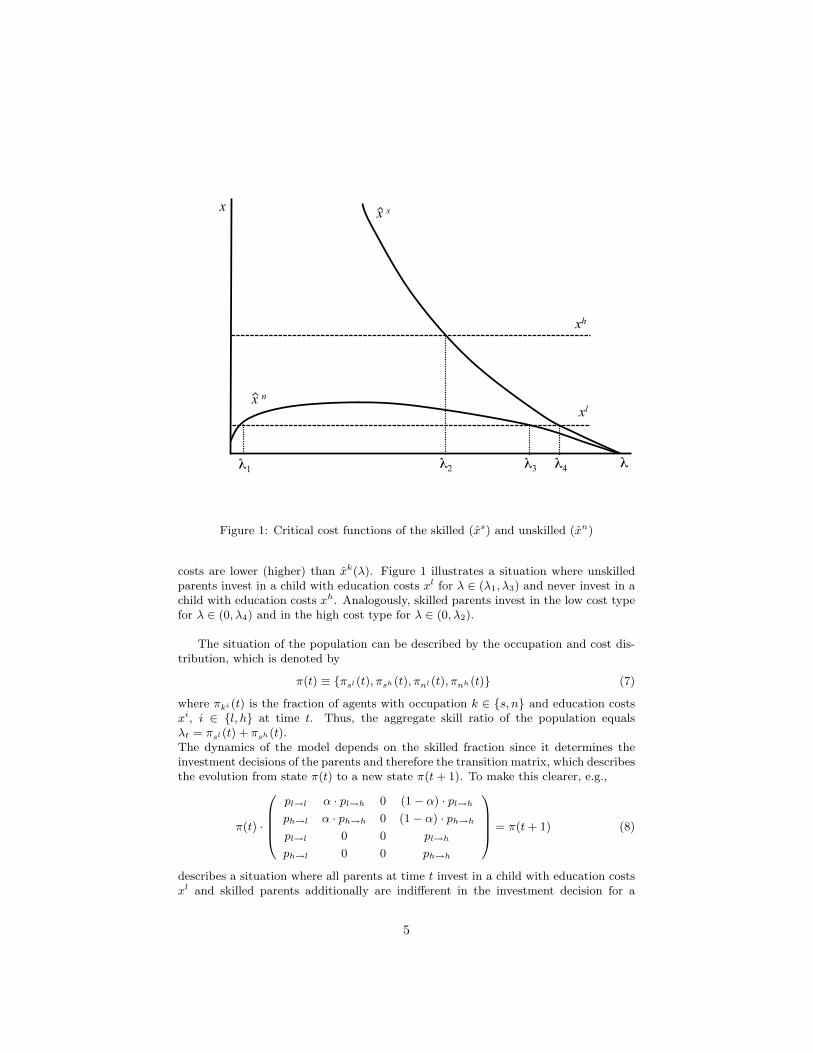
Figure 1: Critical cost functions of the skilled (xs) and unskilled (xn)
costs are lower (higher) than xk(λ). Figure 1 illustrates a situation where unskilledparents invest in a child with education costs xl for λ ∈ (λ1, λ3) and never invest in achild with education costs xh. Analogously, skilled parents invest in the low cost typefor λ ∈ (0, λ4) and in the high cost type for λ ∈ (0, λ2).
The situation of the population can be described by the occupation and cost dis-tribution, which is denoted by
π(t) ≡ {πsl(t), πsh(t), πnl(t), πnh(t)} (7)
where πki(t) is the fraction of agents with occupation k ∈ {s, n} and education costsxi, i ∈ {l, h} at time t. Thus, the aggregate skill ratio of the population equalsλt = πsl(t) + πsh(t).The dynamics of the model depends on the skilled fraction since it determines theinvestment decisions of the parents and therefore the transition matrix, which describesthe evolution from state π(t) to a new state π(t+ 1). To make this clearer, e.g.,
π(t) ·
0BBB@pl→l α · pl→h 0 (1− α) · pl→hph→l α · ph→h 0 (1− α) · ph→hpl→l 0 0 pl→h
ph→l 0 0 ph→h
1CCCA = π(t+ 1) (8)
describes a situation where all parents at time t invest in a child with education costsxl and skilled parents additionally are indifferent in the investment decision for a
5
child with education costs xh. Skilled parents invest in such a child with probabilityα. Summing up, the dynamics can be described by a time-heterogenous Markov chain.
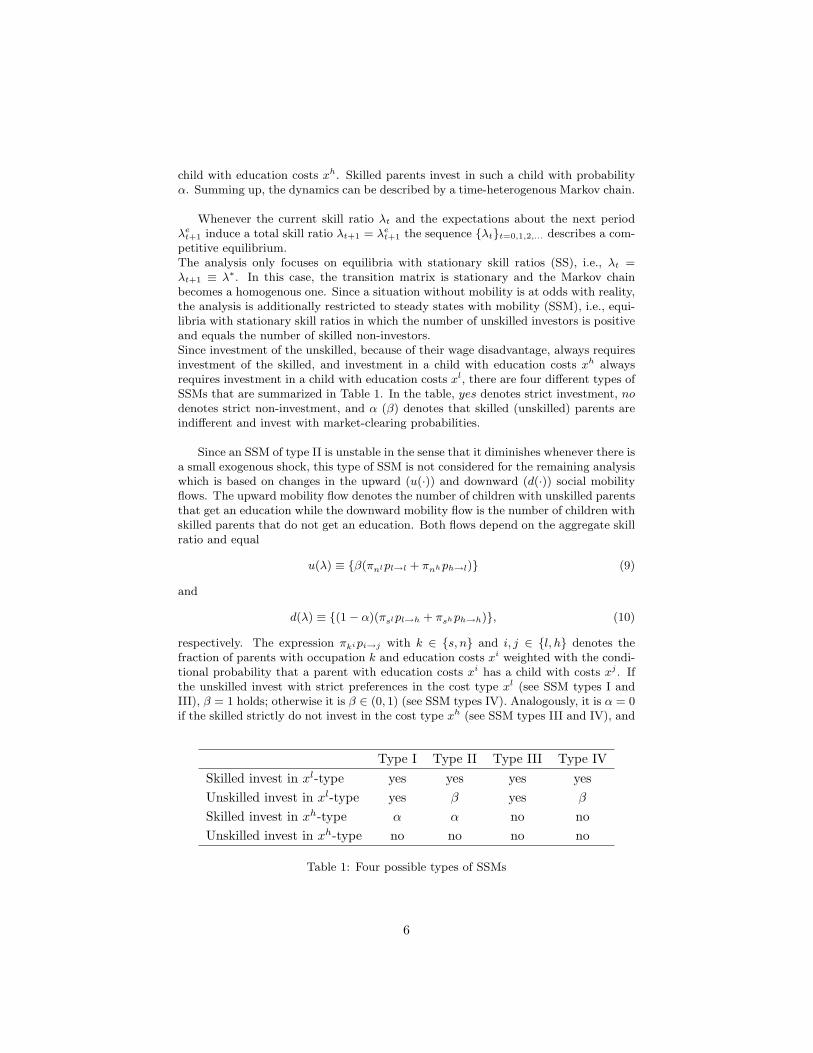
Whenever the current skill ratio λt and the expectations about the next periodλet+1 induce a total skill ratio λt+1 = λet+1 the sequence {λt}t=0,1,2,... describes a com-petitive equilibrium.The analysis only focuses on equilibria with stationary skill ratios (SS), i.e., λt =λt+1 ≡ λ∗. In this case, the transition matrix is stationary and the Markov chainbecomes a homogenous one. Since a situation without mobility is at odds with reality,the analysis is additionally restricted to steady states with mobility (SSM), i.e., equi-libria with stationary skill ratios in which the number of unskilled investors is positiveand equals the number of skilled non-investors.Since investment of the unskilled, because of their wage disadvantage, always requiresinvestment of the skilled, and investment in a child with education costs xh alwaysrequires investment in a child with education costs xl, there are four different types ofSSMs that are summarized in Table 1. In the table, yes denotes strict investment, nodenotes strict non-investment, and α (β) denotes that skilled (unskilled) parents areindifferent and invest with market-clearing probabilities.
Since an SSM of type II is unstable in the sense that it diminishes whenever there isa small exogenous shock, this type of SSM is not considered for the remaining analysiswhich is based on changes in the upward (u(·)) and downward (d(·)) social mobilityflows. The upward mobility flow denotes the number of children with unskilled parentsthat get an education while the downward mobility flow is the number of children withskilled parents that do not get an education. Both flows depend on the aggregate skillratio and equal
u(λ) ≡ {β(πnlpl→l + πnhph→l)} (9)
and
d(λ) ≡ {(1− α)(πslpl→h + πshph→h)}, (10)
respectively. The expression πkipi→j with k ∈ {s, n} and i, j ∈ {l, h} denotes thefraction of parents with occupation k and education costs xi weighted with the condi-tional probability that a parent with education costs xi has a child with costs xj . Ifthe unskilled invest with strict preferences in the cost type xl (see SSM types I andIII), β = 1 holds; otherwise it is β ∈ (0, 1) (see SSM types IV). Analogously, it is α = 0if the skilled strictly do not invest in the cost type xh (see SSM types III and IV), and
Type I Type II Type III Type IVSkilled invest in xl-type yes yes yes yesUnskilled invest in xl-type yes β yes β
Skilled invest in xh-type α α no noUnskilled invest in xh-type no no no no
Table 1: Four possible types of SSMs
6
α ∈ (0, 1) otherwise (see SSM types I). Although the RHSs of equations (9) and (10)do not directly depend on the aggregate skill ratio λ, they depend on the parametersα and β, respectively, that are determined by λ.
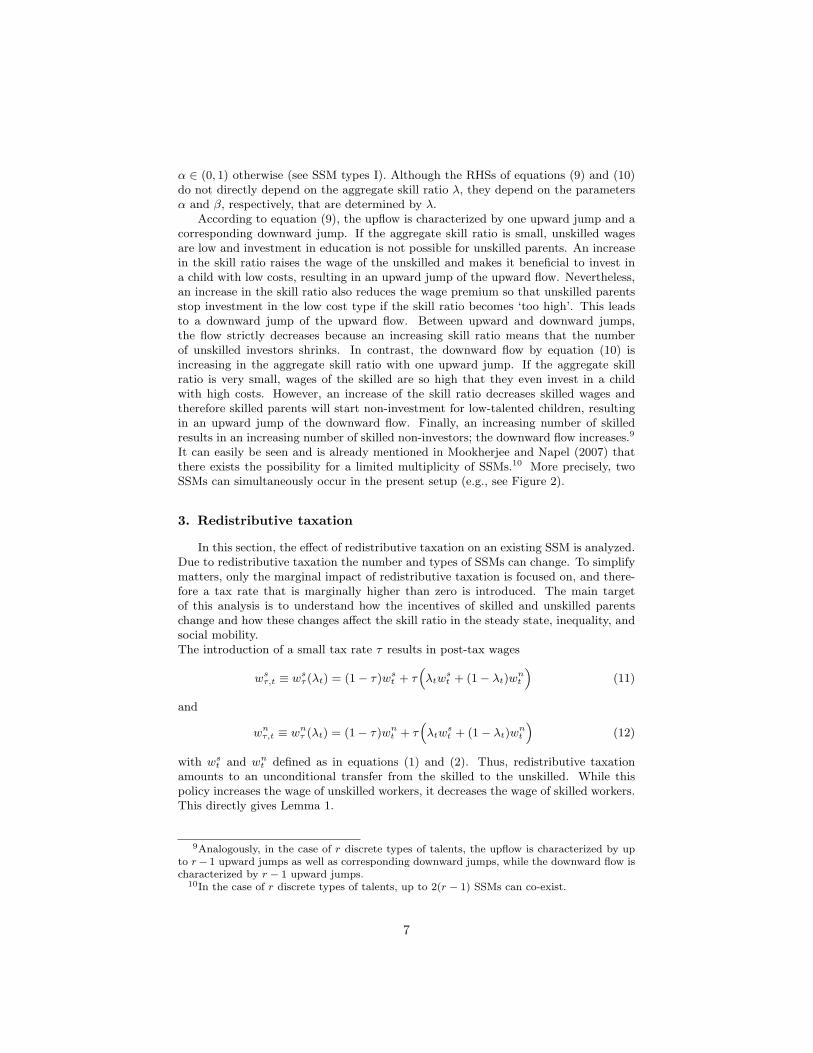
According to equation (9), the upflow is characterized by one upward jump and acorresponding downward jump. If the aggregate skill ratio is small, unskilled wagesare low and investment in education is not possible for unskilled parents. An increasein the skill ratio raises the wage of the unskilled and makes it beneficial to invest ina child with low costs, resulting in an upward jump of the upward flow. Nevertheless,an increase in the skill ratio also reduces the wage premium so that unskilled parentsstop investment in the low cost type if the skill ratio becomes ‘too high’. This leadsto a downward jump of the upward flow. Between upward and downward jumps,the flow strictly decreases because an increasing skill ratio means that the numberof unskilled investors shrinks. In contrast, the downward flow by equation (10) isincreasing in the aggregate skill ratio with one upward jump. If the aggregate skillratio is very small, wages of the skilled are so high that they even invest in a childwith high costs. However, an increase of the skill ratio decreases skilled wages andtherefore skilled parents will start non-investment for low-talented children, resultingin an upward jump of the downward flow. Finally, an increasing number of skilledresults in an increasing number of skilled non-investors; the downward flow increases.9
It can easily be seen and is already mentioned in Mookherjee and Napel (2007) thatthere exists the possibility for a limited multiplicity of SSMs.10 More precisely, twoSSMs can simultaneously occur in the present setup (e.g., see Figure 2).
3. Redistributive taxation
In this section, the effect of redistributive taxation on an existing SSM is analyzed.Due to redistributive taxation the number and types of SSMs can change. To simplifymatters, only the marginal impact of redistributive taxation is focused on, and there-fore a tax rate that is marginally higher than zero is introduced. The main targetof this analysis is to understand how the incentives of skilled and unskilled parentschange and how these changes affect the skill ratio in the steady state, inequality, andsocial mobility.The introduction of a small tax rate τ results in post-tax wages
wsτ,t ≡ wsτ (λt) = (1− τ)wst + τ“λtw
st + (1− λt)wnt
”(11)
and
wnτ,t ≡ wnτ (λt) = (1− τ)wnt + τ“λtw
st + (1− λt)wnt
”(12)
with wst and wnt defined as in equations (1) and (2). Thus, redistributive taxationamounts to an unconditional transfer from the skilled to the unskilled. While thispolicy increases the wage of unskilled workers, it decreases the wage of skilled workers.This directly gives Lemma 1.
9Analogously, in the case of r discrete types of talents, the upflow is characterized by upto r− 1 upward jumps as well as corresponding downward jumps, while the downward flow ischaracterized by r − 1 upward jumps.
10In the case of r discrete types of talents, up to 2(r − 1) SSMs can co-exist.
7
SSM
SSM
d
u
λ
u, d
Figure 2: Mobility flows for a case with two SSMs
Lemma 1. Subjective benefit of investment (Bτ ) is reduced by redistributive taxation.Subjective costs of investment are lowered for the unskilled (Cnτ ) but raised for theskilled (Csτ ).
Thus, for skilled parents, investment incentives shrink due to increased costs anddecreased benefit. However, for unskilled parents, two counteracting effects appear.On the one hand, investment becomes easier as a result of decreased costs (cost effect);on the other hand, return on investment in human capital drops due to a lowered wagegap (wage premium effect). Let λ ∈ (0, γ) be defined as the solution of
wn(λ)− wn(λ)δ+1
ws(λ)δ= wnτ (λ)− wnτ (λ)δ+1
wsτ (λ)δ, (13)
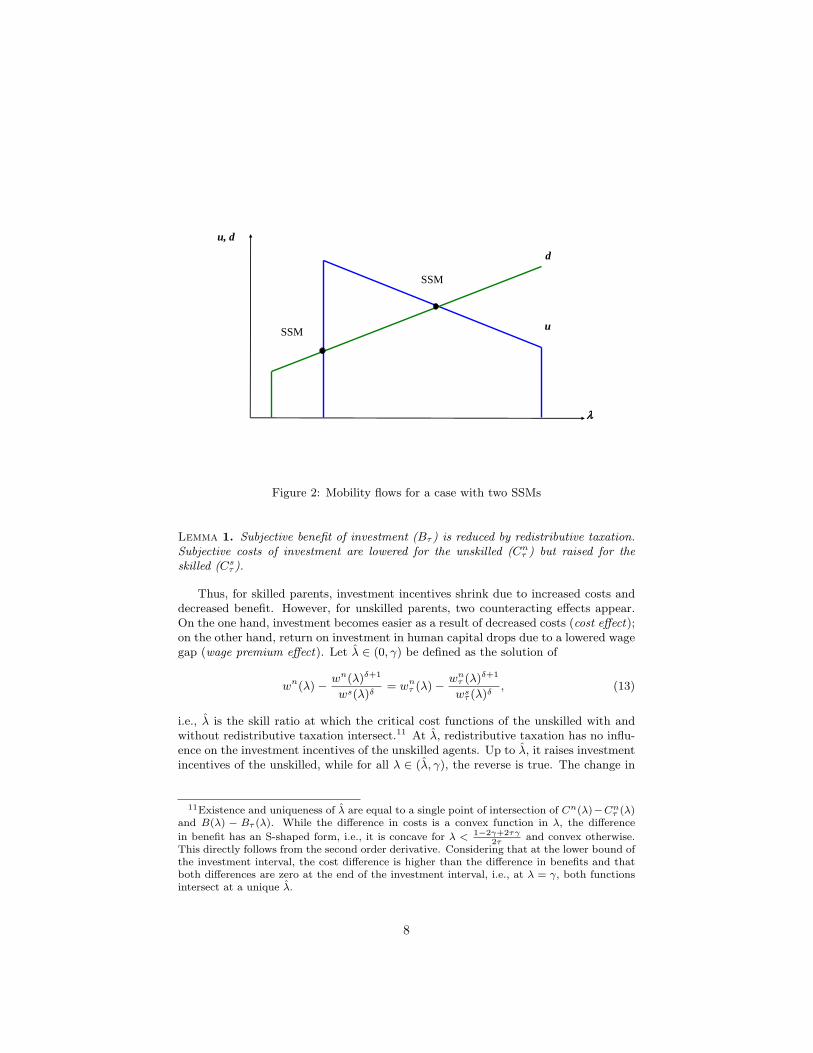
i.e., λ is the skill ratio at which the critical cost functions of the unskilled with andwithout redistributive taxation intersect.11 At λ, redistributive taxation has no influ-ence on the investment incentives of the unskilled agents. Up to λ, it raises investmentincentives of the unskilled, while for all λ ∈ (λ, γ), the reverse is true. The change in
11Existence and uniqueness of λ are equal to a single point of intersection of Cn(λ)−Cnτ (λ)and B(λ) − Bτ (λ). While the difference in costs is a convex function in λ, the difference
in benefit has an S-shaped form, i.e., it is concave for λ < 1−2γ+2τγ2τ
and convex otherwise.This directly follows from the second order derivative. Considering that at the lower bound ofthe investment interval, the cost difference is higher than the difference in benefits and thatboth differences are zero at the end of the investment interval, i.e., at λ = γ, both functionsintersect at a unique λ.
8
x
λ
x n τ x n
λ ⌃
⌃ ⌃
Figure 3: Critical cost function of the unskilled with (dashed line) and without (solidline) redistributive taxation
the critical cost function of the unskilled is illustrated in Figure 3.The change in the investment incentives directly implies that the downflow weakly in-creases due to redistributive taxation. The upflow never decreases if the pre-tax SSMsatisfies λ∗ ∈ (0, λ), but it never increases if λ∗ ∈ (λ, γ) holds. Thus, the social mo-bility upflow can only be raised due to redistributive taxation if the population beforethe policy intervention is characterized by a low skill ratio. Proposition 1 summarizesthe results for the change in the skill ratio.
Proposition 1. The aggregate skill ratio decreases due to redistributive taxation inthe case of a type-I or type-IV SSM. It is unchanged in the case of a type-III SSM.
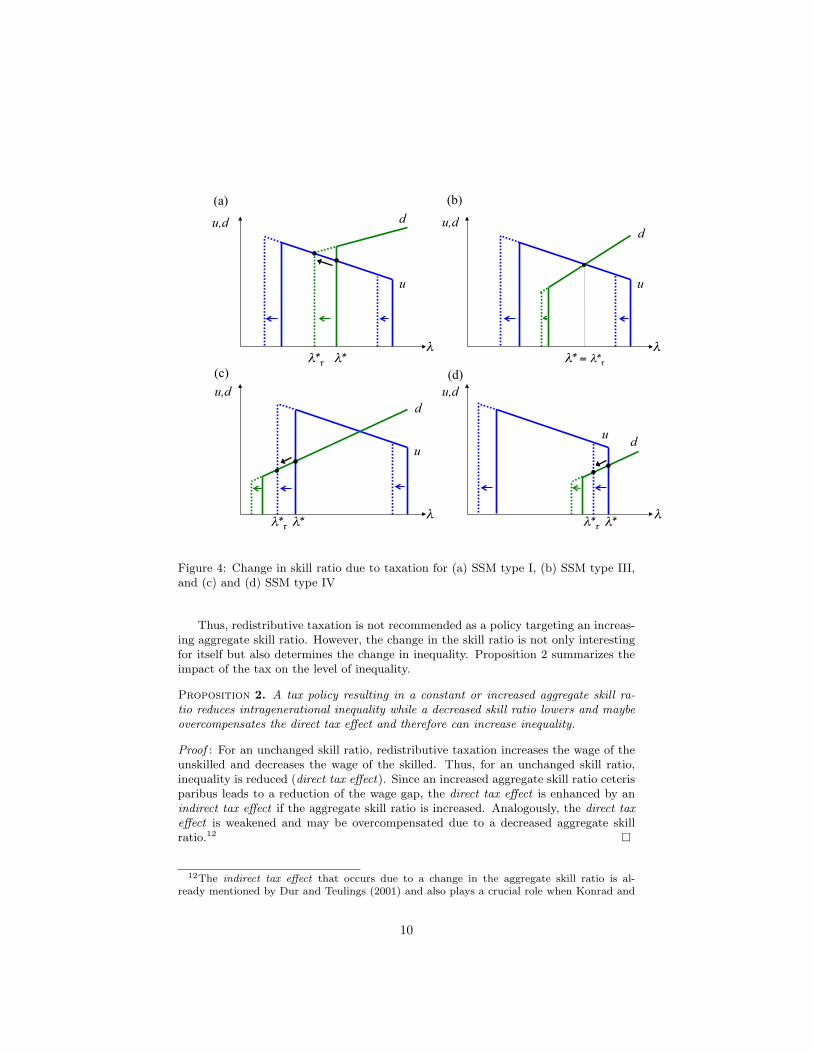
Proof : The results for all cases are illustrated in Figure 4. While solid lines illustratemobility flows without taxation, dashed lines illustrate mobility flows with redistribu-tive policy. Let λ∗ denote the SSM before taxation while λ∗τ is the stationary skillratio after taxation. Focusing on an SSM of type I, the investment incentives of theskilled are decreased by the policy, while the investment incentives of the unskillednear the initial skill ratio λ∗ are not influenced. This implies that the skilled startnon-investment in at least some high-skilled children at λ∗τ < λ∗. Thus, the stationaryskill ratio decreases. An SSM of type IV can appear at the lower bound of the intervalwhere unskilled parents invest in a child with low costs, i.e., when λ∗ < λ holds, orat the upper bound of this interval, i.e., when λ∗ > λ holds. Redistributive taxationshifts this investment interval to the left. Therefore, λ∗τ < λ∗ holds, i.e., the stationaryskill ratio is smaller with than without taxation. For an SSM of type III, i.e., an SSMwhere all agents have strict investment incentives, a small tax rate τ does not changeinvestment incentives at the initial SSM λ∗. Therefore, stationary skill ratios beforeand after taxation are equal. �
9
(a) (b)
(d) (c) λ*τ λ*
λ λ
λ
u,d
λ
u,d
u,d u,d
u
d
λ* = λ*τ
λ* λ*τ
d
u
u
d
d u
λ* λ*τ
Figure 4: Change in skill ratio due to taxation for (a) SSM type I, (b) SSM type III,and (c) and (d) SSM type IV
Thus, redistributive taxation is not recommended as a policy targeting an increas-ing aggregate skill ratio. However, the change in the skill ratio is not only interestingfor itself but also determines the change in inequality. Proposition 2 summarizes theimpact of the tax on the level of inequality.
Proposition 2. A tax policy resulting in a constant or increased aggregate skill ra-tio reduces intragenerational inequality while a decreased skill ratio lowers and maybeovercompensates the direct tax effect and therefore can increase inequality.
Proof : For an unchanged skill ratio, redistributive taxation increases the wage of theunskilled and decreases the wage of the skilled. Thus, for an unchanged skill ratio,inequality is reduced (direct tax effect). Since an increased aggregate skill ratio ceterisparibus leads to a reduction of the wage gap, the direct tax effect is enhanced by anindirect tax effect if the aggregate skill ratio is increased. Analogously, the direct taxeffect is weakened and may be overcompensated due to a decreased aggregate skillratio.12 �
12The indirect tax effect that occurs due to a change in the aggregate skill ratio is al-ready mentioned by Dur and Teulings (2001) and also plays a crucial role when Konrad and
10
Summing up, for a type-I or type-IV SSM, redistributive taxation may increaseinequality while it is definitely reduced in case of a type-III SSM that is characterizedby strict investment incentives of all agents.
The second point of interest is the change in social mobility due to redistributivetaxation.
Proposition 3. Social mobility increases due to redistributive taxation if the SSM isof type I while it decreases if the SSM is of type IV. For a SSM of type III socialmobility is not influenced by redistributive taxation.
Proof : For an SSM of type I, the skill ratio is decreased by redistributive taxation(see Prop. 1). This implies, since the upward flow is strictly decreasing in the relevantrange, increased upward mobility. Therefore, in the SSM, there must also be anincreased downward mobility. For an SSM of type IV, the skill ratio also increases dueto redistributive taxation (see Prop. 1). However, the strictly decreasing downwardflow in this situation implies a reduction in the downward mobility, and therefore inthe SSM also a decrease in the upward mobility. For an SSM of type III, the skill ratiodoes not change due to redistributive taxation (see Prop. 1). Therefore, upward anddownward mobility flows do not change at λ∗. The results for the different types ofSSM can also be inferred by Figure 4. �
Summarizing, redistributive taxation is in general not a good policy to reduceinequality and increase social mobility at the same time. However, it reduces inequality(for a constant level of social mobility) if the pre-tax SSM is of type III and it increasessocial mobility (with an ambiguous effect on inequality) if the SSM is of type I.
4. Education subsidies
One may suspect that redistributive taxation is, in general, no good policy inter-vention because it amounts to an unconditional transfer. However, this section showsthat education subsidies as a conditional transfer generally cannot decrease inequalityand increase social mobility, either. In the analysis, the focus is again on the marginaleffect of subsidization and therefore a subsidy rate θ that is marginally higher thanzero is assumed. Otherwise, the number and types of SSMs could change completely.Assume that education subsidies are available to all parents that choose to acquireeducation, and that they are independent of the parent’s occupation type. They arepaid proportional to the education costs of the child and are financed by a flat-rate taxlevied on the general public (similar to Bovenberg and Jacobs (2005)). Consideringpractical applications, parents facing monetary education costs only have to pay the(1 − θ)-fraction of these costs and can demand the remaining costs from the govern-ment. In equilibrium, the aggregate amount of subsidy Θ(λ) for an exogenous andsmall subsidy rate θ is
Θ(λ) = θλ(ρlxl + αρhx
h) + θ(1− λ)βρlxl, (14)
Spadaro (2006) show that not only low-talented but also highly talented agents may supportredistribution.
11
where ρl and ρh denote the exogenous fractions of children with low and high educationcosts, respectively.13 Considering a tax rate τsub the aggregate tax amount in equilib-rium is τsub(λws + (1− λ)wn).14 Thus, for a subsidy rate θ that is exogenously fixed,the tax rate τsub is endogenously determined by the government’s budget restrictionas
τsub ≡θλ(ρlx
l + αρhxh) + θ(1− λ)βρlx
l
λws + (1− λ)wn. (15)
For the remaining analysis θ > τsub is assumed to hold. This assumption is necessaryto foster investment incentives of the agents15 and can be guaranteed for at least asmall exogenous subsidy rate.16
Considering the described policy intervention, equilibrium wages are
wssub = (1− τsub)ws and wnsub = (1− τsub)wn (16)
with ws and wn given as in equations (1) and (2). Replacing ws and wn in equations(4) and (5) by wssub and wnsub gives subjective benefit and costs after subsidization.
Lemma 2. The subjective benefit of investment (Bsub) does not change due to educa-tion subsidies. Subjective costs of the skilled (Cssub) and unskilled (Cnsub) are reduced.17
The lemma directly follows from the change in wages. Caused by the unchangedbenefit and the reduced costs the investment incentives of all parents increase. There-fore, the upflow is never decreased due to the described policy while the downflow isnever increased. The change in the mobility flows then gives Proposition 4.
Proposition 4. Education subsidies that are financed by a flat-rate tax levied on thegeneral public increase the aggregate skill ratio if the SSM is of type I and do notchange the skill ratio if the SSM is of type III. If the SSM is of type IV, subsidizationdecreases the skill ratio in a low-skilled population, i.e., if λ∗ < λ holds, but it increasesthe skill ratio in a high-skilled population, i.e., if λ∗ > λ holds.
13Another common subsidy policy is a flat subsidy where every parent who invests getsa fixed subsidy amount θ. Since in this case, equation (14) can be rewritten as Θ(λ) =θλ(ρl +αρh) + θ(1−λ)βρl qualitative results of this section also hold for a flat subsidy. Evena flat subsidy only available for the unskilled can, in general, not increase social mobility anddecrease inequality.
14All parameters that refer to the case of education subsidies are indexed with ‘sub’.15Subjective benefit is not influenced by the policy (see Lemma 2) and, easily checked again,
only for τsub < θ subjective costs are smaller with than without education subsidies.16Considering equation (15), ρlx
l + αρhxh
`< (ρl + αρh)xh
´< ws and βρlx
l < wn are
sufficient conditions to assure τsub < θ. As ws ≥ (1− θ)xh and wn ≥ (1− θ)xl are necessaryconditions for investment, we can rewrite the sufficient conditions as (1− θ) ≥ ρl + αρh and(1 − θ) ≥ βρl. As the second condition always holds if the first condition is fulfilled and theright-hand side of the first condition is smaller than 1, there exists a θ > 0 so that the firstcondition and therefore θ > τsub holds.
17The fact that subjective benefit is not influenced by subsidization depends on the special
form of the utility function. If the utility function is, e.g., u(c) = c1−φ
1−φ subsidization causes
an increase in the subjective benefit.
12
(a) (b)
(d) (c) λ*τ λ*
λ λ
λ
u,d
λ
u,d
u,d u,d
u
d
λ* = λ*τ
λ* λ*τ
d
u
u
d
d u
λ* λ*τ
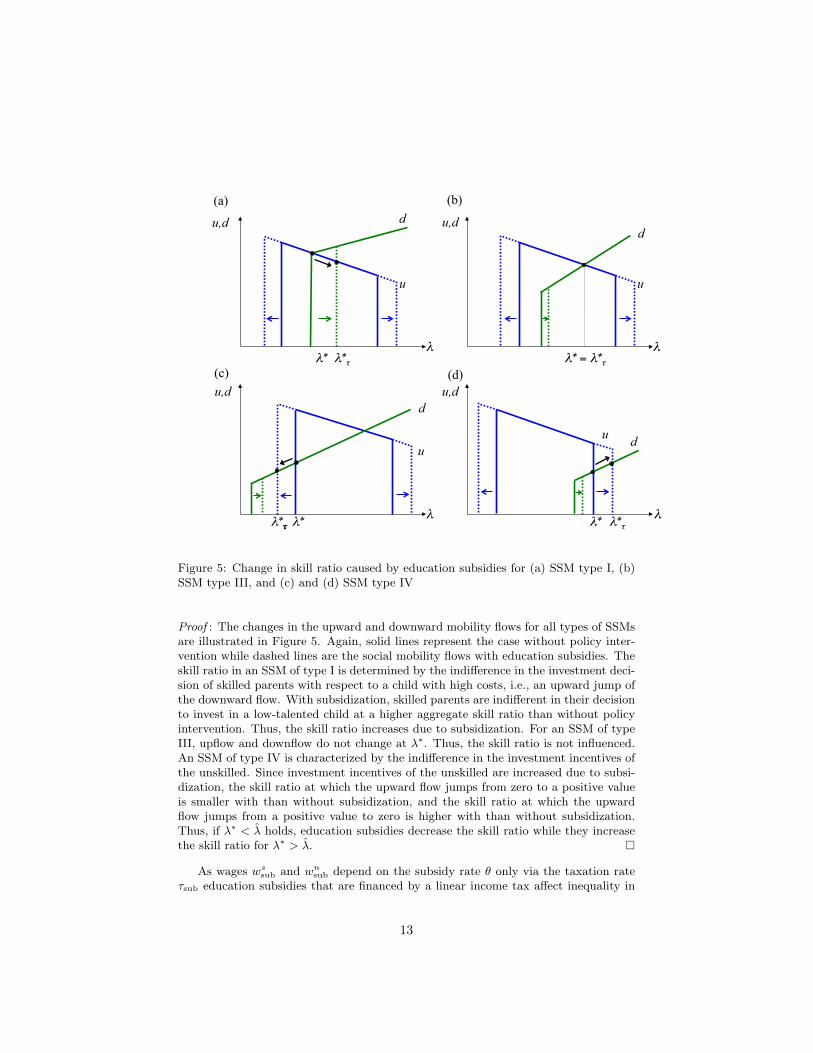
Figure 5: Change in skill ratio caused by education subsidies for (a) SSM type I, (b)SSM type III, and (c) and (d) SSM type IV
Proof : The changes in the upward and downward mobility flows for all types of SSMsare illustrated in Figure 5. Again, solid lines represent the case without policy inter-vention while dashed lines are the social mobility flows with education subsidies. Theskill ratio in an SSM of type I is determined by the indifference in the investment deci-sion of skilled parents with respect to a child with high costs, i.e., an upward jump ofthe downward flow. With subsidization, skilled parents are indifferent in their decisionto invest in a low-talented child at a higher aggregate skill ratio than without policyintervention. Thus, the skill ratio increases due to subsidization. For an SSM of typeIII, upflow and downflow do not change at λ∗. Thus, the skill ratio is not influenced.An SSM of type IV is characterized by the indifference in the investment incentives ofthe unskilled. Since investment incentives of the unskilled are increased due to subsi-dization, the skill ratio at which the upward flow jumps from zero to a positive valueis smaller with than without subsidization, and the skill ratio at which the upwardflow jumps from a positive value to zero is higher with than without subsidization.Thus, if λ∗ < λ holds, education subsidies decrease the skill ratio while they increasethe skill ratio for λ∗ > λ. �
As wages wssub and wnsub depend on the subsidy rate θ only via the taxation rateτsub education subsidies that are financed by a linear income tax affect inequality in
13
the same way as redistributive taxation does. Therefore, Proposition 2 also holds inthe case of subsidization. Summarizing, education subsidies are an appropriate policyto reduce inequality under most circumstances, i.e., if the SSM is of type I, III, or ina high-skilled population of type IV. However, if the population is characterized bya low initial aggregate skill ratio and the unskilled are indifferent in their investmentdecision with respect to the cost type xl, the impact on the wage gap is ambiguous.
Focusing on the impact of education subsidies on social mobility, one can obtain:
Proposition 5. Social mobility decreases due to education subsidies if the SSM is oftype I. It is not influenced if the SSM is of type III. If the SSM is of type IV, socialmobility is decreased by subsidization in a low-skilled population, i.e., if λ∗ < λ holds,but it is increased in a high-skilled population, i.e., if λ∗ > λ holds.
Proof : All results are illustrated in Figure 5. The skill ratio in an SSM of type I isdetermined by the indifference in the investment decision of the skilled with respectto a child with high education costs. With education subsides, skilled parents areindifferent in their investment decision for a low-talented child at a higher aggreagteskill ratio than without subsidization. This implies, since the upward mobility flow isstrictly decreasing, a decrease in social mobility. For an SSM of type III, investmentincentives are not influenced by subsidization at λ∗. Thus, social mobility does notchange due to the policy intervention. In a low-skilled population, the aggregate skillratio decreases for an SSM of type IV (see Proposition 4). This increase implies areduction in the social mobility because the downward flow increases in the aggregateskill ratio. In a high-skilled population, the aggregate skill ratio increases for an SSMof type IV (see Proposition 4). Therefore, the increasing downward flow results in anincrease of the social mobility. �
Summing up, education subsidies increase social mobility only in a high-skilledpopulation where the unskilled are indifferent in their investment decision with re-spect to a child with low education costs.
Comparing both types of policy intervention, redistributive taxation and educationsubsidies affect inequality and social mobility in the same way when the SSM is of typeIII or the SSM is of type IV and λ∗ < λ holds, but they have different effects in allother cases. Redistributive taxation can in no case simultaneously reduce inequalityand increase social mobility. However, education subsidies can achieve this in a high-skilled population where the unskilled are indifferent in their investment decision,having a child with low education costs.
5. Concluding remarks
This paper shows that neither redistributive taxation nor education subsidies arealways a recommended policy to help poor children become educated when parentsdecide on the education of their children and wages are endogenous. The impact ofboth policy interventions on the aggregate skill ratio as well as on inequality and so-cial mobility depends on the initial investment decisions of all parents. Under somecircumstances, both policies can definitely reduce inequality and under other circum-stances, increase social mobility. However, only education subsidies can ensure bothat the same time for at least one situation. Unfortunately, this situation requires that
14
the population without policy intervention is already characterized by a high skill ra-tio. Thus, if ‘skilled’ refers to primary education, one can say that the simultaneousimprovement of intra- and intergenerational equity can only be reached in developedcountries; if ‘skilled’ refers to higher education, it can only be reached in countrieswith a high initial level of university education. Finally, although both policies shouldincrease social mobility, conditions under which social mobility is reduced due to pub-lic provision are provided. Only when the government is aware of the specific situationcan it implement the right’ policy to raise the number of poor children that get ed-ucated. However, in a low-skilled population where unskilled parents are indifferentwith respect to an investment in a child with low education costs, neither redistribu-tive taxation nor education subsidies yield an increase in social mobility.Note that in the present model, a child’s future wage depends only on the educationdecision of its parents but not on the inherent talent of the child. Thus, this modeldoes not consider a possible positive effect in aggregate productivity or growth if themost talented agents get educated (see e.g., Hassler and Rodrıguez Mora (1998) andDe Fraja (2002) for models that consider this effect). Additionally, the influence of theanalyzed policies on social welfare could be an interesting starting point for furtherresearch. Such an approach seems to be complicated because even the special formsof the utility and production functions considered above do not allow quantifying theexact change in the skill ratio, but it can only determine the direction of change.
References
Banerjee, A. and A. Newman (1993). Occupational choice and the process of develop-ment. Journal of Political Economy 101 (2), 274–298.
Becker, G. and N. Tomes (1979). An equilibrium theory of the distribution of incomeand intergenerational mobility. Journal of Political Economy 87 (6), 1153–1189.
Bjorklund, A. and C. Kjellstrom (2002). Estimating the return to investments ineducation: how useful is the standard Mincer equation? Economics of EducationReview 21 (3), 195–210.
Bovenberg, A. and B. Jacobs (2005). Redistribution and education subsidies areSiamese twins. Journal of Public Economics 89 (11-12), 2005–2035.
De Fraja, G. (2002). The design of optimal education policies. Review of EconomicStudies 69 (239), 437–466.
De Fraja, G. (2005). Reverse discrimination and efficiency in education. InternationalEconomic Review 46 (3), 1009–1031.
Dur, R. and C. Teulings (2001). Education and efficient redistribution. CESifo Work-ing Paper 592 .
Freeman, S. (1996). Equilibrium income inequality among identical agents. Journalof Political Economy 104 (4), 1047–1064.
Galor, O. and J. Zeira (1993). Income distribution and macroeconomics. Review ofEconomic Studies 60 (1), 35–52.
15
Gaviria, A. (2002). Intergenerational mobility, sibling inequality and borrowing con-straints. Economics of Education Review 21 (4), 331–340.
Hassler, J. and J. Rodrıguez Mora (1998). IQ, social mobility and growth. C.E.P.R.Discussion Papers 1827 .
Heckman, J. J. and A. B. Krueger (2003). Inequality in America - What role forhuman capital policies? Massachusetts et al., The MIT Press.
Katz, L. F. and K. M. Murphy (1992). Changes in relative wages, 1963-1987: supplyand demand factors. Quarterly Journal of Economics 107 (1), 35–78.
Konrad, K. and A. Spadaro (2006). Education, redistributive taxation and confidence.Journal of Public Economics 90 (1-2), 171–188.
Loury, G. C. (1981). Intergenerational transfers and the distribution of earnings.Econometrica 49 (4), 843–867.
Maoz, Y. and O. Moav (1999). Intergenerational mobility and the process of develop-ment. Economic Journal 109 (458), 677–697.
Mincer, J. (1958). Investment in human capital and personal income distribution.Journal of Political Economy 66 (4), 281–302.
Mookherjee, D. and S. Napel (2007). Intergenerational mobility and macroeconomichistory dependence. Journal of Economic Theory 137 (1), 49–78.
Mookherjee, D. and D. Ray (2003). Persistent inequality. Review of Economic Stud-ies 70 (2), 369–393.
Mookherjee, D. and D. Ray (2008). A dynamic incentive-based argument for condi-tional transfers. The Economic Record 84 , Special Issue, September, 2-16.
Mookherjee, D. and D. Ray (2009). Inequality and markets: some im-plications of occupational diversity. Working Paper, Boston University,http://people.bu.edu/dilipm/wkpap/09span03.pdf.
Napel, S. and A. Schneider (2008). Intergenerational talent transmission, inequality,and social mobility. Economics Letters 99 (2), 405–409.
OECD (2009). Education at a Glance 2009: OECD indicators. Organisation forEconomic Co-operation and Development, Paris et al.
Rumberger, R. W. (2009). Education and the reproduction of economic inequalityin the United States: An empirical investigation. Economics of Education Re-view (forthcoming), [http://dx.doi.org/10.1016/j.econedurev.2009.07.006].
16
Recommended