Data Mining about
Movie Industry
중어중문학과 2011312723 홍경택
문헌정보학과 2014314637 박지원
Contents
Overview1.
Exploratory Data Analysis
Data Present Condition
Modeling
Analysis Result & Verification
Result
2.3.4.5.6.
Overview1.
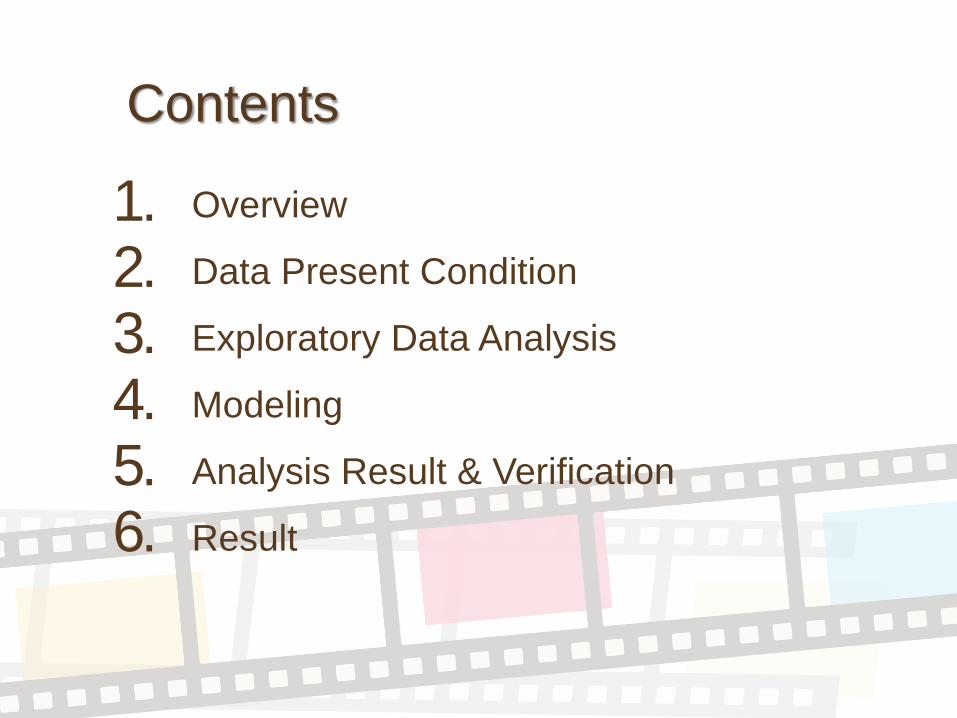
연도 2011 2012 2013 2014 2015
극장매출
(억원)
전체 12,358 14,551 15,513 16,641 17,154
증감률 5.8% 17.8% 6.6% 7.3% 3.1%
관객수(만명)
총관객수 15,972 19,489 21,335 21,506 21,729
증감률 7.1% 22.0% 9.5% 0.8% 1.0%
1인당관람횟수 (회) 3.15 3.83 4.17 4.19 4.22
< 2011-2015 Movie Theater Sales, Attendance,the Number of Watching Movie per Person >
Recent 5 years from 2011 to 2015, movie theater sales, total attendance
and the number of watching movie per person all continued to increase.
Overview1.
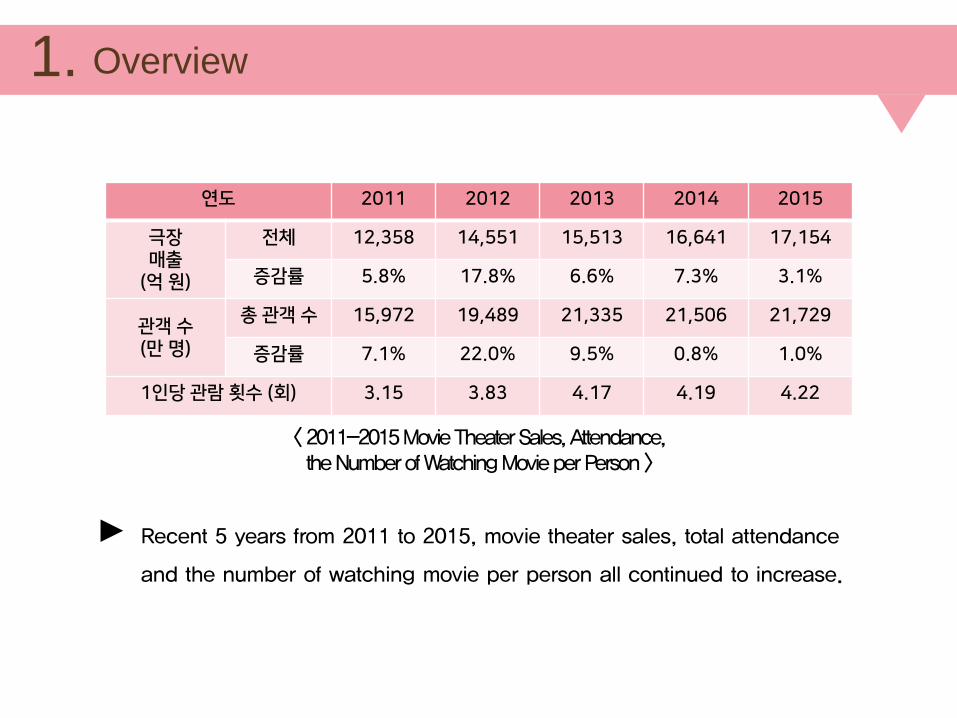
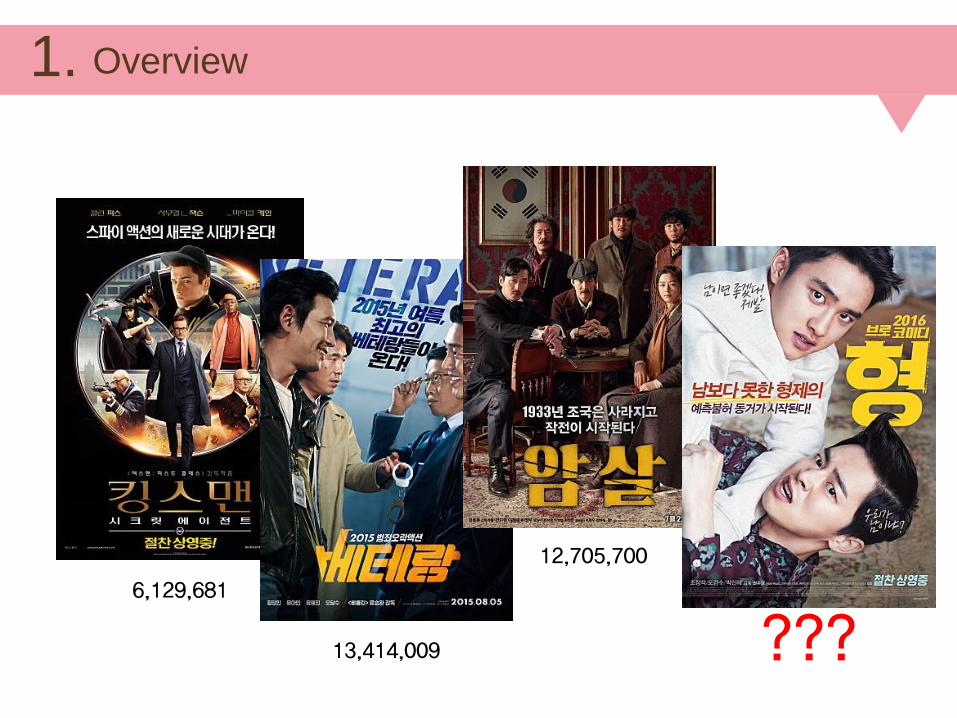
13,414,009
6,129,681
12,705,700
Hit Movie of 2015 and
its Total Attendance
Overview1.
13,414,009
6,129,681
12,705,700
???
Overview1.
“ A Study on Prediction Model of Movie Success ”
Topic
Purpose
To understand the factors that influence movie success with
various analysis techniques
To predict total attendance by framing prediction model of
movie success
To exploit the result for marketing strategy development
Data Present Condition2.
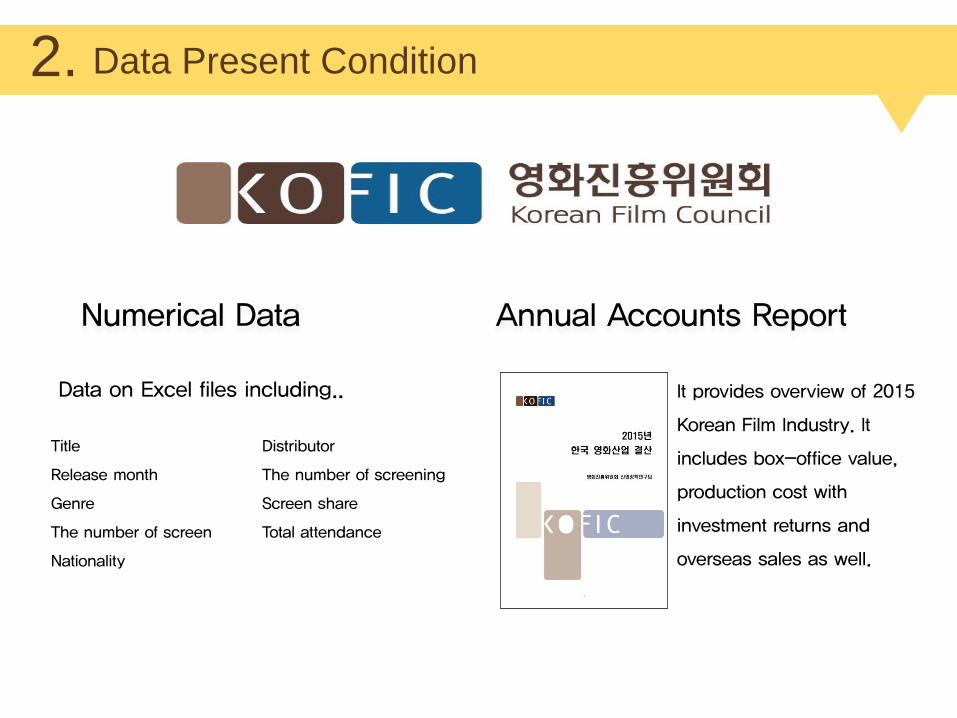
Annual Accounts ReportNumerical Data
Data Present Condition2.
Annual Accounts ReportNumerical Data
It provides overview of 2015
Korean Film Industry. It
includes box-office value,
production cost with
investment returns and
overseas sales as well.
Data on Excel files including..
Title
Release month
Genre
The number of screen
Nationality
Distributor
The number of screening
Screen share
Total attendance
Data Present Condition2.
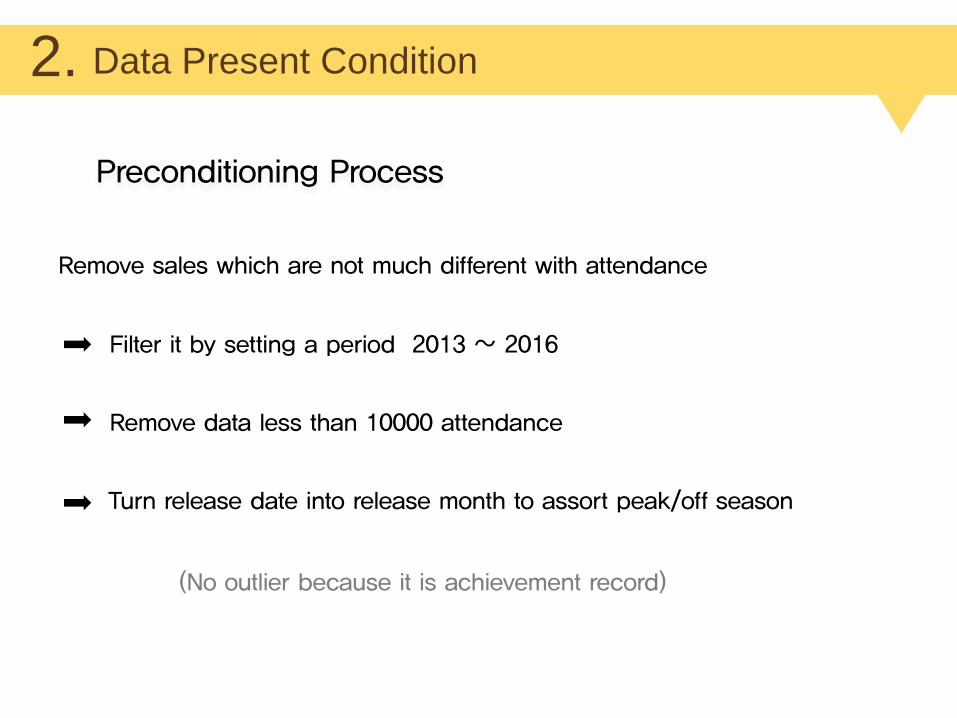
Preconditioning Process
Remove sales which are not much different with attendance
Filter it by setting a period 2013 ~ 2016
Remove data less than 10000 attendance
(No outlier because it is achievement record)
Turn release date into release month to assort peak/off season
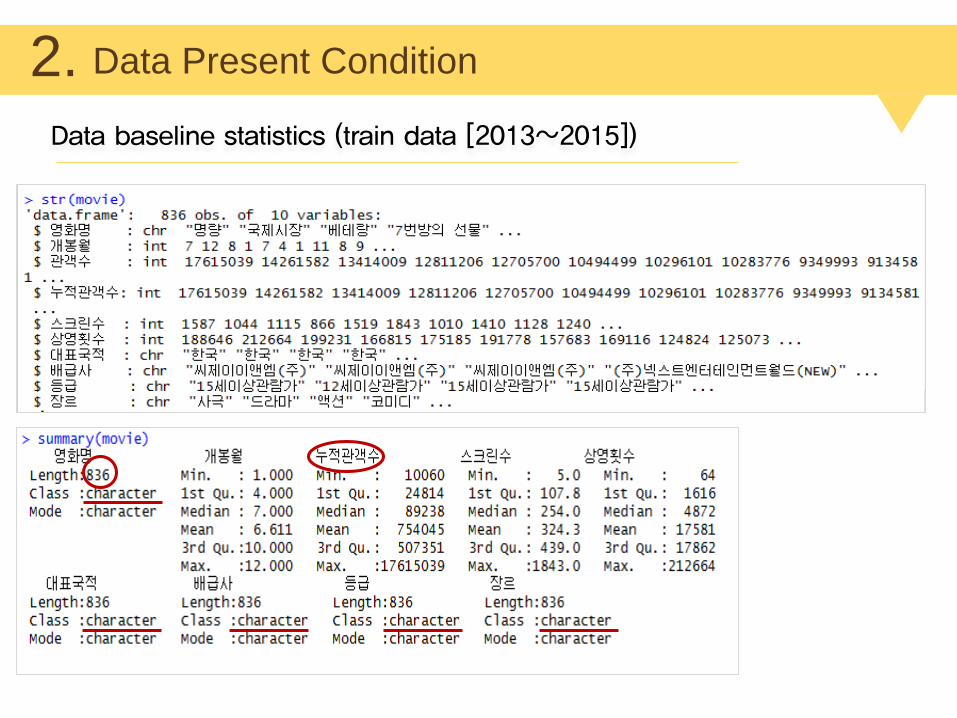
Data Present Condition2.Data baseline statistics (train data [2013~2015])
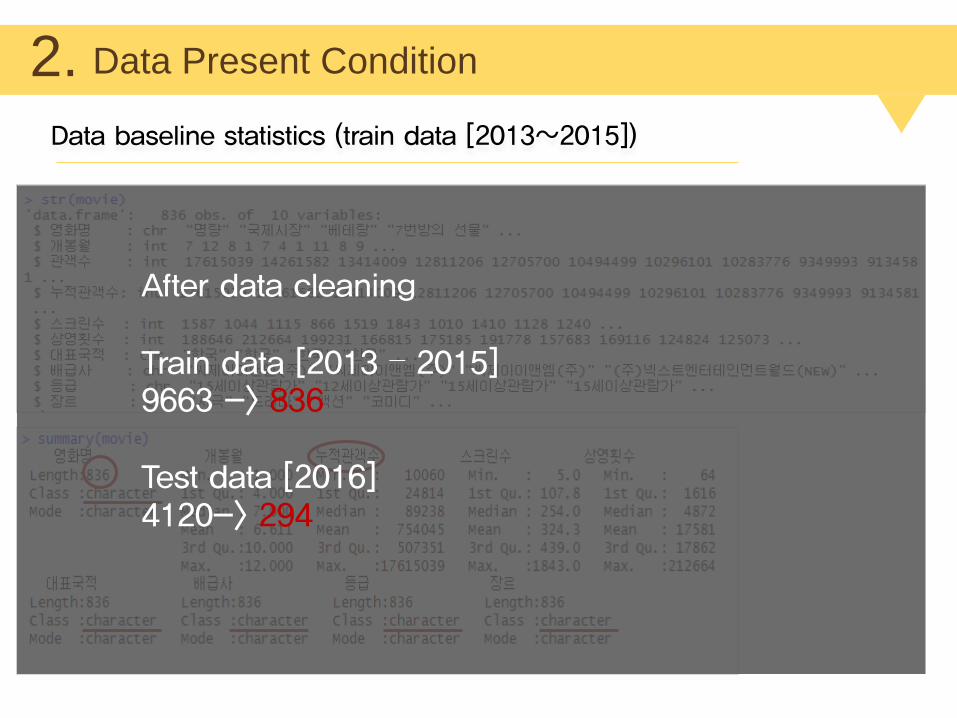
Data Present Condition2.
After data cleaning
Train data [2013 – 2015]9663 -> 836
Test data [2016]4120-> 294
Data baseline statistics (train data [2013~2015])
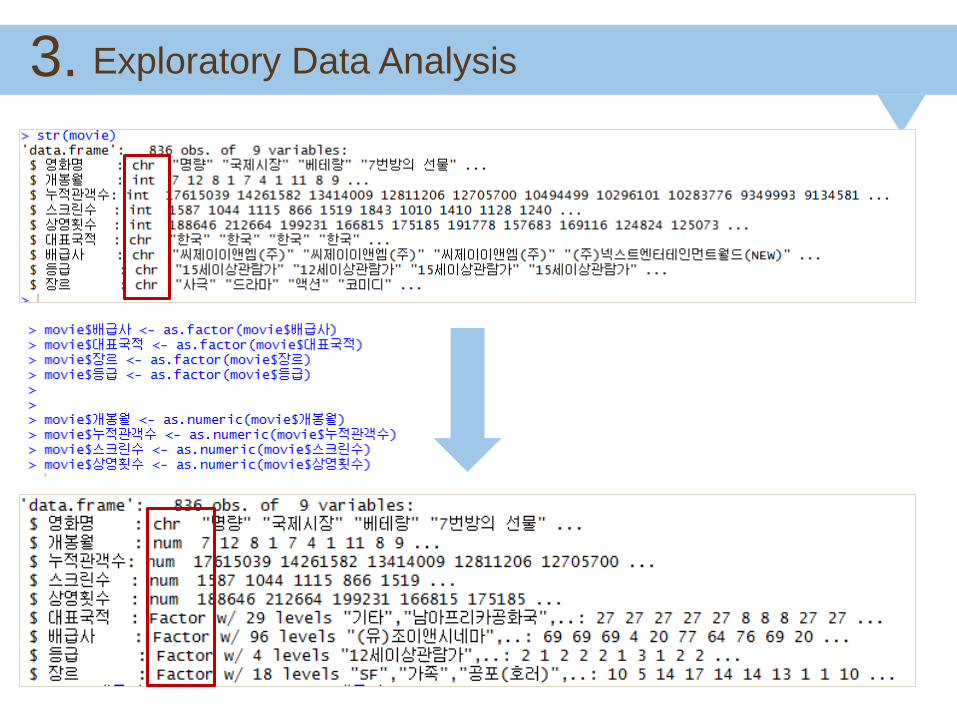
Exploratory Data Analysis 3.
Exploratory Data Analysis 3.
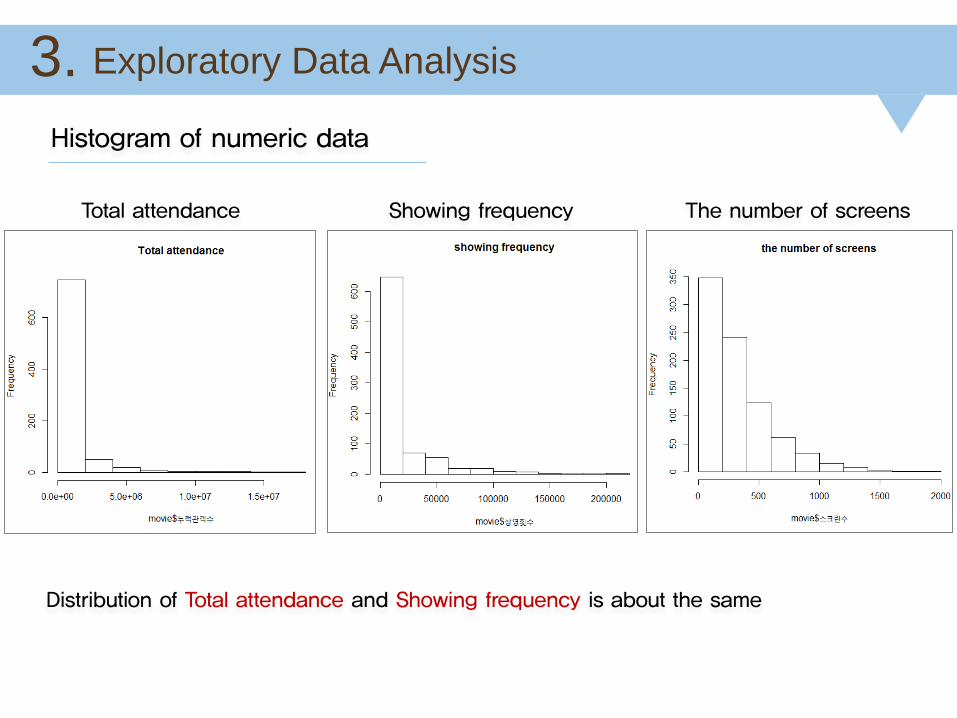
Histogram of numeric data
Total attendance Showing frequency The number of screens
Distribution of Total attendance and Showing frequency is about the same
Exploratory Data Analysis 3.
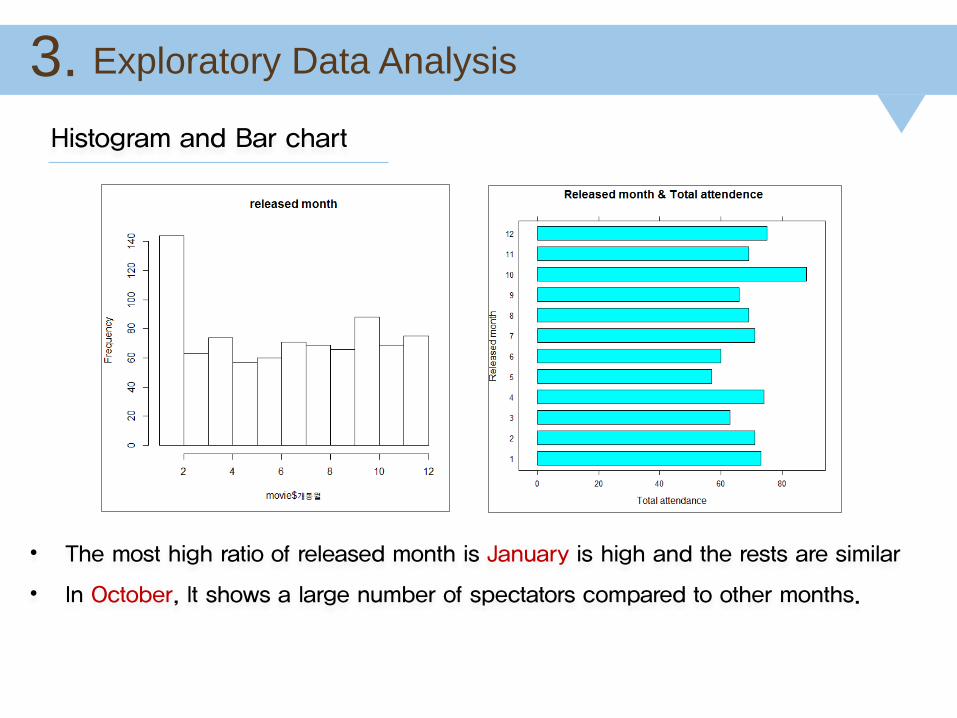
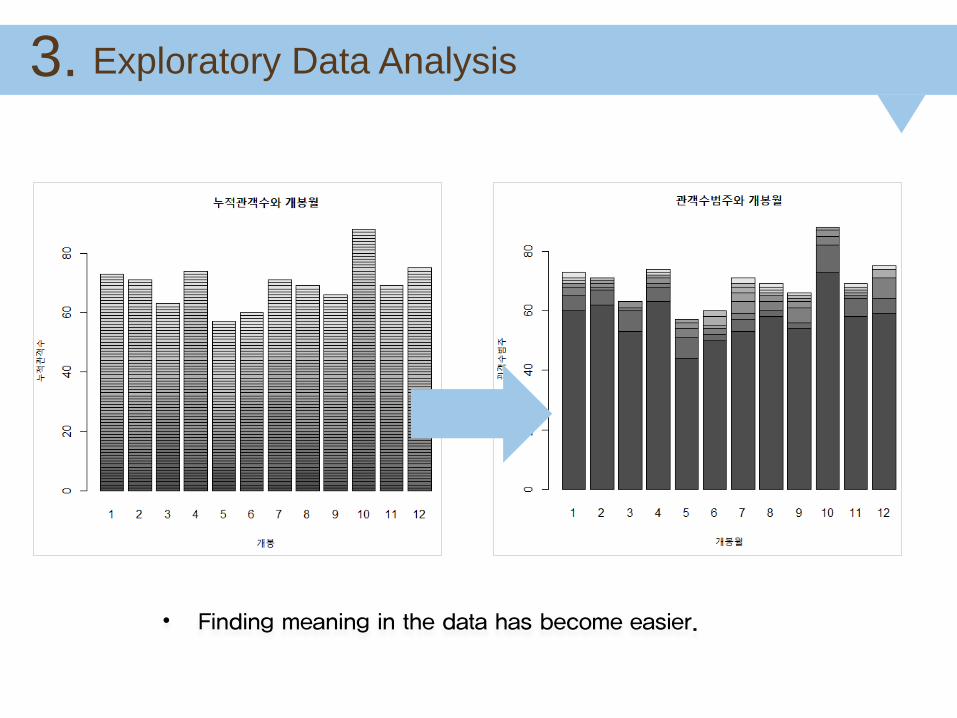
• The most high ratio of released month is January is high and the rests are similar
• In October, It shows a large number of spectators compared to other months.
Histogram and Bar chart
Exploratory Data Analysis 3.
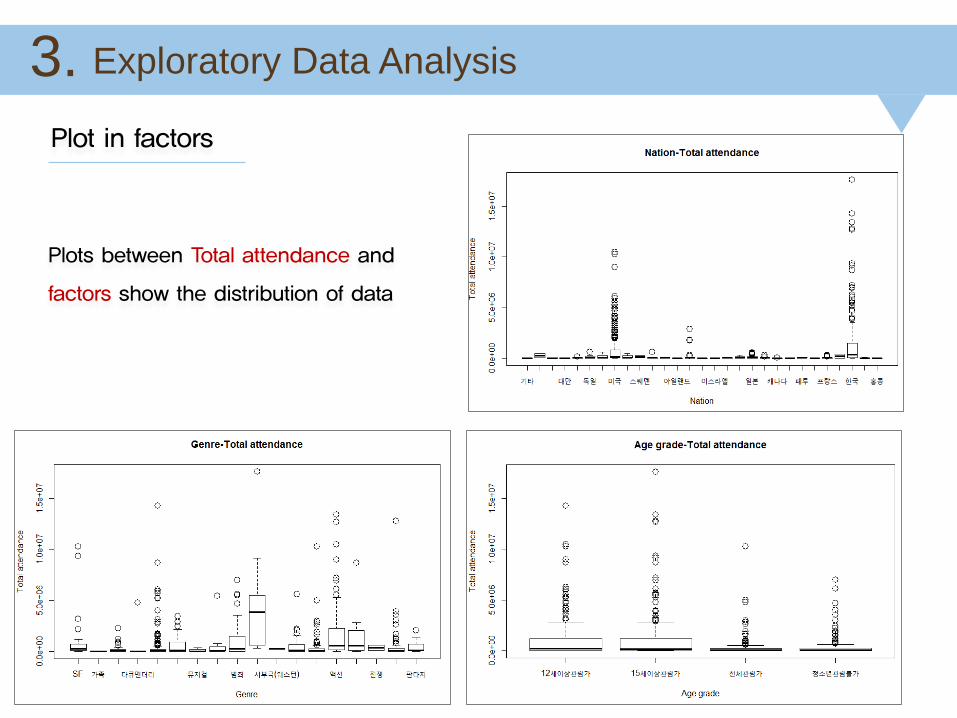
Plots between Total attendance and
factors show the distribution of data
Plot in factors
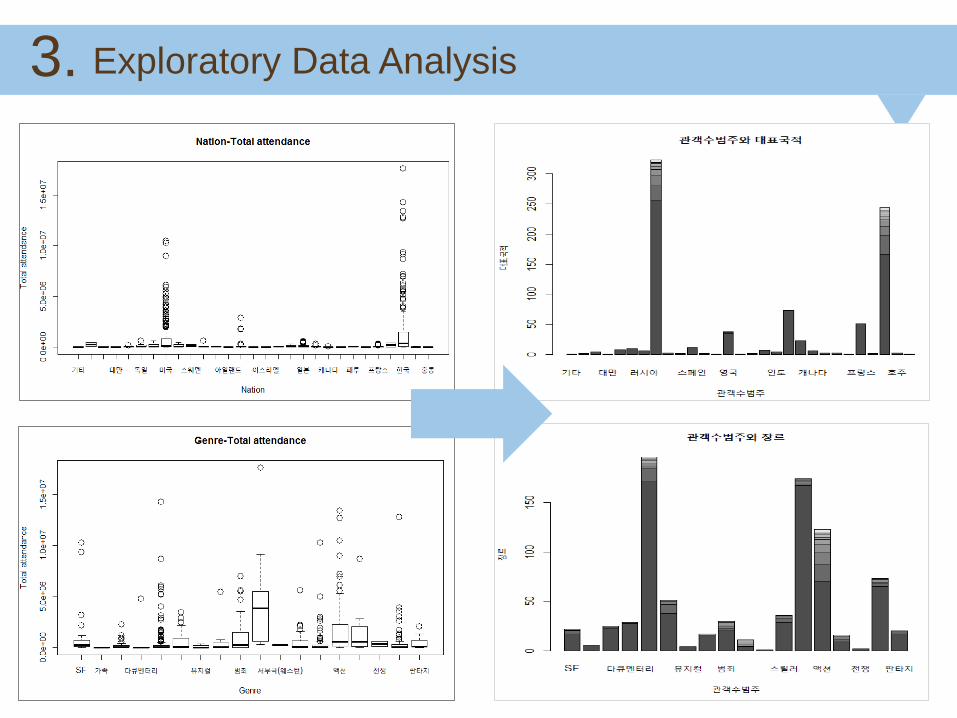
Exploratory Data Analysis 3.
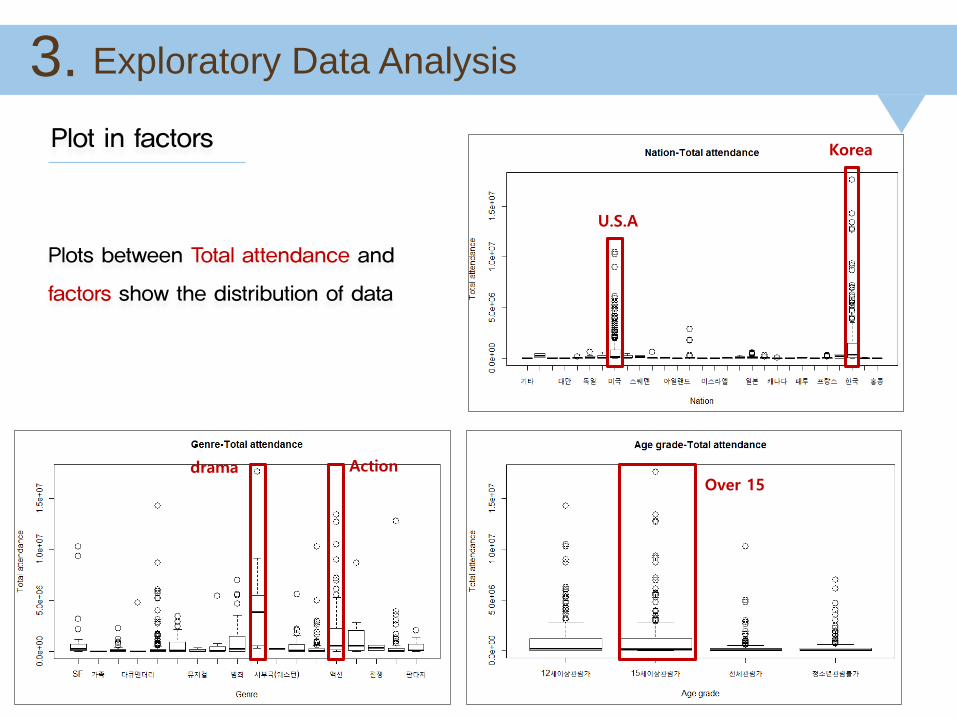
Plots between Total attendance and
factors show the distribution of data
Plot in factors
U.S.A
Korea
ActiondramaOver 15
Exploratory Data Analysis 3.
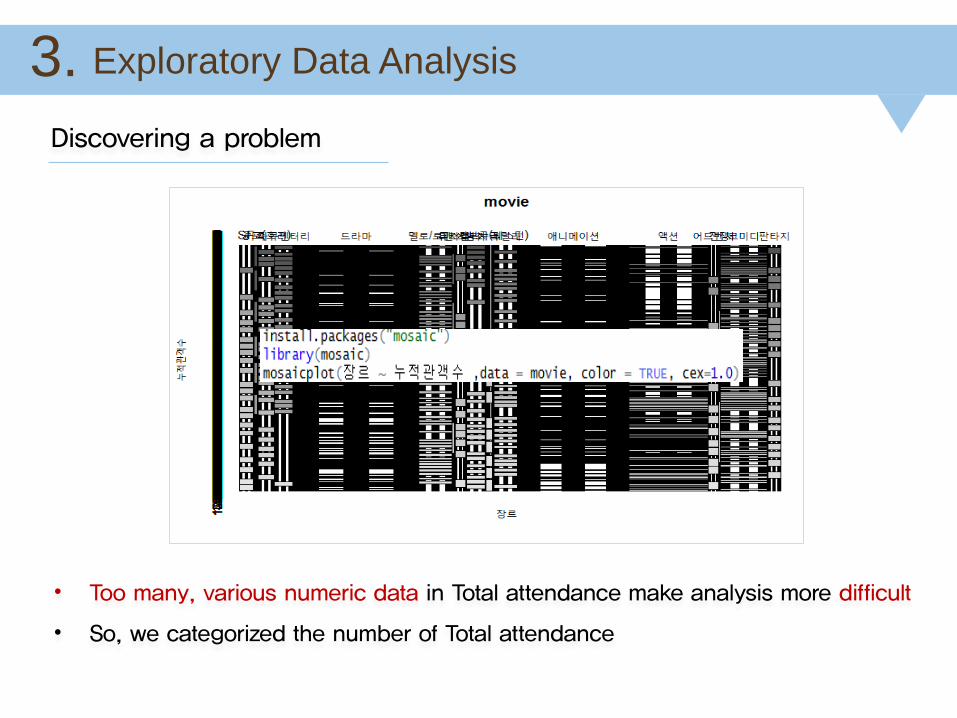
• Too many, various numeric data in Total attendance make analysis more difficult
• So, we categorized the number of Total attendance
Discovering a problem
Exploratory Data Analysis 3.
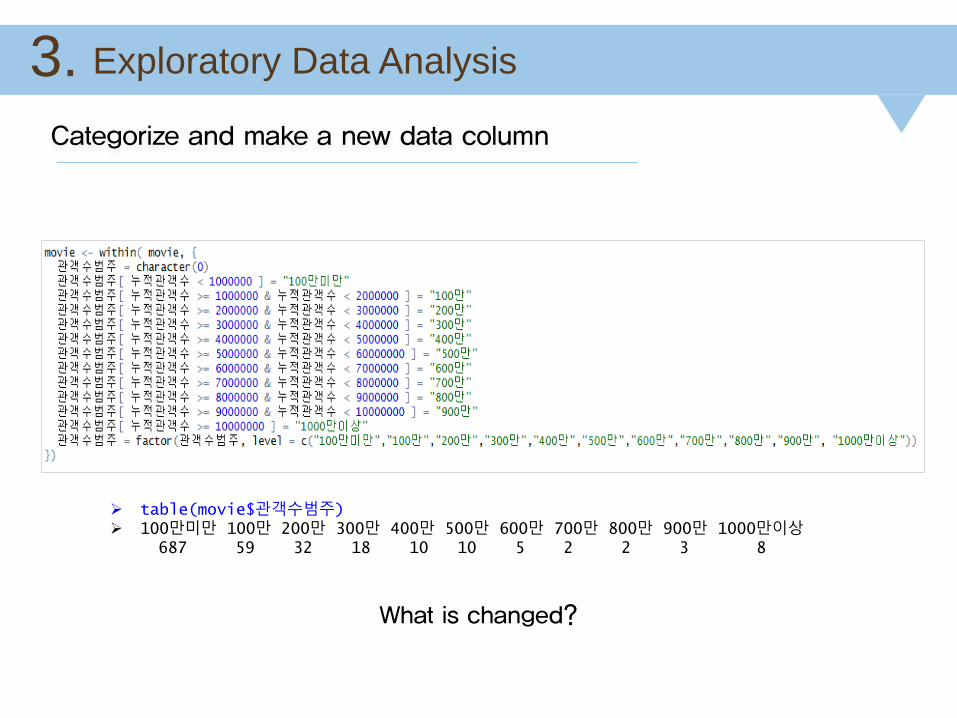
table(movie$관객수범주) 100만미만 100만 200만 300만 400만 500만 600만 700만 800만 900만 1000만이상
687 59 32 18 10 10 5 2 2 3 8
What is changed?
Categorize and make a new data column
Exploratory Data Analysis 3.
Exploratory Data Analysis 3.
• Finding meaning in the data has become easier.
Exploratory Data Analysis 3.
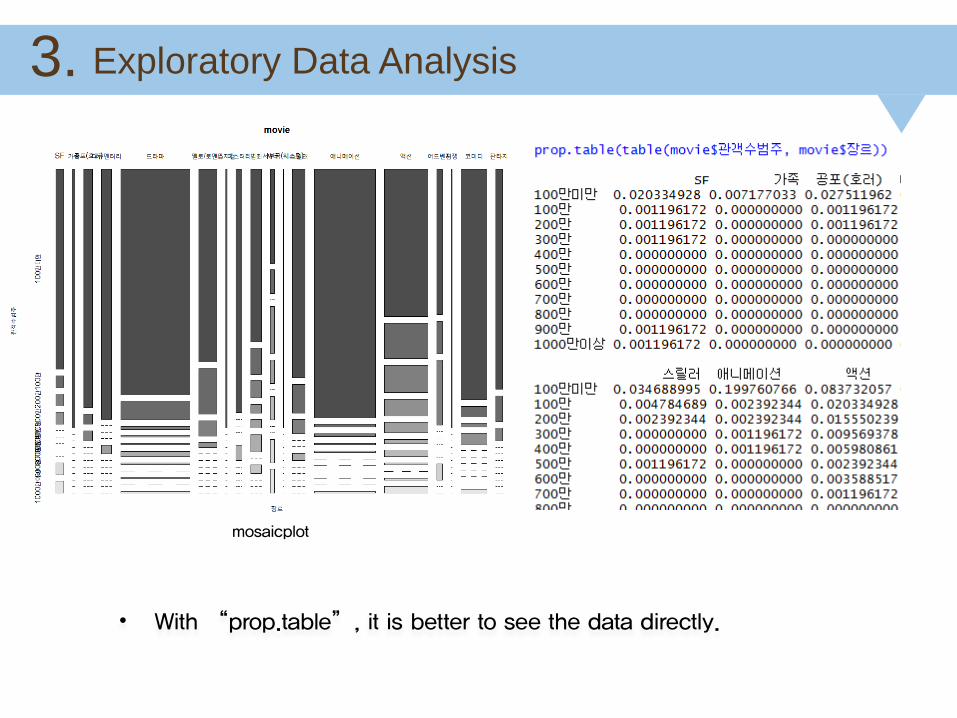
• With “prop.table”, it is better to see the data directly.
mosaicplot
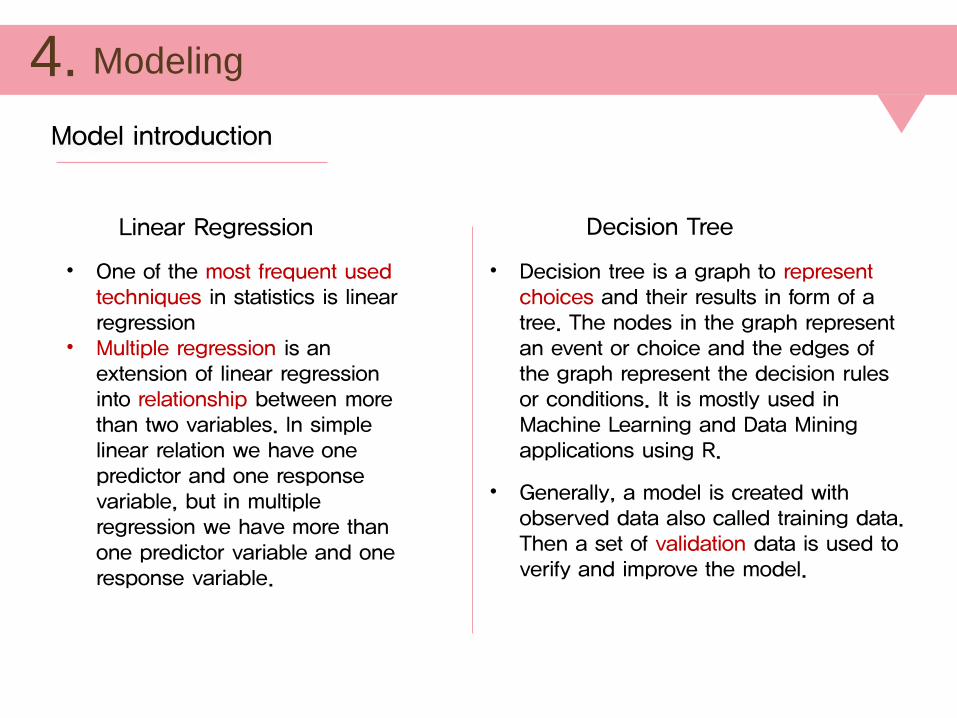
Modeling4.Model introduction
Linear Regression Decision Tree
• One of the most frequent used techniques in statistics is linear regression
• Multiple regression is an extension of linear regression into relationship between more than two variables. In simple linear relation we have one predictor and one response variable, but in multiple regression we have more than one predictor variable and one response variable.
• Decision tree is a graph to represent choices and their results in form of a tree. The nodes in the graph represent an event or choice and the edges of the graph represent the decision rules or conditions. It is mostly used in Machine Learning and Data Mining applications using R.
• Generally, a model is created with observed data also called training data. Then a set of validation data is used to verify and improve the model.
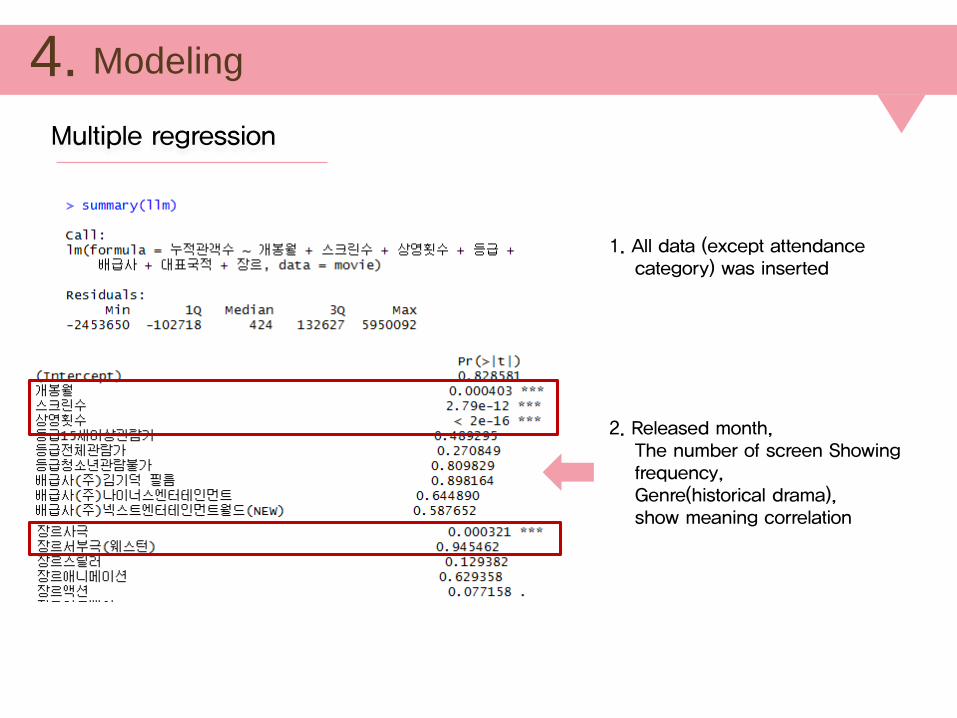
Modeling4.
1. All data (except attendancecategory) was inserted
2. Released month,The number of screen Showing frequency, Genre(historical drama),show meaning correlation
Multiple regression
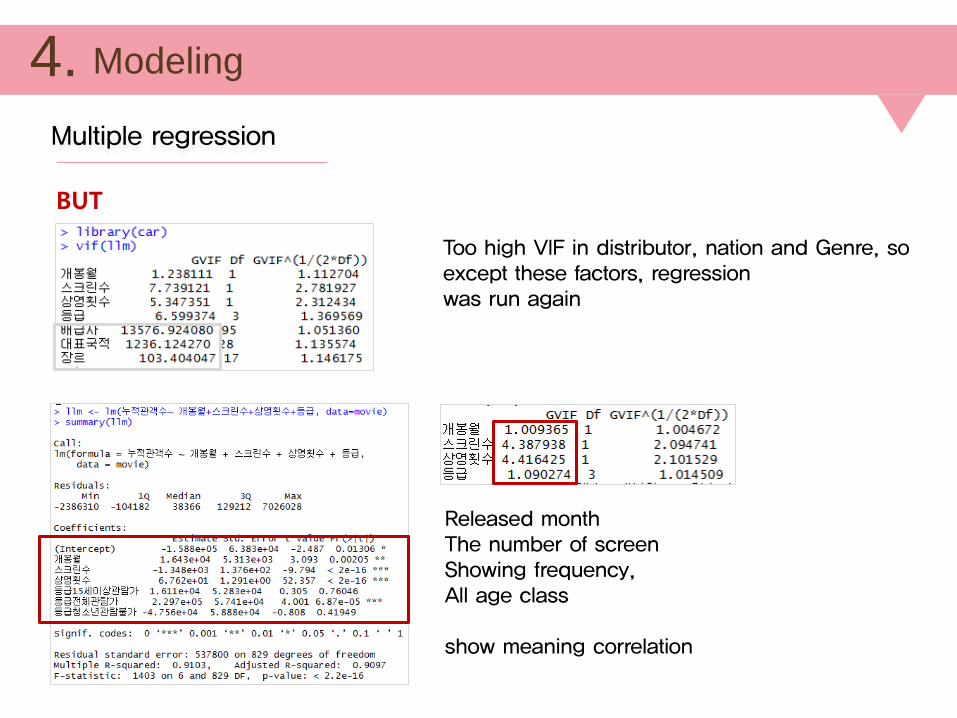
Modeling4.
BUT
Too high VIF in distributor, nation and Genre, so except these factors, regression was run again
Released month The number of screenShowing frequency, All age class
show meaning correlation
Multiple regression
Modeling4.
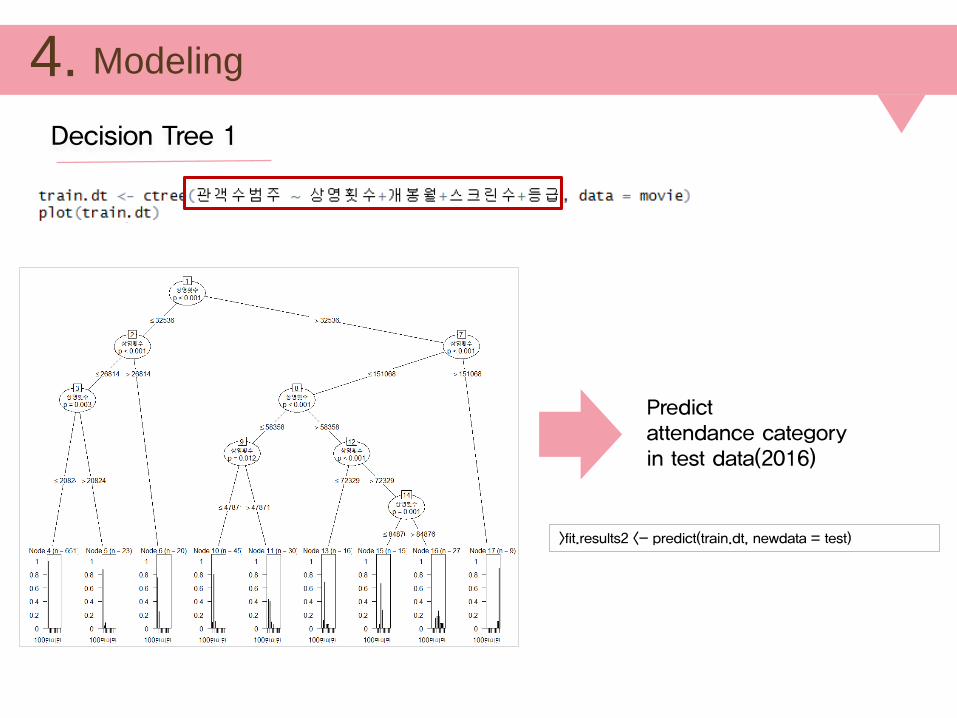
Predict attendance category in test data(2016)
>fit.results2 <- predict(train.dt, newdata = test)
Decision Tree 1
Modeling4.
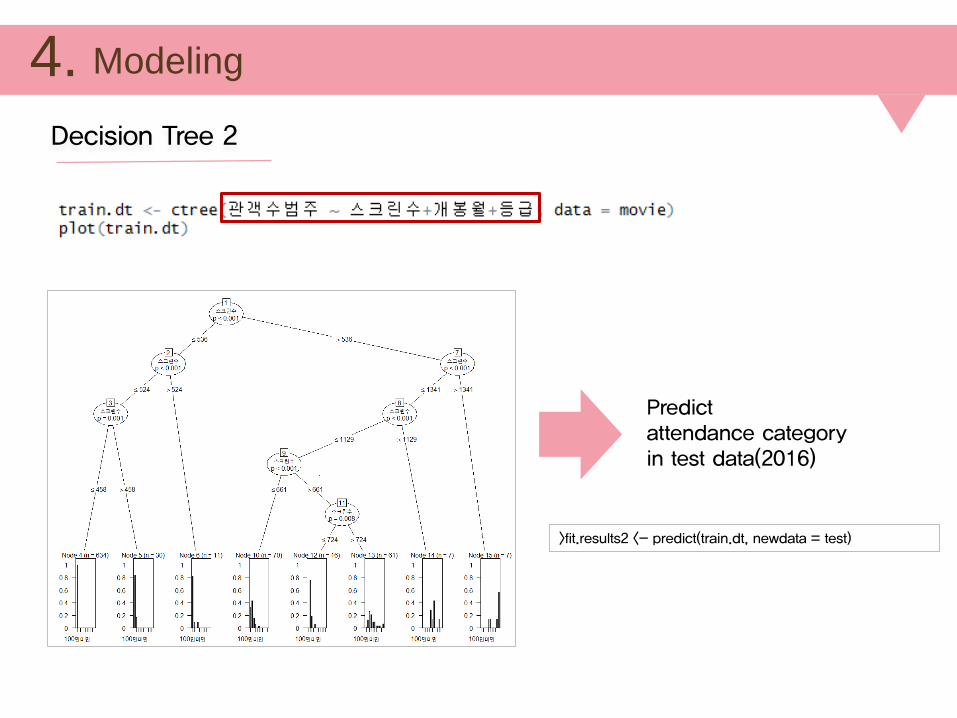
Predict attendance category in test data(2016)
>fit.results2 <- predict(train.dt, newdata = test)
Decision Tree 2
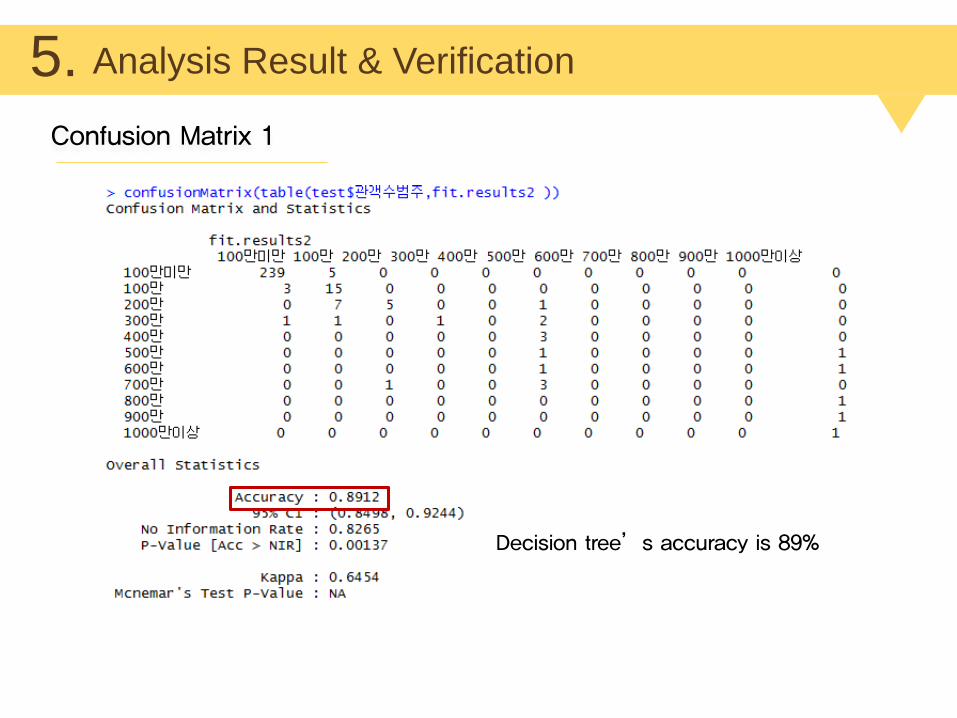
Analysis Result & Verification5.
Decision tree’s accuracy is 89%
Confusion Matrix 1
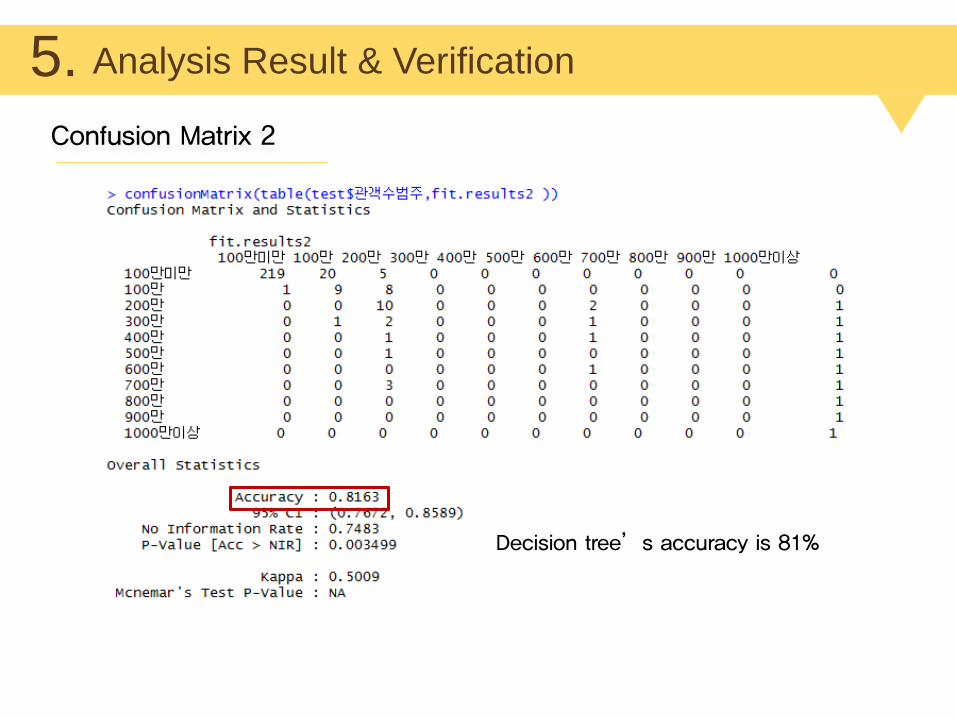
Analysis Result & Verification5.
Decision tree’s accuracy is 81%
Confusion Matrix 2
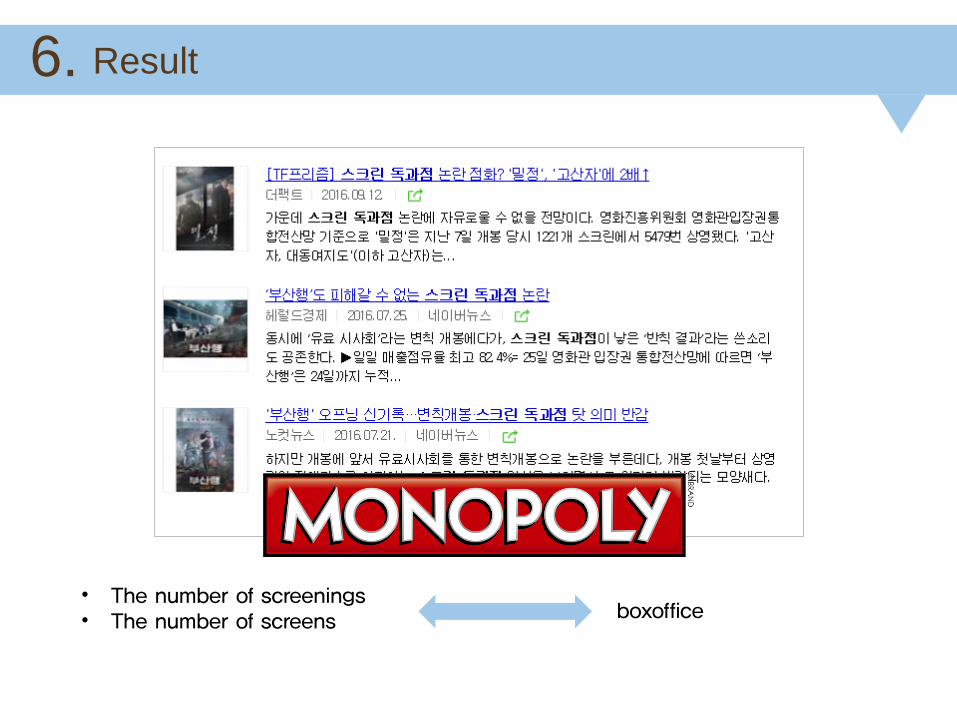
Result6.
• The number of screenings• The number of screens boxoffice
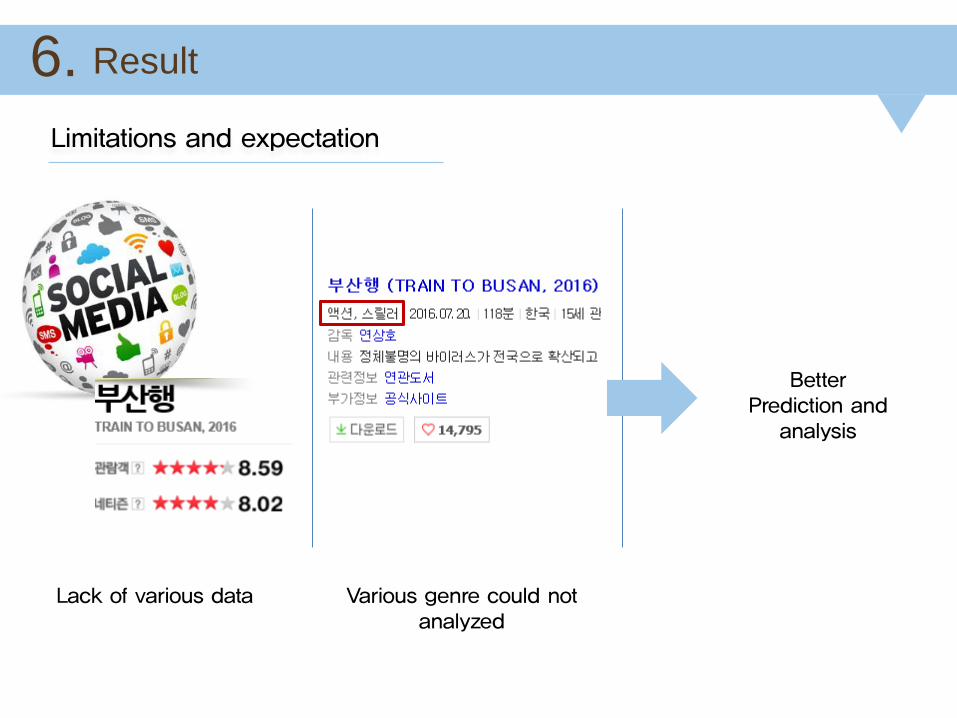
Result6.
Lack of various data Various genre could not analyzed
BetterPrediction and
analysis
Limitations and expectation

Thank You
Recommended