i
Ricardo Miguel Tomás do Couto Mestre em Biotecnologia
Development of Integrated Separation
Processes with Green Solvents
Dissertação para obtenção do Grau de Doutor em Química Sustentável
Orientador: Pedro Calado Simões, Professor Auxiliar, Universidade Nova de Lisboa
Co-orientador: Susana Barreiros, Professora Associada, Universidade Nova de Lisboa
Co-orientador: Rui Ruivo, Investigador Doutorado, Universidade Nova de Lisboa
Júri:
Presidente: Prof. Doutora Ana Isabel Aguiar-Ricardo
Arguentes: Prof. Doutor Haiko Hense Prof. Doutor Henrique Aníbal Santos de Matos
Prof. Doutor Carlos Alberto Mateus Afonso
Vogais: Prof. Doutor Pedro Miguel Calado Simões Prof. Doutora Susana Filipe Barreiros
Doutor Rui Manuel Ruivo
Dezembro 2012
ii
Development of Integrated Separation
Processes with Green Solvents
Copyright: Ricardo Miguel Tomás do Couto, Faculdade de Ciências e Tecnologia da Universidade
Nova de Lisboa, e Universidade Nova de Lisboa para todos os capítulos, excepto o Capítulo 3 – “Ionic
Liquids Screening”, que foi publicado previamente e é reproduzido aqui sob permissão do editor
original e sujeito às restrições de cópia impostas pelo mesmo
A Faculdade de Ciências e Tecnologia e a Universidade Nova de Lisboa têm o direito, perpétuo e sem
limites geográficos, de arquivar e publicar esta dissertação através de exemplares impressos
reproduzidos em papel ou de forma digital, ou por qualquer outro meio conhecido ou que venha a ser
inventado, e de a divulgar através de repositórios científicos e de admitir a sua cópia e distribuição
com objectivos educacionais ou de investigação, não comerciais, desde que seja dado crédito ao autor
e editor.
iii
Agradecimentos
Chegada a hora dos agradecimentos, tenho obrigatoriamente de começar por agradecer aos meus
orientadores, que sempre me apoiaram e acreditaram em mim, Prof. Pedro Simões, Profª. Susana
Barreiros e Dr. Rui Ruivo. Um muito obrigado muito especial por tudo o que me ensinaram.
Ao Dr. Luís Branco, por toda a ajuda nas medições de polaridades de líquidos iónicos e pela
colaboração que conseguimos estabelecer, que continua ainda a dar frutos e se estende para lá do
âmbito desta tese.
À Tânia Carvalho, que foi uma ajuda preciosa na preparação das primeiras membranas de Ion-Jelly®, e
a quem devo um grande agradecimento.
Ao João Fernandes, meu colega de gabinete que me passou o testemunho de aluno de doutoramento
do Prof. Pedro Simões, e com quem tive também oportunidade de aprender muitos conceitos de
engenharia química.
E ao Pedro Lisboa, a quem passo agora o testemunho de aluno de doutoramento do Prof. Pedro
Simões com muito gosto. Foi com muito prazer que no início ensinei e mais tarde partilhei todas as
ideias malucas que fomos tendo. Parabéns pela instalação da unidade piloto! (Quando é que
começamos a produção de cerveja?).
A todos os alunos que foram passando pelo laboratório e foram deixando contributos valiosos para os
diversos trabalhos: Beatriz Afonso, Anabela Santos, Filipe Calixto, Tiago Reis, Murilo Nascimento,
Elvis Ramos.
Ao Pedro Vidinha, que me iniciou no mundo dos supercríticos e me contagiou com o entusiasmo pela
ciência.
Ao Alexandre Paiva, companheiro de laboratório e de aventuras. Temos de inventar uma nova
aventura em breve!
Aos “colegas do lado”, presentes e passados, com quem vamos partilhando espaço e ferramentas:
Teresa Casimiro, Márcio Temtem, Mara, Eunice, Telma, Rita Restani, Vanessa, Raquel, Ana Paninho,
Anita, etc… de certeza que me estou a esquecer de alguém!
A todas as pessoas do 427 que ainda não mencionei: Sílvia Rebocho, Rita Rodrigues, Rita Craveiro,
Diana Garcia, Andreia Pimenta, Carmen Montoya e vários outros que por lá foram passando.
À Catarina Pereira e Ana Pereira pelas pausas para café nos últimos tempos.
À Fundação para a Ciência e Tecnologia, pela bolsa de doutoramento SFRH/BD/36618/2007.
Ao meu agrupamento de escuteiros, Agrupamento 337 – Caldas da Rainha, com quem muito aprendi,
e que é sempre um prazer acompanhar ao longo de todos estes anos a dar pontapés no im do
impossível.
Aos meus amigos de sempre, Filipe Ramires, João Pedro Gomes, André Pontes, Ricardo Barata,
Vanessa Nascimento, João Lopes, Ana Lucena, Leonardo Mendes, Diana Fernandes, Vítor Silva, etc.,
etc.
À minha família, por ser uma Família e estar lá sempre que preciso. E à minha avó, que já não me vê
Doutor…

iv
v
Resumo
Esta tese explora o fraccionamento de misturas com solventes não convencionais, como dióxido de
carbono supercrítico (scCO2) e líquidos iónicos à temperatura ambiente (RTILs), e desenvolve novos
processos integrados que acoplam estes solventes com membranas.
Explorou-se a possibilidade de usar membranas de osmose reversa para fraccionamentos em scCO2
com uma mistura modelo de ácido oleico e esqualeno. Todas as membranas testadas foram selectivas
para o ácido oleico. Testou-se o efeito de acoplar a membrana a um processo de extracção supercrítica
tendo-se atingido um enriquecimento combinado de 1.6 vezes.
Os RTILs foram usados para fraccionar a mistura modelo de ácido oleico e esqualeno. Escolhendo
adequadamente o anião e catião do RTIL é possível modelar o fraccionamento. Com
[EMIM][MDEGSO4] a selectividade para ácido oleico foi 2.96 e com [BMIM][NTf2] foi de 0.86.
Desenvolveu-se um método indirecto de sondar as polaridades dos RTILs usando solventes orgânicos
comuns e o corante de Reichardt, permitindo a construção de uma escala de polaridades. Mostrou-se
que os RTILs mais polares têm menores selectividades para o ácido oleico.
Desenvolveram-se membranas suportadas de líquidos iónicos e aplicaram-se no fraccionamento de
misturas modelo. Estas membranas apresentaram selectividades negligenciáveis no fracionamento da
mistura modelo de ácido oleico e esqualeno, mas apresentaram bons resultados no fraccionamento dos
produtos e reagentes de uma reacção de transesterificação, retendo completamente o glicerol e
produzindo um permeado com uma fracção mássica de ésteres metílicos de 0.85.
Desenvolveu-se um novo tipo de membranas de gel, usando gelatina como polímero de suporte para
RTILs. Apesar de estas membranas não serem capazes de fraccionar a mistura modelo de ácido oleico
e esqualeno, foram capazes de atingir um factor de separação de ésteres metílicos em relação ao
glicerol numa reacção de transesterificação de 166. Estas membranas foram também testadas na
separação de gases, mas as selectividades obtidas foram muito baixas.
Palavras Chave: CO2 Supercrítico, Líquidos Iónicos, Membranas, Processos Verdes, Integração de
Processos, Ion-Jelly®

vi
vii
Abstract
This thesis explores the fractionation of mixtures with unconventional solvents, like supercritical
carbon dioxide (scCO2) and room temperature ionic liquids (RTILs), and develops new integrated
processes which couple these solvents with membranes.
It was explored the feasibility of using reverse osmosis membranes for fractionations in scCO2 with a
model mixture of oleic acid and squalene, and it was found that all membranes tested were selective
towards oleic acid. The effect of coupling the membrane to a supercritical fluid extraction (SFE)
process was also tested, achieving a combined enrichment in squalene of 1.6 times.
RTILs were used to fractionate the model mixture oleic acid and squalene. By appropriately choosing
the anion and cation of the RTIL it was possible to model the fractionation. With [EMIM][MDEGSO4]
a selectivity towards oleic acid of 2.96 was achieved, and with [BMIM][NTF2] the selectivity was
0.86.
An indirect method of probing the polarities of RTILs is developed using common organic solvents
and Reichardt’s dye and a polarity scale is built. It was found that the most polar RTILs have lower
selectivities towards oleic acid.
Supported ionic liquid membranes were developed and applied in the fractionation of model mixtures.
These membranes had negligible selectivities for fractionating the model mixture of oleic acid and
squalene, but presented good results when fractionating the products and reactants of a
transesterification reaction, retaining completely glycerol and producing a permeate with 0.85 mass
fraction of methyl esters.
A new type of gel membranes was developed, using gelatine as a support polymer for RTILs.
Although these membranes were not able to fractionate the model mixture of oleic acid and squalene,
they were able to achieve a separation factor of methyl esters in detriment of glycerol of 166. These
membranes were also tested for the separation of gases, but the selectivities obtained were very low.
Keywords: Supercritical CO2, Ionic Liquids, Membranes, Green Processes, Process Integration, Ion-
Jelly

viii
ix
Table of Contents
Agradecimentos .................................................................................................. iii
Resumo ................................................................................................................. v
Abstract .............................................................................................................. vii
Table of Contents................................................................................................ ix
Figures Index .................................................................................................... xiii
Tables Index ..................................................................................................... xvii
Abbreviations List ............................................................................................ xix
Chapter 1 - Introduction.....................................................................................1
1.1 - Thesis Outline ............................................................................................................... 3
1.2 - Supercritical Fluids ...................................................................................................... 4
1.2.1 – Fractionations with Supercritical Carbon Dioxide ............................................................... 5
1.3 - Membranes ................................................................................................................... 5
1.3.1 - Applications in Supercritical Carbon Dioxide ...................................................................... 7
1.4 – Room Temperature Ionic Liquids ............................................................................. 8
1.5 – Supported Ionic Liquid Membranes and Gel Membranes ................................... 10
1.6 – References .................................................................................................................. 13
Chapter 2 - Reverse Osmosis Membranes......................................................19
2.1 - Introduction ............................................................................................................... 21
2.2 – Materials and Methods ............................................................................................. 22
2.2.1 - scCO2 Fractionation Experiments ....................................................................................... 22
2.2.3 - Sample analysis .................................................................................................................. 25
2.3 - Results ......................................................................................................................... 26
2.3.1 - scCO2 Permeabilities .......................................................................................................... 26
2.3.2 - Fractionation Experiments .................................................................................................. 30
2.3.3 - Membrane Separation coupled with Supercritical Fluid Extraction ................................... 35
2.3.4 - Fractionation of Raffinate Model Mixture with Membranes .............................................. 37
2.4 - Conclusions ................................................................................................................. 38
2.5 - References ................................................................................................................... 39
Chapter 3 - Ionic Liquids Screening................................................................41
3.1 - Introduction ................................................................................................................ 43
3.2 - Materials and Methods .............................................................................................. 45
3.2.1 - Apparatus and Method. ....................................................................................................... 45
x
3.3 - Results and Discussion ............................................................................................... 47
3.4 - Conclusions ................................................................................................................. 52
3.5 - References ................................................................................................................... 52
Chapter 4 - Ionic Liquids Polarities Measurements......................................55
4.1 - Introduction ................................................................................................................ 57
4.2 - Materials and Methods .............................................................................................. 59
4.2.1 - UV/Visible Spectroscopy ................................................................................................... 59
4.3 - Results ......................................................................................................................... 61
4.4 - Conclusions ................................................................................................................. 75
4.5 - References ................................................................................................................... 75
Chapter 5 - Supported Ionic Liquids Membranes.........................................79
5.1 - Introduction ................................................................................................................ 81
5.2 - Materials and Methods .............................................................................................. 83
5.2.1 - Oleic Acid and Squalene Analysis by Gas Chromatography ............................................. 84
5.2.2 - Methyl Esters Analysis by Gas Chromatography ............................................................... 85
5.2.3 - Preparation of Supported Ionic Liquid Membranes ............................................................ 85
5.2.4 - Preparation of Ion-Jelly Membranes by evaporative casting-knife method ....................... 85
5.2.5 - Preparation of Ion-Jelly Membranes by glass plates pressed method ................................ 86
5.2.6 - Characterization of Ion-Jelly Membranes ........................................................................... 86
5.2.6.1 - Traction ............................................................................................................ 86
5.2.6.2 - Contact Angles ................................................................................................. 86
5.2.6.3 - SEM Images ..................................................................................................... 87
5.2.7 - scCO2 Fractionation Experiments ....................................................................................... 87
5.2.7.1 - Elemental Analysis ........................................................................................... 87
5.2.8- Single Gas Permeabilities .................................................................................................... 87
5.3 - Results ......................................................................................................................... 89
5.3.1 - Supported Ionic Liquids Membranes .................................................................................. 89
5.3.2 - Development of Ion-Jelly® Membranes prepared by evaporative casting-knife method ... 93
5.3.2.1 - Traction ............................................................................................................ 93
5.3.2.2 - Contact Angles ................................................................................................. 95
5.3.2.3 - scCO2 Permeability Measurements ................................................................. 96
5.3.2.4 - SEM images ..................................................................................................... 97
5.3.3 - scCO2 Fractionation Experiments ....................................................................................... 99
5.3.3.1 - Elemental Analysis ......................................................................................... 101
5.3.4 - Development of Ion-Jelly® Membranes prepared by glass plates pressed method .......... 102
5.3.4.1 - Traction .......................................................................................................... 102
5.3.4.2 - Contact Angles ............................................................................................... 103
5.3.4.3 - scCO2 Permeability Measurements ............................................................... 104

xi
5.3.4.4 - SEM images ................................................................................................... 105
5.3.5 - scCO2 Fractionation Experiments ................................................................................... 1075
5.3.5.1 - Elemental Analysis ......................................................................................... 108
5.3.6 - Single Gas Permeabilities of Ion-Jelly® Membranes Prepared by the Glass Plates Pressed
Method. ........................................................................................................................................ 109
5.4 - Conclusions ............................................................................................................... 111
5.5 - References ................................................................................................................. 112
Chapter 6 – Conclusions and Future Work………………………………..115
Appendix – Complete ETN Tables…………………………………………..121

xii
xiii
Figures Index
Figure 1.1 – Generic phase diagram of a common pure substance, including the
supercritical region. CP: critical point, TP: triple point, Tc: critical temperature, Pc:
critical pressure. 4
Figure 1.2 – Schematic representation of a membrane process. 5
Figure 1.3 – Schematic representation of a two-phase system separated by a membrane. 6
Figure 1.4 – Structures of some common ionic liquids cations and anions. 9
Figure 2.1 – Molecular structures of squalene and oleic acid. 22
Figure 2.2 – Flow scheme of the high pressure apparatus for the fractionation experiments
with scCO2. 23
Figure 2.3 – Stainless steel flat sheet membrane test cell. a) Scheme of the module; b)
Picture of the module assembled in the apparatus. 24
Figure 2.4 – scCO2 permeabilities for Polyamide AD membrane at 313 K and two
pressures. 26
Figure 2.5 – scCO2 permeabilities for Polyamide AG membrane at 313 K and several
pressures. 27
Figure 2.6 – scCO2 permeabilities for Teflon Af 2400 membrane at 313 K and two
pressures. 27
Figure 2.7 – scCO2 permeabilities for Cellulose Acetate membrane at 313 K and two
pressures. 28
Figure 2.8 – scCO2 permeabilities for Thin-Film SG membrane at 313 K and two
pressures. 28
Figure 2.9 – scCO2 permeabilities for Polyamide AD, Polyamide AG, Teflon Af 2400 and
Cellulose Acetate membranes at 313 K and 18 MPa. 29
Figure 2.10 – scCO2 permeabilities for Polyamide AD and Thin-Film SG membranes at
313 K and 18 MPa, obtained in this work (open symbols) and obtained at TUHH (closed
symbols). 30
Figure 2.11 – scCO2 permeabilities for Teflon Af, Polyamide AG and Cellulose Acetate
membranes at 313 K and 18 MPa, obtained in this work (open symbols) and obtained at
TUHH (closed symbols). 30
Figure 2.12 – Squalene selectivities and corresponding CO2 densities for Polyamide AD
membrane. 31
Figure 2.13 – Squalene selectivities and corresponding CO2 densities for Cellulose
Acetate membrane. 32
xiv
Figure 2.14 – Squalene selectivities and corresponding CO2 densities for Thin-Film SG
membrane. 33
Figure 2.15 – Squalene selectivities at 18 MPa and 313 K for three membranes. AC:
Cellulose Acetate; AD: Polyamide AD; SG: Thin-film SG 33
Figure 2.16 – Squalene selectivities at 18 MPa and 323 K for three membranes. AC:
Cellulose Acetate; AD: Polyamide AD; SG: Thin-film SG 34
Figure 2.17 – Squalene selectivities at 22 MPa and 323 K for three membranes. AC:
Cellulose Acetate; AD: Polyamide AD; SG: Thin-film SG 34
Figure 2.18 – Squalene mass fractions obtained with the coupling of Polyamide AD
membrane with SFE column, at 313 K, 18 MPa, CO2 flow of 40 g/min and feed flow of
1.2 g/min. 36
Figure 2.19 – Squalene mass fractions obtained with the coupling of Polyamide AD
membrane with SFE column, at 313 K, 18 MPa, CO2 flow of 90 g/min and feed flow of
4.5 g/min. 37
Figure 3.1 - Molecular structures of the ionic liquids cations and anions studied in this
work. 44
Figure 3.2 - High pressure apparatus for the extraction of solutes from the ionic liquid and
oil phases. 46
Figure 3.3 - Partition coefficient of oleic acid with A+ [BF4]
- ionic liquids.
48
Figure 3.4 - Partition coefficient of oleic acid with [BMIM]+ X
- ionic liquids.
49
Figure 3.5 – Partition coefficient of oleic acid with different proportions of model mixture
and [(C6)3C14P][NTf2]. 49
Figure 4.1 – Molecular structures of solvents and probe (betaine) used in this work. 59
Figure 4.2 – Molecular structures of ionic liquids cations and anions used in this work. 60
Figure 4.3 - Anion effect in ETN values of acetonitrile.
63
Figure 4.4 - Cation effect in ETN values of acetonitrile.
64
Figure 4.5 – Range of effects in acetonitrile polarity for individual anions and cations, in
ETN values.
66
Figure 4.6 – Effect in ETN values of acetonitrile by the continuous addition of ionic liquid
to acetonitrile. 67
Figure 4.7 - Anion effect in ETN values of ethanol.
68
Figure 4.8 - Cation effect in ETN values of ethanol.
69
Figure 4.9 - Effect in ETN values of the addition of RTILs to tetrahydrofuran, pre-dried
tetrahydrofuran, chloroform and isopropanol. 71
Figure 4.10 – Effect in ETN values of continuous addition of [BMIM][BF4] to solvents.
72
Figure 5.1 – Generic transesterification reaction. 82
xv
Figure 5.2 – Structure of ionic liquids cations and anions used in this work. 84
Figure 5.3 – Experimental set-up for measuring the permeability of the SILMs for a single
gas. 88
Figure 5.4 - scCO2 permeability in commercial reverse osmosis membranes (see Chapter
2) and supported ionic liquids membranes at 18 MPa and 313 K. 90
Figure 5.5 – Squalene selectivities with reverse osmosis membranes and their
corresponding supported ionic liquid membranes at 18 MPa and 313 K. 91
Figure 5.6 - Fractionation of effluent stream of enzymatic transesterification of sunflower
oil to biodiesel with [BMIM][DCA] supported in cellulose acetate membrane. Operating
conditions were 20 MPa and 323 K. 92
Figure 5.7 – Stress-strain curves of Ion-Jelly® membranes prepared by evaporative
casting-knife method.
94
Figure 5.8 – Pictures of a) Ion-Jelly® based in [BMIM][DCA] membrane and b) gelatine
membrane. 95
Figure 5.9 – Contact angles of [BMIM][DCA] Ion-Jelly® membranes prepared according
to evaporative casting-knife method. 95
Figure 5.10 – scCO2 permeability in commercial reverse osmosis membranes and Ion-
Jelly® membranes without thickness control.
96
Figure 5.11 – scCO2 permeability in [BMIM][DCA] Ion-Jelly®
membranes with and
without thickness control. 97
Figure 5.12 – SEM images of Ion-Jelly® membranes prepared by evaporative casting-
knife method. 98
Figure 5.13 – Squalene selectivities with Ion-Jelly®
membranes prepared according to
evaporative casting-knife method at 18 MPa and 313 K. 99
Figure 5.14 – Squalene selectivities with Ion-Jelly® membranes prepared by the
evaporative casting-knife method at 18 MPa and 313 K. 100
Figure 5.15 – SEM image of the surface of a [BMIM][DCA] membrane 0.5 mm in
thickness. The red circle indicates two air bubbles which remained during the jellification
process. 100
Figure 5.16 – Stress-strain curves of Ion-Jelly® membranes prepared by glass plates
pressed method. 102
Figure 5.17 – Water contact angles in Ion-Jelly® membranes prepared by glass plates
pressed method. 103
Figure 5.18 – Triglycerides contact angles in Ion-Jelly® membranes prepared by glass
plates pressed method. 104
Figure 5.19 – scCO2 permeability in commercial reverse osmosis membranes (see Chapter 104
xvi
2) and Ion-Jelly® membranes prepared by glass plates pressed method.
Figure 5.20 – SEM images of Ion-Jelly® membranes prepared by glass plates pressed
method. 106
Figure 5.21 – Selectivity of squalene with [BMIM][DCA] Ion-Jelly® membranes prepared
by the glass plates pressed method at 18 MPa and 313 K. 107
Figure 5.22 – Fractionation of effluent stream of enzymatic transesterification of
sunflower oil to biodiesel with [BMIM][DCA] Ion-Jelly®
membrane. Operating
conditions were 20 MPa and 323 K. 108
Figure 5.23 – Gas permeabilities of the Ion-Jelly® membranes as a function of the gas
Lennard–Jones diameter. 110
xvii
Tables Index
Table 1.1 – Range of permeations possible to obtain according to particle size, for different
membranes. 7
Table 2.1 – Geometric characteristics of Sulzer EX gauze packing used in this work 25
Table 2.2 – Selectivity of squalene towards oleic acid, CO2 densities and permeate fractions
for Cellulose Acetate, Polyamide AD and Thin-Film SG at different pressure and temperature
conditions. 35
Table 2.3 – Results obtained in the fractionation of raffinate model mixture with membranes. 38
Table 3.1 - Partition coefficients of oleic acid for the ionic liquids studied in this work. 47
Table 3.2 - Solvent polarity of RTIL determined by solvatochromism (Reichardt’s method). 51
Table 4.1 – Wavelength values obtained and calculated ET(30) and , from literature and
this work, for pure [BMIM][BF4] with addition of Reichardt’s dye. 61
Table 4.2 – Effects in polarity of the addition of ionic liquids to acetonitrile. 62
Table 4.3 – Effects in polarity of the addition of ionic liquids to ethanol. 68
Table 4.4 – Effects in polarity of the addition of ionic liquids to tetrahydrofuran, chloroform
and isopropanol. 70
Table 4.5 - Effects in polarity of the addition of [BMIM][BF4] to different solvents. 72
Table 4.6 – Ordered ETN values of common RTILs tested in acetonitrile and ethanol. 73
Table 4.7 – Partition coefficients of oleic acid for the ionic liquids studied in this chapter and
corresponding ETN value in ethanol. 73
Table 4.8 - Solvent polarity of pure RTILs determined by solvatochromism (Reichardt’s
method) as found in published literature. 74
Table 5.1 – Amounts of ionic liquids impregnated in respective membranes and solubilities
of CO2 in ionic liquids reported in the literature at pressure and temperature conditions used
in this work (18 MPa, 313 K). 89
Table 5.2 – Values obtained for diverse membranes in the fractionation of a model mixture
of oleic acid and squalene. 92
Table 5.3 – Young modulus of Ion-Jelly® membranes. 94
Table 5.4 – Values obtained for diverse membranes in the fractionation of a model mixture
of oleic acid and squalene and a model mixture of methyl oleate and squalene. 99
Table 5.5 – Nitrogen detected by elemental analysis in several streams. 101
Table 5.6 – Young modulus of Ion-Jelly® membranes prepared by glass plates pressed
method. 103
Table 5.7 – Nitrogen detected by elemental analysis in several streams. 109

xviii
Table 5.8 – Permeabilities of pure gases and calculated ideal selectivities. 111
Table A.1 – ETN values for acetonitrile. 123
Table A.2 - ETN values for Ethanol. 124
Table A.3 - ETN values for Tetrahydrofuran. 124
Table A.4 – ETN values for Pre-dried Tetrahydrofuran. 124
Table A.5 – ETN values for Chloroform. 125
Table A.6 – ETN values for isopropanol. 125
xix
Abbreviations List
αi/j – Selectivity of component i over component j
β – Geometric parameter
Δl – Change in length
ΔP – Pressure drop
ε - Strain
µi/j – Number of moles of component i per number of moles of component j
µL - Microliter
µm – Micrometer
λmax - Wavelength of the maximum of the long-wavelength
max – Wavenumber
σ – Stress
A – Cross-sectional area
A – Membrane area
A+ - Generic cation
Å - Angstrom
AC – Cellulose acetate membrane
ACN - Acetonitrile
AD – Polyamide AD membrane
[ALIQUAT] – Tri-octyl-methyl-ammonium
[BDMIM] - 1-butyl-2,3-dimethyl-imidazolium
BES - 2-[N,N-bis(2-hydroxyethyl)amino]ethanesulfonate
[BF4] – Tetrafluroborate
[BMIM] - 1-butyl-3-methyl-imidazolium
[BMPyr] - 1-butyl-3-methylpyrrolidinium
BPR - Back Pressure Regulator
c (page 50) – Speed of Light
C (page 47) - Concentration
ºC – Celsius Degree
[C2] - (2-hydroxyethyl)-ethyl-dimethyl-ammonium
[C2OHMIM] - 1-(2-hydroxyethyl)-3-methyl-imidazolium
[C3OMIM] – 1-(2-Methoxyethyl)-3-methyl-imidazolium
[C5O2MIM] - 1-[2-(2-Methoxyethoxy)-ethyl]-3-methyl-imidazolium
[(C6)3C14P] - Trihexyl-tetradecyl-phosphonium
[C10MIM] - 1-decyl-3-methyl-imidazolium
xx
C14:0 – Myristic acid
C16:0 – Palmitic acid
C16:1 – Palmitoleic acid
C18:0 – Stearic acid
C18:2 – Linoleic acid
ca. – circa
CH4 - Methane
CHCl3 – Chloroform
CHES - 2-(Cyclohexylamino)-ethanesulfonate
[Cl] - Chloride
cm – Centimeter
cm2 – Square centimeter
cm3 – Cubic centimeter
CO2 – Carbon dioxide
CT – Charge transfer
CVi - Check-Valves
Da – Dalton
[DCA] – Dicyanamide
[DMG] - Dimethylguanidinium
[EMIM] - 1-ethyl-3-methyl-imidazolium
ET(30) – Reichardt’s empirical scale of solvent polarity
ETN – Normalized scale of solvent polarity
EtOH - Ethanol
[EtSO4] - Ethylsulfate
EPV - Electro-Pneumatic Valve.
F – Applied force
FID – Flame ionization detector
g - Gram
GC – Gas chromatography
h – Planck’s constant
H2 - Hydrogen
HPLC – High performance liquid chromatography
I.D. – Internal diameter
i.e. – id est; in other words
IJ – Ion-jelly
IL – Ionic liquid
i-PrOH - isopropanol
xxi
IUPAC – International Union of Pure and Applied Chemistry
K –Kelvin Degree
KD – Partition coefficient
KPa – Kilopascal
l – Membrane thickness
L - Length
m – Meter
m2 – Square meter
m3 – Cubic meter
[MDEGSO4] - 2-(2-methoxyethoxy)-ethylsulfate
MFM - Mass flow meter
mg - Milligram
min - Minute
mL - Milliliter
mm – Millimeter
mM – Millimolar
MO – Methyl oleate
mol – Moles
MOPSO - 2-hydroxy-3-(4-morpholino)propanesulfonate
MPa – Megapascal
[MSO4] – Methanesulfonate
N – Newton
N2 - Nitrogen
NA – Avogadro’s constant
nm - nanometer
[NTf2] - Bis(trifluoromethylsulfonyl)-imide
O2 - Oxygen
OA – Oleic acid
[OMIM] - 1-octyl-3-methyl-imidazolium
P – Membrane permeability
Pa - Pascal
[PF6] – Hexafluorophosphate
pfeed – Pressure in the feed compartment
PI - Pressure Indicator
Pperm – Pressure in the permeate compartment
PTI - Pressure and Temperature Indicator
PTV – Programmed temperature vaporizing
xxii
R – Generic substituent
Ref. - Reference
RO – Reverse Osmosis
RTIL – Room temperature ionic liquid
s - Second
scCO2 - Supercritical carbon dioxide
SEM – Scanning electron microscopy
S/F – Solvent-to-feed mass flow ratio
SFE – Supercritical fluid extraction
SG – Thin-Film SG membrane
SILM – Supported ionic liquid membrane
SQ – Squalene
t - Time
THF - Tetrahydrofuran
TMS - Tetramethylsilane
TUHH - Technische Universität Hamburg-Harbug
UV/Vis – Ultraviolet/Visible
Vi - Valves
Vfeed – Volume of the feed compartment
Vol. – Volume
Vperm – Volume of the permeate compartment
vs. - Versus
wt% - Weight percent
w/w – Weight per weight
X- - Generic anion
Xi/j – Mole fraction of component i in component j

1
Chapter 1
Introduction

2
3
1.1 Thesis Outline
This thesis explores the fractionation of mixtures with unconventional solvents, like
supercritical carbon dioxide (scCO2) and room temperature ionic liquids (RTILs), and develops
new integrated processes which couple these solvents with membranes.
In Chapter 1 is given a general introduction to the main themes discussed in this thesis. It starts
with the characteristics of one of the main solvents, scCO2, and a brief state of the art of
applications of scCO2 is also given. The main separation process, membrane separation, is also
explained, and the previous applications of membranes in scCO2 are explored. It follows with
the other main class of solvents, RTILs. Their characteristics and applications are reviewed, as
well as a brief overview of some of the applications in scCO2. And finally, the Introduction ends
with a state of the art of the recent developments in supported ionic liquids membranes (SILMs)
and gel membranes.
In Chapter 2 is explored the feasibility of using reverse osmosis membranes for fractionations in
scCO2. The influence of pressure, temperature and pressure drop across the membranes in the
permeability of the membranes is tested. Next, these are tested for the fractionation of a model
mixture of oleic acid and squalene in scCO2. The effect of coupling the membrane to a
supercritical fluid extraction (SFE) process is also tested.
Chapter 3 and 4 explore the characteristics of RTILs and their ability to fractionate mixtures,
which would otherwise be difficult to separate. In Chapter 3 RTILs are used to fractionate the
same model mixture used in Chapter 2, and in Chapter 4 an attempt to build a polarity scale of
RTILs is made as a way of rationalising and explaining the results obtained in Chapter 3.
Finally, the knowledge obtained in the previous Chapters is used in Chapter 5 to develop SILMs
and apply them in scCO2 in the fractionation of the model mixture tested in Chapters 2 and 3.
Due to the poor results obtained in this attempt, a new type of gel membranes was developed,
using gelatine as a support polymer for RTILs. These new membranes are tested in scCO2 for
the fractionation of the model mixture of oleic acid and squalene and for the fractionation of
products and reagents of a transesterification reaction. Furthermore, these membranes are also
tested for the separation of gases.
This thesis concludes with Chapter 6, which includes the general conclusions of the thesis and
several possibilities of future work.
4
1.2 - Supercritical Fluids
In August 12, 1822, Baron Cagniard de la Tour described for the first time an experiment where
he would heat a fluid far beyond its boiling point, inside a closed vessel. He introduced alcohol
at 36º in a cannon barrel and a silex sphere, and sealed it. By gradually heating it, and making
the sphere roll back and forth inside the barrel, he could listen to the sound the sphere would
make at different temperatures. At first, he would hear the splashing sound that the sphere
would make when traversing the liquid-vapour interface, but when the temperature would rise
enough, that sound would disappear. And thus, the critical point of a substance was for the first
time acknowledged [1].
A pure component is considered to be in a supercritical state if its temperature and its pressure
are higher than the critical values, which for carbon dioxide, the supercritical fluid used in this
work, are 304.15 K and 7.38 MPa, respectively [2].
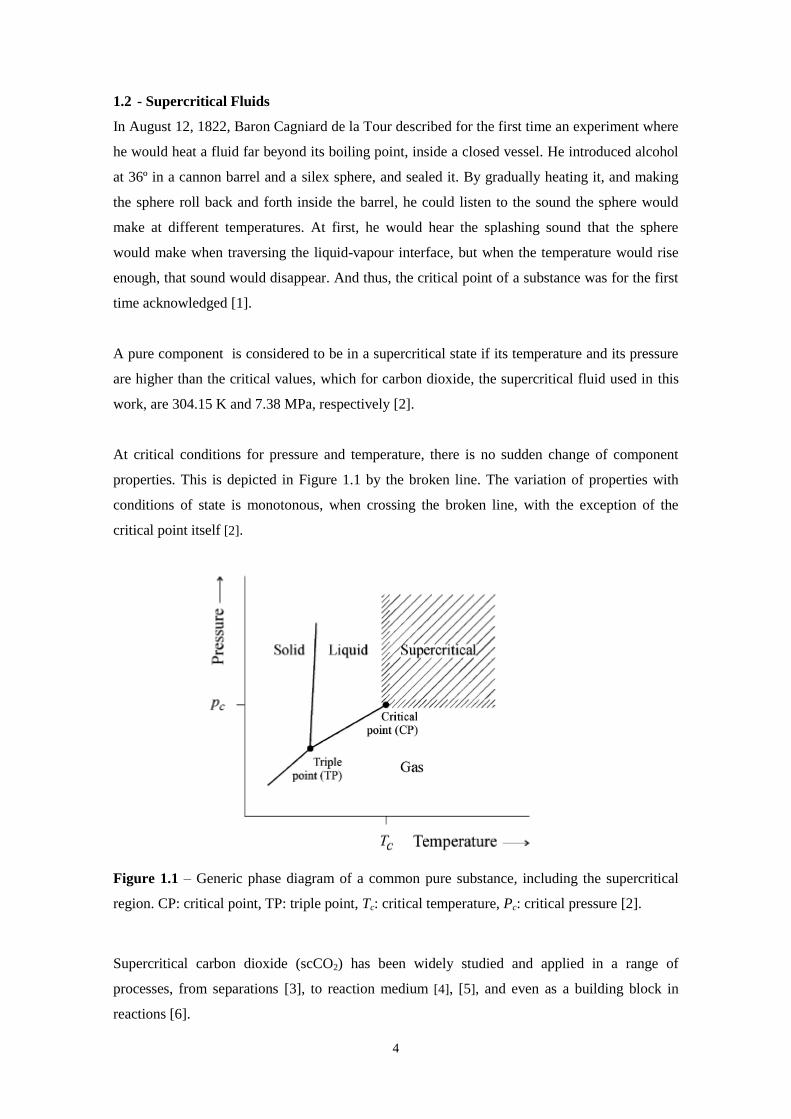
At critical conditions for pressure and temperature, there is no sudden change of component
properties. This is depicted in Figure 1.1 by the broken line. The variation of properties with
conditions of state is monotonous, when crossing the broken line, with the exception of the
critical point itself [2].
Figure 1.1 – Generic phase diagram of a common pure substance, including the supercritical
region. CP: critical point, TP: triple point, Tc: critical temperature, Pc: critical pressure [2].
Supercritical carbon dioxide (scCO2) has been widely studied and applied in a range of
processes, from separations [3], to reaction medium [4], [5], and even as a building block in
reactions [6].
5
1.2.1 – Fractionations with Supercritical Carbon Dioxide
Extraction of compounds from natural sources is the most widely studied application of
supercritical fluids (SCFs) with several hundreds of published scientific papers. Indeed, SFE has
immediate advantages over traditional extraction techniques: it is a flexible process due to the
possibility of continuous modulation of the solvent power/selectivity of the SCF, allows the
elimination of polluting organic solvents and of the expensive post-processing of the extracts for
solvent elimination. Carbon dioxide is the most popular SFE solvent because it is safe, readily
available and has a low cost. It allows supercritical operations at relatively low pressures and
near-room temperatures. The only serious drawback of SFE is the higher investment costs if
compared to traditional atmospheric pressure extraction techniques. However, the base process
scheme (extraction plus separation) is relatively cheap and very simple to be scaled up to
industrial scale [3].
SFE of solids is the most studied application since the most frequently required separation
process is the extraction/elimination of one or more compound families from a solid natural
matrix [3]. Some examples include the extraction of lipids from cyanobacteria [7], extraction of
essential oils from plants [8], [9], extraction of lycopene from tomatoes [10] and the
decaffeination of coffee [11]. It has been carried out in a commercial scale for more than three
decades, in processes like the decaffeination of coffee beans and black tea leaves and the
production of hop extracts [3].
1.3 - Membranes
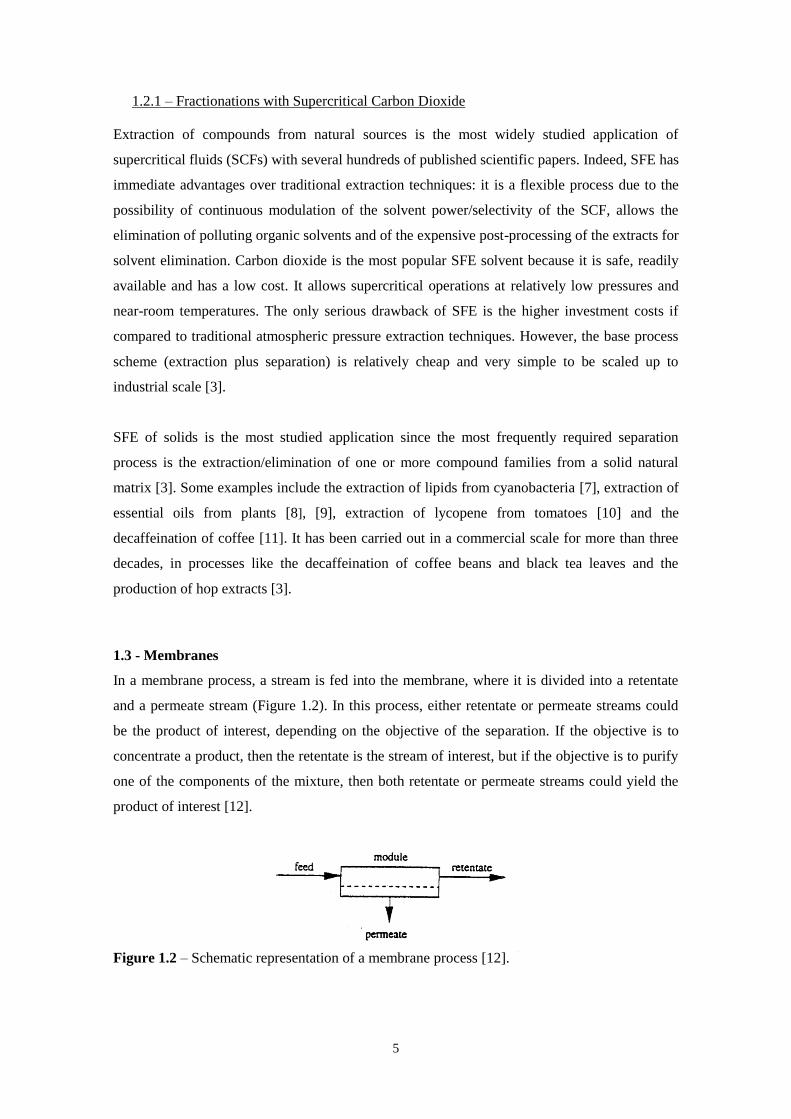
In a membrane process, a stream is fed into the membrane, where it is divided into a retentate
and a permeate stream (Figure 1.2). In this process, either retentate or permeate streams could
be the product of interest, depending on the objective of the separation. If the objective is to
concentrate a product, then the retentate is the stream of interest, but if the objective is to purify
one of the components of the mixture, then both retentate or permeate streams could yield the
product of interest [12].
Figure 1.2 – Schematic representation of a membrane process [12].
6
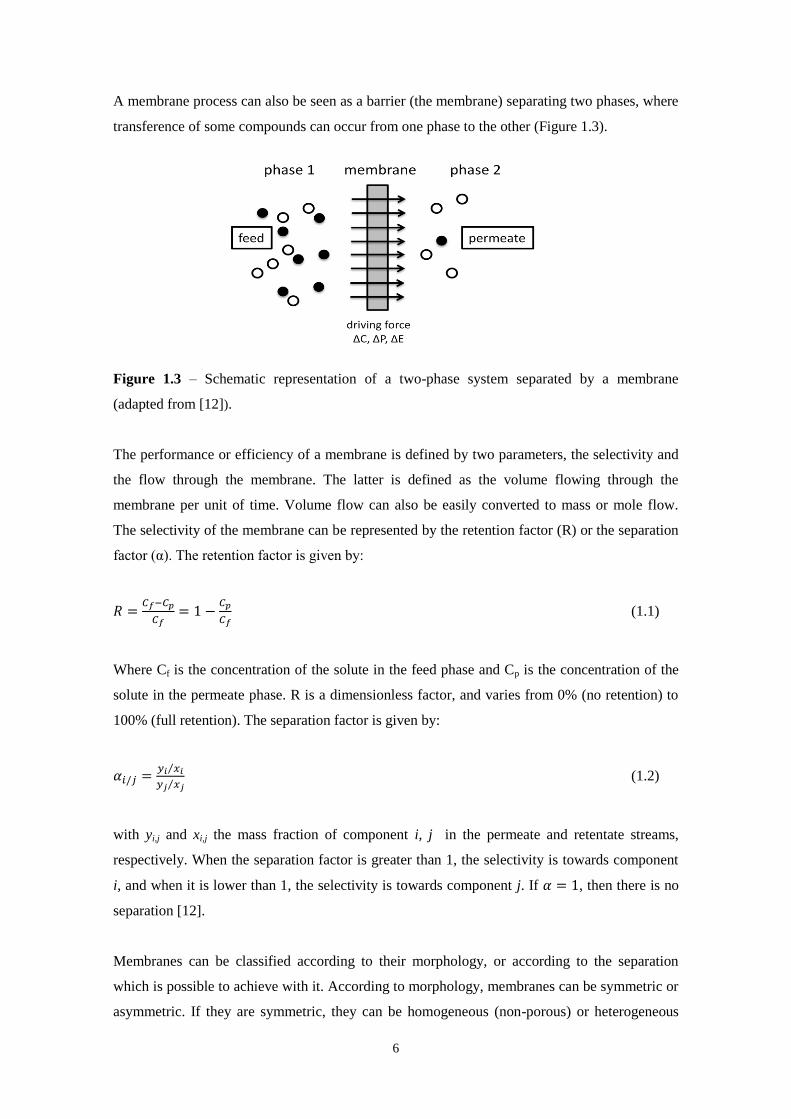
A membrane process can also be seen as a barrier (the membrane) separating two phases, where
transference of some compounds can occur from one phase to the other (Figure 1.3).
Figure 1.3 – Schematic representation of a two-phase system separated by a membrane
(adapted from [12]).
The performance or efficiency of a membrane is defined by two parameters, the selectivity and
the flow through the membrane. The latter is defined as the volume flowing through the
membrane per unit of time. Volume flow can also be easily converted to mass or mole flow.
The selectivity of the membrane can be represented by the retention factor (R) or the separation
factor (α). The retention factor is given by:
(1.1)
Where Cf is the concentration of the solute in the feed phase and Cp is the concentration of the
solute in the permeate phase. R is a dimensionless factor, and varies from 0% (no retention) to
100% (full retention). The separation factor is given by:
(1.2)
with yi,j and xi,j the mass fraction of component i, j in the permeate and retentate streams,
respectively. When the separation factor is greater than 1, the selectivity is towards component
i, and when it is lower than 1, the selectivity is towards component j. If , then there is no
separation [12].
Membranes can be classified according to their morphology, or according to the separation
which is possible to achieve with it. According to morphology, membranes can be symmetric or
asymmetric. If they are symmetric, they can be homogeneous (non-porous) or heterogeneous
7
(porous). If they are asymmetric, then they are generally made from a very dense and thin top
layer, supported by a porous and thicker layer. This combination allows to achieve the high
selectivity of the dense layer with the high permeability of the porous layer [12].
The range of particle sizes that can permeate the different kinds of membranes are summarized
in Table 1.1.
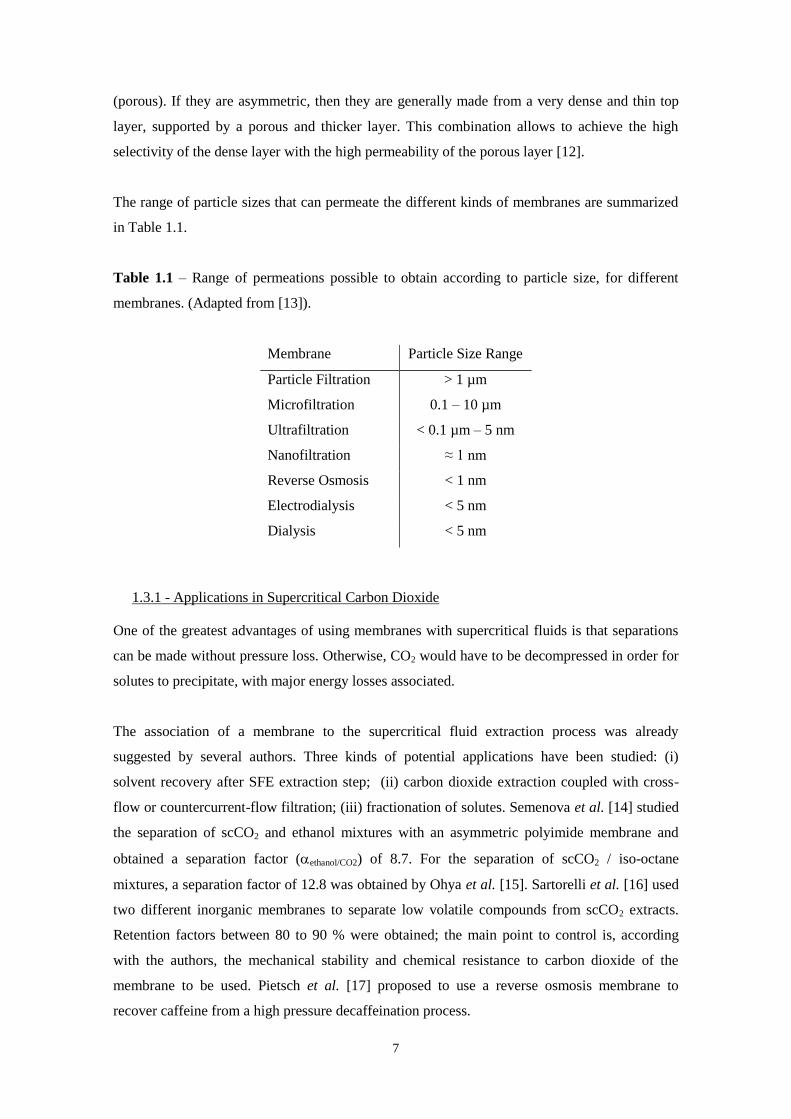
Table 1.1 – Range of permeations possible to obtain according to particle size, for different
membranes. (Adapted from [13]).
Membrane Particle Size Range
Particle Filtration > 1 µm
Microfiltration 0.1 – 10 µm
Ultrafiltration < 0.1 µm – 5 nm
Nanofiltration ≈ 1 nm
Reverse Osmosis < 1 nm
Electrodialysis < 5 nm
Dialysis < 5 nm
1.3.1 - Applications in Supercritical Carbon Dioxide
One of the greatest advantages of using membranes with supercritical fluids is that separations
can be made without pressure loss. Otherwise, CO2 would have to be decompressed in order for
solutes to precipitate, with major energy losses associated.
The association of a membrane to the supercritical fluid extraction process was already
suggested by several authors. Three kinds of potential applications have been studied: (i)
solvent recovery after SFE extraction step; (ii) carbon dioxide extraction coupled with cross-
flow or countercurrent-flow filtration; (iii) fractionation of solutes. Semenova et al. [14] studied
the separation of scCO2 and ethanol mixtures with an asymmetric polyimide membrane and
obtained a separation factor (ethanol/CO2) of 8.7. For the separation of scCO2 / iso-octane
mixtures, a separation factor of 12.8 was obtained by Ohya et al. [15]. Sartorelli et al. [16] used
two different inorganic membranes to separate low volatile compounds from scCO2 extracts.
Retention factors between 80 to 90 % were obtained; the main point to control is, according
with the authors, the mechanical stability and chemical resistance to carbon dioxide of the
membrane to be used. Pietsch et al. [17] proposed to use a reverse osmosis membrane to
recover caffeine from a high pressure decaffeination process.
8
Regeneration of scCO2 from caffeine loaded gas phases was achieved by commercial
nanofiltration membranes, with a ZrO2-TiO2 thin layer [18], and later with silica and
microporous silicalite membrane filters, obtaining a retention factor of 98% [19]. But a caffeine
retention factor of 100% was possible to observe at a temperature of 308 K and a pressure equal
to or lower than 12 MPa, with a microporous silicalite membrane [19]. Carlson et al. applied
reverse osmosis membranes (thin layer SC membrane) to separate efficiently limonene (94 %
retention factor) from scCO2 extracts [20]. Reverse osmosis membranes have also been used to
separate lemongrass essential oil from scCO2 with a retention factor up to 90% [21], or
polyphenols from scCO2 after extraction from cocoa seeds with retention factors higher than
90% [22].
The use of hollow fiber microporous membrane contactors in supercritical fluid extraction
processes has been reported in the literature [23]-[25]; improved mass transfer efficiency due to
a reduced shell-side fiber bypassing is claimed by the authors. Sarrade et al. [26] proposed the
coupling of scCO2 extraction with nanofiltration separation to extract and purify low molecular
weight compounds (up to 1500 Da). A nanofiltration tubular membrane resistant enough to
endure supercritical conditions was applied to two different processes: (i) the fractionation of
triglycerides from fish oil and (ii), the purification of -carotene issued from either carrot oils or
carrot seeds. The coupled process led to good quality extracts.
Goetheer et al. proposed to use an inorganic microporous membrane for the separation of
catalyst from products in homogeneous catalysis in scCO2, for the hydrogenation of 1-butene to
n-butane, with a derivative of Wilkinson’s catalyst [27]. And finally, two nanofiltration and one
reverse osmosis membrane were studied for the purification of modified triglycerides, by
retention of triglycerides and permeation of reaction subproducts (fatty acid esters and/or fatty
acid lipids), achieving retention factors of triglycerides up to 100% [28].
1.4 – Room Temperature Ionic Liquids
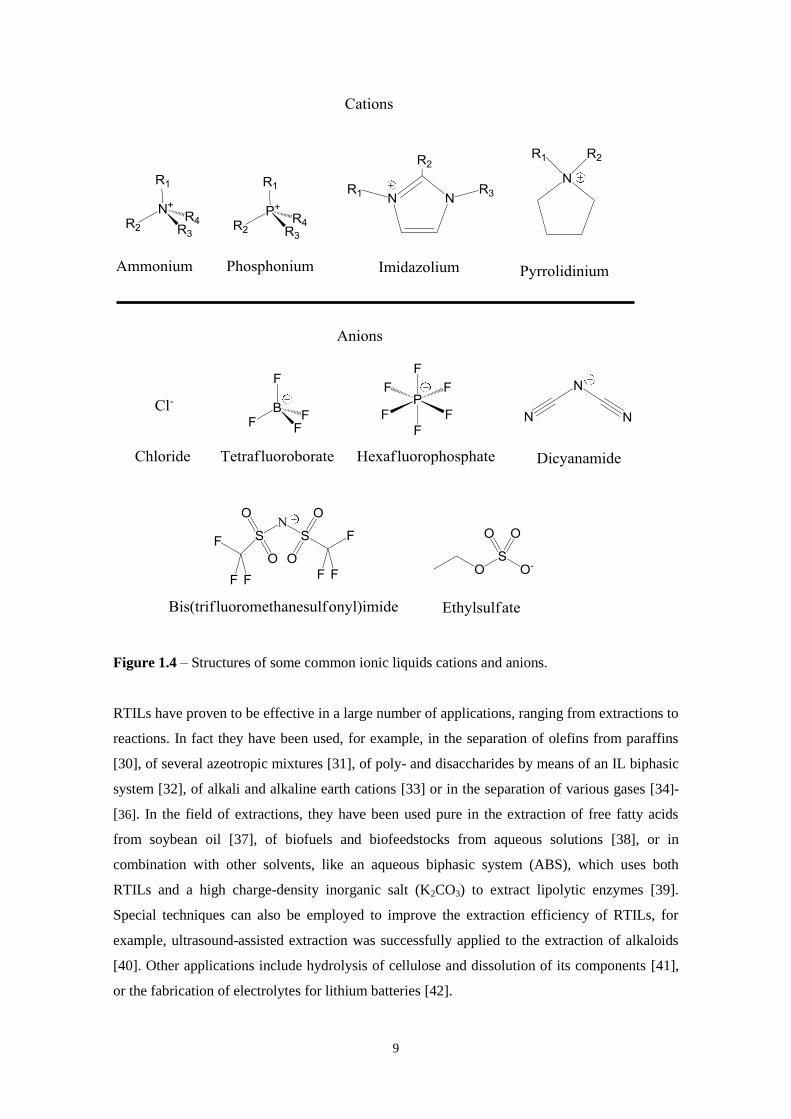
Room temperature ionic liquids (RTILs) are salts which are liquid up to 373 K. The first
example was described as early as 1914, ethylammonium nitrate, although for a long time this
class of compounds was known as molten salts [29]. These can have organic or inorganic
cations and anions. Some common examples are given in Figure 1.4
9
Figure 1.4 – Structures of some common ionic liquids cations and anions.
RTILs have proven to be effective in a large number of applications, ranging from extractions to
reactions. In fact they have been used, for example, in the separation of olefins from paraffins
[30], of several azeotropic mixtures [31], of poly- and disaccharides by means of an IL biphasic
system [32], of alkali and alkaline earth cations [33] or in the separation of various gases [34]-
[36]. In the field of extractions, they have been used pure in the extraction of free fatty acids
from soybean oil [37], of biofuels and biofeedstocks from aqueous solutions [38], or in
combination with other solvents, like an aqueous biphasic system (ABS), which uses both
RTILs and a high charge-density inorganic salt (K2CO3) to extract lipolytic enzymes [39].
Special techniques can also be employed to improve the extraction efficiency of RTILs, for
example, ultrasound-assisted extraction was successfully applied to the extraction of alkaloids
[40]. Other applications include hydrolysis of cellulose and dissolution of its components [41],
or the fabrication of electrolytes for lithium batteries [42].
10
Many studies have been made with ionic liquids and scCO2. The phase equilibria for many
systems has been determined, and it was found that, as a general rule, CO2 has high solubility in
RTILs, but RTILs are not soluble in scCO2. This behavior renders it viable to use scCO2 to
extract solutes from RTILs [43]. It is also possible to purify RTILs by using scCO2 extraction,
which can remove water and organic impurities [44]. Other applications have also been
explored, for example, RTILs have been used as effective solvents in extractive distillation for
the separation of an azeotropic mixture containing tetrafluoroethylene and carbon dioxide [45].
Still another example is the combination of RTILs with scCO2 as reaction mediums. This was
accomplished for lipase catalysis, with RTILs stabilizing the enzyme and scCO2 extracting the
products of the reaction [46] and for continuous-flow rhodium-catalysed hydroformylation of
long chain alkenes, achieving selectivities to the desired linear aldehyde of 92% and minimum
rhodium loss, using a xantphos-derived ligand attached to an imidazolium salt [47].
1.5 – Supported Ionic Liquid Membranes and Gel Membranes
It has been recognized for a long time that RTILs have the potential to recover solutes or
fractionate mixtures which are not easy to separate/fractionate with conventional solvents. The
immobilization of RTILs in membranes, creating supported ionic liquid membranes (SILMs),
has been developed as a way to facilitate the application of RTILs in industrial environments.
SILMs have several advantages, allowing to operate with an extremely large specific membrane
area (membrane area per unit volume) without dispersing the extractant in the feed phase;
extraction and re-extraction take place simultaneously, involving a minimal amount of
extractant, which is constantly regenerated and with the additional possibility of tuning the
selectivity of the extractant phase to a defined solute by adequate selection of the solid
supporting membrane [48].
One of the major applications studied for SILMs is the separation of gases. Very diverse pairs of
ionic liquids and membranes have been tested. Imidazolium ionic liquids immobilized in Viton
membranes achieved a separation factor for CO2/CH4 around 59 [49]. Nafion membranes with
imidazolium ionic liquids achieved an ideal separation factor for CO2/CH4 of 26 [50]. The
permeability of hydrogen (H2), oxygen (O2), nitrogen (N2), and carbon monoxide (CO) was
studied for 1-butyl-3-methylimidazolium ([BMIM]), 1-decyl-3-methylimidazolium ([C10MIM]],
trioctylmethylammonium ([(C8)3CN]) and octylpyridinium ([OPy]) cations with the anion
bis(trifluoromethylsulfonyl)-imide ([NTf2]) supported on nanofiltration membranes and the best
selectivity of H2/CO (5.5) was obtained for [BMIM][NTf2] at 0.3 MPa [51]. A ceramic
nanofiltration membrane with an immobilized silane functionalized ionic liquid was studied for
the separation of CO2 from CO, obtaining a separation factor of 25 at 323 K [52]. Imidazolium
11
RTILs supported in polyvinylidene fluoride porous membrane were used to separate CO2 from
N2, being possible to achieve a separation factor of 86.5 with [BMIM][BF4] at 303.15 K [53].
With imidazolium RTILs immobilized in polyethersulfone membranes, the best selectivities
were found for the RTIL 1-ethyl-3-methylimidazolium trifluoromethanesulfone
([EMIM][CF3SO3]) (CO2/N2: 28; CO2/CH4: 16; SO2/N2: 337; SO2/CH4: 196) [53]. Also for
imidazolium RTILs immobilized in polyethersulfone membranes, but now with fluoroalkyl
substituents, the best selectivity it was possible to achieve was of 27 for the pair CO2/N2 [54].
The influence of anions trifluoromethanesulfone ([CF3SO3]), dicyanamide ([DCA]) and [NTf2],
in the separation of gases was studied with the cation [EMIM], and the best selectivities were
obtained with [DCA] (CO2/N2: 61; CO2/CH4: 20) [55]. With ILs based in pyridinium and
ammonium immobilized in α-alumina inorganic supports, the best selectivity was for the pair
CO2/CH4 with a value of 30 for [BMPy][BF4] [56].
The effect of increasing the alkyl chain length in 1-alkyl-3-methylimidazolium RTILs supported
in polymeric membranes was investigated and it was found out that the permeability increases
with increasing alkyl chain length, and also that permeability decreases with increasing
viscosity. In this same study it was possible to obtain selectivities for the pairs CO2/N2 and
CO2/CH4 of 32 and 161, respectively [57].
Camper et al. in 2006 developed a model to predict solubility of gases in imidazolium RTILs
based on the molar volume of the RTILs and estimated gas permeability and gas pair separation
selectivity for ideal CO2/N2 and CO2/CH4 separations. At the time, they concluded that there
appears to be more potential for RTIL-based membranes in CO2/N2 separations than in
CO2/CH4 [58]. In a later paper, Scovazzo summarized literature data and some new data for
SILM permeabilities and selectivities for the gas pairs CO2/N2, CO2/CH4, O2/N2,
ethylene/ethane, propylene/propane, 1-butene/butane, and 1,3-butadiene/butane, finding little
room for improving the reported permeabilities, but some space for increasing the selectivities
[59].
Other applications of SILMs include applications as diverse as separation of arsenate and
arsenite from aqueous media [60], enzymatic synthesis in an active membrane using ionic
liquids as catalyst support [61], removal of phenol from wastewater [62], vapor permeation of
benzene/cyclohexane [63], transport of salicylic acid [64], or the removal of butan-1-ol from
fermentation broths of Clostridium acetobutylicum in order to avoid the decrease of the
population [65].
12
SILMs have also been used for the fractionation of organic compounds, for example, a porous
polyvinylidene fluoride film membrane was used with a feed solution of heptanes and a
receiving solution of hexadecane for the transport of aromatic hydrocarbons, benzene, toluene
and p-xylene, with the best selectivity being obtained for benzene [66]. Víllora et al., in a series
of papers, started by showing that it was possible to fractionate the substrates and products of a
transesterification reaction (vinyl butyrate, 1-butanol, butyl butyrate and butyric acid) through
SILMs based on 1-n-alkyl-3-methylimidazolium cations combined with [BF4], [PF6] and [NTf2]
anions [67]. From this study, they found that the hydrophilic nature of ILs was a key parameter
for the selective separation of those compounds, and thus developed new membranes based
on a hydrophilic anion, dicyanamide, concluding that both the permeability of the compounds
and the permselectivity of the membrane were enhanced with the use of dicyanamide based
ionic liquids [68]. Then, they went on to study the permeability of sixteen different organic
compounds (vinyl esters, aliphatic esters, alcohols and carboxylic acids) through SILMs
containing [BF4] based ionic liquids ([BMIM][BF4] and [OMIM][BF4]). It was found that
permeability increased as the alkyl chain length decreased for the same organic functional
group. In addition, significant permeability differences were found between the different
organic functional groups [69].
Despite the fact that gel polymers with RTILs have been studied for some time to prepare
electrolytes for lithium batteries [70], [71], it was only recently that they have been proposed as
membranes for the separation of gases. The efforts in the development of gel membranes have
been triggered by limitations of SILMs on the trans-membranes pressures that are possible to
apply. In fact, it was demonstrated that trans-membrane pressures as low as 0.2 MPa can result
in displacement of RTIL from SILMs [57].
Polymeric gel membranes have been prepared with addition of 20 to 80 wt.% of 1-butyl-3-
methylimidazolium trifluoromethanesulfonate ([BMIM][CF3SO3]), to Pebax® 1657 and Pebax
®
2533. Although permeability and selectivity of Pebax® 2533 are not notably affected by the
addition of RTIL, Pebax® 1657 shows a significant increase in the gas permeability, but a slight
decrease in the permselectivity for most gas pairs [72]. A series of cross-linked
poly(vinylimidazolium)-RTIL gel membranes was synthesized and evaluated for ideal CO2/N2,
CO2/CH4, and CO2/H2 room-temperature separation performance, and the effect of free RTIL
([EMIM][NTf2]) loading on CO2 separation performance was evaluated by varying RTIL
loading at three levels (45, 65, and 75 wt. %). A higher loading of free RTIL increased CO2
permeability dramatically, but had no effect on CO2/N2 or CO2/CH4 permeability selectivity. It
had, however a significant improvement on CO2/H2 permeability selectivity [73]. A triblock
copolymer self-assembled in CO2-selective RTILs (poly(styrene-block-ethylene oxide-block-
13
styrene)) was synthesized and used with three RTILs based in the 1-n-hexyl-3-
methylimidazolium ([HMIM]) cation and [NTf2], [BF4], and [PF6] anions. The ideal CO2/CH4
separation factors were studied and ranged from 9.0 to 9.9 [74].
To the best of our knowledge, this work proposes for the first time the application of either
SILMs or gel membranes in scCO2.
1.6 – References
[1] C. de la Tour; Exposé de quelques résultats obtenus par l’action combinée de la chaleur et
de la compression sur certains liquides, tels que l’eau, l’alcool, l’éther sulfurique et
l’essence de pétrole rectifiée; Ann. Chim. Phys. 21, (1822) 127-132.
[2] G. Brunner, Gas Extraction, Springer, Berlin, 1994.
[3] E. Reverchon, I. De Marco; Supercritical Fluid Extraction and Fractionation of Natural
Matter; J. of Supercritical Fluids 38 (2006) 146-166.
[4] H. Taher, S. Al-Zuhair, A. Al-Marzouqi, Y. Haik, M. Farid; A Review of Enzymatic
Transesterification of Microalgal Oil-Based Biodiesel Using Supercritical Technology;
Enzyme Research Volume 2011, Article ID 468292, doi:10.4061/2011/468292
[5] R. Couto, P. Vidinha, C. Peres, A. Ribeiro, O. Ferreira, M. Oliveira, E. Macedo, J.
Loureiro, S. Barreiros; Geranyl Acetate Synthesis in a Packed-Bed Reactor Catalyzed by
Novozym in Supercritical Carbon Dioxide and in Supercritical Ethane; Ind. Eng. Chem.
Res. 2011, 50, 1938–1946.
[6] V. Bonifácio, V. Correia, M. Pinho, J. Lima, A. Aguiar-Ricardo; Blue emission of
carbamic acid oligooxazoline biotags; Materials Letters 81 (2012) 205–208.
[7] Mendes, R. L.; Reis, A. D.; Palavra, A. F.; Supercritical CO2 extraction of c-linolenic acid
and other lipids from Arthrospira (Spirulina)maxima: Comparison with organic solvent
extraction; Food Chemistry 99 (2006) 57–63.
[8] Simões, P.C.; Nunes da Ponte, M.; Matos, H.; Gomes de Azevedo, E.; in Proceedings of
the Second International Symposium on High Pressure Chemical Engineering, Erlangen,
1990, p. 401.
[9] Della Porta, G.; Porcedda, S.; Marongiu, B.; Reverchon, E.; Isolation of eucalyptus oil by
supercritical fluid extraction, Flavour Fragr. J. 14 (1999) 214–218.
[10] Cadoni, E.; De Giorgi, M.R.; Medda, E.; Poma, G.; Supercritical CO2 extraction of
Lycopene and β-carotene from ripe tomatoes; Dyes Pigments 44 (2000) 27–32.
[11] Zosel, K.; Separation with Supercritical Gases: Practical Applications; Angew. Chem. Int.
Ed. Eng. 17 (10) (1978) 702 – 709.
[12] M. Mulder; Basic principles of membrane technology; Kluwer Academic Publishers; 2nd
edition; Dordrecht; The Netherlands; 1996.
14
[13] J. Coulson and J. Richardson; Chemical Engineering, Volume 2 – Particle Technology and
Separation Processes; 5th edition; Oxford; 2002.
[14] S.I. Semenova, H. Ohya, T. Higashijima, Y. Negishi, Separation of supercritical CO2 and
ethanol mixtures with an asymmetric polyimide membrane, J. Membr. Sci. 74 (1992) 131-
139.
[15] H. Ohya, T. Higashijima, Y. Tsuchiya, H. Tokunaga, Y. Negishi, Separation of
supercritical CO2 and iso-octane mixtures with an asymmetric polyimide membrane, J.
Membr. Sci. 84 (1993) 185-189.
[16] L. Sartorelli, G. Brunner, Membrane separation of extracts from supercritical carbon
dioxide, in: Proceedings of the 5th International Symposium on Supercritical Fluids,
Atlanta, USA, 2000, 22.
[17] A. Pietsch, W. Hilgendorff, O. Thom, R. Eggers; Basic investigation of integrating a
membrane unit into high-pressure decaffeination processing; Separation and Purification
Technology 14 (1998) 107–115.
[18] C. Tan, Y. Chiu, Regeneration of supercritical carbon dioxide by membrane at near critical
conditions, J. Supercrit. Fluids 21 (2001) 81-89.
[19] C. Tan, H. Lien, S. Lin, H. Cheng, K. Chao; Separation of supercritical carbon dioxide and
caffeine with mesoporous silica and microporous silicalite membranes, J. of Supercritical
Fluids 26 (2003) 55-62.
[20] L.H.C. Carlson, A. Bolzan, R.A.F. Machado, Separation of d-limonene from supercritical
CO2 by means of membranes, J. of Supercritical Fluids 34 (2005) 143-147.
[21] L. Sarmento, R. Machado, A. Bolzan, C. Spricigo, J. Petrus; Use Of Reverse Osmosis
Membranes For The Separation Of Lemongrass Essential Oil And Supercritical CO2;
Brazilian Journal of Chemical Engineering; 21 (02) (2004) 285–291.
[22] L. Sarmento, R. Machado, J. Petrus, T. Tamanini, A. Bolzan; Extraction of polyphenols
from cocoa seeds and concentration through polymeric membranes; J. of Supercritical
Fluids 45 (2008) 64–69.
[23] J.R. Robinson, M.J. Sims, Method and System for Extracting a Solute from a Fluid Using
Dense Gas and a Porous Membrane, US Patent 5490884 (13 February 1996).
[24] G.D. Bothun, B.L. Knutson, H.J. Strobel, S.E. Nokes, Mass transfer in hollow fiber
membrane contactor extraction using compressed solvents, J. Membr. Sci. 227 (2003) 183–
196.
[25] A. Gabelman, S.-T. Hwang, W.B. Krantz, Dense gas extraction using a hollow fiber
membrane contactor: experimental results vs. model predictions, J. Membr. Sci. 257 (2005)
11-36.
[26] S. Sarrade, G.M. Rios, M. Carlès, Supercritical CO2 extraction coupled with nanofiltration
separation: Applications to natural products, Sep. Purif. Technol. 14 (1998) 19-25.
15
[27] E. Goetheer, A. Verkerk, L. van den Broeke, E. de Wolf, B. Deelman, G. van Koten, J.
Keurentjes; Membrane reactor for homogeneous catalysis in supercritical carbon dioxide;
Journal of Catalysis 219 (2003) 126–133.
[28] J. de Moura, L. Gonçalves, L. Sarmento, J. Petrus; Purification of structured lipids using
SCCO2 and membrane process; Journal of Membrane Science 299 (2007) 138–145.
[29] C. Angell, Y. Ansari, Z. Zhao; Ionic Liquids: Past, present and future; Faraday Discuss.,
154 (2012) 9–27.
[30] G. Belluomini, J. Pendergast, C. Domke, B. Ussing; Performance of Several Ionic Liquids
for the Separation of 1-Octene from n-Octane; Ind. Eng. Chem. Res. 2009, 48, 11168–
11174.
[31] A.B. Pereiro, J.M.M. Araújo, J.M.S.S. Esperança, I.M. Marrucho, L.P.N. Rebelo; Ionic
Liquids in Separations of Azeotropic Systems A Review, J. Chem. Thermodynamics 46
(2012) 2–28.
[32] K. Tonova; Separation of poly- and disaccharides by biphasic systems based on ionic
liquids; Separation and Purification Technology 89 (2012) 57–65.
[33] C. Hawkins, S. Garvey, M. Dietz; Structural variations in room-temperature ionic liquids:
Influence on metal ion partitioning modes and extraction selectivity; Separation and
Purification Technology 89 (2012) 31–38
[34] M.B. Shiflett, A. Yokozeki, Separation of CO2 and H2S using Room-Temperature Ionic
Liquid [bmim][PF6], Fluid Phase Equilibria 294 (2010) 105–113.
[35] S.M. Mahurin, J.S. Lee, G.A. Baker, H. Luo, S. Dai, Performance of Nitrile-Containing
Anions in Task-Specific Ionic Liquids for Improved CO2/N2 Separation, Journal of
Membrane Science 353 (2010) 177–183
[36] S.M. Mahurin, J.S. Yeary, S. Baker, D.-e. Jiang, S. Dai, G.A. Baker, Ring Opened
Heterocycles: Promising Ionic Liquids for Gas Separation and Capture, Journal of
Membrane Science 401– 402 (2012) 61– 67
[37] M. Manic, V. Najdanovic–Visak, Z. Visak, M. Nunes da Ponte; Extraction of Free Fatty
Acids from Soybean Oil using Ionic Liquids or Poly(ethyleneglycol)s; AIChE Journal 57
(5) (2011) 1344–1355.
[38] L. Simoni, A. Chapeaux, J. Brennecke, M. Stadtherr; Extraction of Biofuels and
Biofeedstocks from Aqueous Solutions Using Ionic Liquids; Computers and Chemical
Engineering 34 (2010) 1406–1412.
[39] F. J. Deive, A. Rodríguez, A. B. Pereiro, J. M. M. Araújo, M. A. Longo, M. A. Z. Coelho,
J. N. Canongia Lopes, J. M. S. S. Esperança, L. P. N. Rebelo and I. M. Marrucho; Ionic
liquid-based aqueous biphasic system for lipase extraction; Green Chem., 2011, 13, 390-
396.
16
[40] L. Yang, H. Wang, Y. Zu, C. Zhao, L. Zhang, X. Chen, Z. Zhang; Ultrasound-assisted
extraction of the three terpenoid indole alkaloids vindoline, catharanthine and vinblastine
from Catharanthus roseus using ionic liquid aqueous solutions; Chemical Engineering
Journal 172 (2011) 705– 712.
[41] J. van Spronsen, M. Tavares Cardoso, G. Witkamp, W. de Jong, M. Kroon; Separation and
Recovery of the Constituents from Lignocellulosic Biomass by using Ionic Liquids and
Acetic Acid as Co-Solvents for Mild Hydrolysis; Chemical Engineering and Processing 50
(2011) 196–199.
[42] J. Kim, A. Matic, J. Ahn, P. Jacobsson; An imidazolium based ionic liquid electrolyte for
lithium batteries; Journal of Power Sources 195 (2010) 7639–7643.
[43] S. Keskin, D. Kayrak-Talay, U. Akman, O. Hortaçsu; A review of ionic liquids towards
supercritical fluid applications; J. of Supercritical Fluids 43 (2007) 150–180.
[44] J. Andanson, F. Jutz, A. Baiker; Purification of ionic liquids by supercritical CO2
monitored by infrared spectroscopy; J. of Supercritical Fluids 55 (2010) 395–400.
[45] M. Shifletta, A. Shiflett, A. Yokozeki; Separation of tetrafluoroethylene and carbon
dioxide using ionic liquids; Separation and Purification Technology 79 (2011) 357– 364.
[46] Y. Fan, J. Qian; Lipase catalysis in ionic liquids/supercritical carbon dioxide and its
applications; Journal of Molecular Catalysis B: Enzymatic 66 (2010) 1–7
[47] T. Kunene, P. Webb, D. Cole-Hamilton; Highly selective hydroformylation of long-chain
alkenes in a supercritical fluid ionic liquid biphasic system; Green Chem., 2011, 13, 1476-
1481.
[48] L. C. Branco, J. G. Crespo and C. A. M. Afonso; Studies on the Selective transport of
Organic Compounds by Using Ionic Liquids as Novel Supported Liquid Membranes;
Chem. Eur. J. 2002, 8,No . 17, 3865-3871.
[49] P. Uchytil, J. Schauer, R. Petrychkovych, K. Setnickova, S.Y. Suen; Ionic liquid
membranes for carbon dioxide-methane separation; Journal of Membrane Science 383
(2011) 262– 271.
[50] S. Yoo, J. Won, S. Kang, Y. Kang, S. Nagase; CO2 separation membranes using ionic
liquids in a Nafion matrix; Journal of Membrane Science 363 (2010) 72–79.
[51] Q. Gan, D. Rooney, M. Xue, G. Thompson, Y. Zou; An experimental study of gas
transport and separation properties of ionic liquids supported on nanofiltration membranes;
Journal of Membrane Science 280 (2006) 948–956.
[52] O. Vangeli, G. Romanos, K. Beltsios, D. Fokas, C. Athanasekou, N. Kanellopoulos;
Development and Characterization of Chemically stabilized Ionic Liquid Membranes-Part
I: Nanoporous ceramic Supports; Journal of Membrane Science 365 (2010) 366–377.
17
[53] J. Yingying, W. Youting, W. Wenting, L. Lei, Z. Zheng, Z. Zhibing; Permeability and
Selectivity of Sulfur Dioxide and Carbon Dioxide in Supported Ionic Liquid Membranes;
Chinese Journal of Chemical Engineering, 17(4) (2009) 594-601.
[54] J. Bara, C. Gabriel, T. Carlisle, D. Camper, A. Finotello, D. Gin, R. Noble; Gas separations
in fluoroalkyl-functionalized room-temperature ionic liquids using supported liquid
membranes; Chemical Engineering Journal 147 (2009) 43–50.
[55] P. Scovazzo, J. Kieft, D. Finan, C. Koval, D. DuBois, R. Noble; Gas separations using non-
hexafluorophosphate [PF6]− anion supported ionic liquid membranes; Journal of
Membrane Science 238 (2004) 57–63.
[56] D.D. Iarikov, P. Hacarlioglu, S.T. Oyama, Supported Room Temperature Ionic Liquid
Membranes for CO2/CH4 Separation; Chemical Engineering Journal 166 (2011) 401–406.
[57] L. Neves, J. Crespo, I. Coelhoso; Gas permeation studies in supported ionic liquid
membranes; Journal of Membrane Science 357 (2010) 160–170.
[58] D. Camper, J. Bara, C. Koval, R. Noble; Bulk-Fluid Solubility and Membrane Feasibility
of Rmim-Based Room-Temperature Ionic Liquids; Ind. Eng. Chem. Res. 2006, 45, 6279-
6283.
[59] P. Scovazzo; Determination of the upper limits, benchmarks, and critical properties for gas
separations using stabilized room temperature ionic liquid membranes (SILMs) for the
purpose of guiding future research; Journal of Membrane Science 343 (2009) 199–211.
[60] R. Güell, C. Fontàs, E. Anticó, V. Salvadó, J. Crespo, S. Velizarov; Transport and
separation of arsenate and arsenite from aqueous media by supported liquid and anion-
exchange membranes; Separation and Purification Technology 80 (2011) 428–434.
[61] M. Mori, R. Gomez Garcia, M.P. Belleville, D. Paolucci-Jeanjean, J. Sanchez, P. Lozano,
M. Vaultier, G. Rios; A new way to conduct enzymatic synthesis in an active membrane
using ionic liquids as catalyst support; Catalysis Today 104 (2005) 313–317.
[62] S. Nosrati, N.S. Jayakumar, M.A. Hashim; Performance evaluation of supported ionic
liquid membrane for removal of phenol; Journal of Hazardous Materials 192 (2011) 1283–
1290.
[63] M. Matsumoto, K. Ueba, K. Kondo; Vapor permeation of hydrocarbons through supported
liquid membranes based on ionic liquids; Desalination 241 (2009) 365-371.
[64] N. Kouki, R. Tayeb, R. Zarrougui, M. Dhahbi; Transport of salicylic acid through
supported liquid membrane based on ionic liquids; Separation and Purification Technology
76 (2010) 8–14.
[65] M. Kohoutova, A. Sikora, Š. Hovorka, A. Randova, J. Schauer, M. Tišma, K. Setnickova,
R. Petrickovic, S. Guernik, N. Greenspoon, P. Izak; Influence of ionic liquid content on
properties of dense polymer membranes; European Polymer Journal 45 (2009) 813–819.
18
[66] M. Matsumoto, Y. Inomoto, K. Kondo; Selective separation of aromatic hydrocarbons
through supported liquid membranes based on ionic liquids; Journal of Membrane Science
246 (2005) 77–81.
[67] A.P. de los Ríos, F.J. Hernández-Fernández, F. Tomás-Alonso, M. Rubio, D. Gómez, G.
Víllora, On the importance of the nature of the ionic liquids in the selective simultaneous
separation of the substrates and products of a transesterification reaction through supported
ionic liquid membranes, J. Membr. Sci., 307 (2008) 233–238.
[68] F. Hernández-Fernández, A. de los Ríos, F. Tomás-Alonso, D. Gómez, G. Víllora;
Improvement in the separation efficiency of transesterification reaction compounds by the
use of supported ionic liquid membranes based on the dicyanamide anion; Desalination 244
(2009) 122–129.
[69] A. de los Ríos, F. Hernández-Fernández, M. Rubio, D. Gómez, G. Víllora; Highly selective
transport of transesterification reaction compounds through supported liquid membranes
containing ionic liquids based on the tetrafluoroborate anion; Desalination 250 (2010) 101–
104.
[70] M. Rao, X. Geng, Y. Liao, S. Hu, W. Li; Preparation and performance of gel polymer
electrolyte based on electrospun polymer membrane and ionic liquid for lithium ion
battery; Journal of Membrane Science 399– 400 (2012) 37– 42.
[71] C. Sirisopanaporn, A. Fernicola, B. Scrosati; New, Ionic Liquid-Based Membranes For
Lithium Battery Application; Journal of Power Sources 186 (2009) 490–495.
[72] P. Bernardo, J. C. Jansen, F. Bazzarelli, F. Tasselli, A. Fuoco, K. Friess, P. Izak, V.
Jarmarova, M. Kacirkova, G. Clarizia; Gas transport properties of Pebax®/room
temperature ionic liquid gel membranes; Separation and Purification Technology 97 (2012)
73–82.
[73] T. Carlisle, G. Nicodemus, D. Gin, R. Noble; CO2/Light Gas Separation Performance of
Cross-linked Poly(vinylimidazolium) Gel Membranes as a Function of Ionic Liquid
Loading and Cross-linker Content; Journal of Membrane Science 397– 398 (2012) 24– 37.
[74] I. Yoon, S. Yoo, S. Park, J. Won; CO2 separation membranes using ion gels by self-
assembly of a triblock copolymer in ionic liquids; Chemical Engineering Journal 172
(2011) 237– 242.
19
Chapter 2
Reverse Osmosis Membranes

20
21
2.1 - Introduction
Supercritical fluid extraction (SFE), using supercritical carbon dioxide (scCO2), can substitute
traditional organic solvent extraction processes due to several advantages: contamination of the
product does not occur; mass transport is highly facilitated owing to favourable transport
properties (high mass and thermal diffusivities coupled with low viscosities); and the solvent
parameters are tuneable by the operating conditions employed. One of the most promising
applications of supercritical fluids is the extraction of high value natural compounds from
residues of the food industry [1]. Squalene (Figure 2.1) is one of these compounds, used as a
health-food or refined to squalane, a product used in pharmaceuticals and cosmetics. It has also
been identified as a possible adjunctive in cancer therapy and during vaccination [2]. For the
past decades the main source of squalene has been the liver oil of deep-sea sharks, where it is
present in concentrations of 40 to 80% by weight. Strong environmental concerns with regard to
the protection of the marine life, however, have focused the attention onto other sources, in
particular to the residues from olive oil processing industries. Such residues, stemming from the
olive oil deodorizer distillation, can contain up to 40% by weight of squalene and 30 to 40% by
weight of free fatty acids. Supercritical carbon dioxide processing of such residues can be of
interest to recover “vegetal” squalene [3]. However, this process poses technical difficulties that
are mainly associated with the very similar solubilities of squalene and the free fatty acids in
supercritical carbon dioxide [4]. Although it was possible to fractionate squalene from every
other free fatty acid, the difficulty remains mainly in the separation of oleic acid (Figure 2.1),
which is also the main fatty acid present in olive oil residues. In a previous work, a significant
enrichment in squalene could be obtained with reverse osmosis membranes, but with the
drawback of a lower total permeate flux [5]. Furthermore, this study was performed only at 313
K and 18 MPa, because these conditions were found to be the best for the fractionation of
squalene from free fatty acids in scCO2 [4]. However, for membrane separations other
conditions of pressure and temperature could prove more suitable for this fractionation. So, in
this chapter is explored the separation of squalene from oleic acid with reverse osmosis
membranes at pressures ranging from 18 to 22 MPa and temperatures of 313 and 323 K.
Permeability measurements to carbon dioxide were also performed to the membranes tested.
22
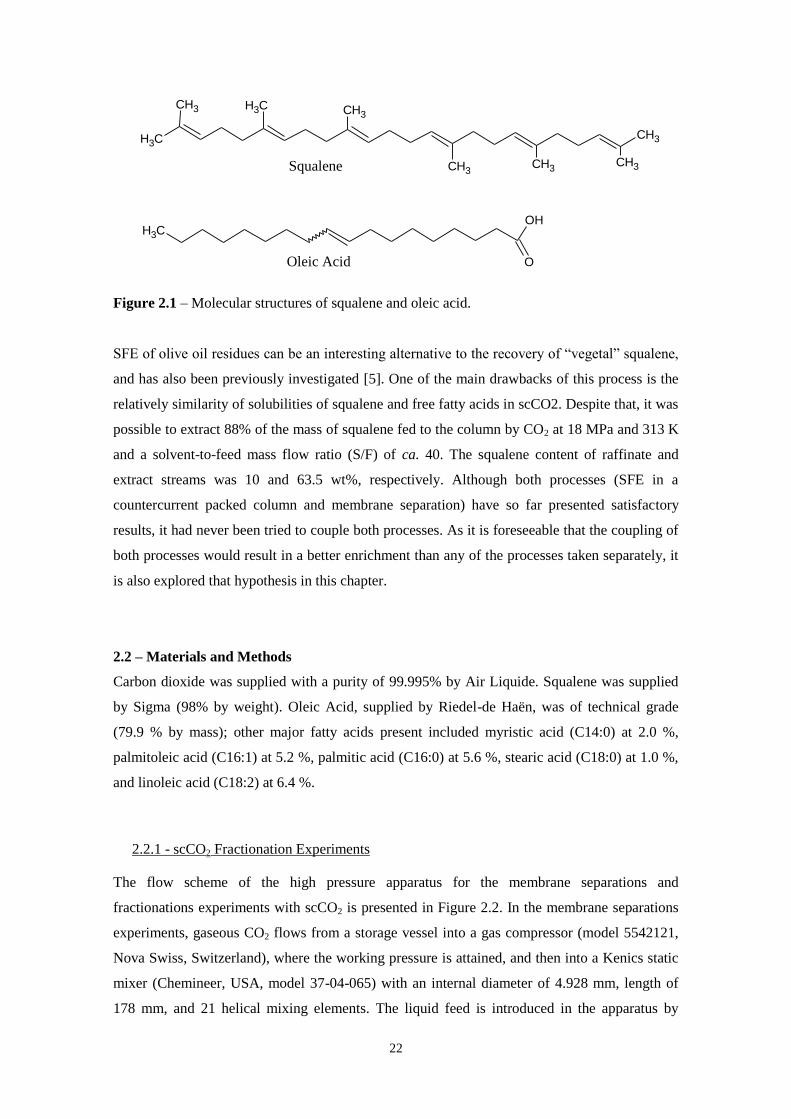
Figure 2.1 – Molecular structures of squalene and oleic acid.
SFE of olive oil residues can be an interesting alternative to the recovery of “vegetal” squalene,
and has also been previously investigated [5]. One of the main drawbacks of this process is the
relatively similarity of solubilities of squalene and free fatty acids in scCO2. Despite that, it was
possible to extract 88% of the mass of squalene fed to the column by CO2 at 18 MPa and 313 K
and a solvent-to-feed mass flow ratio (S/F) of ca. 40. The squalene content of raffinate and
extract streams was 10 and 63.5 wt%, respectively. Although both processes (SFE in a
countercurrent packed column and membrane separation) have so far presented satisfactory
results, it had never been tried to couple both processes. As it is foreseeable that the coupling of
both processes would result in a better enrichment than any of the processes taken separately, it
is also explored that hypothesis in this chapter.
2.2 – Materials and Methods
Carbon dioxide was supplied with a purity of 99.995% by Air Liquide. Squalene was supplied
by Sigma (98% by weight). Oleic Acid, supplied by Riedel-de Haën, was of technical grade
(79.9 % by mass); other major fatty acids present included myristic acid (C14:0) at 2.0 %,
palmitoleic acid (C16:1) at 5.2 %, palmitic acid (C16:0) at 5.6 %, stearic acid (C18:0) at 1.0 %,
and linoleic acid (C18:2) at 6.4 %.
2.2.1 - scCO2 Fractionation Experiments
The flow scheme of the high pressure apparatus for the membrane separations and
fractionations experiments with scCO2 is presented in Figure 2.2. In the membrane separations
experiments, gaseous CO2 flows from a storage vessel into a gas compressor (model 5542121,
Nova Swiss, Switzerland), where the working pressure is attained, and then into a Kenics static
mixer (Chemineer, USA, model 37-04-065) with an internal diameter of 4.928 mm, length of
178 mm, and 21 helical mixing elements. The liquid feed is introduced in the apparatus by
CH3CH3
CH3 CH3 CH3
CH3CH3
CH3
CH3
OH
O
Squalene
Oleic Acid
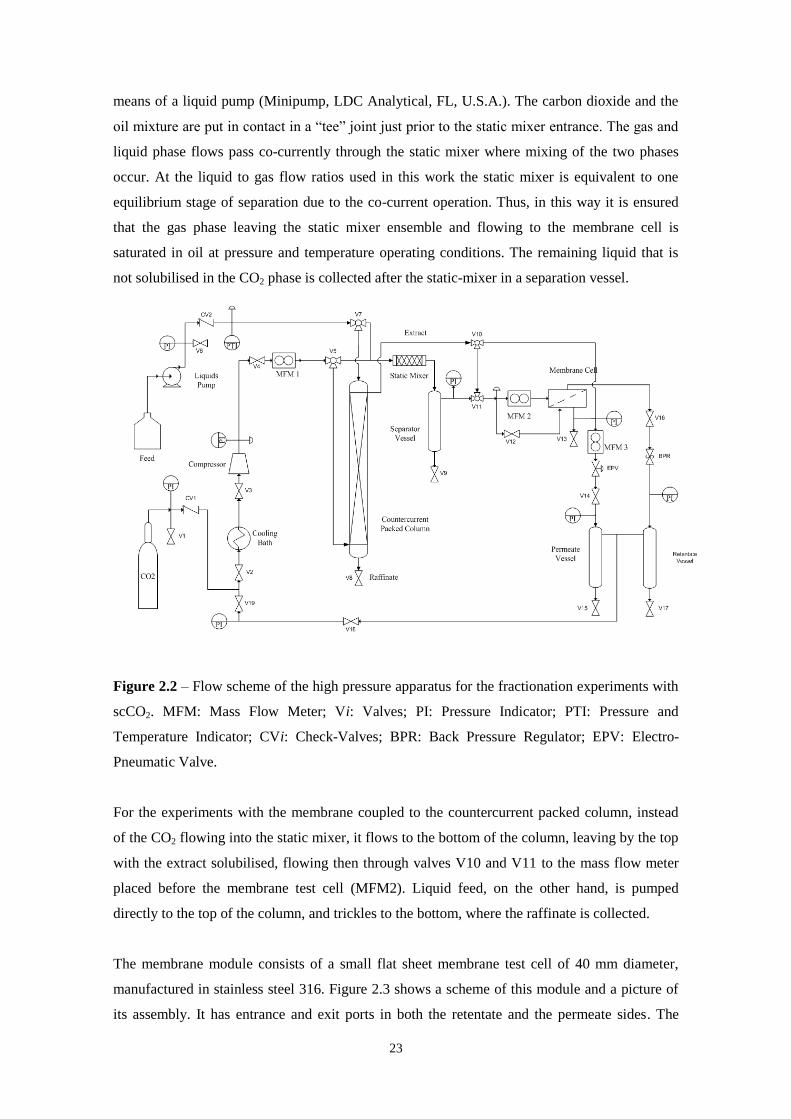
23
means of a liquid pump (Minipump, LDC Analytical, FL, U.S.A.). The carbon dioxide and the
oil mixture are put in contact in a “tee” joint just prior to the static mixer entrance. The gas and
liquid phase flows pass co-currently through the static mixer where mixing of the two phases
occur. At the liquid to gas flow ratios used in this work the static mixer is equivalent to one
equilibrium stage of separation due to the co-current operation. Thus, in this way it is ensured
that the gas phase leaving the static mixer ensemble and flowing to the membrane cell is
saturated in oil at pressure and temperature operating conditions. The remaining liquid that is
not solubilised in the CO2 phase is collected after the static-mixer in a separation vessel.
Figure 2.2 – Flow scheme of the high pressure apparatus for the fractionation experiments with
scCO2. MFM: Mass Flow Meter; Vi: Valves; PI: Pressure Indicator; PTI: Pressure and
Temperature Indicator; CVi: Check-Valves; BPR: Back Pressure Regulator; EPV: Electro-
Pneumatic Valve.
For the experiments with the membrane coupled to the countercurrent packed column, instead
of the CO2 flowing into the static mixer, it flows to the bottom of the column, leaving by the top
with the extract solubilised, flowing then through valves V10 and V11 to the mass flow meter
placed before the membrane test cell (MFM2). Liquid feed, on the other hand, is pumped
directly to the top of the column, and trickles to the bottom, where the raffinate is collected.
The membrane module consists of a small flat sheet membrane test cell of 40 mm diameter,
manufactured in stainless steel 316. Figure 2.3 shows a scheme of this module and a picture of
its assembly. It has entrance and exit ports in both the retentate and the permeate sides. The
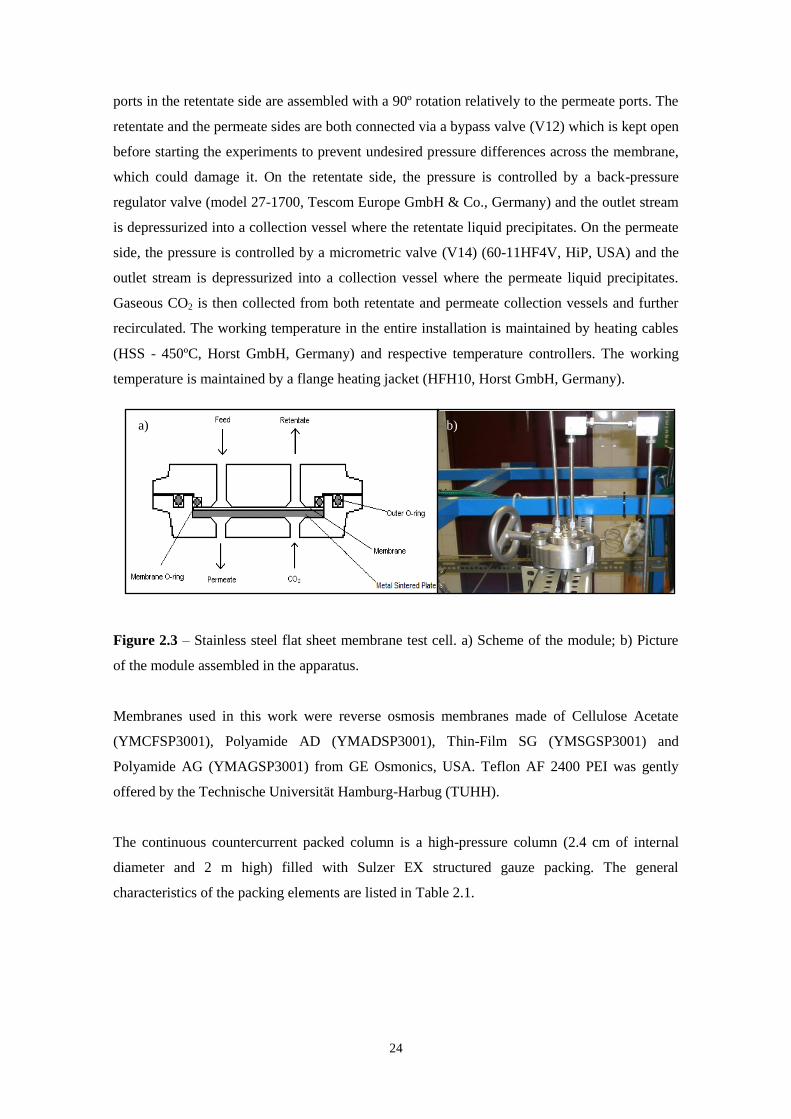
24
ports in the retentate side are assembled with a 90º rotation relatively to the permeate ports. The
retentate and the permeate sides are both connected via a bypass valve (V12) which is kept open
before starting the experiments to prevent undesired pressure differences across the membrane,
which could damage it. On the retentate side, the pressure is controlled by a back-pressure
regulator valve (model 27-1700, Tescom Europe GmbH & Co., Germany) and the outlet stream
is depressurized into a collection vessel where the retentate liquid precipitates. On the permeate
side, the pressure is controlled by a micrometric valve (V14) (60-11HF4V, HiP, USA) and the
outlet stream is depressurized into a collection vessel where the permeate liquid precipitates.
Gaseous CO2 is then collected from both retentate and permeate collection vessels and further
recirculated. The working temperature in the entire installation is maintained by heating cables
(HSS - 450ºC, Horst GmbH, Germany) and respective temperature controllers. The working
temperature is maintained by a flange heating jacket (HFH10, Horst GmbH, Germany).
Figure 2.3 – Stainless steel flat sheet membrane test cell. a) Scheme of the module; b) Picture
of the module assembled in the apparatus.
Membranes used in this work were reverse osmosis membranes made of Cellulose Acetate
(YMCFSP3001), Polyamide AD (YMADSP3001), Thin-Film SG (YMSGSP3001) and
Polyamide AG (YMAGSP3001) from GE Osmonics, USA. Teflon AF 2400 PEI was gently
offered by the Technische Universität Hamburg-Harbug (TUHH).
The continuous countercurrent packed column is a high-pressure column (2.4 cm of internal
diameter and 2 m high) filled with Sulzer EX structured gauze packing. The general
characteristics of the packing elements are listed in Table 2.1.
a) b)
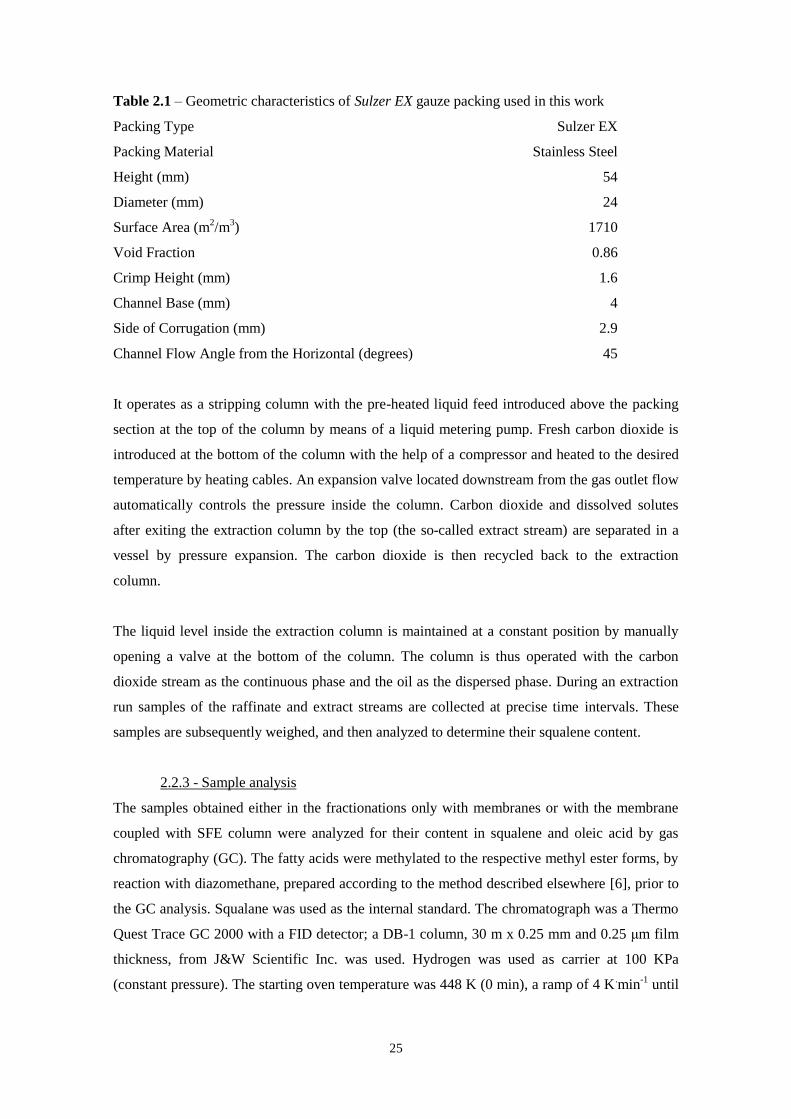
25
Table 2.1 – Geometric characteristics of Sulzer EX gauze packing used in this work
Packing Type Sulzer EX
Packing Material Stainless Steel
Height (mm) 54
Diameter (mm) 24
Surface Area (m2/m
3) 1710
Void Fraction 0.86
Crimp Height (mm) 1.6
Channel Base (mm) 4
Side of Corrugation (mm) 2.9
Channel Flow Angle from the Horizontal (degrees) 45
It operates as a stripping column with the pre-heated liquid feed introduced above the packing
section at the top of the column by means of a liquid metering pump. Fresh carbon dioxide is
introduced at the bottom of the column with the help of a compressor and heated to the desired
temperature by heating cables. An expansion valve located downstream from the gas outlet flow
automatically controls the pressure inside the column. Carbon dioxide and dissolved solutes
after exiting the extraction column by the top (the so-called extract stream) are separated in a
vessel by pressure expansion. The carbon dioxide is then recycled back to the extraction
column.
The liquid level inside the extraction column is maintained at a constant position by manually
opening a valve at the bottom of the column. The column is thus operated with the carbon
dioxide stream as the continuous phase and the oil as the dispersed phase. During an extraction
run samples of the raffinate and extract streams are collected at precise time intervals. These
samples are subsequently weighed, and then analyzed to determine their squalene content.
2.2.3 - Sample analysis
The samples obtained either in the fractionations only with membranes or with the membrane
coupled with SFE column were analyzed for their content in squalene and oleic acid by gas
chromatography (GC). The fatty acids were methylated to the respective methyl ester forms, by
reaction with diazomethane, prepared according to the method described elsewhere [6], prior to
the GC analysis. Squalane was used as the internal standard. The chromatograph was a Thermo
Quest Trace GC 2000 with a FID detector; a DB-1 column, 30 m x 0.25 mm and 0.25 μm film
thickness, from J&W Scientific Inc. was used. Hydrogen was used as carrier at 100 KPa
(constant pressure). The starting oven temperature was 448 K (0 min), a ramp of 4 K.min
-1 until
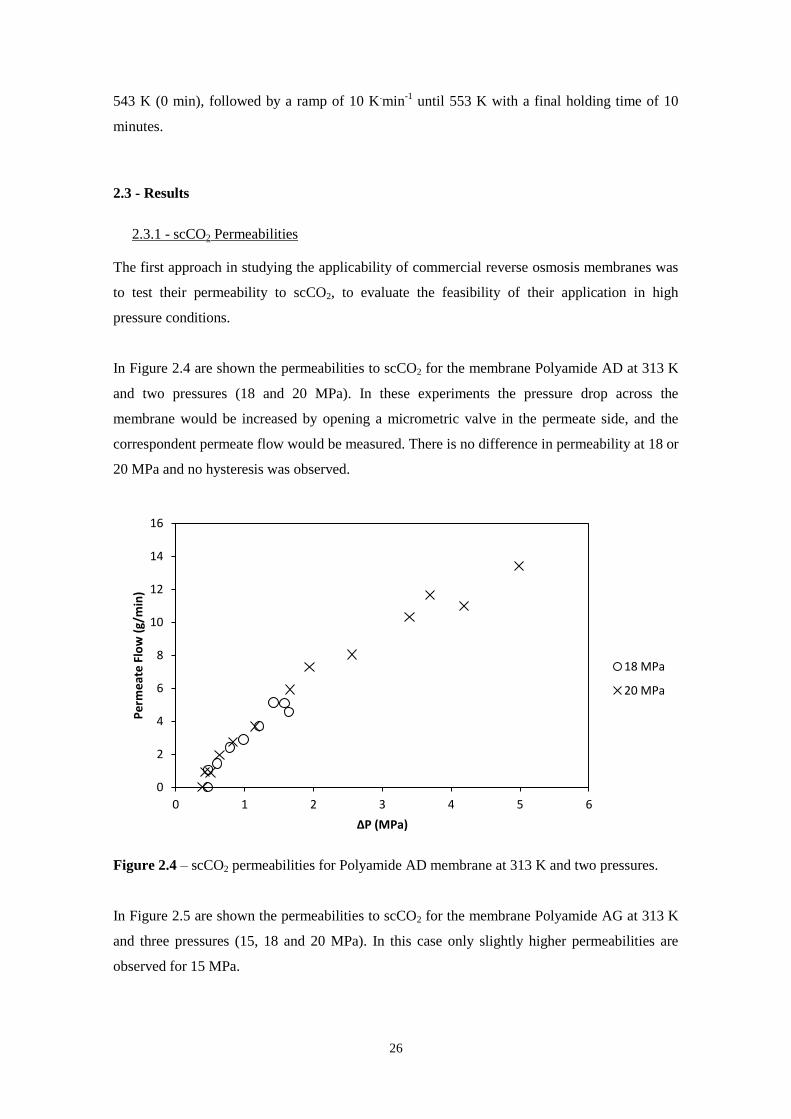
26
543 K (0 min), followed by a ramp of 10 K.min
-1 until 553 K with a final holding time of 10
minutes.
2.3 - Results
2.3.1 - scCO2 Permeabilities
The first approach in studying the applicability of commercial reverse osmosis membranes was
to test their permeability to scCO2, to evaluate the feasibility of their application in high
pressure conditions.
In Figure 2.4 are shown the permeabilities to scCO2 for the membrane Polyamide AD at 313 K
and two pressures (18 and 20 MPa). In these experiments the pressure drop across the
membrane would be increased by opening a micrometric valve in the permeate side, and the
correspondent permeate flow would be measured. There is no difference in permeability at 18 or
20 MPa and no hysteresis was observed.
Figure 2.4 – scCO2 permeabilities for Polyamide AD membrane at 313 K and two pressures.
In Figure 2.5 are shown the permeabilities to scCO2 for the membrane Polyamide AG at 313 K
and three pressures (15, 18 and 20 MPa). In this case only slightly higher permeabilities are
observed for 15 MPa.
0
2
4
6
8
10
12
14
16
0 1 2 3 4 5 6
Pe
rme
ate
Flo
w (
g/m
in)
ΔP (MPa)
18 MPa
20 MPa
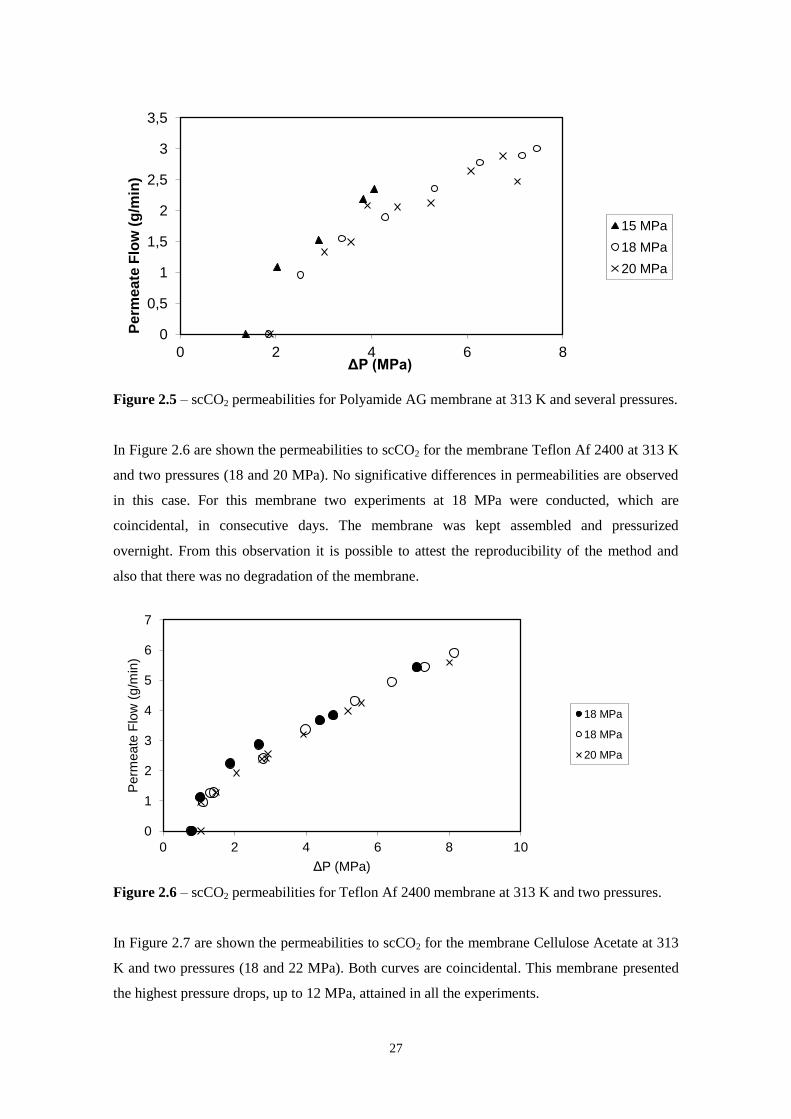
27
Figure 2.5 – scCO2 permeabilities for Polyamide AG membrane at 313 K and several pressures.
In Figure 2.6 are shown the permeabilities to scCO2 for the membrane Teflon Af 2400 at 313 K
and two pressures (18 and 20 MPa). No significative differences in permeabilities are observed
in this case. For this membrane two experiments at 18 MPa were conducted, which are
coincidental, in consecutive days. The membrane was kept assembled and pressurized
overnight. From this observation it is possible to attest the reproducibility of the method and
also that there was no degradation of the membrane.
Figure 2.6 – scCO2 permeabilities for Teflon Af 2400 membrane at 313 K and two pressures.
In Figure 2.7 are shown the permeabilities to scCO2 for the membrane Cellulose Acetate at 313
K and two pressures (18 and 22 MPa). Both curves are coincidental. This membrane presented
the highest pressure drops, up to 12 MPa, attained in all the experiments.
0
0,5
1
1,5
2
2,5
3
3,5
0 2 4 6 8
Pe
rme
ate
Flo
w (
g/m
in)
ΔP (MPa)
15 MPa
18 MPa
20 MPa
0
1
2
3
4
5
6
7
0 2 4 6 8 10
Perm
eate
Flo
w (
g/m
in)
ΔP (MPa)
18 MPa
18 MPa
20 MPa
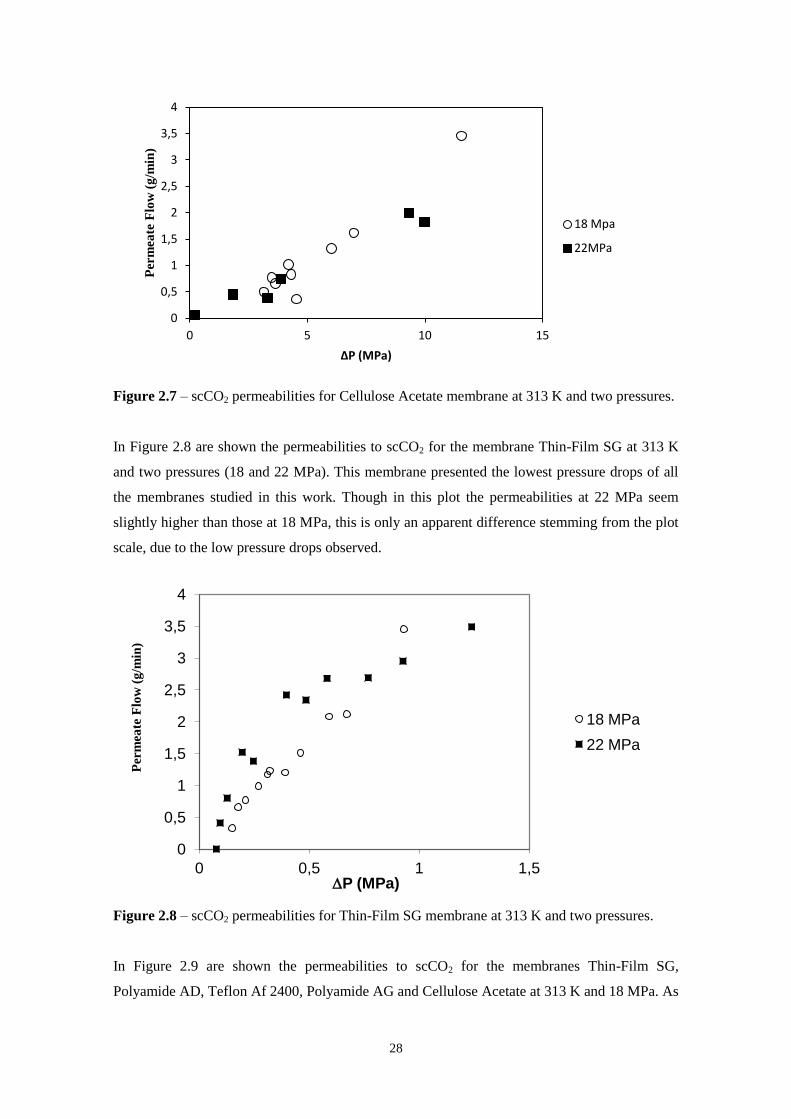
28
Figure 2.7 – scCO2 permeabilities for Cellulose Acetate membrane at 313 K and two pressures.
In Figure 2.8 are shown the permeabilities to scCO2 for the membrane Thin-Film SG at 313 K
and two pressures (18 and 22 MPa). This membrane presented the lowest pressure drops of all
the membranes studied in this work. Though in this plot the permeabilities at 22 MPa seem
slightly higher than those at 18 MPa, this is only an apparent difference stemming from the plot
scale, due to the low pressure drops observed.
Figure 2.8 – scCO2 permeabilities for Thin-Film SG membrane at 313 K and two pressures.
In Figure 2.9 are shown the permeabilities to scCO2 for the membranes Thin-Film SG,
Polyamide AD, Teflon Af 2400, Polyamide AG and Cellulose Acetate at 313 K and 18 MPa. As
0
0,5
1
1,5
2
2,5
3
3,5
4
0 5 10 15
Per
mea
te F
low
(g
/min
)
ΔP (MPa)
18 Mpa
22MPa
0
0,5
1
1,5
2
2,5
3
3,5
4
0 0,5 1 1,5
Per
mea
te F
low
(g
/min
)
DP (MPa)
18 MPa
22 MPa
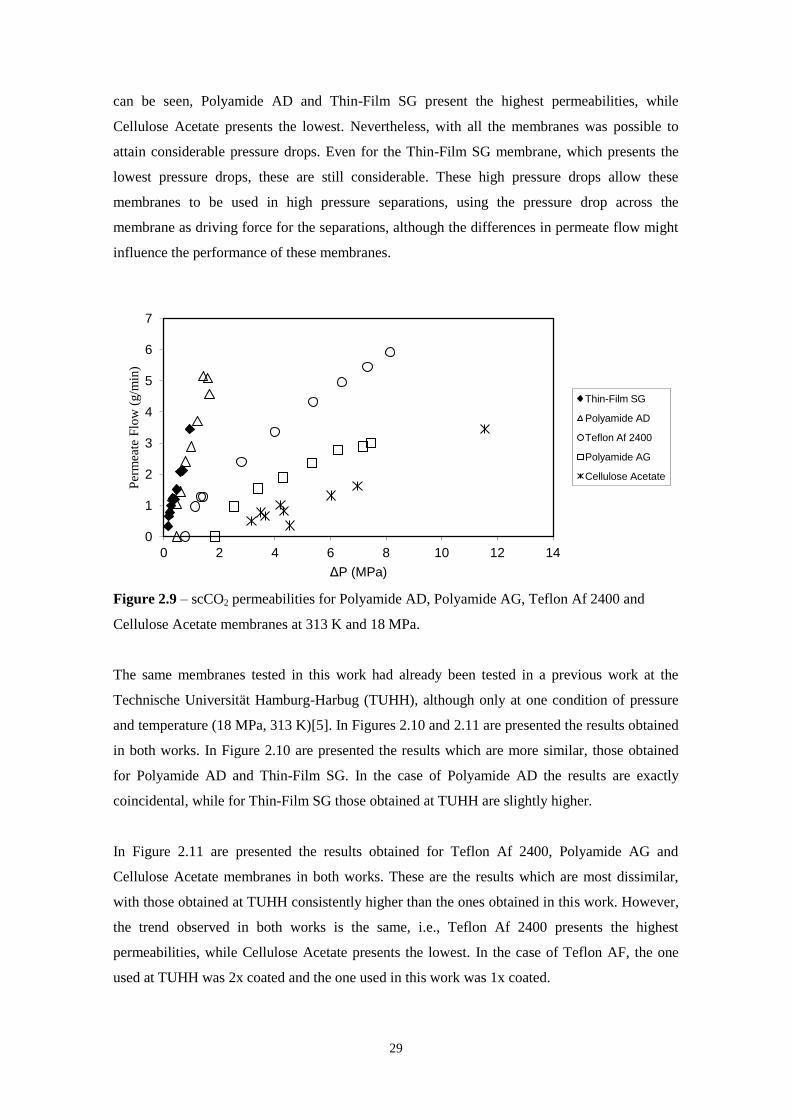
29
can be seen, Polyamide AD and Thin-Film SG present the highest permeabilities, while
Cellulose Acetate presents the lowest. Nevertheless, with all the membranes was possible to
attain considerable pressure drops. Even for the Thin-Film SG membrane, which presents the
lowest pressure drops, these are still considerable. These high pressure drops allow these
membranes to be used in high pressure separations, using the pressure drop across the
membrane as driving force for the separations, although the differences in permeate flow might
influence the performance of these membranes.
Figure 2.9 – scCO2 permeabilities for Polyamide AD, Polyamide AG, Teflon Af 2400 and
Cellulose Acetate membranes at 313 K and 18 MPa.
The same membranes tested in this work had already been tested in a previous work at the
Technische Universität Hamburg-Harbug (TUHH), although only at one condition of pressure
and temperature (18 MPa, 313 K)[5]. In Figures 2.10 and 2.11 are presented the results obtained
in both works. In Figure 2.10 are presented the results which are more similar, those obtained
for Polyamide AD and Thin-Film SG. In the case of Polyamide AD the results are exactly
coincidental, while for Thin-Film SG those obtained at TUHH are slightly higher.
In Figure 2.11 are presented the results obtained for Teflon Af 2400, Polyamide AG and
Cellulose Acetate membranes in both works. These are the results which are most dissimilar,
with those obtained at TUHH consistently higher than the ones obtained in this work. However,
the trend observed in both works is the same, i.e., Teflon Af 2400 presents the highest
permeabilities, while Cellulose Acetate presents the lowest. In the case of Teflon AF, the one
used at TUHH was 2x coated and the one used in this work was 1x coated.
0
1
2
3
4
5
6
7
0 2 4 6 8 10 12 14
Per
mea
te F
low
(g/m
in)
ΔP (MPa)
Thin-Film SG
Polyamide AD
Teflon Af 2400
Polyamide AG
Cellulose Acetate
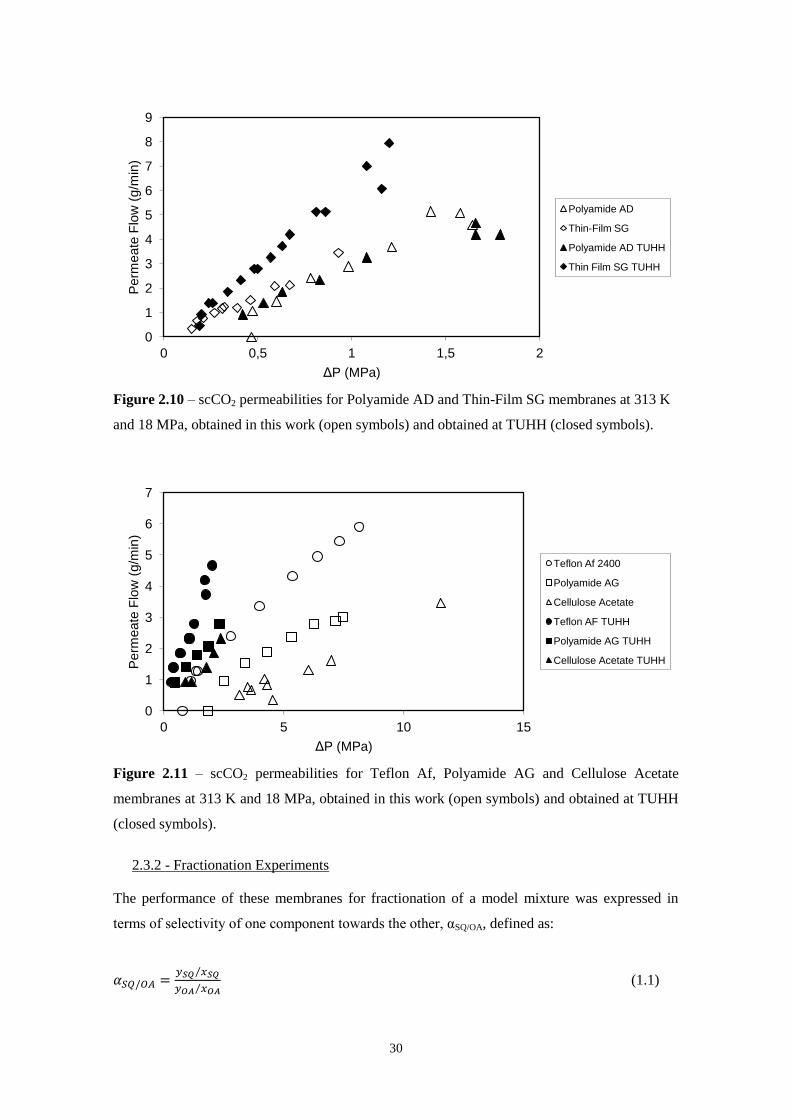
30
Figure 2.10 – scCO2 permeabilities for Polyamide AD and Thin-Film SG membranes at 313 K
and 18 MPa, obtained in this work (open symbols) and obtained at TUHH (closed symbols).
Figure 2.11 – scCO2 permeabilities for Teflon Af, Polyamide AG and Cellulose Acetate
membranes at 313 K and 18 MPa, obtained in this work (open symbols) and obtained at TUHH
(closed symbols).
2.3.2 - Fractionation Experiments
The performance of these membranes for fractionation of a model mixture was expressed in
terms of selectivity of one component towards the other, αSQ/OA, defined as:
(1.1)
0
1
2
3
4
5
6
7
8
9
0 0,5 1 1,5 2
Perm
eate
Flo
w (
g/m
in)
ΔP (MPa)
Polyamide AD
Thin-Film SG
Polyamide AD TUHH
Thin Film SG TUHH
0
1
2
3
4
5
6
7
0 5 10 15
Perm
eate
Flo
w (
g/m
in)
ΔP (MPa)
Teflon Af 2400
Polyamide AG
Cellulose Acetate
Teflon AF TUHH
Polyamide AG TUHH
Cellulose Acetate TUHH
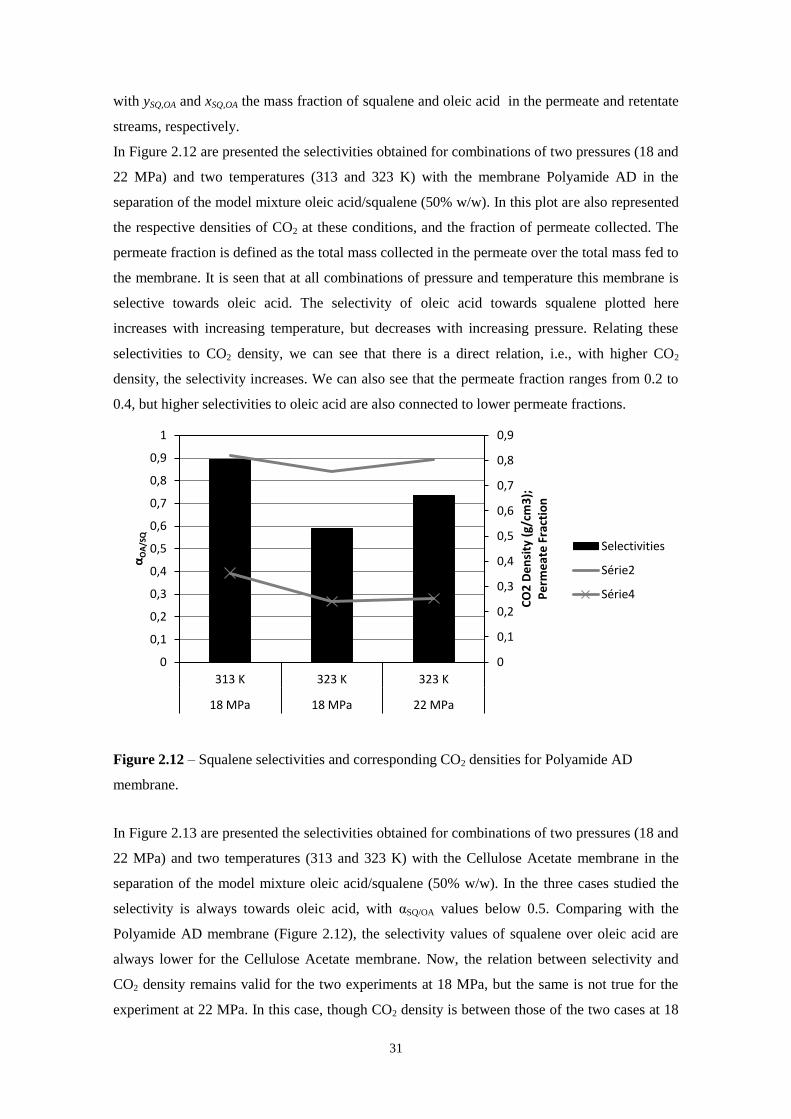
31
with ySQ,OA and xSQ,OA the mass fraction of squalene and oleic acid in the permeate and retentate
streams, respectively.
In Figure 2.12 are presented the selectivities obtained for combinations of two pressures (18 and
22 MPa) and two temperatures (313 and 323 K) with the membrane Polyamide AD in the
separation of the model mixture oleic acid/squalene (50% w/w). In this plot are also represented
the respective densities of CO2 at these conditions, and the fraction of permeate collected. The
permeate fraction is defined as the total mass collected in the permeate over the total mass fed to
the membrane. It is seen that at all combinations of pressure and temperature this membrane is
selective towards oleic acid. The selectivity of oleic acid towards squalene plotted here
increases with increasing temperature, but decreases with increasing pressure. Relating these
selectivities to CO2 density, we can see that there is a direct relation, i.e., with higher CO2
density, the selectivity increases. We can also see that the permeate fraction ranges from 0.2 to
0.4, but higher selectivities to oleic acid are also connected to lower permeate fractions.
Figure 2.12 – Squalene selectivities and corresponding CO2 densities for Polyamide AD
membrane.
In Figure 2.13 are presented the selectivities obtained for combinations of two pressures (18 and
22 MPa) and two temperatures (313 and 323 K) with the Cellulose Acetate membrane in the
separation of the model mixture oleic acid/squalene (50% w/w). In the three cases studied the
selectivity is always towards oleic acid, with αSQ/OA values below 0.5. Comparing with the
Polyamide AD membrane (Figure 2.12), the selectivity values of squalene over oleic acid are
always lower for the Cellulose Acetate membrane. Now, the relation between selectivity and
CO2 density remains valid for the two experiments at 18 MPa, but the same is not true for the
experiment at 22 MPa. In this case, though CO2 density is between those of the two cases at 18
0
0,1
0,2
0,3
0,4
0,5
0,6
0,7
0,8
0,9
0
0,1
0,2
0,3
0,4
0,5
0,6
0,7
0,8
0,9
1
313 K 323 K 323 K
18 MPa 18 MPa 22 MPa
CO
2 D
en
sity
(g/
cm3
);
Pe
rme
ate
Fra
ctio
n
αO
A/S
Q
Selectivities
Série2
Série4
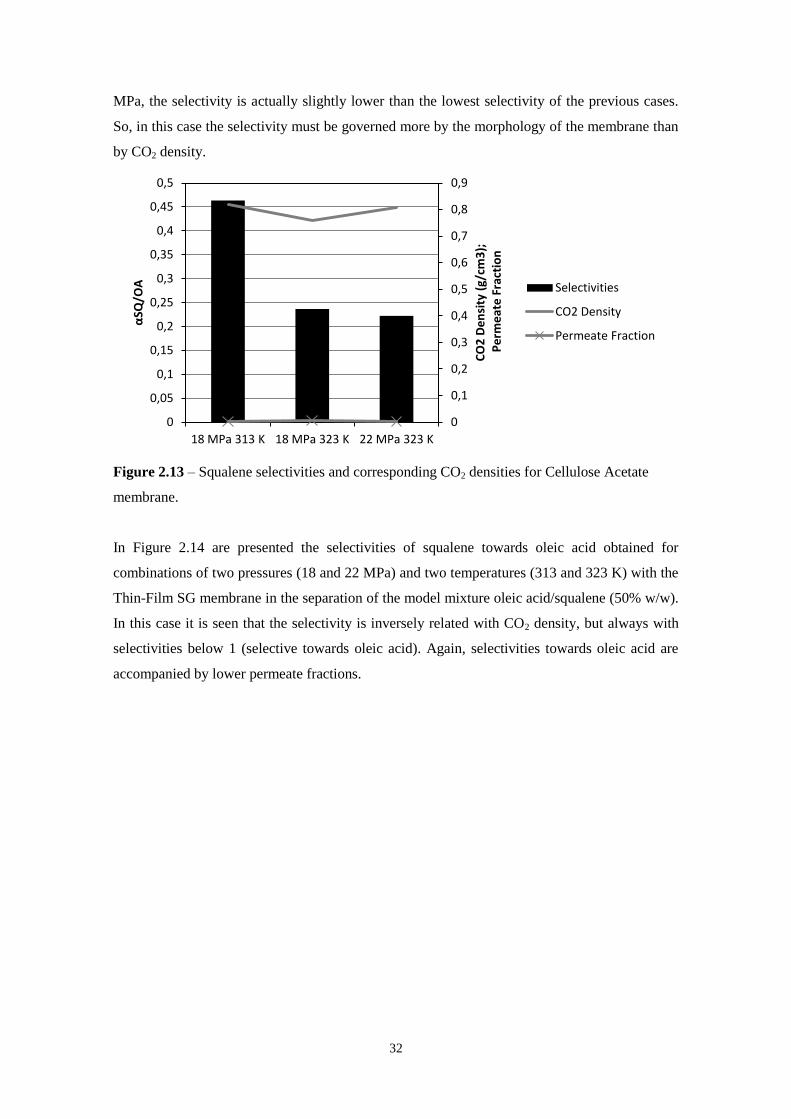
32
MPa, the selectivity is actually slightly lower than the lowest selectivity of the previous cases.
So, in this case the selectivity must be governed more by the morphology of the membrane than
by CO2 density.
Figure 2.13 – Squalene selectivities and corresponding CO2 densities for Cellulose Acetate
membrane.
In Figure 2.14 are presented the selectivities of squalene towards oleic acid obtained for
combinations of two pressures (18 and 22 MPa) and two temperatures (313 and 323 K) with the
Thin-Film SG membrane in the separation of the model mixture oleic acid/squalene (50% w/w).
In this case it is seen that the selectivity is inversely related with CO2 density, but always with
selectivities below 1 (selective towards oleic acid). Again, selectivities towards oleic acid are
accompanied by lower permeate fractions.
0
0,1
0,2
0,3
0,4
0,5
0,6
0,7
0,8
0,9
0
0,05
0,1
0,15
0,2
0,25
0,3
0,35
0,4
0,45
0,5
18 MPa 313 K 18 MPa 323 K 22 MPa 323 K
CO
2 D
en
sity
(g/
cm3
);
Pe
rme
ate
Fra
ctio
n
αSQ
/OA
Selectivities
CO2 Density
Permeate Fraction
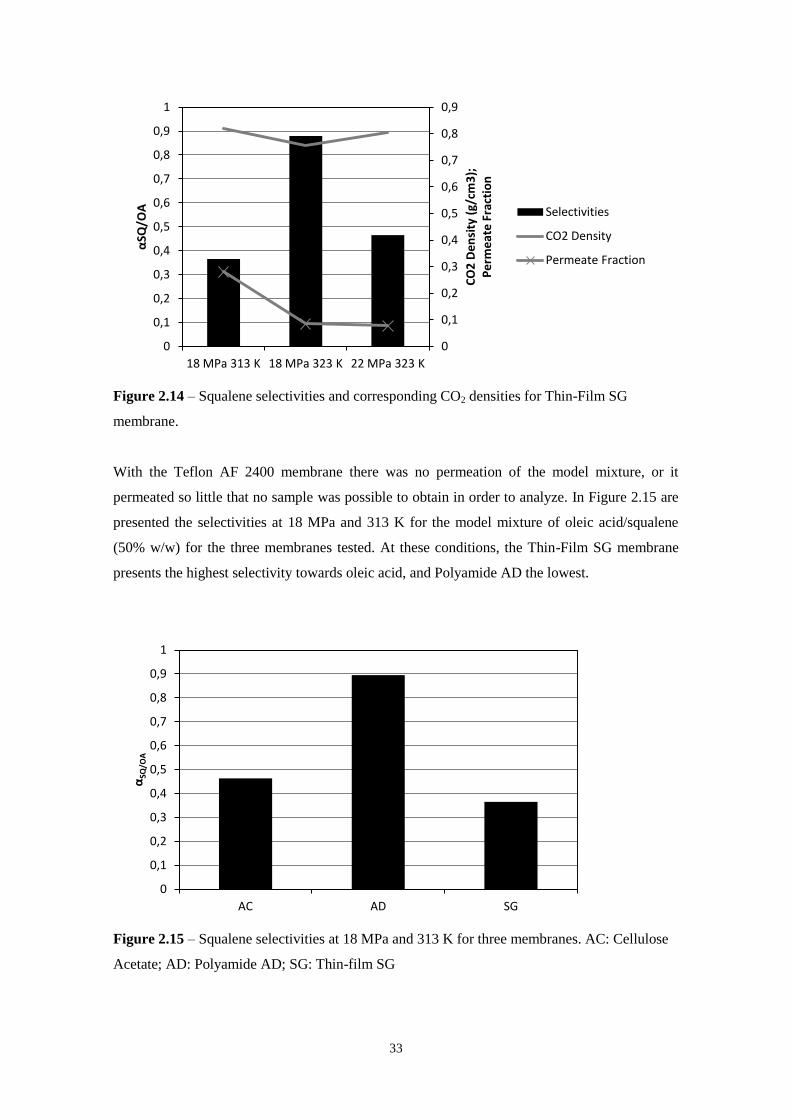
33
Figure 2.14 – Squalene selectivities and corresponding CO2 densities for Thin-Film SG
membrane.
With the Teflon AF 2400 membrane there was no permeation of the model mixture, or it
permeated so little that no sample was possible to obtain in order to analyze. In Figure 2.15 are
presented the selectivities at 18 MPa and 313 K for the model mixture of oleic acid/squalene
(50% w/w) for the three membranes tested. At these conditions, the Thin-Film SG membrane
presents the highest selectivity towards oleic acid, and Polyamide AD the lowest.
Figure 2.15 – Squalene selectivities at 18 MPa and 313 K for three membranes. AC: Cellulose
Acetate; AD: Polyamide AD; SG: Thin-film SG
0
0,1
0,2
0,3
0,4
0,5
0,6
0,7
0,8
0,9
0
0,1
0,2
0,3
0,4
0,5
0,6
0,7
0,8
0,9
1
18 MPa 313 K 18 MPa 323 K 22 MPa 323 K
CO
2 D
en
sity
(g/
cm3
);
Pe
rme
ate
Fra
ctio
n
αSQ
/OA
Selectivities
CO2 Density
Permeate Fraction
0
0,1
0,2
0,3
0,4
0,5
0,6
0,7
0,8
0,9
1
AC AD SG
αSQ
/OA
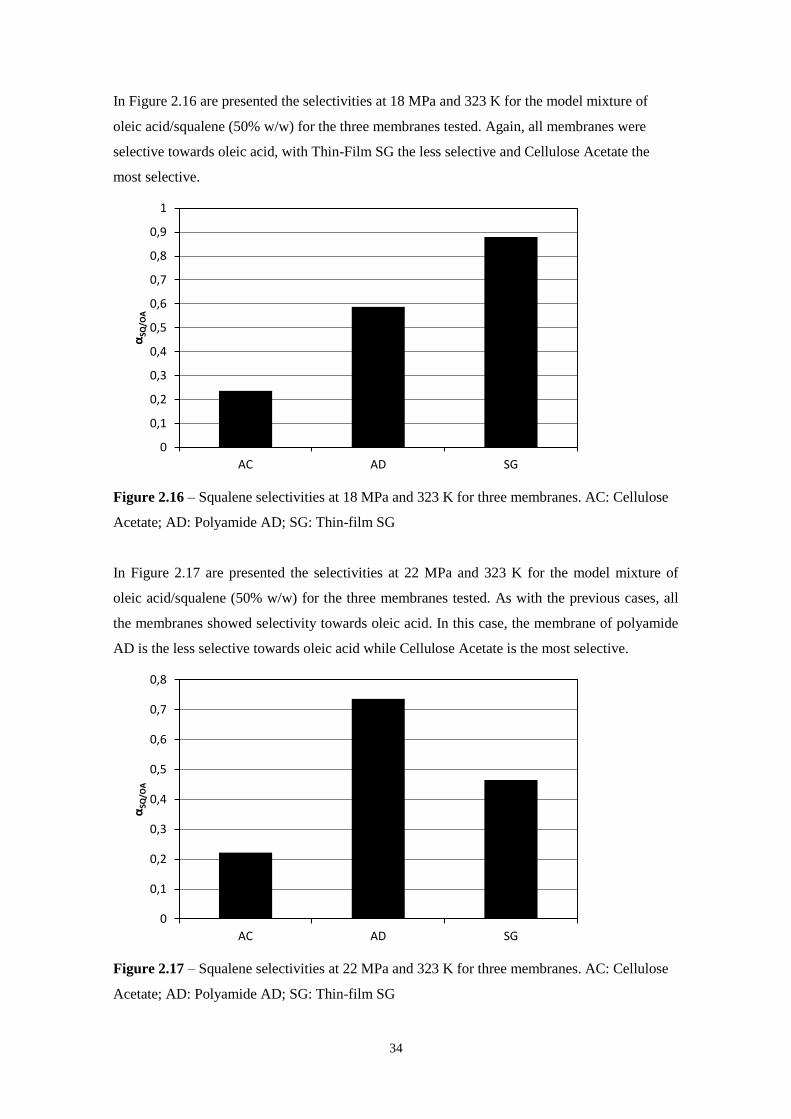
34
In Figure 2.16 are presented the selectivities at 18 MPa and 323 K for the model mixture of
oleic acid/squalene (50% w/w) for the three membranes tested. Again, all membranes were
selective towards oleic acid, with Thin-Film SG the less selective and Cellulose Acetate the
most selective.
Figure 2.16 – Squalene selectivities at 18 MPa and 323 K for three membranes. AC: Cellulose
Acetate; AD: Polyamide AD; SG: Thin-film SG
In Figure 2.17 are presented the selectivities at 22 MPa and 323 K for the model mixture of
oleic acid/squalene (50% w/w) for the three membranes tested. As with the previous cases, all
the membranes showed selectivity towards oleic acid. In this case, the membrane of polyamide
AD is the less selective towards oleic acid while Cellulose Acetate is the most selective.
Figure 2.17 – Squalene selectivities at 22 MPa and 323 K for three membranes. AC: Cellulose
Acetate; AD: Polyamide AD; SG: Thin-film SG
0
0,1
0,2
0,3
0,4
0,5
0,6
0,7
0,8
0,9
1
AC AD SG
αSQ
/OA
0
0,1
0,2
0,3
0,4
0,5
0,6
0,7
0,8
AC AD SG
αSQ
/OA
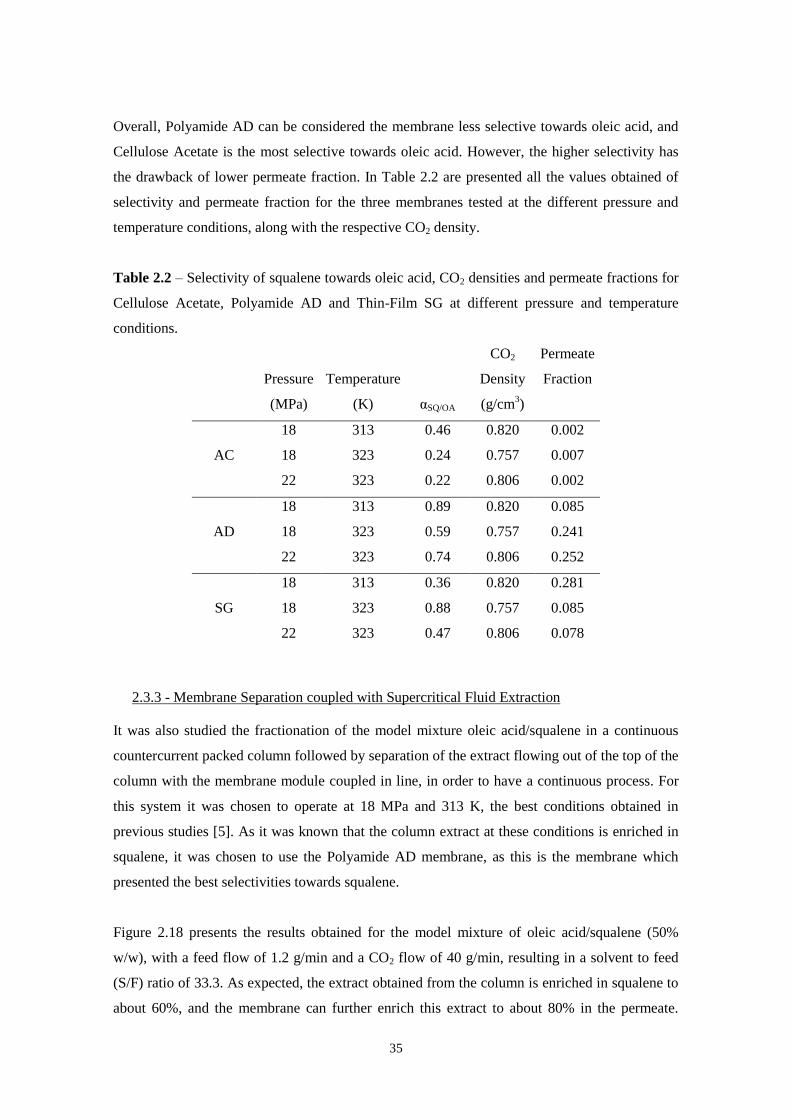
35
Overall, Polyamide AD can be considered the membrane less selective towards oleic acid, and
Cellulose Acetate is the most selective towards oleic acid. However, the higher selectivity has
the drawback of lower permeate fraction. In Table 2.2 are presented all the values obtained of
selectivity and permeate fraction for the three membranes tested at the different pressure and
temperature conditions, along with the respective CO2 density.
Table 2.2 – Selectivity of squalene towards oleic acid, CO2 densities and permeate fractions for
Cellulose Acetate, Polyamide AD and Thin-Film SG at different pressure and temperature
conditions.
Pressure
(MPa)
Temperature
(K) αSQ/OA
CO2
Density
(g/cm3)
Permeate
Fraction
AC
18 313 0.46 0.820 0.002
18 323 0.24 0.757 0.007
22 323 0.22 0.806 0.002
AD
18 313 0.89 0.820 0.085
18 323 0.59 0.757 0.241
22 323 0.74 0.806 0.252
SG
18 313 0.36 0.820 0.281
18 323 0.88 0.757 0.085
22 323 0.47 0.806 0.078
2.3.3 - Membrane Separation coupled with Supercritical Fluid Extraction
It was also studied the fractionation of the model mixture oleic acid/squalene in a continuous
countercurrent packed column followed by separation of the extract flowing out of the top of the
column with the membrane module coupled in line, in order to have a continuous process. For
this system it was chosen to operate at 18 MPa and 313 K, the best conditions obtained in
previous studies [5]. As it was known that the column extract at these conditions is enriched in
squalene, it was chosen to use the Polyamide AD membrane, as this is the membrane which
presented the best selectivities towards squalene.
Figure 2.18 presents the results obtained for the model mixture of oleic acid/squalene (50%
w/w), with a feed flow of 1.2 g/min and a CO2 flow of 40 g/min, resulting in a solvent to feed
(S/F) ratio of 33.3. As expected, the extract obtained from the column is enriched in squalene to
about 60%, and the membrane can further enrich this extract to about 80% in the permeate.
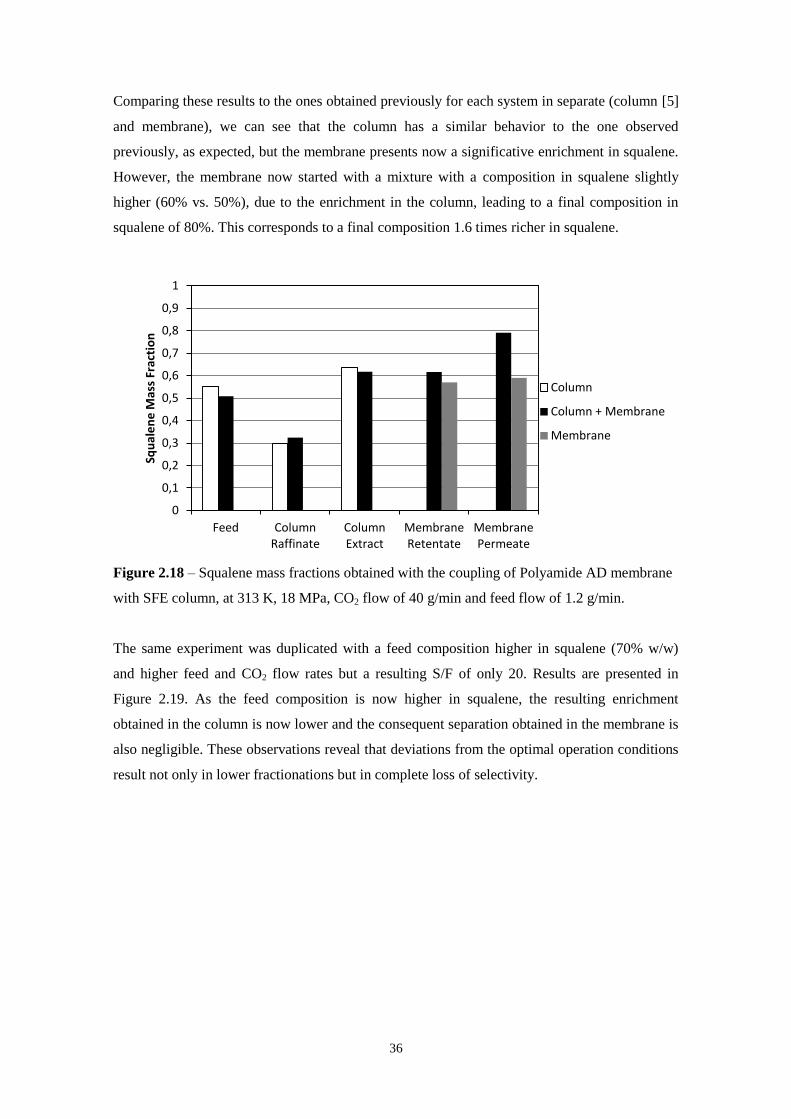
36
Comparing these results to the ones obtained previously for each system in separate (column [5]
and membrane), we can see that the column has a similar behavior to the one observed
previously, as expected, but the membrane presents now a significative enrichment in squalene.
However, the membrane now started with a mixture with a composition in squalene slightly
higher (60% vs. 50%), due to the enrichment in the column, leading to a final composition in
squalene of 80%. This corresponds to a final composition 1.6 times richer in squalene.
Figure 2.18 – Squalene mass fractions obtained with the coupling of Polyamide AD membrane
with SFE column, at 313 K, 18 MPa, CO2 flow of 40 g/min and feed flow of 1.2 g/min.
The same experiment was duplicated with a feed composition higher in squalene (70% w/w)
and higher feed and CO2 flow rates but a resulting S/F of only 20. Results are presented in
Figure 2.19. As the feed composition is now higher in squalene, the resulting enrichment
obtained in the column is now lower and the consequent separation obtained in the membrane is
also negligible. These observations reveal that deviations from the optimal operation conditions
result not only in lower fractionations but in complete loss of selectivity.
0
0,1
0,2
0,3
0,4
0,5
0,6
0,7
0,8
0,9
1
Feed Column Raffinate
Column Extract
Membrane Retentate
Membrane Permeate
Squ
ale
ne
Mas
s Fr
acti
on
Column
Column + Membrane
Membrane
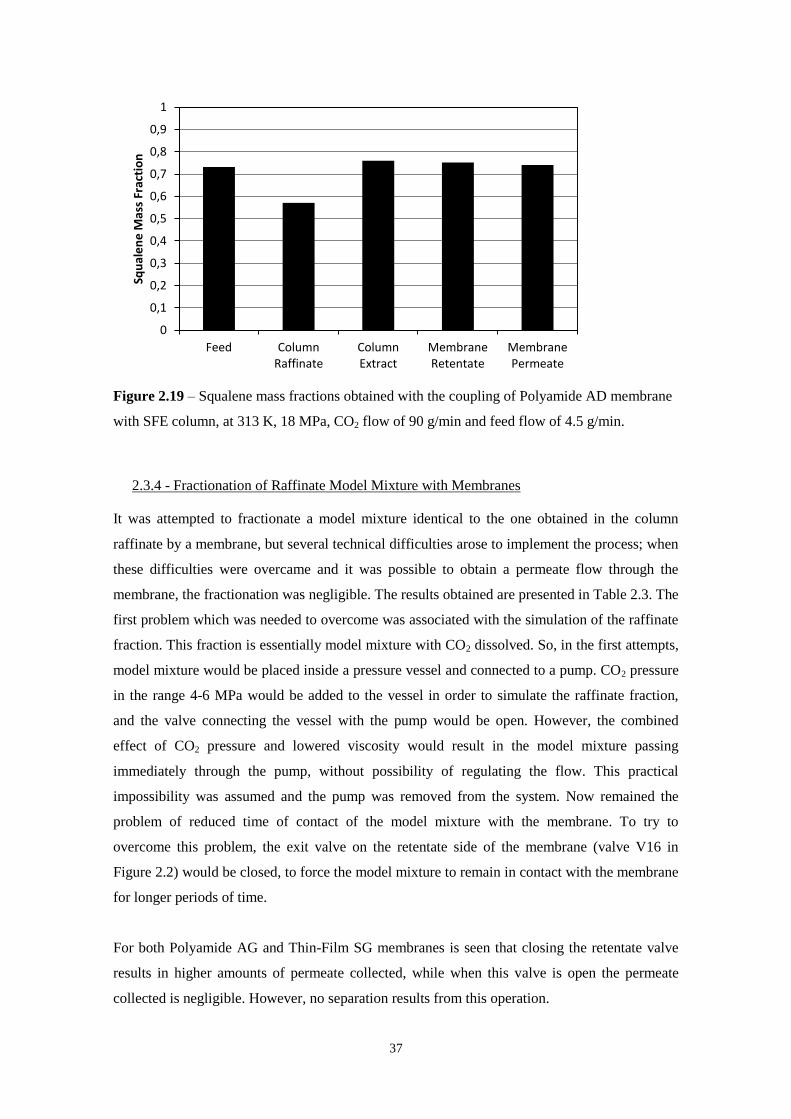
37
Figure 2.19 – Squalene mass fractions obtained with the coupling of Polyamide AD membrane
with SFE column, at 313 K, 18 MPa, CO2 flow of 90 g/min and feed flow of 4.5 g/min.
2.3.4 - Fractionation of Raffinate Model Mixture with Membranes
It was attempted to fractionate a model mixture identical to the one obtained in the column
raffinate by a membrane, but several technical difficulties arose to implement the process; when
these difficulties were overcame and it was possible to obtain a permeate flow through the
membrane, the fractionation was negligible. The results obtained are presented in Table 2.3. The
first problem which was needed to overcome was associated with the simulation of the raffinate
fraction. This fraction is essentially model mixture with CO2 dissolved. So, in the first attempts,
model mixture would be placed inside a pressure vessel and connected to a pump. CO2 pressure
in the range 4-6 MPa would be added to the vessel in order to simulate the raffinate fraction,
and the valve connecting the vessel with the pump would be open. However, the combined
effect of CO2 pressure and lowered viscosity would result in the model mixture passing
immediately through the pump, without possibility of regulating the flow. This practical
impossibility was assumed and the pump was removed from the system. Now remained the
problem of reduced time of contact of the model mixture with the membrane. To try to
overcome this problem, the exit valve on the retentate side of the membrane (valve V16 in
Figure 2.2) would be closed, to force the model mixture to remain in contact with the membrane
for longer periods of time.
For both Polyamide AG and Thin-Film SG membranes is seen that closing the retentate valve
results in higher amounts of permeate collected, while when this valve is open the permeate
collected is negligible. However, no separation results from this operation.
0
0,1
0,2
0,3
0,4
0,5
0,6
0,7
0,8
0,9
1
Feed Column Raffinate
Column Extract
Membrane Retentate
Membrane Permeate
Squ
ale
ne
Mas
s Fr
acti
on
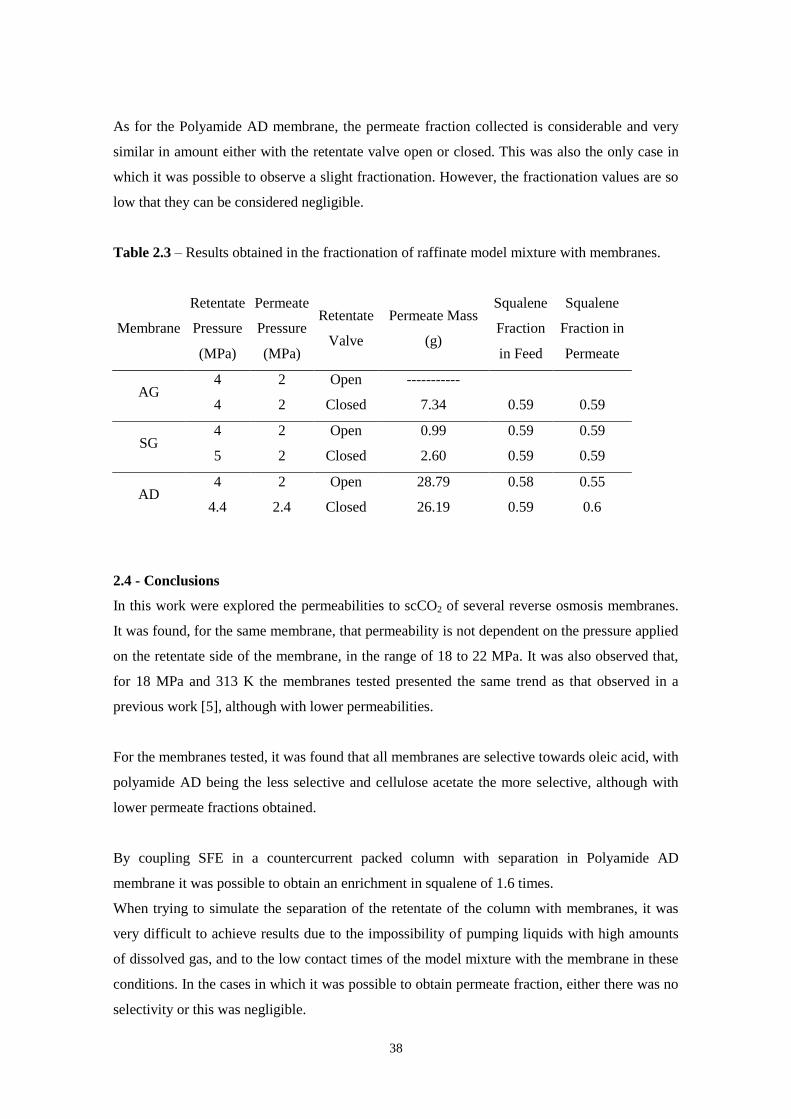
38
As for the Polyamide AD membrane, the permeate fraction collected is considerable and very
similar in amount either with the retentate valve open or closed. This was also the only case in
which it was possible to observe a slight fractionation. However, the fractionation values are so
low that they can be considered negligible.
Table 2.3 – Results obtained in the fractionation of raffinate model mixture with membranes.
Membrane
Retentate
Pressure
(MPa)
Permeate
Pressure
(MPa)
Retentate
Valve
Permeate Mass
(g)
Squalene
Fraction
in Feed
Squalene
Fraction in
Permeate
AG 4 2 Open -----------
4 2 Closed 7.34 0.59 0.59
SG 4 2 Open 0.99 0.59 0.59
5 2 Closed 2.60 0.59 0.59
AD 4 2 Open 28.79 0.58 0.55
4.4 2.4 Closed 26.19 0.59 0.6
2.4 - Conclusions
In this work were explored the permeabilities to scCO2 of several reverse osmosis membranes.
It was found, for the same membrane, that permeability is not dependent on the pressure applied
on the retentate side of the membrane, in the range of 18 to 22 MPa. It was also observed that,
for 18 MPa and 313 K the membranes tested presented the same trend as that observed in a
previous work [5], although with lower permeabilities.
For the membranes tested, it was found that all membranes are selective towards oleic acid, with
polyamide AD being the less selective and cellulose acetate the more selective, although with
lower permeate fractions obtained.
By coupling SFE in a countercurrent packed column with separation in Polyamide AD
membrane it was possible to obtain an enrichment in squalene of 1.6 times.
When trying to simulate the separation of the retentate of the column with membranes, it was
very difficult to achieve results due to the impossibility of pumping liquids with high amounts
of dissolved gas, and to the low contact times of the model mixture with the membrane in these
conditions. In the cases in which it was possible to obtain permeate fraction, either there was no
selectivity or this was negligible.
39
2.5 - References
[1] G. Brunner, Gas Extraction, Springer, Berlin, 1994.
[2] L. Reddy, P. Couvreur; Squalene: A natural triterpene for use in disease management
and therapy; Advanced Drug Delivery Reviews 61 (2009) 1412–1426.
[3] O. Catchpole, P. Simões, J. Grey, E. Nogueiro, P. Carmelo, M. Nunes da Ponte,
Fractionation of Lipids in a Static Mixer and Packed Column Using Supercritical
Carbon Dioxide, Ind. Eng. Chem. Res. 39 (12) (2000) 4820-4827.
[4] R.M. Ruivo, R.M. Couto, P.C. Simões, High Pressure Phase Equilibria of the Ternary
System Oleic Acid / Squalene / Carbon Dioxide, J.Chem.Eng.Data. 52 (2007) 566-570.
[5] R. Ruivo, R. Couto, P. C. Simões; Supercritical carbon dioxide fractionation of the
model mixture squalene/oleic acid in a membrane contactor; Separation and Purification
Technology 59 (2008) 231–237.
[6] B.S. Furniss, A.J. Hannaford, P.W.G. Smith, A.R. Tachtell, Vogel’s Textbook of
Practical Organic Chemistry, fifth ed., Longmann Scientific & Technical, England,
1989.

40
41
Chapter 3
Ionic Liquids Screening1
1 Chapter published previously as: Rui Ruivo, Ricardo Couto, Pedro C. Simões; Screening of ionic
liquids as promising separation agents of oil mixtures for application in membranes; Separation and
Purification Technology 76 (2010) 84–88.

42
43
3.1 - Introduction
Chapter 2 explored the feasibility of coupling supercritical carbon dioxide extraction together
with reverse osmosis membranes to improve the fractionation efficiency of squalene from the
free fatty acids in olive oil residues. It was observed that the enrichment in the permeate side is
mainly towards oleic acid. However, higher selectivities had the drawback of less permeate
fraction collected.
A promising alternative is the use of supported ionic liquid membranes (SILM). SILM are
composed of membranes in which a room temperature ionic liquid (RTIL) is immobilized. They
have been successfully employed in the separation of organic compounds such as hydrocarbons,
alcohols, amines and esters [1]-[5], owing to the high stability and non-volatile character of
RTIL and their advantage with regard to tailor-made design for specific separation tasks. RTIL
can be customized by an almost unlimited combination of cation-anion pairs to be selective for
a specific compound in an extraction process. Thus, the use of supported ionic liquid
membranes may be particularly interesting for the separation of squalene from free fatty acids in
olive oil residues.
The purpose of this work was to screen and identify potential ionic liquids to be used in
conjunction with the reverse osmosis membranes studied in Chapter 2, in order to create SILMs,
which will be described in Chapter 5. With this aim in view, the same model mixture of oleic
acid and squalene (50% w/w) used in Chapter 2, resembling the olive oil residues, was studied
with a range of ionic liquids, chosen in order to assess the role of different cation (imidazolium,
phosphonium and ammonium) and anion (tetrafluoroborate, hexafluorophosphate, bistriflamide,
dicyanamide, nitrate, ethylsulfate, methanesulfonate, 2-(2-methoxyethoxy)-ethylsulfate) types
on the extraction efficiency (Figure 3.1).
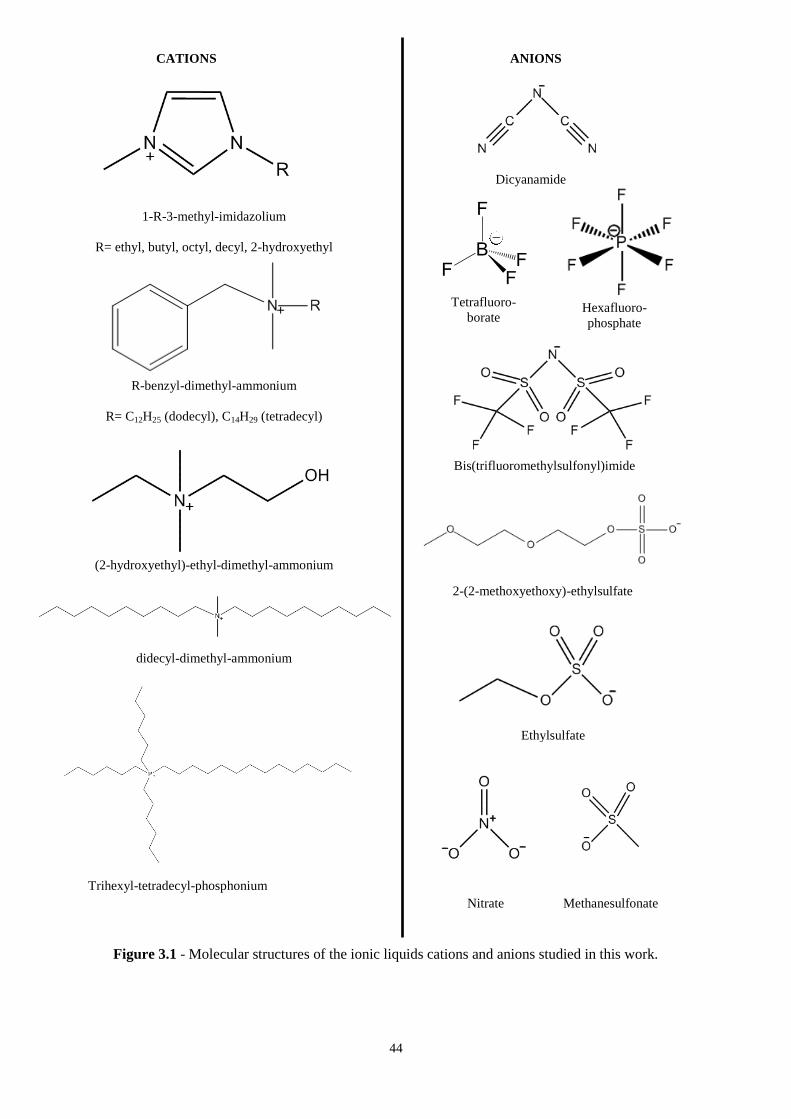
44
Figure 3.1 - Molecular structures of the ionic liquids cations and anions studied in this work.
1-R-3-methyl-imidazolium
R= ethyl, butyl, octyl, decyl, 2-hydroxyethyl
Dicyanamide
CATIONS ANIONS
Trihexyl-tetradecyl-phosphonium
Tetrafluoro-
borate
Bis(trifluoromethylsulfonyl)imide
2-(2-methoxyethoxy)-ethylsulfate
R-benzyl-dimethyl-ammonium
R= C12H25 (dodecyl), C14H29 (tetradecyl)
(2-hydroxyethyl)-ethyl-dimethyl-ammonium
didecyl-dimethyl-ammonium
Hexafluoro-
phosphate
Ethylsulfate
Nitrate Methanesulfonate
45
3.2 - Materials and Methods
Carbon dioxide was supplied with a purity of 99.995% by Air Liquide. Squalene was supplied
by Sigma (98% by weight). Oleic Acid, supplied by Riedel-de-Haën, was of technical grade
(79.9 % by mass); other major fatty acids present included myristic acid (C14:0) at 2.0 %,
palmitoleic acid (C16:1) at 5.2 %, palmitic acid (C16:0) at 5.6 %, stearic acid (C18:0) at 1.0 %,
and linoleic acid (C18:2) at 6.4 %.
The ionic liquids 1-ethyl-3-methyl-imidazolium ethylsulfate ([EMIM][EtSO4], trade name
ECOENG 212), 1-ethyl-3-methyl-imidazolium 2-(2-methoxyethoxy)-ethylsulfate
([EMIM][MDEGSO4], trade name ECOENG 21M) and 1-ethyl-3-methyl-imidazolium
methanesulfonate ([EMIM][MSO4], trade name ECOENG 110) were purchased from Solvent
Innovation (≥ 98% purity), trihexyl-tetradecyl-phosphonium tetrafluoroborate
([(C6)3C14P][BF4]) was purchased from Fluka (purity ≥95%), 1-decyl-3-methyl-imidazolium
tetrafluoroborate ([C10MIM][BF4]), 1-octyl-3-methyl-imidazolium hexafluorophosfate
([OMIM][PF6]), 1-octyl-3-methyl-imidazolium tetrafluoroborate ([OMIM][BF4]), 1-butyl-3-
methyl-imidazolium bis(trifluoromethylsulfonyl)-imide ([BMIM][NTf2]), 1-butyl-3-methyl-
imidazolium hexafluorophosfate ([BMIM][PF6]), 1-butyl-3-methyl-imidazolium dicyanamide
([BMIM][DCA]), 1-(2-hydroxyethyl)-3-methyl-imidazolium tetrafluoroborate
([C2OHMIM][BF4]), 1-octyl-3-methyl-imidazolium dicyanamide ([OMIM][DCA]) and 1-butyl-
3-methyl-imidazolium tetrafluoroborate ([BMIM][BF4]) were purchased from Solchemar
(>98% purity). All were used as received. The ionic liquids (2-hydroxyethyl)-ethyl-dimethyl-
ammonium bis(trifluoromethylsulfonyl)-imide [C2][NTf2], didecyl-dimethyl-ammonium nitrate
and alkyl-benzyl-dimethyl-ammonium nitrate (C6H5CH2N+(CH3)2R
-NO3; R = 40% C12H25 +
60% C14H29) were synthesised according with previously published synthetic route [6].
Gas chromatography (GC) analysis was carried out as described in Chapter 2.
3.2.1 - Apparatus and Method.
Equal volumes of the model mixture oleic acid + squalene 50% (w/w) and ionic liquid were
mixed at ambient temperature, shaken and left to separate for 48 hours. After separation, the oil
and ionic liquid phases were collected separately. The relative composition of oleic acid and
squalene in the two resulting phases was determined by GC analysis. RTIL are generally
regarded as green solvents due to their non-volatile character. Yet, this makes difficult the
separation and recovery of non-volatile or thermo-sensitive products from the RTIL.
Supercritical carbon dioxide (scCO2) was used in this work to recover a representative sample
from the solutes dissolved in the ionic liquids for subsequent GC analysis. The recovery process
is based on the principle that scCO2 is soluble in RTIL, but RTIL are not soluble in scCO2 [7].
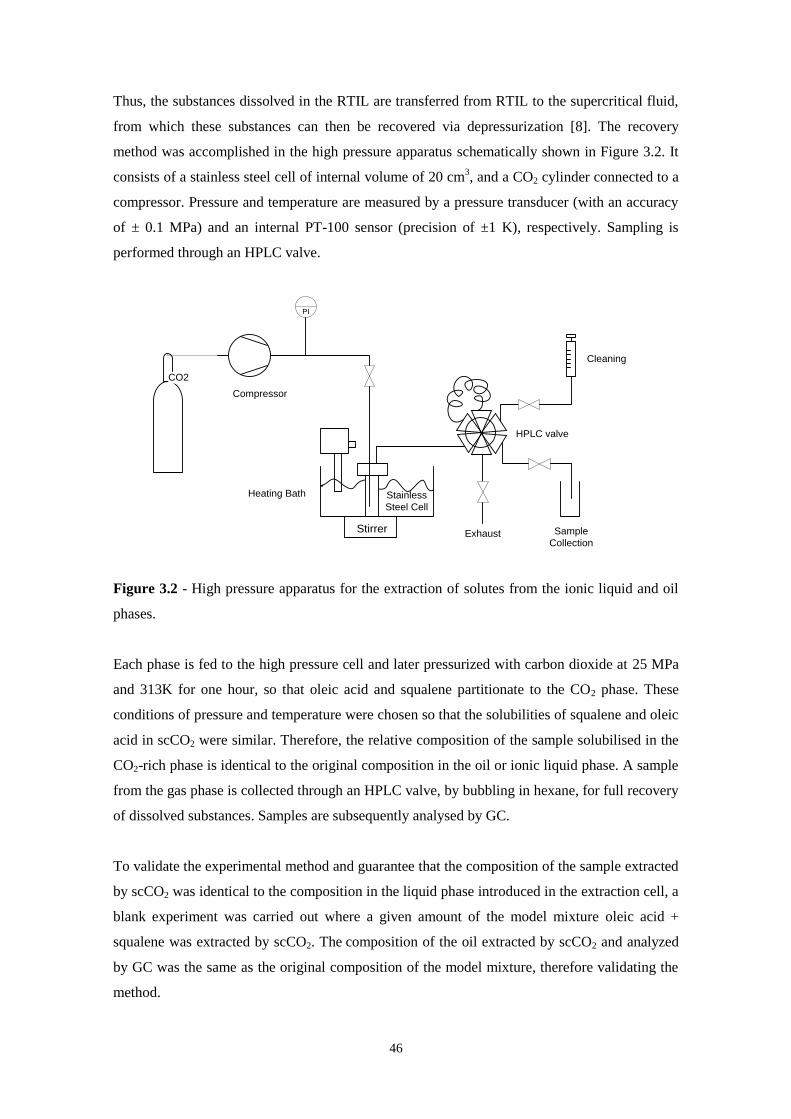
46
Thus, the substances dissolved in the RTIL are transferred from RTIL to the supercritical fluid,
from which these substances can then be recovered via depressurization [8]. The recovery
method was accomplished in the high pressure apparatus schematically shown in Figure 3.2. It
consists of a stainless steel cell of internal volume of 20 cm3, and a CO2 cylinder connected to a
compressor. Pressure and temperature are measured by a pressure transducer (with an accuracy
of ± 0.1 MPa) and an internal PT-100 sensor (precision of ±1 K), respectively. Sampling is
performed through an HPLC valve.
CO2
Compressor
PI
Stirrer Sample
CollectionExhaust
Cleaning
Heating Bath
HPLC valve
Stainless
Steel Cell
Figure 3.2 - High pressure apparatus for the extraction of solutes from the ionic liquid and oil
phases.
Each phase is fed to the high pressure cell and later pressurized with carbon dioxide at 25 MPa
and 313K for one hour, so that oleic acid and squalene partitionate to the CO2 phase. These
conditions of pressure and temperature were chosen so that the solubilities of squalene and oleic
acid in scCO2 were similar. Therefore, the relative composition of the sample solubilised in the
CO2-rich phase is identical to the original composition in the oil or ionic liquid phase. A sample
from the gas phase is collected through an HPLC valve, by bubbling in hexane, for full recovery
of dissolved substances. Samples are subsequently analysed by GC.
To validate the experimental method and guarantee that the composition of the sample extracted
by scCO2 was identical to the composition in the liquid phase introduced in the extraction cell, a
blank experiment was carried out where a given amount of the model mixture oleic acid +
squalene was extracted by scCO2. The composition of the oil extracted by scCO2 and analyzed
by GC was the same as the original composition of the model mixture, therefore validating the
method.
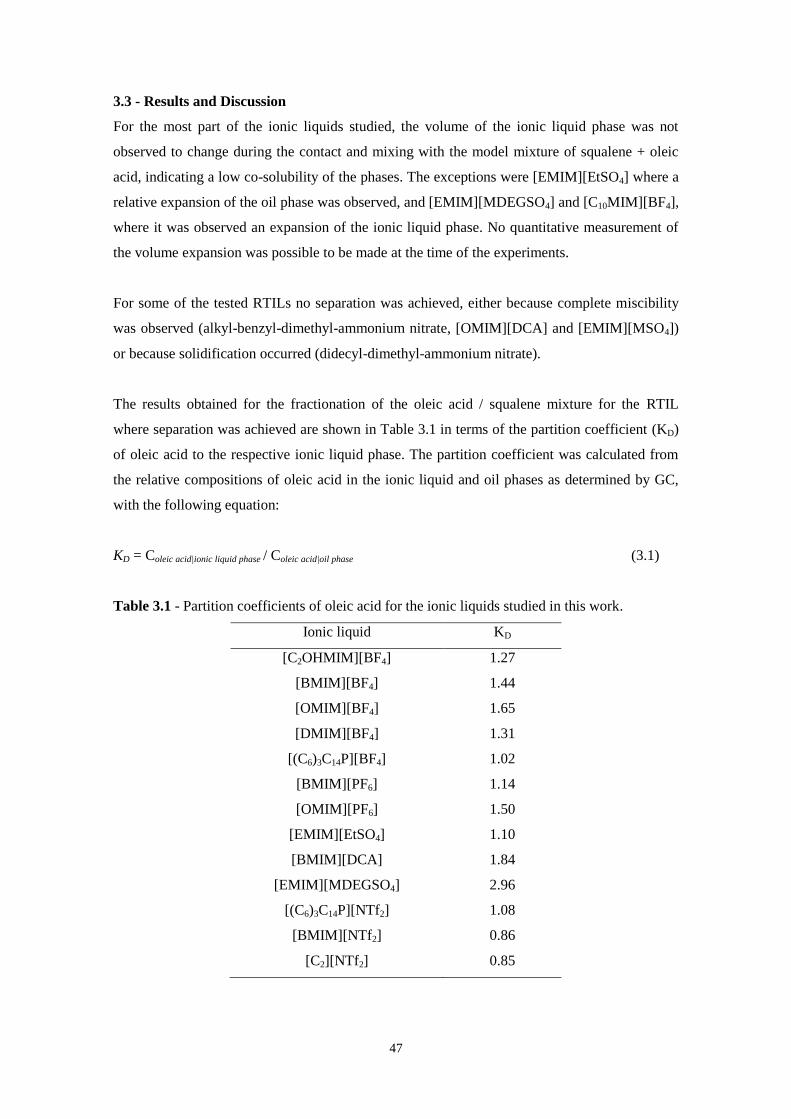
47
3.3 - Results and Discussion
For the most part of the ionic liquids studied, the volume of the ionic liquid phase was not
observed to change during the contact and mixing with the model mixture of squalene + oleic
acid, indicating a low co-solubility of the phases. The exceptions were [EMIM][EtSO4] where a
relative expansion of the oil phase was observed, and [EMIM][MDEGSO4] and [C10MIM][BF4],
where it was observed an expansion of the ionic liquid phase. No quantitative measurement of
the volume expansion was possible to be made at the time of the experiments.
For some of the tested RTILs no separation was achieved, either because complete miscibility
was observed (alkyl-benzyl-dimethyl-ammonium nitrate, [OMIM][DCA] and [EMIM][MSO4])
or because solidification occurred (didecyl-dimethyl-ammonium nitrate).
The results obtained for the fractionation of the oleic acid / squalene mixture for the RTIL
where separation was achieved are shown in Table 3.1 in terms of the partition coefficient (KD)
of oleic acid to the respective ionic liquid phase. The partition coefficient was calculated from
the relative compositions of oleic acid in the ionic liquid and oil phases as determined by GC,
with the following equation:
KD = Coleic acid|ionic liquid phase / Coleic acid|oil phase (3.1)
Table 3.1 - Partition coefficients of oleic acid for the ionic liquids studied in this work.
Ionic liquid KD
[C2OHMIM][BF4] 1.27
[BMIM][BF4] 1.44
[OMIM][BF4] 1.65
[DMIM][BF4] 1.31
[(C6)3C14P][BF4] 1.02
[BMIM][PF6] 1.14
[OMIM][PF6] 1.50
[EMIM][EtSO4] 1.10
[BMIM][DCA] 1.84
[EMIM][MDEGSO4] 2.96
[(C6)3C14P][NTf2] 1.08
[BMIM][NTf2] 0.86
[C2][NTf2] 0.85
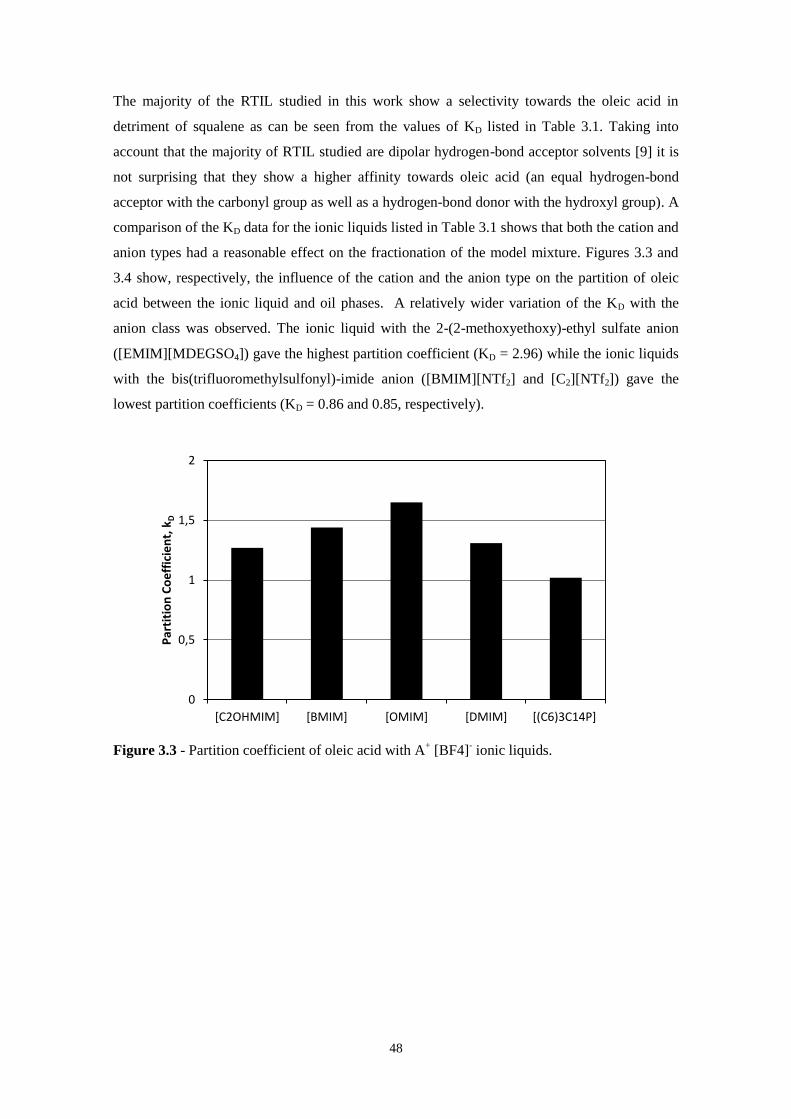
48
The majority of the RTIL studied in this work show a selectivity towards the oleic acid in
detriment of squalene as can be seen from the values of KD listed in Table 3.1. Taking into
account that the majority of RTIL studied are dipolar hydrogen-bond acceptor solvents [9] it is
not surprising that they show a higher affinity towards oleic acid (an equal hydrogen-bond
acceptor with the carbonyl group as well as a hydrogen-bond donor with the hydroxyl group). A
comparison of the KD data for the ionic liquids listed in Table 3.1 shows that both the cation and
anion types had a reasonable effect on the fractionation of the model mixture. Figures 3.3 and
3.4 show, respectively, the influence of the cation and the anion type on the partition of oleic
acid between the ionic liquid and oil phases. A relatively wider variation of the KD with the
anion class was observed. The ionic liquid with the 2-(2-methoxyethoxy)-ethyl sulfate anion
([EMIM][MDEGSO4]) gave the highest partition coefficient (KD = 2.96) while the ionic liquids
with the bis(trifluoromethylsulfonyl)-imide anion ([BMIM][NTf2] and [C2][NTf2]) gave the
lowest partition coefficients (KD = 0.86 and 0.85, respectively).
Figure 3.3 - Partition coefficient of oleic acid with A+ [BF4]
- ionic liquids.
0
0,5
1
1,5
2
[C2OHMIM] [BMIM] [OMIM] [DMIM] [(C6)3C14P]
Par
titi
on
Co
eff
icie
nt,
kD
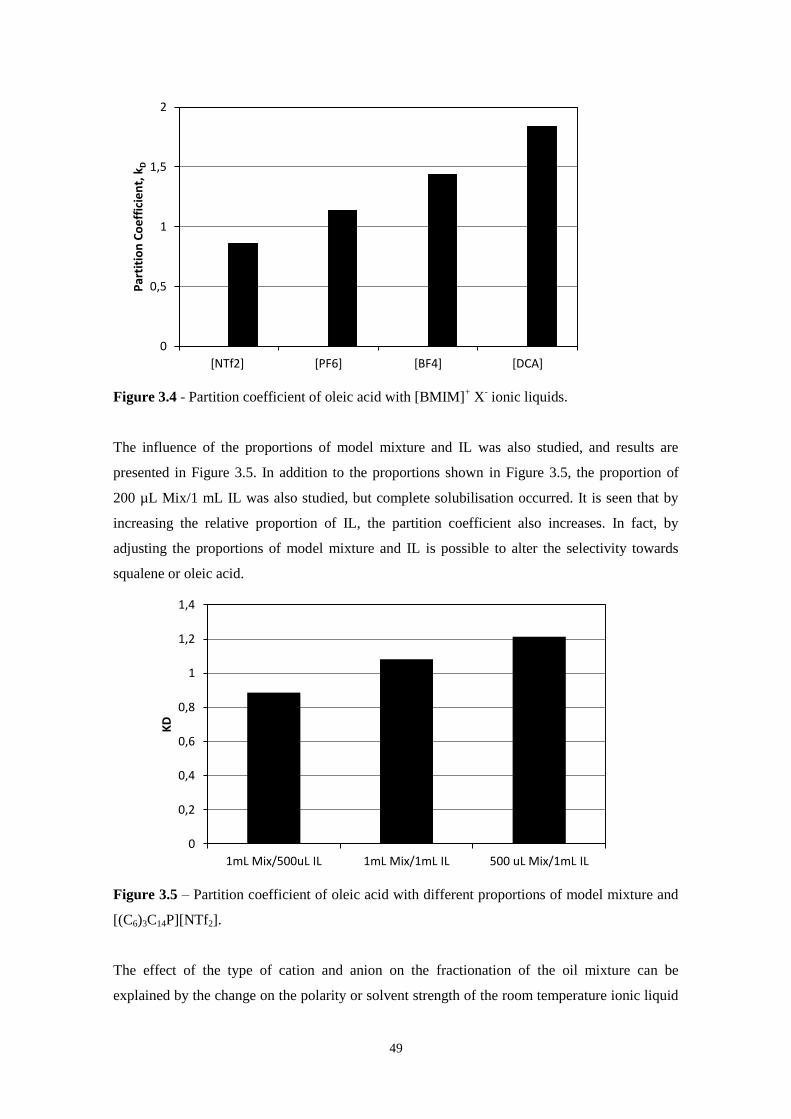
49
Figure 3.4 - Partition coefficient of oleic acid with [BMIM]+ X
- ionic liquids.
The influence of the proportions of model mixture and IL was also studied, and results are
presented in Figure 3.5. In addition to the proportions shown in Figure 3.5, the proportion of
200 µL Mix/1 mL IL was also studied, but complete solubilisation occurred. It is seen that by
increasing the relative proportion of IL, the partition coefficient also increases. In fact, by
adjusting the proportions of model mixture and IL is possible to alter the selectivity towards
squalene or oleic acid.
Figure 3.5 – Partition coefficient of oleic acid with different proportions of model mixture and
[(C6)3C14P][NTf2].
The effect of the type of cation and anion on the fractionation of the oil mixture can be
explained by the change on the polarity or solvent strength of the room temperature ionic liquid
0
0,5
1
1,5
2
[NTf2] [PF6] [BF4] [DCA]
Par
titi
on
Co
eff
icie
nt,
kD
0
0,2
0,4
0,6
0,8
1
1,2
1,4
1mL Mix/500uL IL 1mL Mix/1mL IL 500 uL Mix/1mL IL
KD
50
and thus on the affinity of the RTIL towards oleic acid or squalene. The most polar ionic liquids
show more affinity towards the oleic acid, while the least polar ones have more affinity towards
squalene.
The empirical scale of solvent polarity as suggested by Reichardt [10] was used to evaluate the
polarity of the RTIL studied in this work. Reichardt used the large negative solvatochromism of
the standard betaine dye no. 30 (2,6-diphenyl-4-(2,4,6-triphenylpyridinium-1-yl)phenolate) to
determine spectroscopically an empirical scale of solvent polarity, called the ET(30) scale. The
ET(30) values are simply defined as the molar transition energies of the betaine dye measured in
solvents of different polarity at room temperature (298 K) and normal pressure (0.1 MPa),
according to equation 3.2,
ET(30)/(kcal mol-1
) = h c max NA = (2.8591 x 10⁻³
) max/cm-1
= 28591/(λmax/nm) (3.2)
where max is the wavenumber and λmax the wavelength of the maximum of the long-wavelength,
solvatochromic, intramolecular charge-transfer absorption band of the standard betaine dye, and
h, c, and NA are the Planck’s constant, the speed of light, and Avogadro’s constant, respectively.
According to this scale, high ET(30) values correspond to high solvent polarity.
The scale can be made dimensionless, by using a normalized ETN scale. This scale ranges from
0.0 for tetramethylsilane (the least polar solvent) to 1.0 for water (the most polar solvent). ETN is
defined according to equation 3.3,
ETN = [ET(solvent) – ET(TMS)] / [ET(water) – ET(TMS)] = [ET(solvent) – 30.7] / 32.4 (3.3)
Table 3.2 presents the ETN polarity ranges for several groups of ionic liquids for which ET(30)
values were available in the literature [9], [11]-[14]. For some of the ionic liquids studied in
this work no information was available in the literature. In addition, a close inspection of Table
3.2 shows a non-negligible discrepancy of the ETN values for some ionic liquids. These
deviations are probably linked to the fact that the ETN values reported in the literature have been
determined at different temperatures and different solvatochromic indicator dyes. These effects
are further studied in Chapter 4, where a new technique to probe ionic liquids polarities is
developed.
Ionic liquids of the imidazolium type with a 1-alkyl-3-methyl- substitution pattern, [R3mim]
+X
-,
have ETN values ranging from 0.53 to 0.75. The increase of the length of one of the 1,3-alkyl
substituents causes a small decrease in the ETN values; alternation of the anion has a small
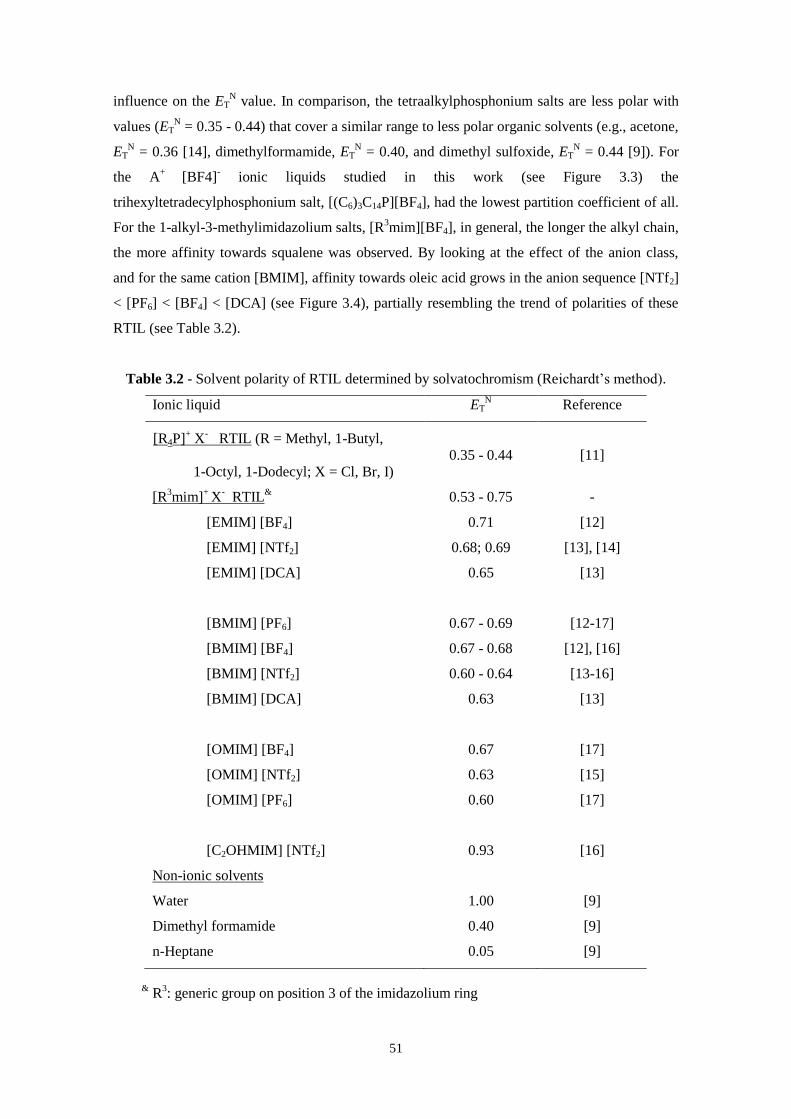
51
influence on the ETN value. In comparison, the tetraalkylphosphonium salts are less polar with
values (ETN = 0.35 - 0.44) that cover a similar range to less polar organic solvents (e.g., acetone,
ETN = 0.36 [14], dimethylformamide, ET
N = 0.40, and dimethyl sulfoxide, ET
N = 0.44 [9]). For
the A+
[BF4]- ionic liquids studied in this work (see Figure 3.3) the
trihexyltetradecylphosphonium salt, [(C6)3C14P][BF4], had the lowest partition coefficient of all.
For the 1-alkyl-3-methylimidazolium salts, [R3mim][BF4], in general, the longer the alkyl chain,
the more affinity towards squalene was observed. By looking at the effect of the anion class,
and for the same cation [BMIM], affinity towards oleic acid grows in the anion sequence [NTf2]
< [PF6] < [BF4] < [DCA] (see Figure 3.4), partially resembling the trend of polarities of these
RTIL (see Table 3.2).
Table 3.2 - Solvent polarity of RTIL determined by solvatochromism (Reichardt’s method).
Ionic liquid ETN Reference
[R4P]+ X
- RTIL (R = Methyl, 1-Butyl,
1-Octyl, 1-Dodecyl; X = Cl, Br, I) 0.35 - 0.44 [11]
[R3mim]
+ X
- RTIL
& 0.53 - 0.75 -
[EMIM] [BF4] 0.71 [12]
[EMIM] [NTf2] 0.68; 0.69 [13], [14]
[EMIM] [DCA] 0.65 [13]
[BMIM] [PF6] 0.67 - 0.69 [12-17]
[BMIM] [BF4] 0.67 - 0.68 [12], [16]
[BMIM] [NTf2] 0.60 - 0.64 [13-16]
[BMIM] [DCA] 0.63 [13]
[OMIM] [BF4] 0.67 [17]
[OMIM] [NTf2] 0.63 [15]
[OMIM] [PF6] 0.60 [17]
[C2OHMIM] [NTf2] 0.93 [16]
Non-ionic solvents
Water 1.00 [9]
Dimethyl formamide 0.40 [9]
n-Heptane 0.05 [9]
& R
3: generic group on position 3 of the imidazolium ring
52
3.4 - Conclusions
Fractionation of a mixture of oleic acid / squalene using room temperature ionic liquids as the
extracting agent has been investigated for a range of imidazolium, phosphonium and ammonium
based ionic liquids. It was shown that it is possible to adjust the fractionation of the oil mixture
by adequately choosing the type of anion and cation of the room temperature ionic liquid. This
effect could be explained by the change in the polarity or solvent strength of the RTIL. It was
also shown that by altering the proportions of ionic liquid and mixture to be extracted is possible
to further adjust the fractionation.
3.5 - References
[1] L.C. Branco, J.G. Crespo, C.A.M. Afonso, Highly selective transport of organic
compounds by using supported liquid membranes based on ionic liquids, Angew.
Chem., Int. Ed. 41 (2002) 2771-2773.
[2] E. Miyako, T. Maruyama, N. Kamiya, M. Goto, Use of ionic liquids in a lipase-
facilitated supported liquid membrane, Biotechnol. Lett. 25 (2003) 805-808.
[3] M. Matsumoto, Y. Inomoto, K. Kondo, Selective separation of aromatic hydrocarbons
through supported liquid membranes based on ionic liquids, J. Membr. Sci. 246 (2005)
77–81.
[4] A.P. Ríos, F.J. Hernández-Fernández, H. Presa, D. Gómez, G. Víllora, Tailoring
supported ionic liquid membranes for the selective separation of transesterification
reaction compounds, J. Membr. Sci. 328 (2009) 81–85.
[5] P. Scovazzo, J. Kieft, D. Finan, R.D. Noble, C.A. Koval, Gas Separations Using Non-
Hexafluorophosphate [PF6] - Anion Supported Ionic Liquid Membranes, J. Membr.
Sci, 238 (2009) 57-64.
[6] M. Earle, U. Frohlich, S. Huq, S. Katdare, R. Lukasik, E. Bogel, N. Plechkova, K.
Seddon, Base Stable Ionic Liquids, WO2006072785, 2006.
[7] L.A. Blanchard, J.F. Brennecke, Recovery of organic products from ionic liquids using
supercritical carbon dioxide, Ind. Eng. Chem. Res. 40 (2001) 287-292.
[8] S. Keskin, D. Kayrak-Talay, U. Akman, Ö. Hortaçsu, A Review of ionic liquids
towards supercritical fluid applications, J. Supercrit. Fluids, 43 (2007) 150–180.
[9] C.F. Poole, S.K. Poole, Extraction of organic compounds with room temperature ionic
liquids, J. Chromatogr. A, 1217 (2010) 2268–2286.
[10] C. Reichardt, Polarity of ionic liquids determined empirically by means of
solvatochromic pyridinium N-phenolate betaine dyes, Green Chem. 7 (2005) 339–351.
[11] W.B. Harrod, N.J. Pienta, Solvent polarity scales. 1. Determination of ET and *
values for phosphonium and ammonium melts, J. Phys. Org. Chem. 3 (1990) 534–544.
53
[12] S. Park, R.J. Kazlauskas, Improved preparation and use of room temperature ionic
liquids in lipase-catalyzed enantio- and regioselective acylations, J. Org. Chem. 66
(2001) 8395–8401.
[13] C. Chiappe, D. Pieraccini, Determination of Ionic Liquids Solvent Properties Using an
Unusual Probe: The Electron Donor−Acceptor Complex between 4,4‘-
bis(Dimethylamino)-benzophenone and Tetracyanoethene, J. Phys. Chem. A 110
(2006), 4937-4941.
[14] K.A. Fletcher, S. Pandey, Solvatochromic Probe Behavior Within Neat and Cosolvent
Added Room-Temperature Ionic Liquid Solutions, in H.C. Dulong, R.W. Bradshaw, M.
Matsunaga, G.K. Stafford, P.C. Trulove (Eds.), 2002-19-Molten Salts XIII,
Electrochemical Society, Pennsylvania, 2002, pp. 244-256.
[15] M.J. Muldoon, C.M. Gordon, I.R. Dunkin, Investigations of solvent–solute interactions
in room temperature ionic liquids using solvatochromic dyes, J. Chem. Soc., Perkin
Trans. 2 (2001) 433–435.
[16] S.V. Dzyuba, R.A. Bartsch, Expanding the polarity range of ionic liquids, Tetrahedron
Lett. 43 (2002) 4657–4659.
[17] J.G. Huddleston, G. Broker, H. Willauer, R.D. Rogers, Ionic Liquids - Industrial
Applications to Green Chemistry, ACS Symposium Series, American Chemical
Society, Washington, DC, 2002, pp. 270–288.

54
55
Chapter 4
Ionic Liquids Polarities Measurements2
2 Chapter partially accepted for publication as: Ricardo M. Couto, Catarina Lourenço, João C. Lima,
Pedro C. Simões, Luis C. Branco; Studies of the influence in acetonitrile polarity using imidazolium Ionic
Liquids as additives; Journal of Chemical and Engineering Data

56
57
4.1 - Introduction
When analyzing the results obtained for the separation of the model mixture of oleic
acid/squalene with RTILs, presented in Chapter 3, it was realized that the separations being
observed were related to the polarity of the RTILs. However, very few of the RTILs studied had
their polarity already published in the literature. As a way of rationalizing the results obtained, it
was decided to explore not only the polarity of the RTILs used in this work but also of a few
others available in the laboratory.
The polarity or strength of a solvent is a well-accepted concept but suffers from a rather vague
definition. Reichardt [1] proposed a practical definition of the solvent polarity (later accepted by
IUPAC [2]) as the “overall solvation capability (or solvation power) for (i) educts and products,
which influences chemical equilibria; (ii) reactants and activated complexes (‘‘transition
states’’), which determines reaction rates; and (iii) ions or molecules in their ground and first
excited state, which is responsible for light absorptions in the various wavelength regions. This
overall solvation capability depends on the action of all, nonspecific and specific, intermolecular
solute–solvent interactions, excluding such interactions leading to definite chemical alterations
of the ions or molecules of the solute”.
These interactions involve several distinct and different intermolecular forces with the
consequence that no single probe molecule or macroscopic physical parameter is capable of
providing a suitable scale of solvent polarity.
A considerable amount of ionic liquids (ILs) polarities measurements have been reported
already [3]. Different probes have been explored, such as Nile Red [4]-[6], pyrene [6],
dansylamide [6], 1-pyrenecarbaldehyde [6], Michler’s ketone [7], DAP
[8],
[Cu(acac)(tmen)][BPh4] [9], [Cu(acac)(tmen)][X] (X=BPh4 or ClO4) [10], and Coumarin-153
[11]. The measurement techniques employed have been mainly UV/Vis spectroscopy [4], [7],
[9], [10] or
fluorescence spectrometry [5], [6], [8], [11]. Despite of several polarity studies
already reported using different probes, the largest number of approaches have undoubtedly
been done based on solvatochromism of betaine dye nº. 30 (commonly known as Reichardt’s
dye) studied by UV/Vis spectroscopy [3], [6], [9], [10], [12]-[15].
Rani and coworkers [16] have shown that when comparing solvatochromic polarity values, it is
important to always compare values from the same solvatochromic dye in order to avoid
deviations due to the different interactions of different probes with the solvents being used. For
that reason, we have chosen to work with betaine dye nº. 30, in order to have the widest range of
data already published to compare with our results.
58
Reichardt [1] used the large negative solvatochromism of the standard betaine dye no. 30 as a
UV/Vis spectroscopic indicator of solvent polarity. The long-wavelength intramolecular charge-
transfer (CT) absorption band of betaine dye nº. 30 was used as a solvent-dependent reference
process to define empirically a solvent polarity scale, called the ET(30) scale. ET(30) values are
simply defined as the molar transition energies of the betaine dye measured in solvents of
different polarities at room temperature (298 K) and normal pressure (0.1 MPa), according to
equation 4.1,
ET(30)/(kcal mol-1
) = h c max NA = (2.8591 x 10⁻³
) max/cm-1
= 28591/(λmax/nm) (4.1)
where max is the wavenumber and λmax is the maximum wavelength and h, c, and NA are the
Planck’s constant, the speed of light, and Avogadro’s constant, respectively. According to this
scale, high ET(30) values correspond to high solvent polarity.
The scale can be made dimensionless, by using a normalized ETN scale. This scale ranges from
0.0 for tetramethylsilane (the least polar solvent for which ET(30) values are experimentally
available) to 1.0 for water (the most polar solvent). ETN is defined according to equation 4.2,
ETN = [ET(solvent) – ET(TMS)] / [ET(water) – ET(TMS)] = [ET(solvent) – 30.7] / 32.4 (4.2)
Despite of this simple procedure widely described in several papers [3], [6], [9], [10], [12]-[15],
soon it was realized that most RTILs used in this work present difficulties in the dissolution of
Reichardt’s dye. Either the dye would not dissolve in the RTIL or it would be needed to add a
large amount of the dye for the RTIL to acquire a measurable band in the region of the visible
spectrum. In order to overcome this problem, it was needed to find an alternative solution. Thus,
it was decided to probe the RTILs polarities by an indirect method. Instead of measuring the
polarity of the RTIL, it was measured the change in polarity induced by the addition of small
quantities of RTIL to common organic solvents of well known polarity.
Although many authors have explored the polarity of RTILs, little work has been done to
explore the RTILs effect in the polarity of other organic solvents. Baker and co-workers [15]
have explored the influence of water content and temperature in RTILs polarities, and found
that the presence of small quantities of water increases the polarity of the RTIL. Rani and co-
workers have also studied the deviation in polarity caused by the presence of common
impurities [16]. The reverse effect of the one studied in this chapter, i.e., the influence of the
addition of small quantities of solvents to ILs has been investigated [17]. Recently, some
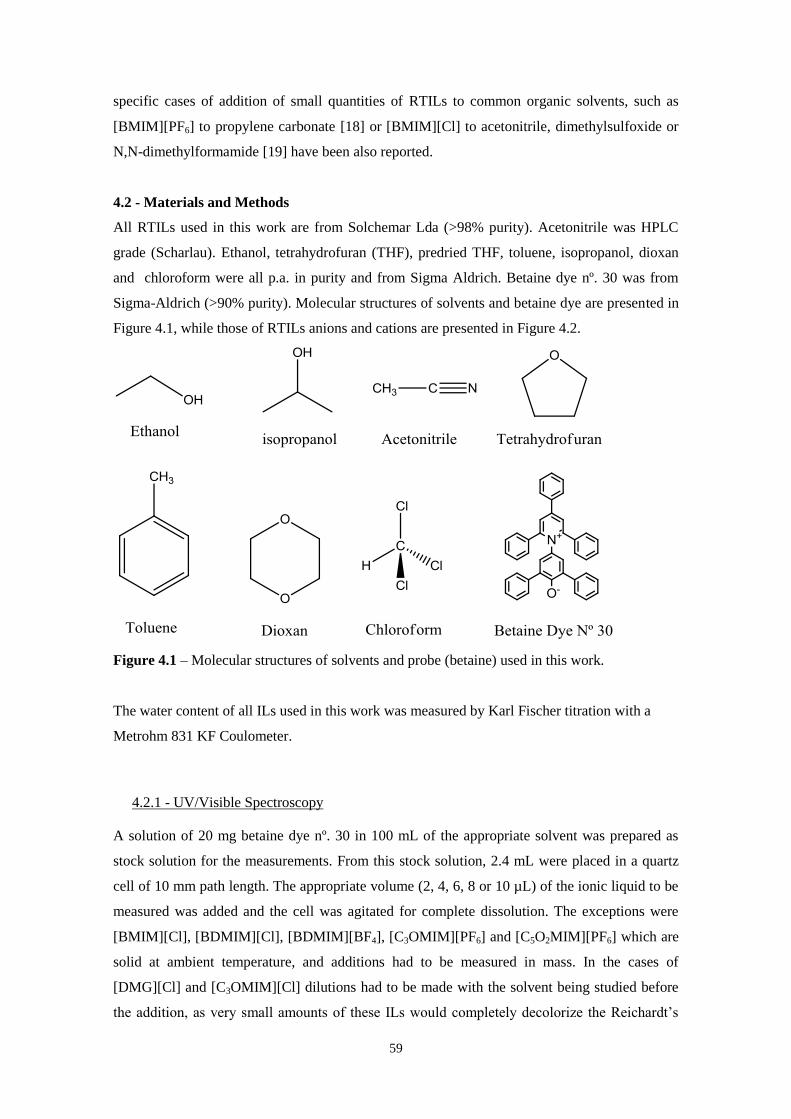
59
specific cases of addition of small quantities of RTILs to common organic solvents, such as
[BMIM][PF6] to propylene carbonate [18] or [BMIM][Cl] to acetonitrile, dimethylsulfoxide or
N,N-dimethylformamide [19] have been also reported.
4.2 - Materials and Methods
All RTILs used in this work are from Solchemar Lda (>98% purity). Acetonitrile was HPLC
grade (Scharlau). Ethanol, tetrahydrofuran (THF), predried THF, toluene, isopropanol, dioxan
and chloroform were all p.a. in purity and from Sigma Aldrich. Betaine dye nº. 30 was from
Sigma-Aldrich (>90% purity). Molecular structures of solvents and betaine dye are presented in
Figure 4.1, while those of RTILs anions and cations are presented in Figure 4.2.
Figure 4.1 – Molecular structures of solvents and probe (betaine) used in this work.
The water content of all ILs used in this work was measured by Karl Fischer titration with a
Metrohm 831 KF Coulometer.
4.2.1 - UV/Visible Spectroscopy
A solution of 20 mg betaine dye nº. 30 in 100 mL of the appropriate solvent was prepared as
stock solution for the measurements. From this stock solution, 2.4 mL were placed in a quartz
cell of 10 mm path length. The appropriate volume (2, 4, 6, 8 or 10 µL) of the ionic liquid to be
measured was added and the cell was agitated for complete dissolution. The exceptions were
[BMIM][Cl], [BDMIM][Cl], [BDMIM][BF4], [C3OMIM][PF6] and [C5O2MIM][PF6] which are
solid at ambient temperature, and additions had to be measured in mass. In the cases of
[DMG][Cl] and [C3OMIM][Cl] dilutions had to be made with the solvent being studied before
the addition, as very small amounts of these ILs would completely decolorize the Reichardt’s
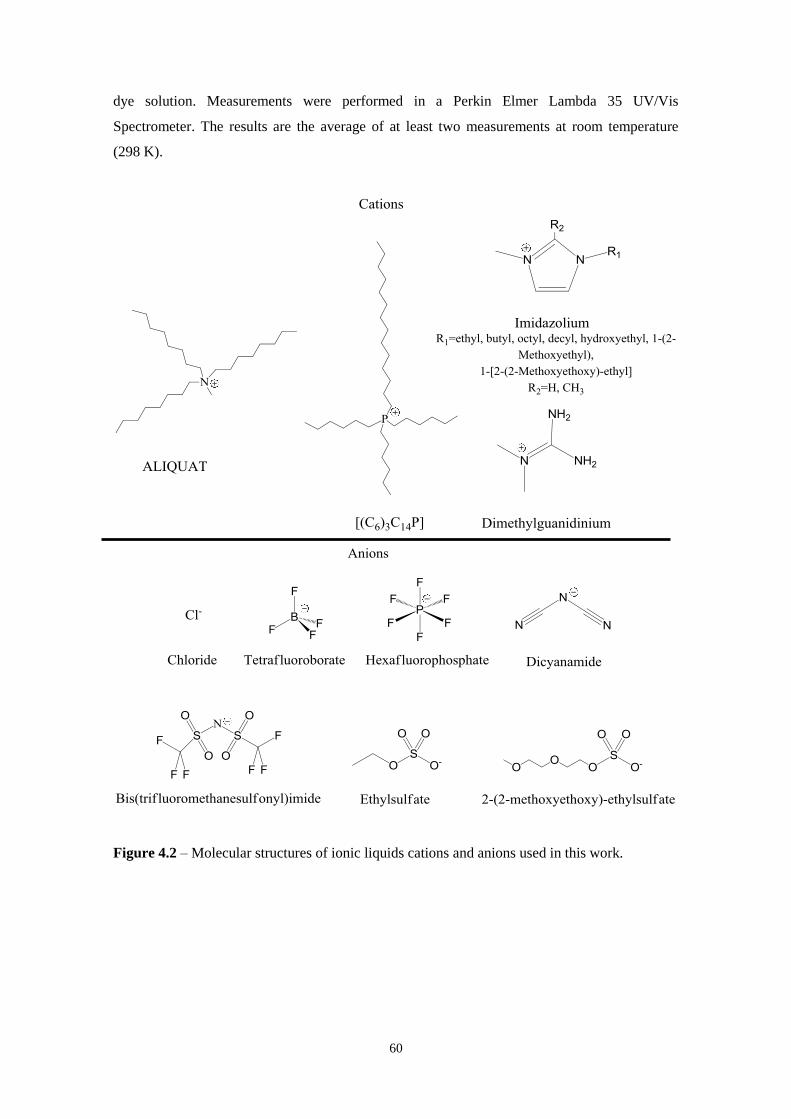
60
dye solution. Measurements were performed in a Perkin Elmer Lambda 35 UV/Vis
Spectrometer. The results are the average of at least two measurements at room temperature
(298 K).
Figure 4.2 – Molecular structures of ionic liquids cations and anions used in this work.
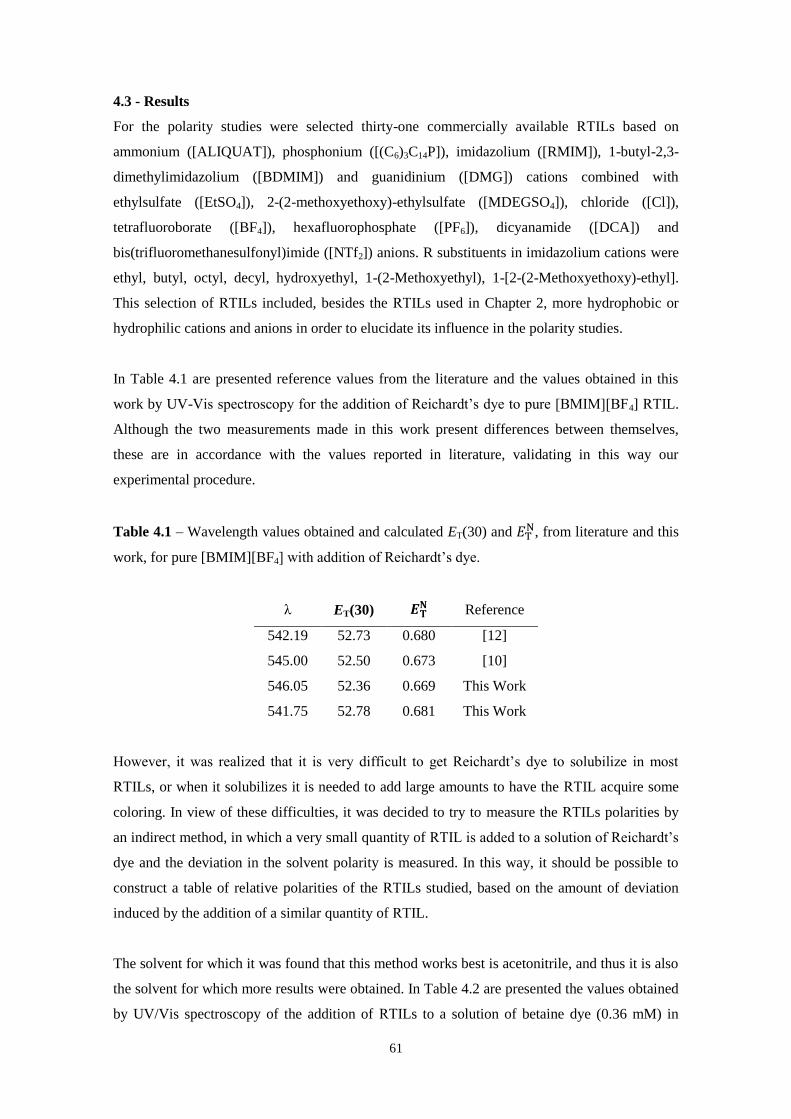
61
4.3 - Results
For the polarity studies were selected thirty-one commercially available RTILs based on
ammonium ([ALIQUAT]), phosphonium ([(C6)3C14P]), imidazolium ([RMIM]), 1-butyl-2,3-
dimethylimidazolium ([BDMIM]) and guanidinium ([DMG]) cations combined with
ethylsulfate ([EtSO4]), 2-(2-methoxyethoxy)-ethylsulfate ([MDEGSO4]), chloride ([Cl]),
tetrafluoroborate ([BF4]), hexafluorophosphate ([PF6]), dicyanamide ([DCA]) and
bis(trifluoromethanesulfonyl)imide ([NTf2]) anions. R substituents in imidazolium cations were
ethyl, butyl, octyl, decyl, hydroxyethyl, 1-(2-Methoxyethyl), 1-[2-(2-Methoxyethoxy)-ethyl].
This selection of RTILs included, besides the RTILs used in Chapter 2, more hydrophobic or
hydrophilic cations and anions in order to elucidate its influence in the polarity studies.
In Table 4.1 are presented reference values from the literature and the values obtained in this
work by UV-Vis spectroscopy for the addition of Reichardt’s dye to pure [BMIM][BF4] RTIL.
Although the two measurements made in this work present differences between themselves,
these are in accordance with the values reported in literature, validating in this way our
experimental procedure.
Table 4.1 – Wavelength values obtained and calculated ET(30) and , from literature and this
work, for pure [BMIM][BF4] with addition of Reichardt’s dye.
λ ET(30) Reference
542.19 52.73 0.680 [12]
545.00 52.50 0.673 [10]
546.05 52.36 0.669 This Work
541.75 52.78 0.681 This Work
However, it was realized that it is very difficult to get Reichardt’s dye to solubilize in most
RTILs, or when it solubilizes it is needed to add large amounts to have the RTIL acquire some
coloring. In view of these difficulties, it was decided to try to measure the RTILs polarities by
an indirect method, in which a very small quantity of RTIL is added to a solution of Reichardt’s
dye and the deviation in the solvent polarity is measured. In this way, it should be possible to
construct a table of relative polarities of the RTILs studied, based on the amount of deviation
induced by the addition of a similar quantity of RTIL.
The solvent for which it was found that this method works best is acetonitrile, and thus it is also
the solvent for which more results were obtained. In Table 4.2 are presented the values obtained
by UV/Vis spectroscopy of the addition of RTILs to a solution of betaine dye (0.36 mM) in
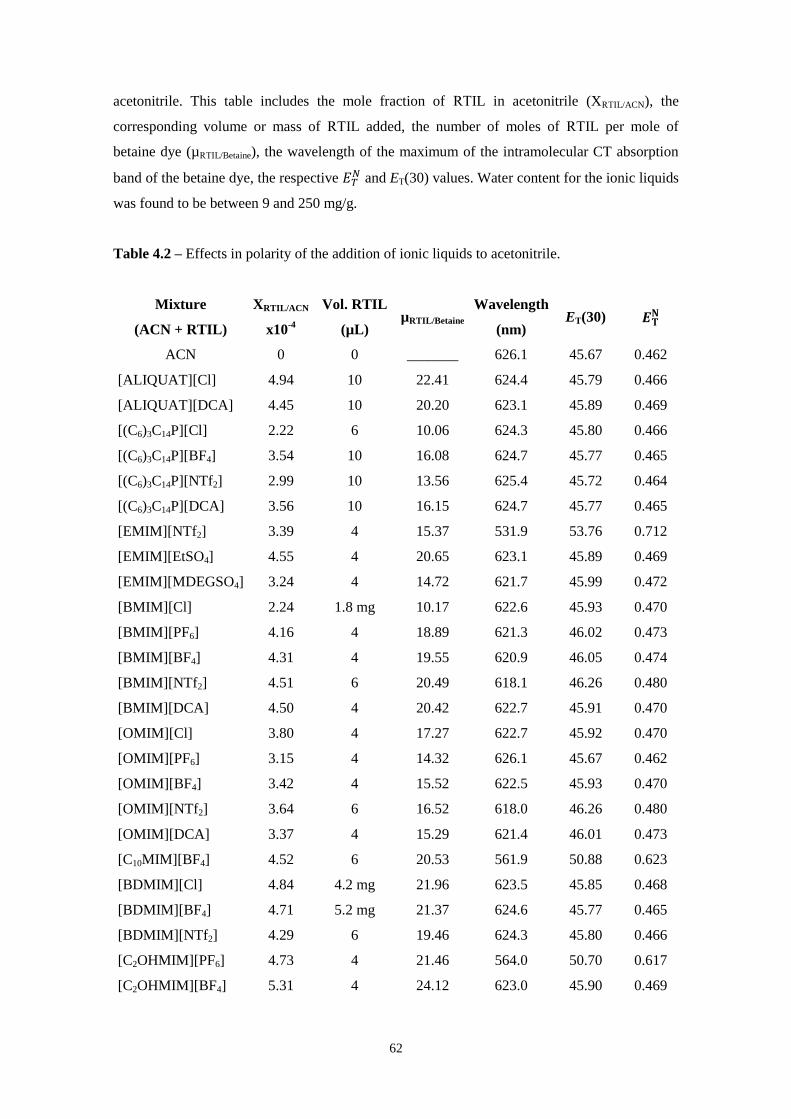
62
acetonitrile. This table includes the mole fraction of RTIL in acetonitrile (XRTIL/ACN), the
corresponding volume or mass of RTIL added, the number of moles of RTIL per mole of
betaine dye (µRTIL/Betaine), the wavelength of the maximum of the intramolecular CT absorption
band of the betaine dye, the respective and ET(30) values. Water content for the ionic liquids
was found to be between 9 and 250 mg/g.
Table 4.2 – Effects in polarity of the addition of ionic liquids to acetonitrile.
Mixture
(ACN + RTIL)
XRTIL/ACN
x10-4
Vol. RTIL
(µL) µRTIL/Betaine
Wavelength
(nm) ET(30)
ACN 0 0 _______ 626.1 45.67 0.462
[ALIQUAT][Cl] 4.94 10 22.41 624.4 45.79 0.466
[ALIQUAT][DCA] 4.45 10 20.20 623.1 45.89 0.469
[(C6)3C14P][Cl] 2.22 6 10.06 624.3 45.80 0.466
[(C6)3C14P][BF4] 3.54 10 16.08 624.7 45.77 0.465
[(C6)3C14P][NTf2] 2.99 10 13.56 625.4 45.72 0.464
[(C6)3C14P][DCA] 3.56 10 16.15 624.7 45.77 0.465
[EMIM][NTf2] 3.39 4 15.37 531.9 53.76 0.712
[EMIM][EtSO4] 4.55 4 20.65 623.1 45.89 0.469
[EMIM][MDEGSO4] 3.24 4 14.72 621.7 45.99 0.472
[BMIM][Cl] 2.24 1.8 mg 10.17 622.6 45.93 0.470
[BMIM][PF6] 4.16 4 18.89 621.3 46.02 0.473
[BMIM][BF4] 4.31 4 19.55 620.9 46.05 0.474
[BMIM][NTf2] 4.51 6 20.49 618.1 46.26 0.480
[BMIM][DCA] 4.50 4 20.42 622.7 45.91 0.470
[OMIM][Cl] 3.80 4 17.27 622.7 45.92 0.470
[OMIM][PF6] 3.15 4 14.32 626.1 45.67 0.462
[OMIM][BF4] 3.42 4 15.52 622.5 45.93 0.470
[OMIM][NTf2] 3.64 6 16.52 618.0 46.26 0.480
[OMIM][DCA] 3.37 4 15.29 621.4 46.01 0.473
[C10MIM][BF4] 4.52 6 20.53 561.9 50.88 0.623
[BDMIM][Cl] 4.84 4.2 mg 21.96 623.5 45.85 0.468
[BDMIM][BF4] 4.71 5.2 mg 21.37 624.6 45.77 0.465
[BDMIM][NTf2] 4.29 6 19.46 624.3 45.80 0.466
[C2OHMIM][PF6] 4.73 4 21.46 564.0 50.70 0.617
[C2OHMIM][BF4] 5.31 4 24.12 623.0 45.90 0.469
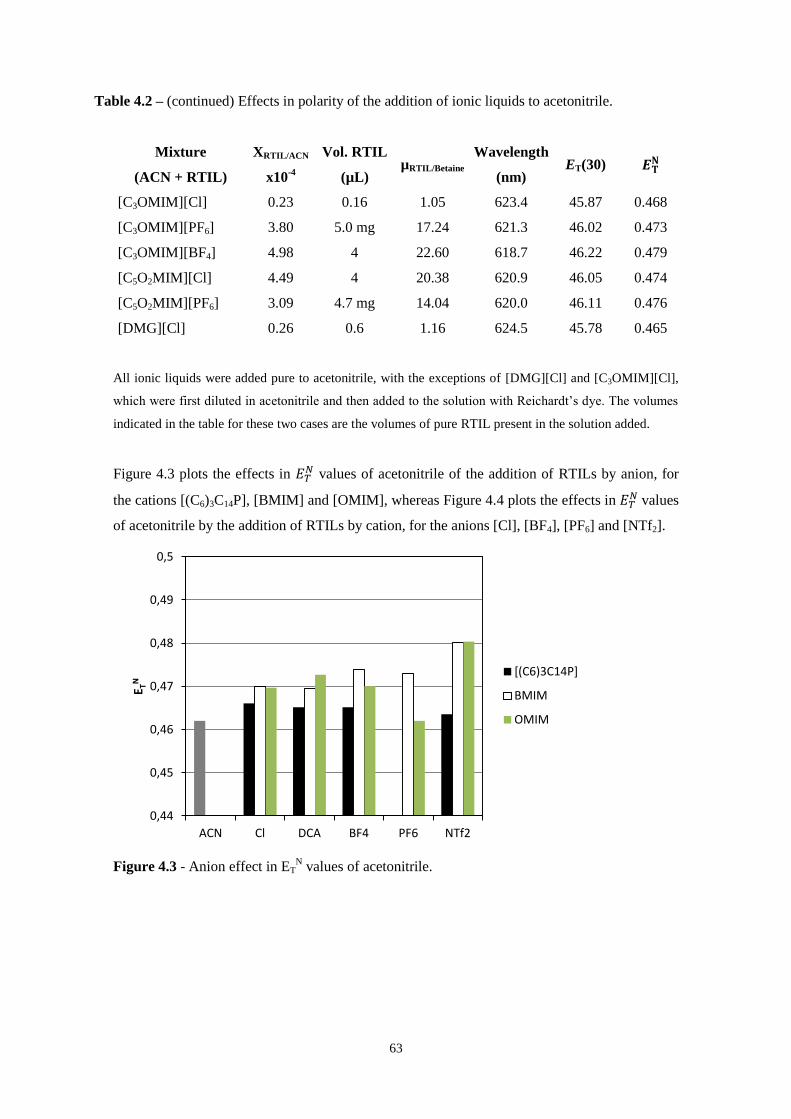
63
Table 4.2 – (continued) Effects in polarity of the addition of ionic liquids to acetonitrile.
Mixture
(ACN + RTIL)
XRTIL/ACN
x10-4
Vol. RTIL
(µL) µRTIL/Betaine
Wavelength
(nm) ET(30)
[C3OMIM][Cl] 0.23 0.16 1.05 623.4 45.87 0.468
[C3OMIM][PF6] 3.80 5.0 mg 17.24 621.3 46.02 0.473
[C3OMIM][BF4] 4.98 4 22.60 618.7 46.22 0.479
[C5O2MIM][Cl] 4.49 4 20.38 620.9 46.05 0.474
[C5O2MIM][PF6] 3.09 4.7 mg 14.04 620.0 46.11 0.476
[DMG][Cl] 0.26 0.6 1.16 624.5 45.78 0.465
All ionic liquids were added pure to acetonitrile, with the exceptions of [DMG][Cl] and [C3OMIM][Cl],
which were first diluted in acetonitrile and then added to the solution with Reichardt’s dye. The volumes
indicated in the table for these two cases are the volumes of pure RTIL present in the solution added.
Figure 4.3 plots the effects in values of acetonitrile of the addition of RTILs by anion, for
the cations [(C6)3C14P], [BMIM] and [OMIM], whereas Figure 4.4 plots the effects in values
of acetonitrile by the addition of RTILs by cation, for the anions [Cl], [BF4], [PF6] and [NTf2].
Figure 4.3 - Anion effect in ETN values of acetonitrile.
0,44
0,45
0,46
0,47
0,48
0,49
0,5
ACN Cl DCA BF4 PF6 NTf2
E TN
[(C6)3C14P]
BMIM
OMIM
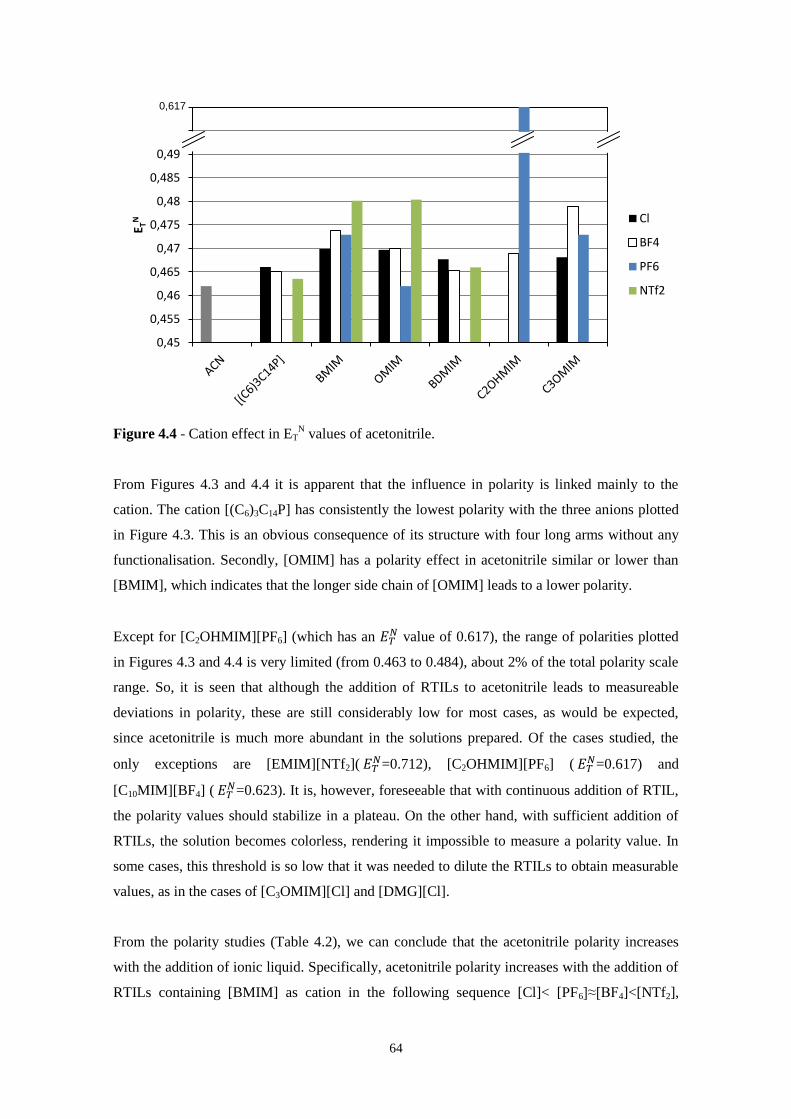
64
Figure 4.4 - Cation effect in ETN values of acetonitrile.
From Figures 4.3 and 4.4 it is apparent that the influence in polarity is linked mainly to the
cation. The cation [(C6)3C14P] has consistently the lowest polarity with the three anions plotted
in Figure 4.3. This is an obvious consequence of its structure with four long arms without any
functionalisation. Secondly, [OMIM] has a polarity effect in acetonitrile similar or lower than
[BMIM], which indicates that the longer side chain of [OMIM] leads to a lower polarity.
Except for [C2OHMIM][PF6] (which has an value of 0.617), the range of polarities plotted
in Figures 4.3 and 4.4 is very limited (from 0.463 to 0.484), about 2% of the total polarity scale
range. So, it is seen that although the addition of RTILs to acetonitrile leads to measureable
deviations in polarity, these are still considerably low for most cases, as would be expected,
since acetonitrile is much more abundant in the solutions prepared. Of the cases studied, the
only exceptions are [EMIM][NTf2]( =0.712), [C2OHMIM][PF6] (
=0.617) and
[C10MIM][BF4] ( =0.623). It is, however, foreseeable that with continuous addition of RTIL,
the polarity values should stabilize in a plateau. On the other hand, with sufficient addition of
RTILs, the solution becomes colorless, rendering it impossible to measure a polarity value. In
some cases, this threshold is so low that it was needed to dilute the RTILs to obtain measurable
values, as in the cases of [C3OMIM][Cl] and [DMG][Cl].
From the polarity studies (Table 4.2), we can conclude that the acetonitrile polarity increases
with the addition of ionic liquid. Specifically, acetonitrile polarity increases with the addition of
RTILs containing [BMIM] as cation in the following sequence [Cl]< [PF6]≈[BF4]<[NTf2],
0,45
0,455
0,46
0,465
0,47
0,475
0,48
0,485
0,49
0,495
0,5
E TN
Cl
BF4
PF6
NTf2
0,617
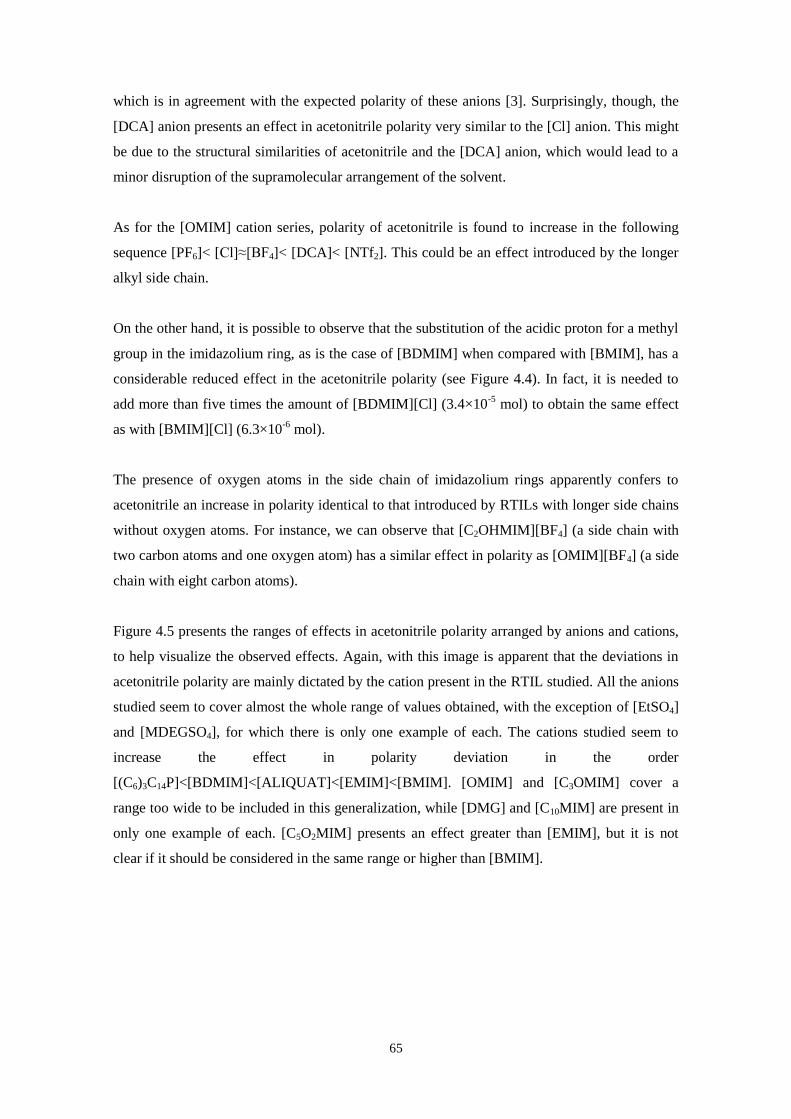
65
which is in agreement with the expected polarity of these anions [3]. Surprisingly, though, the
[DCA] anion presents an effect in acetonitrile polarity very similar to the [Cl] anion. This might
be due to the structural similarities of acetonitrile and the [DCA] anion, which would lead to a
minor disruption of the supramolecular arrangement of the solvent.
As for the [OMIM] cation series, polarity of acetonitrile is found to increase in the following
sequence [PF6]< [Cl]≈[BF4]< [DCA]< [NTf2]. This could be an effect introduced by the longer
alkyl side chain.
On the other hand, it is possible to observe that the substitution of the acidic proton for a methyl
group in the imidazolium ring, as is the case of [BDMIM] when compared with [BMIM], has a
considerable reduced effect in the acetonitrile polarity (see Figure 4.4). In fact, it is needed to
add more than five times the amount of [BDMIM][Cl] (3.4×10⁻⁵
mol) to obtain the same effect
as with [BMIM][Cl] (6.3×10⁻⁶
mol).
The presence of oxygen atoms in the side chain of imidazolium rings apparently confers to
acetonitrile an increase in polarity identical to that introduced by RTILs with longer side chains
without oxygen atoms. For instance, we can observe that [C2OHMIM][BF4] (a side chain with
two carbon atoms and one oxygen atom) has a similar effect in polarity as [OMIM][BF4] (a side
chain with eight carbon atoms).
Figure 4.5 presents the ranges of effects in acetonitrile polarity arranged by anions and cations,
to help visualize the observed effects. Again, with this image is apparent that the deviations in
acetonitrile polarity are mainly dictated by the cation present in the RTIL studied. All the anions
studied seem to cover almost the whole range of values obtained, with the exception of [EtSO4]
and [MDEGSO4], for which there is only one example of each. The cations studied seem to
increase the effect in polarity deviation in the order
[(C6)3C14P]<[BDMIM]<[ALIQUAT]<[EMIM]<[BMIM]. [OMIM] and [C3OMIM] cover a
range too wide to be included in this generalization, while [DMG] and [C10MIM] are present in
only one example of each. [C5O2MIM] presents an effect greater than [EMIM], but it is not
clear if it should be considered in the same range or higher than [BMIM].
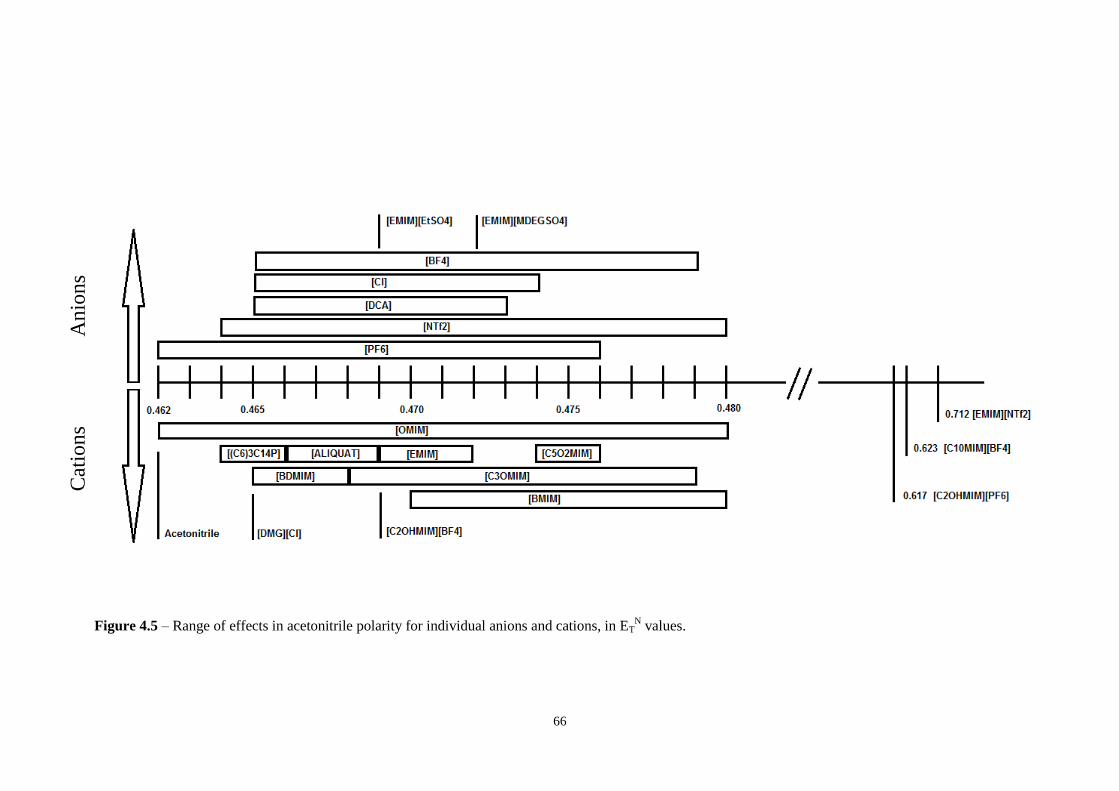
66
Figure 4.5 – Range of effects in acetonitrile polarity for individual anions and cations, in ETN values.
An
ion
s C
atio
ns
67
Figure 4.6 plots the effect in ETN values of the continuous addition of RTILs to acetonitrile. This
plot shows that the increment in acetonitrile polarity is linearly dependent with the addition of
RTIL based on [BF4] anion. The same trend was observed for all RTILs tested.
Figure 4.6 – Effect in ETN values of acetonitrile by the continuous addition of ionic liquid to
acetonitrile.
In Table 4.3 are presented the values obtained by UV/Vis spectroscopy of the addition of RTILs to
a solution of betaine dye (0.36 mM) in ethanol. This table includes the mole fraction of RTIL in
ethanol (XRTIL/EtOH), the corresponding volume of RTIL added, the number of moles of RTIL per
mole of betaine dye (µRTIL/Betaine), the wavelength of the maximum of the intramolecular CT
absorption band of the betaine dye, the respective and ET(30) values.
0,46
0,47
0,47
0,48
0,48
0,49
0,49
0 2 4 6 8 10 12
ETN
XRTIL/ACN x10-4
[BMIM][BF4]
[OMIM][BF4]
[C3OMIM][BF4]
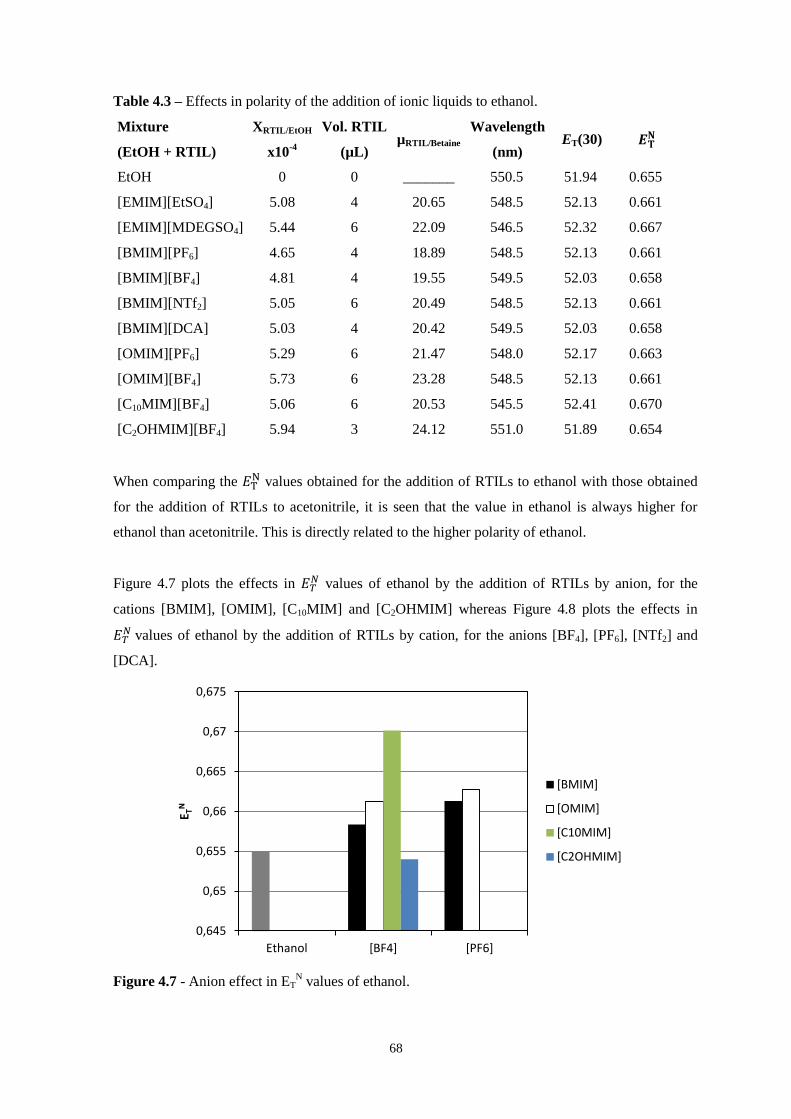
68
Table 4.3 – Effects in polarity of the addition of ionic liquids to ethanol.
Mixture
(EtOH + RTIL)
XRTIL/EtOH
x10-4
Vol. RTIL
(µL) µRTIL/Betaine
Wavelength
(nm) ET(30)
EtOH 0 0 _______ 550.5 51.94 0.655
[EMIM][EtSO4] 5.08 4 20.65 548.5 52.13 0.661
[EMIM][MDEGSO4] 5.44 6 22.09 546.5 52.32 0.667
[BMIM][PF6] 4.65 4 18.89 548.5 52.13 0.661
[BMIM][BF4] 4.81 4 19.55 549.5 52.03 0.658
[BMIM][NTf2] 5.05 6 20.49 548.5 52.13 0.661
[BMIM][DCA] 5.03 4 20.42 549.5 52.03 0.658
[OMIM][PF6] 5.29 6 21.47 548.0 52.17 0.663
[OMIM][BF4] 5.73 6 23.28 548.5 52.13 0.661
[C10MIM][BF4] 5.06 6 20.53 545.5 52.41 0.670
[C2OHMIM][BF4] 5.94 3 24.12 551.0 51.89 0.654
When comparing the values obtained for the addition of RTILs to ethanol with those obtained
for the addition of RTILs to acetonitrile, it is seen that the value in ethanol is always higher for
ethanol than acetonitrile. This is directly related to the higher polarity of ethanol.
Figure 4.7 plots the effects in values of ethanol by the addition of RTILs by anion, for the
cations [BMIM], [OMIM], [C10MIM] and [C2OHMIM] whereas Figure 4.8 plots the effects in
values of ethanol by the addition of RTILs by cation, for the anions [BF4], [PF6], [NTf2] and
[DCA].
Figure 4.7 - Anion effect in ETN values of ethanol.
0,645
0,65
0,655
0,66
0,665
0,67
0,675
Ethanol [BF4] [PF6]
E TN
[BMIM]
[OMIM]
[C10MIM]
[C2OHMIM]
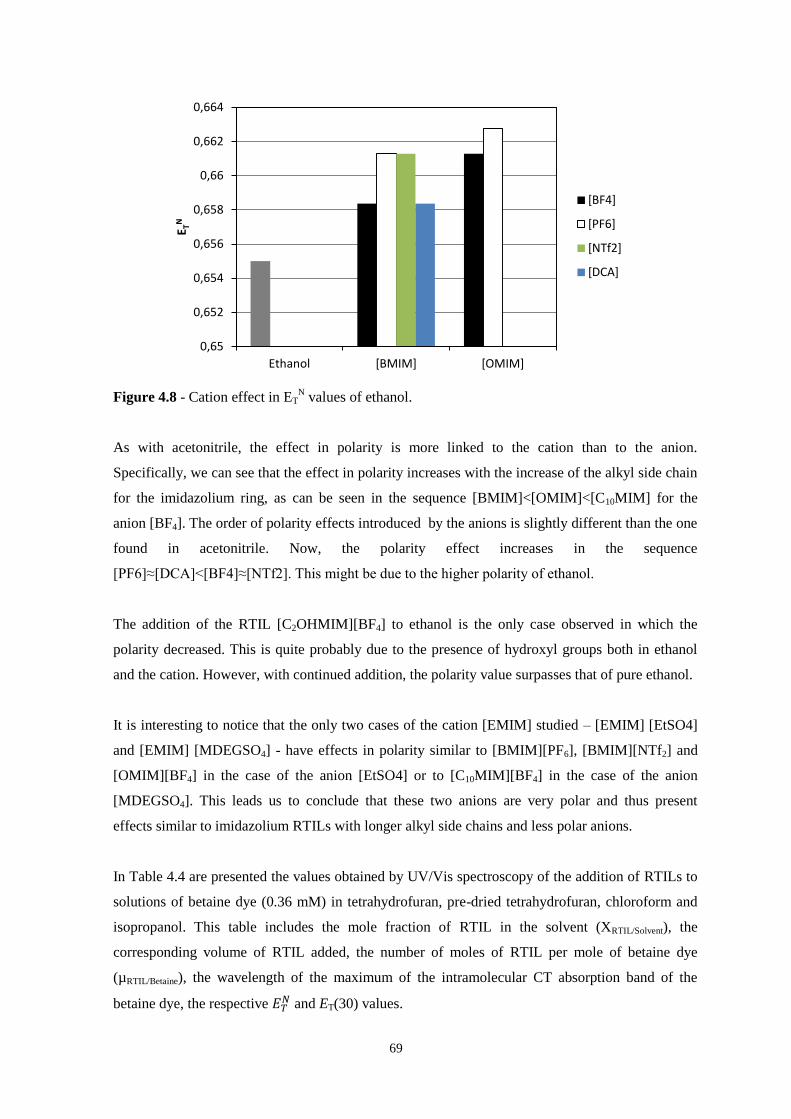
69
Figure 4.8 - Cation effect in ETN values of ethanol.
As with acetonitrile, the effect in polarity is more linked to the cation than to the anion.
Specifically, we can see that the effect in polarity increases with the increase of the alkyl side chain
for the imidazolium ring, as can be seen in the sequence [BMIM]<[OMIM]<[C10MIM] for the
anion [BF4]. The order of polarity effects introduced by the anions is slightly different than the one
found in acetonitrile. Now, the polarity effect increases in the sequence
[PF6]≈[DCA]<[BF4]≈[NTf2]. This might be due to the higher polarity of ethanol.
The addition of the RTIL [C2OHMIM][BF4] to ethanol is the only case observed in which the
polarity decreased. This is quite probably due to the presence of hydroxyl groups both in ethanol
and the cation. However, with continued addition, the polarity value surpasses that of pure ethanol.
It is interesting to notice that the only two cases of the cation [EMIM] studied – [EMIM] [EtSO4]
and [EMIM] [MDEGSO4] - have effects in polarity similar to [BMIM][PF6], [BMIM][NTf2] and
[OMIM][BF4] in the case of the anion [EtSO4] or to [C10MIM][BF4] in the case of the anion
[MDEGSO4]. This leads us to conclude that these two anions are very polar and thus present
effects similar to imidazolium RTILs with longer alkyl side chains and less polar anions.
In Table 4.4 are presented the values obtained by UV/Vis spectroscopy of the addition of RTILs to
solutions of betaine dye (0.36 mM) in tetrahydrofuran, pre-dried tetrahydrofuran, chloroform and
isopropanol. This table includes the mole fraction of RTIL in the solvent (XRTIL/Solvent), the
corresponding volume of RTIL added, the number of moles of RTIL per mole of betaine dye
(µRTIL/Betaine), the wavelength of the maximum of the intramolecular CT absorption band of the
betaine dye, the respective and ET(30) values.
0,65
0,652
0,654
0,656
0,658
0,66
0,662
0,664
Ethanol [BMIM] [OMIM]
E TN
[BF4]
[PF6]
[NTf2]
[DCA]
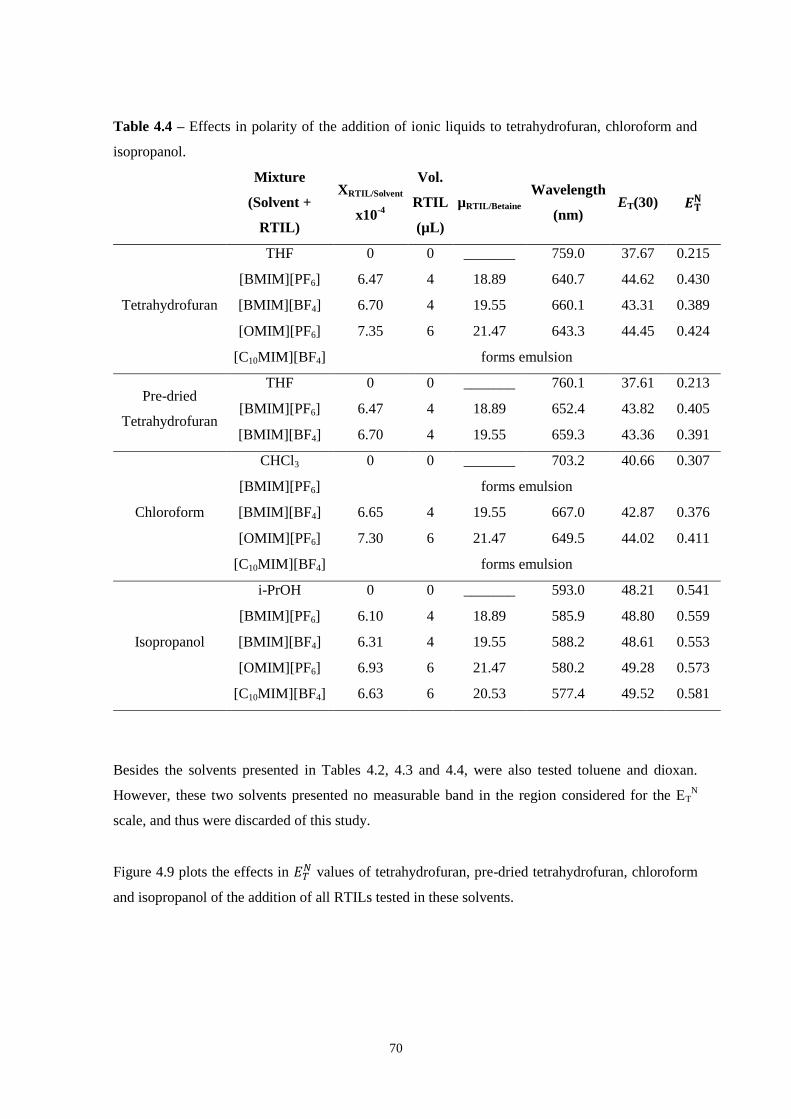
70
Table 4.4 – Effects in polarity of the addition of ionic liquids to tetrahydrofuran, chloroform and
isopropanol.
Mixture
(Solvent +
RTIL)
XRTIL/Solvent
x10-4
Vol.
RTIL
(µL)
µRTIL/Betaine Wavelength
(nm) ET(30)
Tetrahydrofuran
THF 0 0 _______ 759.0 37.67 0.215
[BMIM][PF6] 6.47 4 18.89 640.7 44.62 0.430
[BMIM][BF4] 6.70 4 19.55 660.1 43.31 0.389
[OMIM][PF6] 7.35 6 21.47 643.3 44.45 0.424
[C10MIM][BF4] forms emulsion
Pre-dried
Tetrahydrofuran
THF 0 0 _______ 760.1 37.61 0.213
[BMIM][PF6] 6.47 4 18.89 652.4 43.82 0.405
[BMIM][BF4] 6.70 4 19.55 659.3 43.36 0.391
Chloroform
CHCl3 0 0 _______ 703.2 40.66 0.307
[BMIM][PF6] forms emulsion
[BMIM][BF4] 6.65 4 19.55 667.0 42.87 0.376
[OMIM][PF6] 7.30 6 21.47 649.5 44.02 0.411
[C10MIM][BF4] forms emulsion
Isopropanol
i-PrOH 0 0 _______ 593.0 48.21 0.541
[BMIM][PF6] 6.10 4 18.89 585.9 48.80 0.559
[BMIM][BF4] 6.31 4 19.55 588.2 48.61 0.553
[OMIM][PF6] 6.93 6 21.47 580.2 49.28 0.573
[C10MIM][BF4] 6.63 6 20.53 577.4 49.52 0.581
Besides the solvents presented in Tables 4.2, 4.3 and 4.4, were also tested toluene and dioxan.
However, these two solvents presented no measurable band in the region considered for the ETN
scale, and thus were discarded of this study.
Figure 4.9 plots the effects in values of tetrahydrofuran, pre-dried tetrahydrofuran, chloroform
and isopropanol of the addition of all RTILs tested in these solvents.
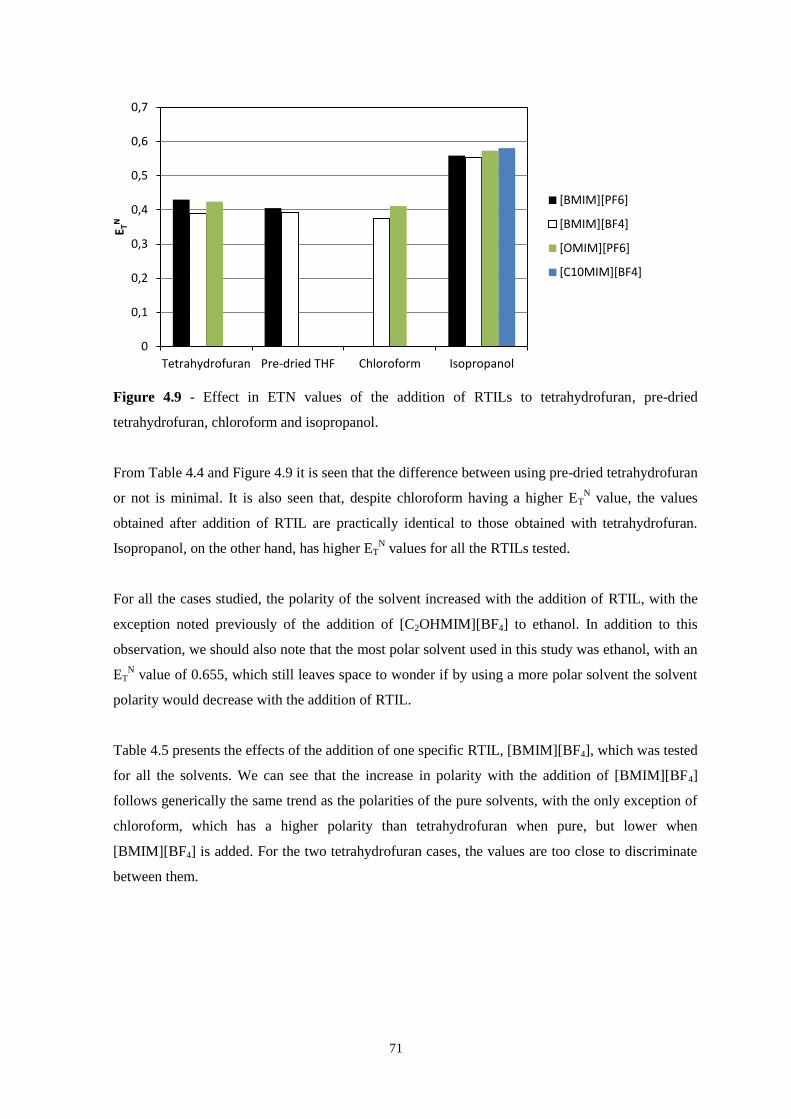
71
Figure 4.9 - Effect in ETN values of the addition of RTILs to tetrahydrofuran, pre-dried
tetrahydrofuran, chloroform and isopropanol.
From Table 4.4 and Figure 4.9 it is seen that the difference between using pre-dried tetrahydrofuran
or not is minimal. It is also seen that, despite chloroform having a higher ETN value, the values
obtained after addition of RTIL are practically identical to those obtained with tetrahydrofuran.
Isopropanol, on the other hand, has higher ETN values for all the RTILs tested.
For all the cases studied, the polarity of the solvent increased with the addition of RTIL, with the
exception noted previously of the addition of [C2OHMIM][BF4] to ethanol. In addition to this
observation, we should also note that the most polar solvent used in this study was ethanol, with an
ETN value of 0.655, which still leaves space to wonder if by using a more polar solvent the solvent
polarity would decrease with the addition of RTIL.
Table 4.5 presents the effects of the addition of one specific RTIL, [BMIM][BF4], which was tested
for all the solvents. We can see that the increase in polarity with the addition of [BMIM][BF4]
follows generically the same trend as the polarities of the pure solvents, with the only exception of
chloroform, which has a higher polarity than tetrahydrofuran when pure, but lower when
[BMIM][BF4] is added. For the two tetrahydrofuran cases, the values are too close to discriminate
between them.
0
0,1
0,2
0,3
0,4
0,5
0,6
0,7
Tetrahydrofuran Pre-dried THF Chloroform Isopropanol
E TN
[BMIM][PF6]
[BMIM][BF4]
[OMIM][PF6]
[C10MIM][BF4]
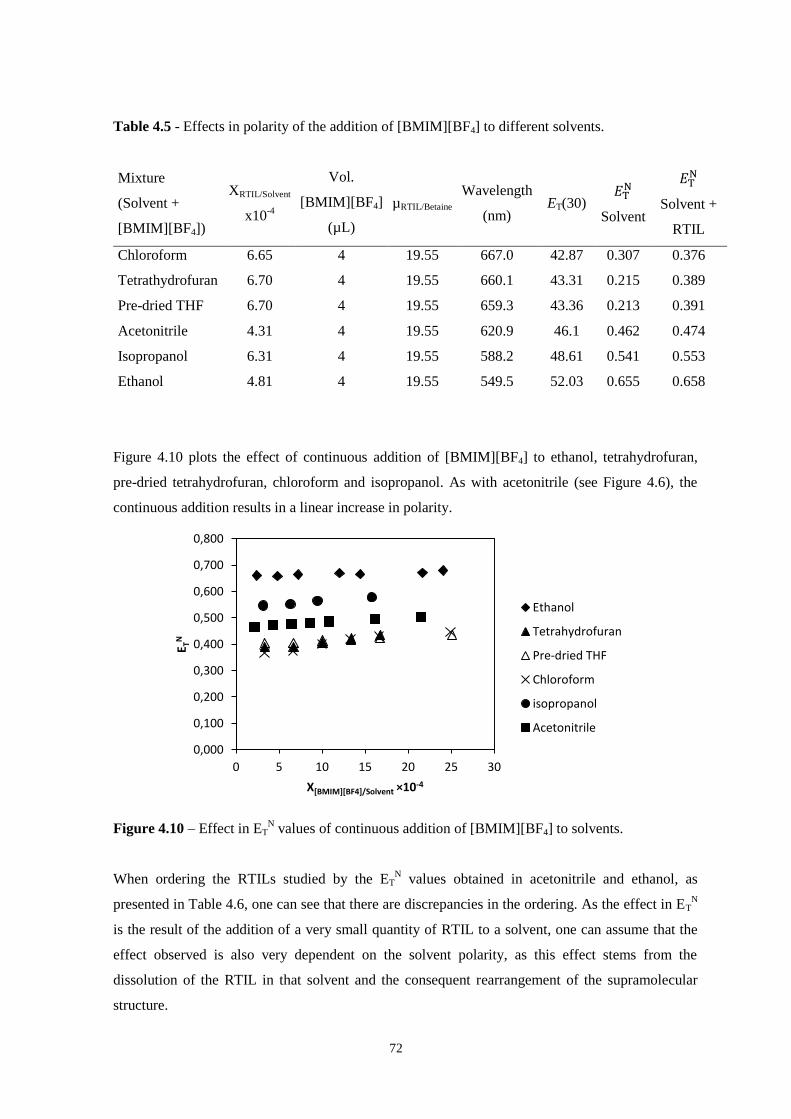
72
Table 4.5 - Effects in polarity of the addition of [BMIM][BF4] to different solvents.
Mixture
(Solvent +
[BMIM][BF4])
XRTIL/Solvent
x10-4
Vol.
[BMIM][BF4]
(µL)
µRTIL/Betaine Wavelength
(nm) ET(30)
Solvent
Solvent +
RTIL
Chloroform 6.65 4 19.55 667.0 42.87 0.307 0.376
Tetrathydrofuran 6.70 4 19.55 660.1 43.31 0.215 0.389
Pre-dried THF 6.70 4 19.55 659.3 43.36 0.213 0.391
Acetonitrile 4.31 4 19.55 620.9 46.1 0.462 0.474
Isopropanol 6.31 4 19.55 588.2 48.61 0.541 0.553
Ethanol 4.81 4 19.55 549.5 52.03 0.655 0.658
Figure 4.10 plots the effect of continuous addition of [BMIM][BF4] to ethanol, tetrahydrofuran,
pre-dried tetrahydrofuran, chloroform and isopropanol. As with acetonitrile (see Figure 4.6), the
continuous addition results in a linear increase in polarity.
Figure 4.10 – Effect in ETN values of continuous addition of [BMIM][BF4] to solvents.
When ordering the RTILs studied by the ETN values obtained in acetonitrile and ethanol, as
presented in Table 4.6, one can see that there are discrepancies in the ordering. As the effect in ETN
is the result of the addition of a very small quantity of RTIL to a solvent, one can assume that the
effect observed is also very dependent on the solvent polarity, as this effect stems from the
dissolution of the RTIL in that solvent and the consequent rearrangement of the supramolecular
structure.
0,000
0,100
0,200
0,300
0,400
0,500
0,600
0,700
0,800
0 5 10 15 20 25 30
E TN
X[BMIM][BF4]/Solvent ×10-4
Ethanol
Tetrahydrofuran
Pre-dried THF
Chloroform
isopropanol
Acetonitrile
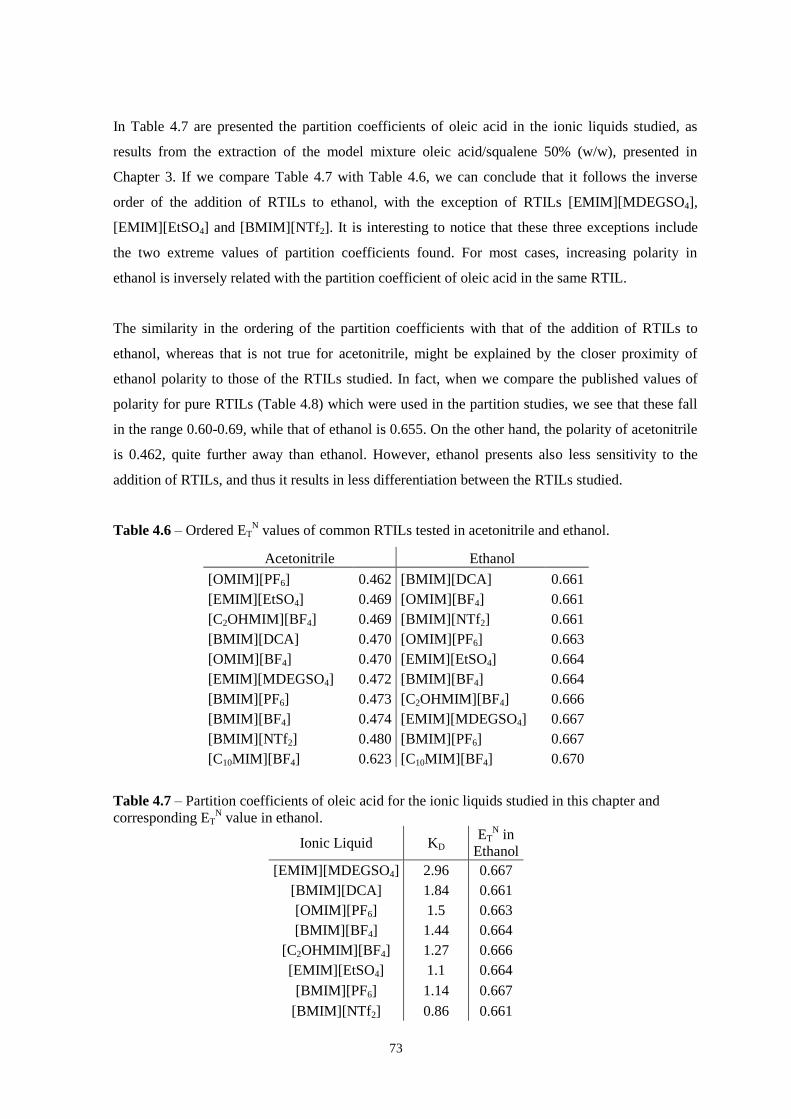
73
In Table 4.7 are presented the partition coefficients of oleic acid in the ionic liquids studied, as
results from the extraction of the model mixture oleic acid/squalene 50% (w/w), presented in
Chapter 3. If we compare Table 4.7 with Table 4.6, we can conclude that it follows the inverse
order of the addition of RTILs to ethanol, with the exception of RTILs [EMIM][MDEGSO4],
[EMIM][EtSO4] and [BMIM][NTf2]. It is interesting to notice that these three exceptions include
the two extreme values of partition coefficients found. For most cases, increasing polarity in
ethanol is inversely related with the partition coefficient of oleic acid in the same RTIL.
The similarity in the ordering of the partition coefficients with that of the addition of RTILs to
ethanol, whereas that is not true for acetonitrile, might be explained by the closer proximity of
ethanol polarity to those of the RTILs studied. In fact, when we compare the published values of
polarity for pure RTILs (Table 4.8) which were used in the partition studies, we see that these fall
in the range 0.60-0.69, while that of ethanol is 0.655. On the other hand, the polarity of acetonitrile
is 0.462, quite further away than ethanol. However, ethanol presents also less sensitivity to the
addition of RTILs, and thus it results in less differentiation between the RTILs studied.
Table 4.6 – Ordered ETN values of common RTILs tested in acetonitrile and ethanol.
Acetonitrile Ethanol
[OMIM][PF6] 0.462 [BMIM][DCA] 0.661
[EMIM][EtSO4] 0.469 [OMIM][BF4] 0.661
[C2OHMIM][BF4] 0.469 [BMIM][NTf2] 0.661
[BMIM][DCA] 0.470 [OMIM][PF6] 0.663
[OMIM][BF4] 0.470 [EMIM][EtSO4] 0.664
[EMIM][MDEGSO4] 0.472 [BMIM][BF4] 0.664
[BMIM][PF6] 0.473 [C2OHMIM][BF4] 0.666
[BMIM][BF4] 0.474 [EMIM][MDEGSO4] 0.667
[BMIM][NTf2] 0.480 [BMIM][PF6] 0.667
[C10MIM][BF4] 0.623 [C10MIM][BF4] 0.670
Table 4.7 – Partition coefficients of oleic acid for the ionic liquids studied in this chapter and
corresponding ETN value in ethanol.
Ionic Liquid KD
ETN in
Ethanol
[EMIM][MDEGSO4] 2.96 0.667
[BMIM][DCA] 1.84 0.661
[OMIM][PF6] 1.5 0.663
[BMIM][BF4] 1.44 0.664
[C2OHMIM][BF4] 1.27 0.666
[EMIM][EtSO4] 1.1 0.664
[BMIM][PF6] 1.14 0.667
[BMIM][NTf2] 0.86 0.661
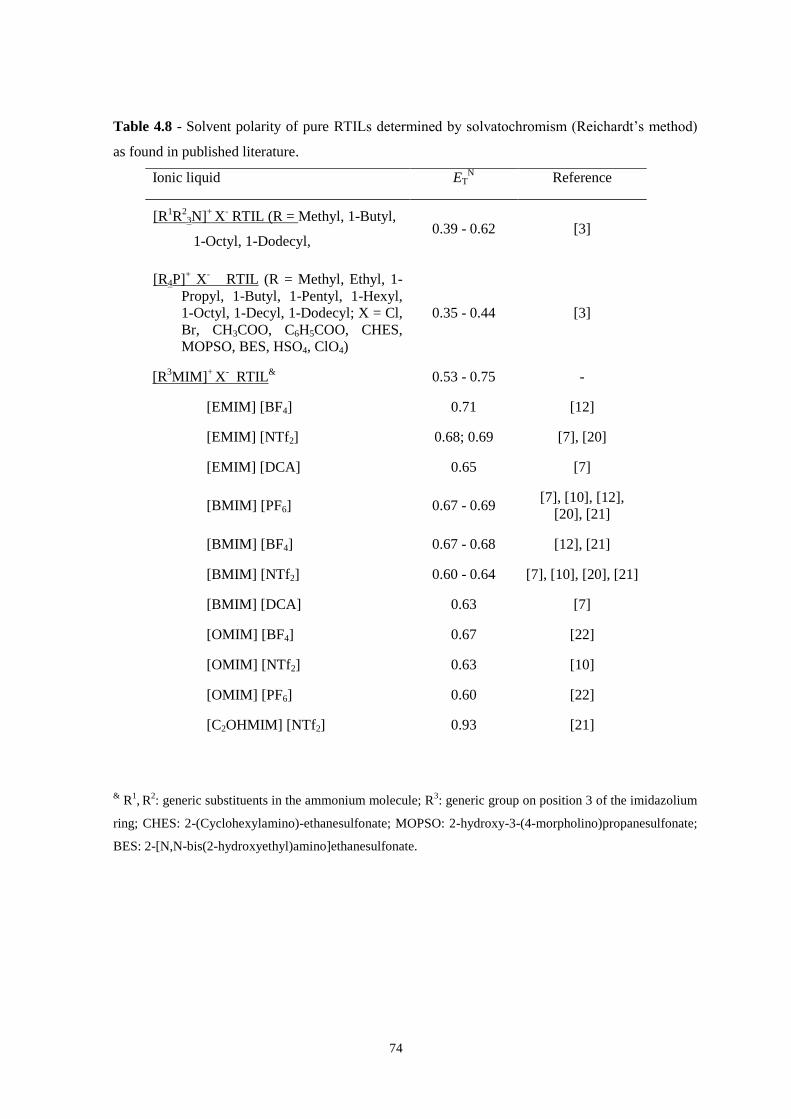
74
Table 4.8 - Solvent polarity of pure RTILs determined by solvatochromism (Reichardt’s method)
as found in published literature.
Ionic liquid ETN Reference
[R1R
23N]
+ X
- RTIL (R = Methyl, 1-Butyl,
1-Octyl, 1-Dodecyl, 0.39 - 0.62 [3]
[R4P]+ X
- RTIL (R = Methyl, Ethyl, 1-
Propyl, 1-Butyl, 1-Pentyl, 1-Hexyl,
1-Octyl, 1-Decyl, 1-Dodecyl; X = Cl,
Br, CH3COO, C6H5COO, CHES,
MOPSO, BES, HSO4, ClO4)
0.35 - 0.44 [3]
[R3MIM]
+ X
- RTIL
& 0.53 - 0.75 -
[EMIM] [BF4] 0.71 [12]
[EMIM] [NTf2] 0.68; 0.69 [7], [20]
[EMIM] [DCA] 0.65 [7]
[BMIM] [PF6] 0.67 - 0.69 [7], [10], [12],
[20], [21]
[BMIM] [BF4] 0.67 - 0.68 [12], [21]
[BMIM] [NTf2] 0.60 - 0.64 [7], [10], [20], [21]
[BMIM] [DCA] 0.63 [7]
[OMIM] [BF4] 0.67 [22]
[OMIM] [NTf2] 0.63 [10]
[OMIM] [PF6] 0.60 [22]
[C2OHMIM] [NTf2] 0.93 [21]
& R
1, R
2: generic substituents in the ammonium molecule; R
3: generic group on position 3 of the imidazolium
ring; CHES: 2-(Cyclohexylamino)-ethanesulfonate; MOPSO: 2-hydroxy-3-(4-morpholino)propanesulfonate;
BES: 2-[N,N-bis(2-hydroxyethyl)amino]ethanesulfonate.
75
4.4 - Conclusions
This work intended to use the addition of RTILs to common organic solvents to probe their
polarities by an indirect method, in order to try to find a correlation between the polarity and the
results obtained with the extraction of the model mixture of oleic acid/squalene 50% (w/w) with
RTILs.
It was seen that the influence in solvent polarity is more linked to the cation than the anion. For all
the cases studied, the polarity of the solvent increased with the addition of RTIL and the continuous
addition is linearly correlated to the increase in polarity. The only exception is [C2OHMIM][BF4],
which decreases the polarity of ethanol with the first addition, but with further additions it also
increased the value of polarity. The increase in polarity in acetonitrile (the solvent with more
RTILs studied) can be generically described following the cation sequence
[(C6)3C14P]<[BDMIM]<[ALIQUAT]<[EMIM]<[BMIM].
Ethanol presented the polarity scale more in accordance with the already published values for pure
RTILs, which is also the sequence observed for the partition coefficients of oleic acid in the pure
RTILs for the model mixture oleic acid/squalene. This is probably a result of closer polarity of
ethanol to those of the pure RTILs. However, it was also seen that ethanol is less sensitive to the
changes in polarity than acetonitrile.
4.5 - References
[1] Reichardt, C. Empirical Parameters of the Polarity of Solvents Angew. Chem. Int. Ed. 1965, 4,
29–40.
[2] Muller P.; Glossary of terms used in physical organic chemistry (IUPAC Recommendations
1994) Pure Appl. Chem. 1994, 66, 1077–1184.
[3] C. Reichardt; Polarity of ionic liquids determined empirically by means of solvatochromic
pyridinium N-phenolate betaine dyes Green Chem. 2005, 7, 339–351.
[4] Carmichael, A. J.; Seddon, K. R.; Polarity study of some 1-alkyl-3-methylimidazolium
ambient-temperature ionic liquids with the solvatochromic dye, Nile Red J. Phys. Org. Chem.
2000, 13, 591-595.
[5] Saha, S.; Mandal, P. K.; Samanta, A. Solvation dynamics of Nile Red in a room temperature
ionic liquid using streak camera Phys. Chem. Chem. Phys. 2004, 6, 3106–3110.
[6] Fletcher, K. A.; Storey, I. A.; Hendricks, A. E.; Pandey, S.; Pandey, S. Behavior of the
solvatochromic probes Reichardt’s dye, pyrene, dansylamide, Nile Red and 1-
pyrenecarbaldehyde within the room-temperature ionic liquid bmimPF6 Green Chem. 2001, 3,
210–21.
76
[7] Chiappe, C.; Pieraccini, D. Determination of Ionic Liquids Solvent Properties Using an
Unusual Probe: The Electron Donor-Acceptor Complex between 4,4'-bis(Dimethylamino)-
benzophenone and Tetracyanoethene J. Phys. Chem. A. 2006, 110, 4937-4941.
[8] Aki, S. N. K. V. K.; Brennecke, J. F.; Samanta, A. How polar are room-temperature ionic
liquids? Chem. Commun. 2001, 413-414.
[9] Wasserscheid, P.; Gordon, C. M.; Hilgers, C.; Muldoon, M. J.; Dunkin, I. R. Ionic liquids:
polar, but weakly coordinating solvents for the first biphasic oligomerisation of ethene to
higher a-olefins with cationic Ni complexes Chem. Commun. 2001, 1186–1188.
[10] Muldoon, M. J.; Gordon, C. M.; Dunkin, I. R. Investigations of solvent-solute interactions in
room temperature ionic liquids using solvatochromic dyes J. Chem. Soc., Perkin Trans. 2001,
2, 433-435.
[11] Karmakar, R.; Samanta, A. Solvation Dynamics of Coumarin-153 in a Room-Temperature
Ionic Liquid J. Phys. Chem. A 2002, 106, 4447–4452.
[12] Park, S.; Kazlauskas, R. J. Improved Preparation and Use of Room-Temperature Ionic Liquids
in Lipase-Catalyzed Enantio- and Regioselective Acylations J. Org. Chem. 2001, 66, 8395-
8401.
[13] Crowhurst, L.; Mawdsley, P. R.; Perez-Arlandis, J. M.; Salter, P. A.; Welton, T. Solvent–
solute interactions in ionic liquids Phys. Chem. Chem. Phys. 2003, 5, 2790–2794.
[14] Kaar, J. L.; Jesionowski, A. M.; Berberich, J. A.; Moulton, R.; Russell, A. J. Impact of Ionic
Liquid Physical Properties on Lipase Activity and Stability J. Am. Chem. Soc. 2003, 125,
4125-4131.
[15] Baker, S. N.; Baker, G. A.; Bright, F. V. Temperature-dependent microscopic solvent
properties of ‘dry’ and ‘wet’ 1-butyl-3-methylimidazolium hexafluorophosphate: correlation
with ET(30) and Kamlet–Taft polarity scales Green Chem. 2002, 4, 165–169.
[16] Ab Rani, M. A.; Brant, A.; Crowhurst, L.; Dolan, A.; Lui, M.; Hassan, N. H.; Hallett, J. P.;
Hunt, P. A.; Niedermeyer, H.; Perez-Arlandis, J. M.; Schrems, M.; Welton, T.; Wilding, R.
Understanding the polarity of ionic liquids Phys. Chem. Chem. Phys. 2011, 13, 16831–16840.
[17] Mellein, B. R.; Aki, S. N. V. K.; Ladewski, R. L.; Brennecke, J. F. Solvatochromic Studies of
Ionic Liquid/Organic Mixtures J. Phys. Chem. B 2007, 111, 131-138.
[18] Trivedi, S.; Sarkar, A.; Pandey, S. Solvatochromic absorbance probe behavior within 1-butyl-
3-methylimidazolium hexafluorophosphate + propylene carbonate: Preferential solvation or
solvent–solvent interaction? Chem. Eng. J. 2009, 147, 36–42.
[19] Yang, Q.; Xing, H.; Su, B.; Yu, K.; Bao, Z.; Yang, Y.; Ren, Q. Improved separation efficiency
using ionic liquid–cosolvent mixtures as the extractant in liquid–liquid extraction: A multiple
adjustment and synergistic effect Chem. Eng. J. 2012, 181-182, 334-342.
[20] K.A. Fletcher, S. Pandey, Solvatochromic probe behavior within neat and cosolvent added
room-temperature ionic liquid solutions, in: H.C. Dulong, R.W. Bradshaw, M. Matsunaga,

77
G.K. Stafford, P.C. Trulove (Eds.), 2002-19-Molten Salts XIII, Electrochemical Society,
Pennsylvania, 2002, pp. 244–256.
[21] S.V. Dzyuba, R.A. Bartsch, Expanding the polarity range of ionic liquids, Tetrahedron Lett.
43 (2002) 4657–4659.
[22] J.G. Huddleston, G. Broker, H. Willauer, R.D. Rogers, Ionic liquids – industrial applications
to green chemistry, in: ACS Symposium Series, American Chemical Society, Washington,
DC, 2002, pp. 270–288.

78
79
Chapter 5
Supported Ionic Liquids Membranes3
3 Chapter partially submited for publication as: Ricardo M. Couto, Tânia Carvalho, Luísa A. Neves, Rui M.
Ruivo, Pedro Vidinha, Alexandre Paiva, Isabel M. Coelhoso, Susana Barreiros, Pedro C. Simões; Development
of Ion-Jelly® Membranes; Separation and Purification Technology

80
81
5.1 - Introduction
In recent years ionic liquid membranes have gained relevance and were proven to effectively
separate compounds of interest. The first approach was developed by Branco et al. [1], who
proposed to use room temperature ionic liquids (RTILs) as bulk membranes, in a U-shaped tube, or
as supported ionic liquid membranes (SILMs), by impregnating a porous membrane with the
desired ionic liquid. With this approach it was possible to separate secondary and tertiary amines
with very similar boiling points, which was not possible to do before either with other liquid
membranes or by distillation. Since then, many substances have been separated with SILMs, such
as hydrocarbons, alcohols, esters and gases [2]-[5].
There are mainly three approaches commonly used to immobilise RTIL in a porous support: (1)
direct immersion, in which the membrane is soaked in the RTIL [5]-[8]; (2) pressure, in which the
RTIL is spread over the membrane and a small pressure is applied to force it to flow into the
membrane pores [9], [10]; (3) and vacuum, in which the air in the pores of the supporting
membrane is removed with vacuum and then, still under vacuum, RTIL is spread over the
membrane [1], [10]-[14]. In all the cases, excess RTIL has to be removed from the surface of the
membrane, either by letting it drip, or by gently wiping it with absorbing tissue. In a study where
the operational stability was assessed, it was found that the preparation method in which pressure is
used, is the one which results in higher amounts of RTIL immobilized in the membrane and which
also presents higher stability [10].
In this chapter is shown the development and application of SILMs in scCO2 separations, based on
the commercial reverse osmosis membranes studied in Chapter 2 and the ionic liquids studied in
Chapters 3 and 4. However, difficulties arose in operation and poor results were obtained.
Furthermore, it is known that RTILs are displaced from SILMs under operation, even at low
differential pressure (above 2 bar) [14]. To try to overcome these difficulties, gel membranes, in
which RTIL is blended with a polymer, have been prepared by several authors [15]-[17].
Membranes prepared in this way retain solubility characteristics identical to the liquid, which
confer them identical permeabilities, but with improved mechanical properties. These membranes
were effectively employed in the separation of gases such as carbon dioxide from nitrogen [15],
[17], methane [16], [17], and hydrogen [17] or hydrogen from nitrogen [17].
In this work gel membranes were developed based on Ion-Jelly® (IJ), a new gel material developed
in our research group, which is obtained by adding an ionic liquid to gelatine [18]. This material is
a transparent and flexible polymer which can be moulded into a wide range of shapes, with the
additional advantage of being obtained from a natural polymer. It was found that Ion-Jelly® can
have very reasonable conductivities over a wide range of frequencies, leading to possible
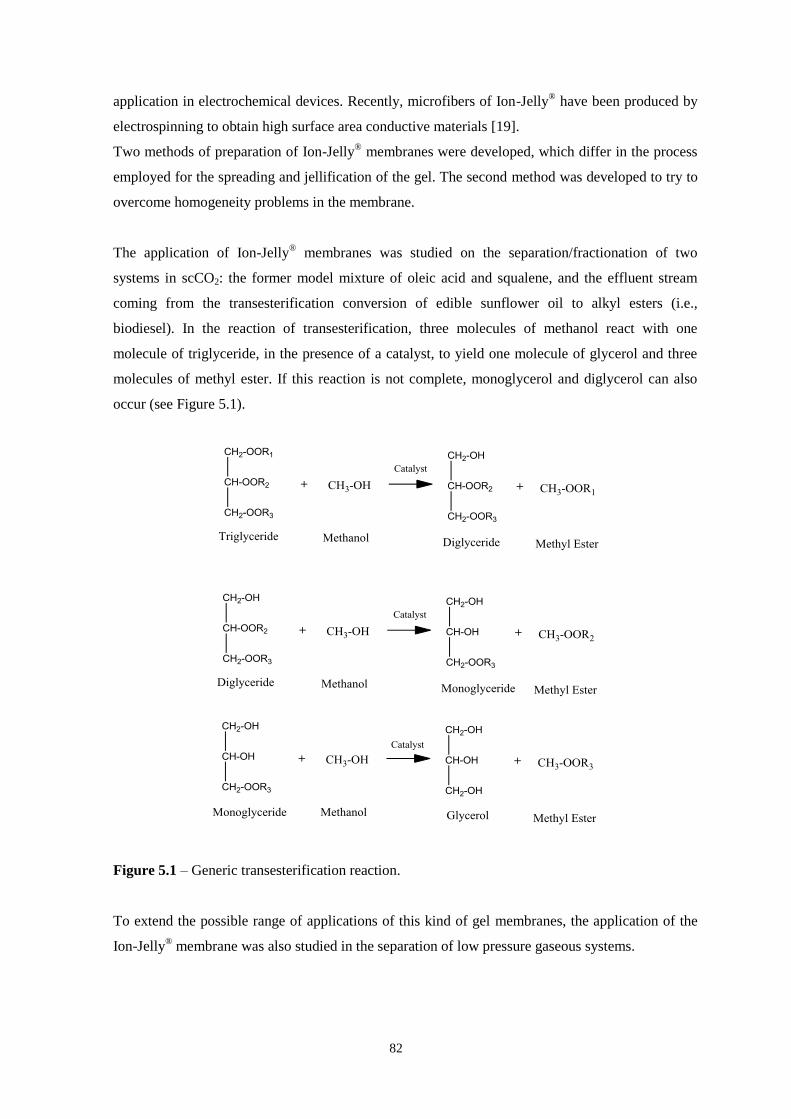
82
application in electrochemical devices. Recently, microfibers of Ion-Jelly® have been produced by
electrospinning to obtain high surface area conductive materials [19].
Two methods of preparation of Ion-Jelly® membranes were developed, which differ in the process
employed for the spreading and jellification of the gel. The second method was developed to try to
overcome homogeneity problems in the membrane.
The application of Ion-Jelly® membranes was studied on the separation/fractionation of two
systems in scCO2: the former model mixture of oleic acid and squalene, and the effluent stream
coming from the transesterification conversion of edible sunflower oil to alkyl esters (i.e.,
biodiesel). In the reaction of transesterification, three molecules of methanol react with one
molecule of triglyceride, in the presence of a catalyst, to yield one molecule of glycerol and three
molecules of methyl ester. If this reaction is not complete, monoglycerol and diglycerol can also
occur (see Figure 5.1).
Figure 5.1 – Generic transesterification reaction.
To extend the possible range of applications of this kind of gel membranes, the application of the
Ion-Jelly® membrane was also studied in the separation of low pressure gaseous systems.
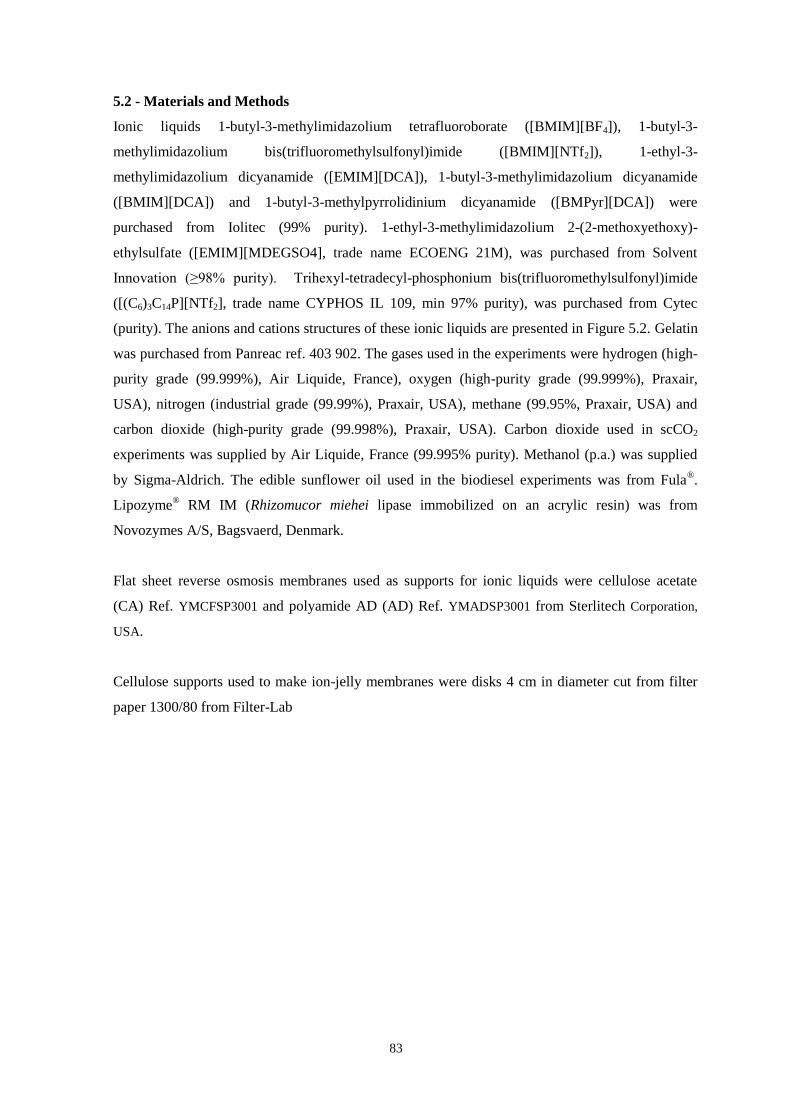
83
5.2 - Materials and Methods
Ionic liquids 1-butyl-3-methylimidazolium tetrafluoroborate ([BMIM][BF4]), 1-butyl-3-
methylimidazolium bis(trifluoromethylsulfonyl)imide ([BMIM][NTf2]), 1-ethyl-3-
methylimidazolium dicyanamide ([EMIM][DCA]), 1-butyl-3-methylimidazolium dicyanamide
([BMIM][DCA]) and 1-butyl-3-methylpyrrolidinium dicyanamide ([BMPyr][DCA]) were
purchased from Iolitec (99% purity). 1-ethyl-3-methylimidazolium 2-(2-methoxyethoxy)-
ethylsulfate ([EMIM][MDEGSO4], trade name ECOENG 21M), was purchased from Solvent
Innovation (≥98% purity). Trihexyl-tetradecyl-phosphonium bis(trifluoromethylsulfonyl)imide
([(C6)3C14P][NTf2], trade name CYPHOS IL 109, min 97% purity), was purchased from Cytec
(purity). The anions and cations structures of these ionic liquids are presented in Figure 5.2. Gelatin
was purchased from Panreac ref. 403 902. The gases used in the experiments were hydrogen (high-
purity grade (99.999%), Air Liquide, France), oxygen (high-purity grade (99.999%), Praxair,
USA), nitrogen (industrial grade (99.99%), Praxair, USA), methane (99.95%, Praxair, USA) and
carbon dioxide (high-purity grade (99.998%), Praxair, USA). Carbon dioxide used in scCO2
experiments was supplied by Air Liquide, France (99.995% purity). Methanol (p.a.) was supplied
by Sigma-Aldrich. The edible sunflower oil used in the biodiesel experiments was from Fula®.
Lipozyme® RM IM (Rhizomucor miehei lipase immobilized on an acrylic resin) was from
Novozymes A/S, Bagsvaerd, Denmark.
Flat sheet reverse osmosis membranes used as supports for ionic liquids were cellulose acetate
(CA) Ref. YMCFSP3001 and polyamide AD (AD) Ref. YMADSP3001 from Sterlitech Corporation,
USA.
Cellulose supports used to make ion-jelly membranes were disks 4 cm in diameter cut from filter
paper 1300/80 from Filter-Lab
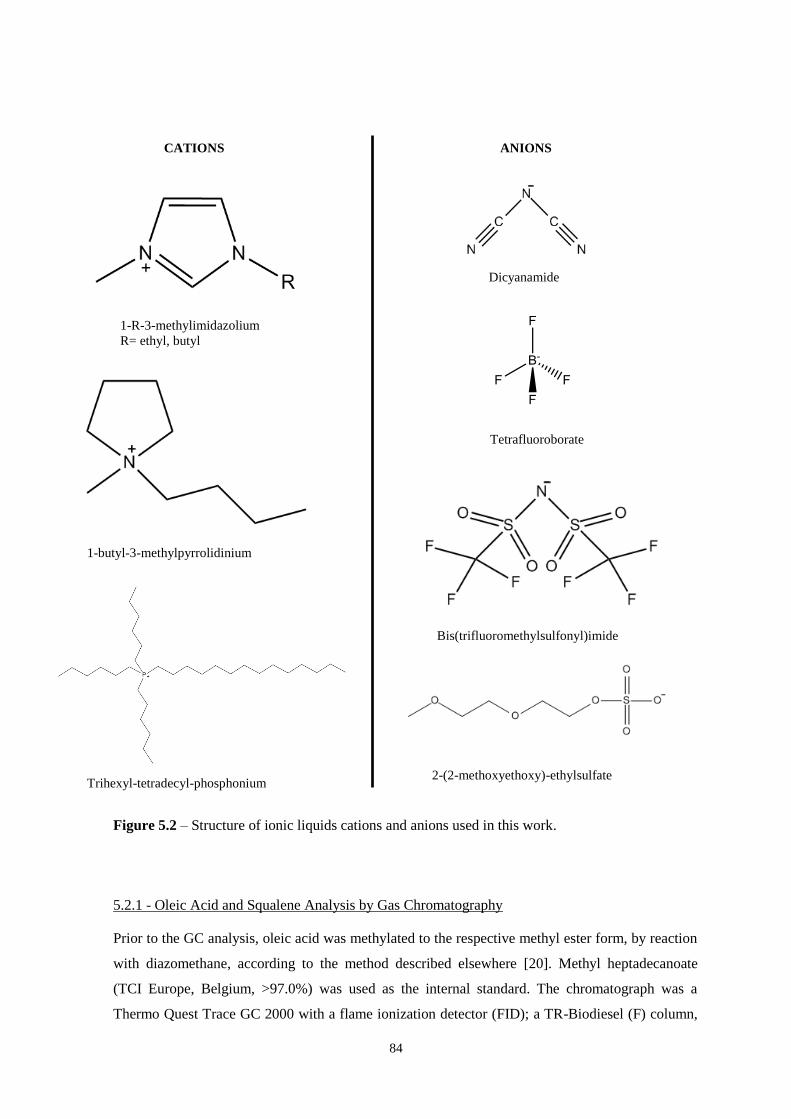
84
Figure 5.2 – Structure of ionic liquids cations and anions used in this work.
5.2.1 - Oleic Acid and Squalene Analysis by Gas Chromatography
Prior to the GC analysis, oleic acid was methylated to the respective methyl ester form, by reaction
with diazomethane, according to the method described elsewhere [20]. Methyl heptadecanoate
(TCI Europe, Belgium, >97.0%) was used as the internal standard. The chromatograph was a
Thermo Quest Trace GC 2000 with a flame ionization detector (FID); a TR-Biodiesel (F) column,
1-butyl-3-methylpyrrolidinium
Dicyanamide
CATIONS ANIONS
Trihexyl-tetradecyl-phosphonium
Tetrafluoroborate
Bis(trifluoromethylsulfonyl)imide
2-(2-methoxyethoxy)-ethylsulfate
1-R-3-methylimidazolium
R= ethyl, butyl
85
30 m × 0.25 mm and 0.25 μm film thickness, from Thermo-Scientific was used. Helium was used
as carrier at a constant flow of 2 mL.min
-1. The oven temperature was set at 393 K for 0.5 min, then
to 493 K at 30 K.min
−1 and holding for 1 min, and then to 523 K at 10 K
.min
-1 with a final holding
time of 5 min. The injector was a PTV programmed to heat from 363 K to 533 K at 10 K.s
-1, with a
transfer time of 3 min and cleaning at 633 K with a split of 250 mL.min
-1 for 20 min. Detector
temperature was 553 K, respectively. Peak identification was carried out using known standards
(FAME mix C8-C24, Supelco).
5.2.2 - Methyl Esters Analysis by Gas Chromatography
Prior to the GC analysis, methyl esters were derivatized with n-methyl-n-
trimethylsilyltrifluoroacetamide (TCI Europe, Belgium, >90%) for better detection. (±)-1,2,4-
Butanetriol (Sigma-Aldrich, ≥90%) and tricaprin (TCI Europe, Belgium, >98%) were used as
internal standards. The gas chromatograph was a Thermo Quest Trace GC 2000 with a flame
ionization detector (FID); a TR-Biodiesel (G) column, 10 m × 0.25 mm and 0.1 µm film thickness,
from Thermo-Scientific was used. Helium was used as carrier at 3 mL.min
-1 for 12 min, and then
ramped to 5 mL.min
-1 at 0.5 mL
.min
-1.min
-1. The oven temperature was 353–453 K at 15 K
.min
−1,
then to 503 K at 7 K.min
−1, then to 638 K at 10 K
.min
−1 with a final holding time of 4 min. The
injector was a true cold On-Column and detector temperature was 653 K.
5.2.3 - Preparation of Supported Ionic Liquid Membranes
Disks 4 cm in diameter were cut from CA or AD flat sheet membranes, and were deposited in the
bottom of a high pressure stainless steel vessel. 1 mL of appropriate ionic liquid was spread on top
of the membrane, and the vessel was closed. CO2 was added to the vessel, at a pressure of 0.2 MPa,
in order to force the ionic liquid to flow into the pores of the membrane. After one hour the vessel
was opened and the excess ionic liquid remaining on top of the membrane was gently wiped with
absorbing tissue. To make sure there was no remaining ionic liquid, the membrane was set upright
and left to drip overnight.
5.2.4 - Preparation of Ion-Jelly® Membranes by evaporative casting-knife method
300 µl of ionic liquid were heated to 318 K under magnetic stirring, followed by the addition of
120 mg of gelatin. In order to obtain a homogenous solution 300 L of water were added dropwise.
The mixtures were kept stirring at 318 K until gelatin was completely solubilized (approximately
15 minutes). The solution was then spread over a cellulose support, in order to form thin films.
Jellification occurred at room temperature. In some cases the thickness of the Ion-Jelly® layer
86
applied was controlled with a K101 Control Coater (RK Print Ltd.), equipped with a casting knife
regulated to make films 0.5 and 1 mm thick.
5.2.5 - Preparation of Ion-Jelly® Membranes by glass plates pressed method
The preparation procedure was basically the same as the first method, differing only in the drying
process. Now, the solution was spread over a cellulose support and pressed between two glass
plates, in order to remove air bubbles and to form thin films of homogeneous thickness. The
membranes were left to jellify overnight pressed between the glass plates, at room temperature. A
blank membrane was prepared in a similar fashion but using 1020 µl of water and 120 mg of
gelatin.
5.2.6 - Characterization of Ion-Jelly® Membranes
5.2.6.1 - Traction
The tensile properties of the membranes were tested with a tensile testing machine (MINIMAT
firm-ware v.3.1) at room temperature. A full scale load of 20 N and maximum extension of 90 mm
were used. Load extension graphs were obtained during testing and converted to stress-strain
curves applying the following equations:
stress = σ =
(5.1)
strain = ε =
(5.2)
where F is the applied force (N); A is the cross-sectional area (m2); Δl is the change in length
(mm); L is the length between clamps (mm).
5.2.6.2 - Contact Angles
Contact angles were measured by the sessile drop method in a contact angle goniometer (CAM
100, KSV Instruments Ltd, Finland). In this method a drop of liquid is dropped with a syringe on
top of the surface to evaluate and images are captured at short intervals for a certain duration of
time. The angle between the surface and the tangent of the drop is measured on both sides of the
drop. The contact angles of water and triglycerides in the Ion-Jelly® membranes were measured
over a period of 10 seconds in intervals of 0.1 seconds.
87
5.2.6.3 - SEM Images
The membranes were characterized by Scanning Electron Microscopy (SEM) using a SEM
DSM962 model from Zeiss. Samples were coated with 8 nm gold/palladium particles in a Q 150T
ES from Quorum. For cross-section analysis the membrane samples were frozen and fractured in
liquid nitrogen.
5.2.7 - scCO2 Fractionation Experiments
For the fractionation experiments with the model mixture of squalene and oleic acid (50% in mass
of each) we used the apparatus as described in Chapter 2. For the biodiesel experiments, a slight
modification of the former configuration was used, in which two HPLC pumps (models 305 and
306, Gilson, USA) were employed, instead of using the single LDC pump, to pump separately the
sunflower oil and the methanol flows. Furthermore, the separation vessel before the membrane cell
was replaced by a high pressure packed-bed enzymatic tubular 316SS reactor (115 cm length, 9
mm I.D.) filled with Lipozyme RM IM, which converted sunflower triglycerides and methanol to
methyl esters and glycerol. The reaction mixture (monophasic) exiting the packed-bed reactor was
fed to the membrane cell for further fractionation. The enzymatic reactor is heated by means of a
water bath recirculated through an external shirt using a heating circulator (MD, Julabo
Labortechnik GmbH, Germany).
5.2.7.1 - Elemental Analysis
Elemental analysis of feed, retentate and permeate streams collected in the scCO2 fractionation
experiments was performed with a Flash EA 1112 CHNS series from Thermo Finnigan-CE
Instruments, Italy.
5.2.8- Single Gas Permeabilities
The pure gas permeability of the Ion-Jelly® membranes for H2, N2, O2, CH4 and CO2 was
determined by using the experimental apparatus shown in Figure 5.3. This rig is composed by a
stainless steel cell with two identical compartments separated by the supported liquid membrane.
The effective membrane area was 4 cm2. Each individual gas permeability was evaluated by
pressurizing both compartments (feed and permeate) with the pure gas, and after opening the
permeate outlet, establishing a driving force of around 0.07 MPa between the feed and the
permeate compartments. The pressure change in both compartments over time was followed using
two pressure transducers (Druck, PDCR 910 models 99166 and 991675, England). All
measurements were performed at a constant temperature of 303 K by using a thermostatic bath
(Julabo, Model EH, Germany).
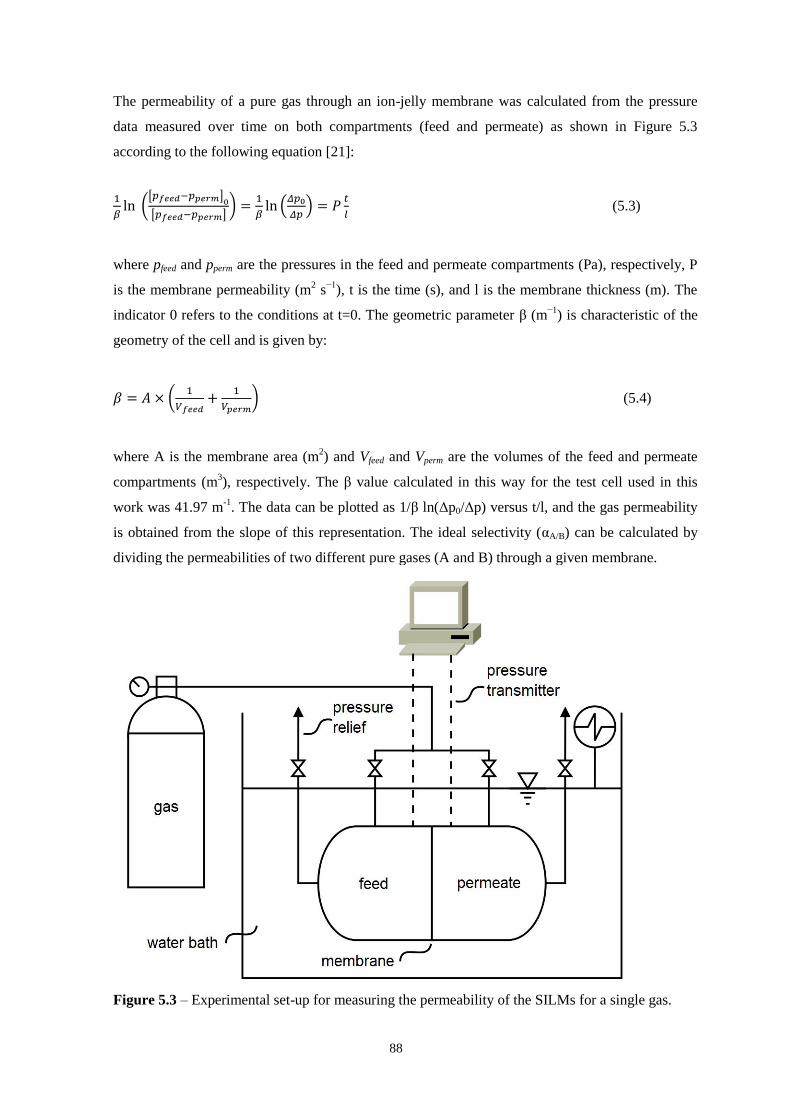
88
The permeability of a pure gas through an ion-jelly membrane was calculated from the pressure
data measured over time on both compartments (feed and permeate) as shown in Figure 5.3
according to the following equation [21]:
(5.3)
where pfeed and pperm are the pressures in the feed and permeate compartments (Pa), respectively, P
is the membrane permeability (m2 s
−1), t is the time (s), and l is the membrane thickness (m). The
indicator 0 refers to the conditions at t=0. The geometric parameter β (m−1
) is characteristic of the
geometry of the cell and is given by:
(5.4)
where A is the membrane area (m2) and Vfeed and Vperm are the volumes of the feed and permeate
compartments (m3), respectively. The β value calculated in this way for the test cell used in this
work was 41.97 m-1
. The data can be plotted as 1/β ln(Δp0/Δp) versus t/l, and the gas permeability
is obtained from the slope of this representation. The ideal selectivity (αA/B) can be calculated by
dividing the permeabilities of two different pure gases (A and B) through a given membrane.
Figure 5.3 – Experimental set-up for measuring the permeability of the SILMs for a single gas.
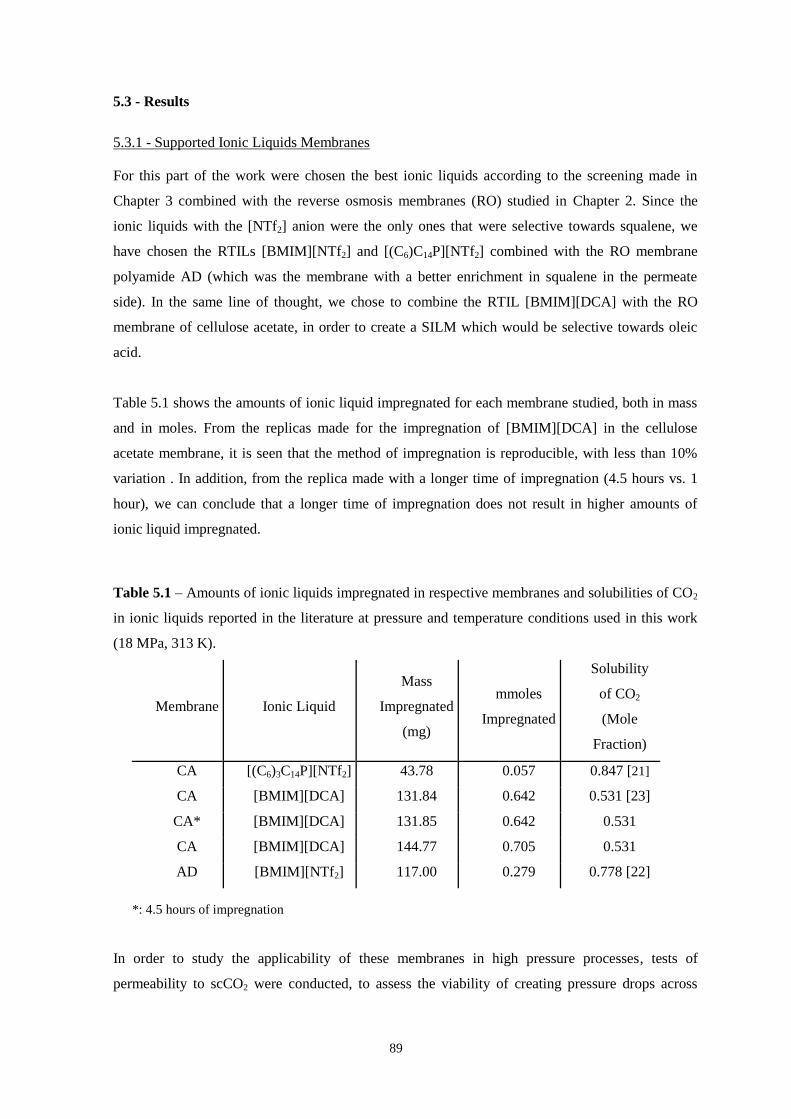
89
5.3 - Results
5.3.1 - Supported Ionic Liquids Membranes
For this part of the work were chosen the best ionic liquids according to the screening made in
Chapter 3 combined with the reverse osmosis membranes (RO) studied in Chapter 2. Since the
ionic liquids with the [NTf2] anion were the only ones that were selective towards squalene, we
have chosen the RTILs [BMIM][NTf2] and [(C6)C14P][NTf2] combined with the RO membrane
polyamide AD (which was the membrane with a better enrichment in squalene in the permeate
side). In the same line of thought, we chose to combine the RTIL [BMIM][DCA] with the RO
membrane of cellulose acetate, in order to create a SILM which would be selective towards oleic
acid.
Table 5.1 shows the amounts of ionic liquid impregnated for each membrane studied, both in mass
and in moles. From the replicas made for the impregnation of [BMIM][DCA] in the cellulose
acetate membrane, it is seen that the method of impregnation is reproducible, with less than 10%
variation . In addition, from the replica made with a longer time of impregnation (4.5 hours vs. 1
hour), we can conclude that a longer time of impregnation does not result in higher amounts of
ionic liquid impregnated.
Table 5.1 – Amounts of ionic liquids impregnated in respective membranes and solubilities of CO2
in ionic liquids reported in the literature at pressure and temperature conditions used in this work
(18 MPa, 313 K).
Membrane Ionic Liquid
Mass
Impregnated
(mg)
mmoles
Impregnated
Solubility
of CO2
(Mole
Fraction)
CA [(C6)3C14P][NTf2] 43.78 0.057 0.847 [21]
CA [BMIM][DCA] 131.84 0.642 0.531 [23]
CA* [BMIM][DCA] 131.85 0.642 0.531
CA [BMIM][DCA] 144.77 0.705 0.531
AD [BMIM][NTf2] 117.00 0.279 0.778 [22]
*: 4.5 hours of impregnation
In order to study the applicability of these membranes in high pressure processes, tests of
permeability to scCO2 were conducted, to assess the viability of creating pressure drops across
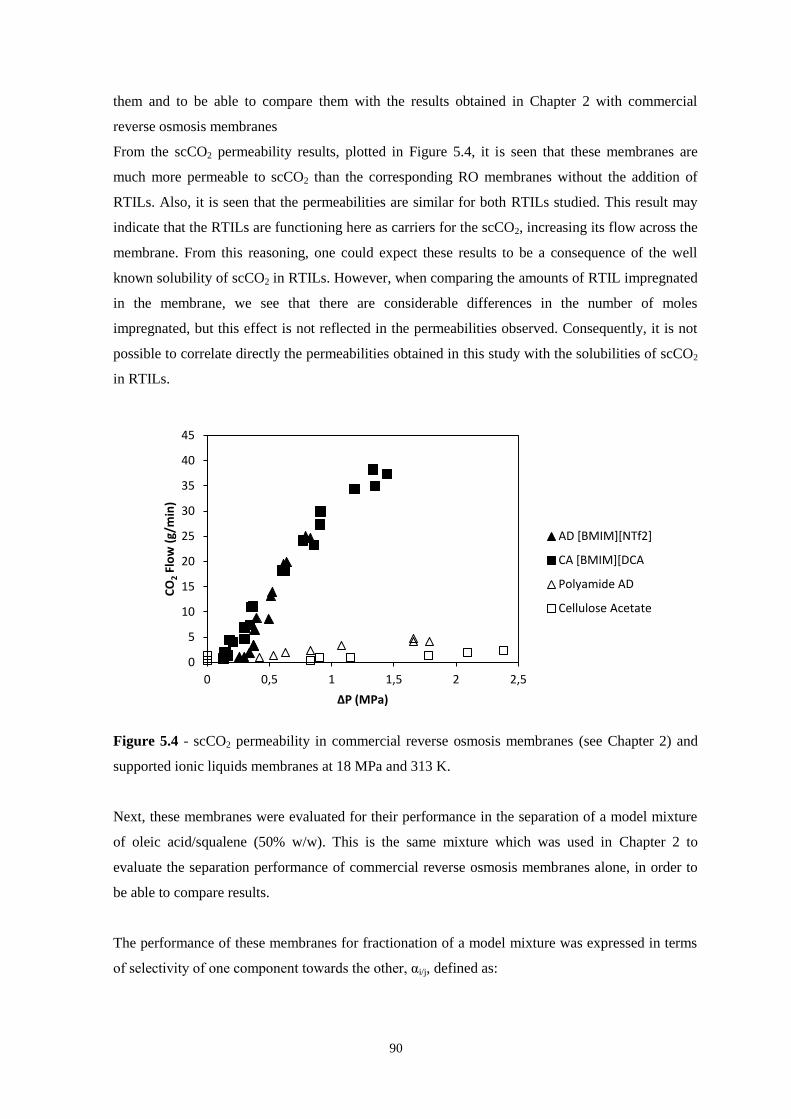
90
them and to be able to compare them with the results obtained in Chapter 2 with commercial
reverse osmosis membranes
From the scCO2 permeability results, plotted in Figure 5.4, it is seen that these membranes are
much more permeable to scCO2 than the corresponding RO membranes without the addition of
RTILs. Also, it is seen that the permeabilities are similar for both RTILs studied. This result may
indicate that the RTILs are functioning here as carriers for the scCO2, increasing its flow across the
membrane. From this reasoning, one could expect these results to be a consequence of the well
known solubility of scCO2 in RTILs. However, when comparing the amounts of RTIL impregnated
in the membrane, we see that there are considerable differences in the number of moles
impregnated, but this effect is not reflected in the permeabilities observed. Consequently, it is not
possible to correlate directly the permeabilities obtained in this study with the solubilities of scCO2
in RTILs.
Figure 5.4 - scCO2 permeability in commercial reverse osmosis membranes (see Chapter 2) and
supported ionic liquids membranes at 18 MPa and 313 K.
Next, these membranes were evaluated for their performance in the separation of a model mixture
of oleic acid/squalene (50% w/w). This is the same mixture which was used in Chapter 2 to
evaluate the separation performance of commercial reverse osmosis membranes alone, in order to
be able to compare results.
The performance of these membranes for fractionation of a model mixture was expressed in terms
of selectivity of one component towards the other, αi/j, defined as:
0
5
10
15
20
25
30
35
40
45
0 0,5 1 1,5 2 2,5
CO
2 Fl
ow
(g/
min
)
ΔP (MPa)
AD [BMIM][NTf2]
CA [BMIM][DCA
Polyamide AD
Cellulose Acetate
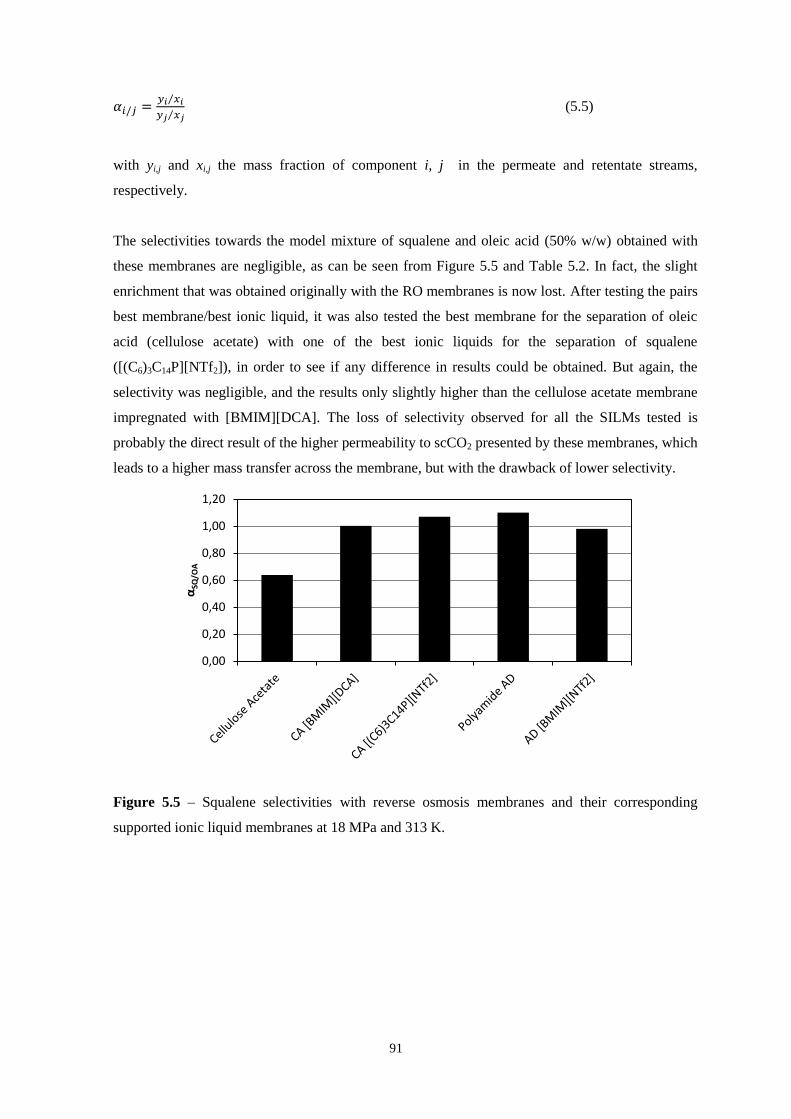
91
(5.5)
with yi,j and xi,j the mass fraction of component i, j in the permeate and retentate streams,
respectively.
The selectivities towards the model mixture of squalene and oleic acid (50% w/w) obtained with
these membranes are negligible, as can be seen from Figure 5.5 and Table 5.2. In fact, the slight
enrichment that was obtained originally with the RO membranes is now lost. After testing the pairs
best membrane/best ionic liquid, it was also tested the best membrane for the separation of oleic
acid (cellulose acetate) with one of the best ionic liquids for the separation of squalene
([(C6)3C14P][NTf2]), in order to see if any difference in results could be obtained. But again, the
selectivity was negligible, and the results only slightly higher than the cellulose acetate membrane
impregnated with [BMIM][DCA]. The loss of selectivity observed for all the SILMs tested is
probably the direct result of the higher permeability to scCO2 presented by these membranes, which
leads to a higher mass transfer across the membrane, but with the drawback of lower selectivity.
Figure 5.5 – Squalene selectivities with reverse osmosis membranes and their corresponding
supported ionic liquid membranes at 18 MPa and 313 K.
0,00
0,20
0,40
0,60
0,80
1,00
1,20
αSQ
/OA
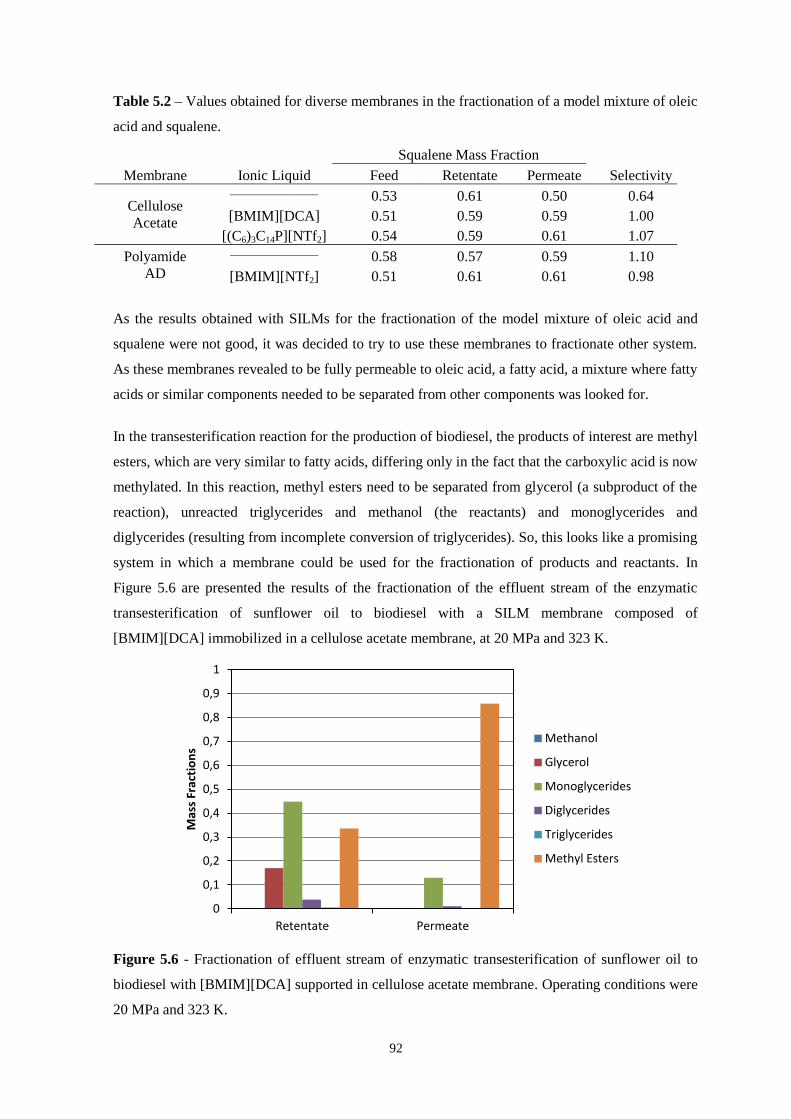
92
Table 5.2 – Values obtained for diverse membranes in the fractionation of a model mixture of oleic
acid and squalene.
Squalene Mass Fraction
Membrane Ionic Liquid Feed Retentate Permeate Selectivity
Cellulose
Acetate
___________________ 0.53 0.61 0.50 0.64
[BMIM][DCA] 0.51 0.59 0.59 1.00
[(C6)3C14P][NTf2] 0.54 0.59 0.61 1.07
Polyamide
AD
___________________ 0.58 0.57 0.59 1.10
[BMIM][NTf2] 0.51 0.61 0.61 0.98
As the results obtained with SILMs for the fractionation of the model mixture of oleic acid and
squalene were not good, it was decided to try to use these membranes to fractionate other system.
As these membranes revealed to be fully permeable to oleic acid, a fatty acid, a mixture where fatty
acids or similar components needed to be separated from other components was looked for.
In the transesterification reaction for the production of biodiesel, the products of interest are methyl
esters, which are very similar to fatty acids, differing only in the fact that the carboxylic acid is now
methylated. In this reaction, methyl esters need to be separated from glycerol (a subproduct of the
reaction), unreacted triglycerides and methanol (the reactants) and monoglycerides and
diglycerides (resulting from incomplete conversion of triglycerides). So, this looks like a promising
system in which a membrane could be used for the fractionation of products and reactants. In
Figure 5.6 are presented the results of the fractionation of the effluent stream of the enzymatic
transesterification of sunflower oil to biodiesel with a SILM membrane composed of
[BMIM][DCA] immobilized in a cellulose acetate membrane, at 20 MPa and 323 K.
Figure 5.6 - Fractionation of effluent stream of enzymatic transesterification of sunflower oil to
biodiesel with [BMIM][DCA] supported in cellulose acetate membrane. Operating conditions were
20 MPa and 323 K.
0
0,1
0,2
0,3
0,4
0,5
0,6
0,7
0,8
0,9
1
Retentate Permeate
Mas
s Fr
acti
on
s
Methanol
Glycerol
Monoglycerides
Diglycerides
Triglycerides
Methyl Esters
93
From Figure 5.6 it can be seen that triglycerides were almost completely converted to other
products, being detected only a residual amount in the retentate stream. The small portion of
diglycerides that were produced is mainly retained in the retentate side of the membrane, and
methanol was not detected. There is also a considerable portion of monoglycerides, which are
mainly retained by the membrane. As for the methyl esters, although they account still for 30% of
the retentate fraction, they constitute about 85% of the permeate stream. The selectivity of methyl
esters in relation to monoglycerides, αME/MG, the two major constituents of both permeate and
retentate, is 8.8, which is a considerable selectivity. On the other hand, glycerol was completely
retained by the membrane. So, these membranes seem to be viable for application in an integrated
process of enzymatic transesterification and fractionation in continuous operation.
As a consequence of the poor results obtained with the SILMs for the fractionation of the model
mixture of oleic acid and squalene, it was decided to try to use gel membranes to overcome these
problems. With gel membranes, it may be possible to reduce the solubility of scCO2 in the RTILs,
and consequently reduce its permeability across the membrane and increase its selectivity.
Although it was not tested for these membranes, several authors report that RTILs are displaced
from SILMs even at low pressure differences between permeate and retentate [14]. This problem
was also related to the membrane compression occurring with the application of pressure and to the
pore sizes of the membranes being used [24]. Gel membranes could also be a solution for this
problem, as the gel polymerization entraps the RTIL and difficults its displacement.
5.3.2 - Development of Ion-Jelly® Membranes prepared by evaporative casting-knife method
5.3.2.1 - Traction
The stress-strain curves in Figure 5.7 indicate that the membrane prepared only with gelatine has a
higher tolerance to stress than the ones prepared with Ion-Jelly®. It is also seen that the tolerance to
stress in Ion-Jelly® membranes is very similar to that of cellulose alone, but the presence of Ion-
Jelly® allows it to sustain higher strains. Additionally, by increasing the amount of Ion-Jelly
® used,
the tolerance to stress also increases.
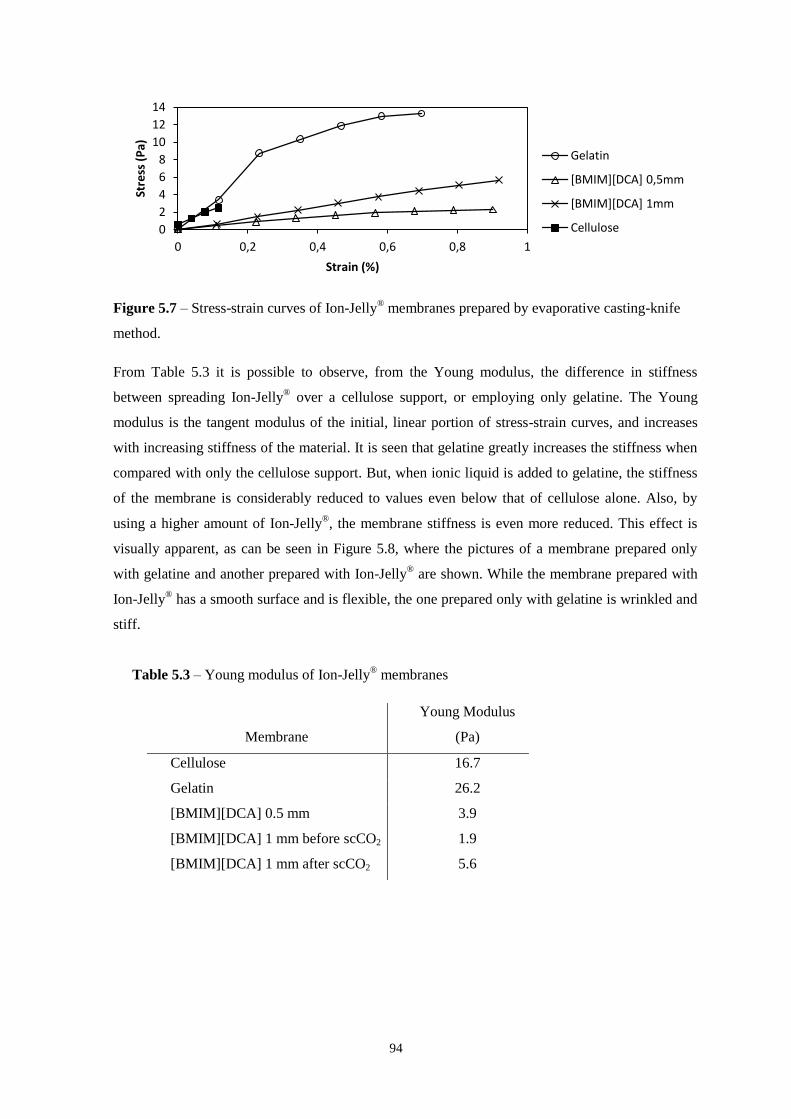
94
Figure 5.7 – Stress-strain curves of Ion-Jelly® membranes prepared by evaporative casting-knife
method.
From Table 5.3 it is possible to observe, from the Young modulus, the difference in stiffness
between spreading Ion-Jelly® over a cellulose support, or employing only gelatine. The Young
modulus is the tangent modulus of the initial, linear portion of stress-strain curves, and increases
with increasing stiffness of the material. It is seen that gelatine greatly increases the stiffness when
compared with only the cellulose support. But, when ionic liquid is added to gelatine, the stiffness
of the membrane is considerably reduced to values even below that of cellulose alone. Also, by
using a higher amount of Ion-Jelly®, the membrane stiffness is even more reduced. This effect is
visually apparent, as can be seen in Figure 5.8, where the pictures of a membrane prepared only
with gelatine and another prepared with Ion-Jelly® are shown. While the membrane prepared with
Ion-Jelly® has a smooth surface and is flexible, the one prepared only with gelatine is wrinkled and
stiff.
Table 5.3 – Young modulus of Ion-Jelly® membranes
0
2
4
6
8
10
12
14
0 0,2 0,4 0,6 0,8 1
Stre
ss (
Pa)
Strain (%)
Gelatin
[BMIM][DCA] 0,5mm
[BMIM][DCA] 1mm
Cellulose
Membrane
Young Modulus
(Pa)
Cellulose 16.7
Gelatin 26.2
[BMIM][DCA] 0.5 mm 3.9
[BMIM][DCA] 1 mm before scCO2 1.9
[BMIM][DCA] 1 mm after scCO2 5.6
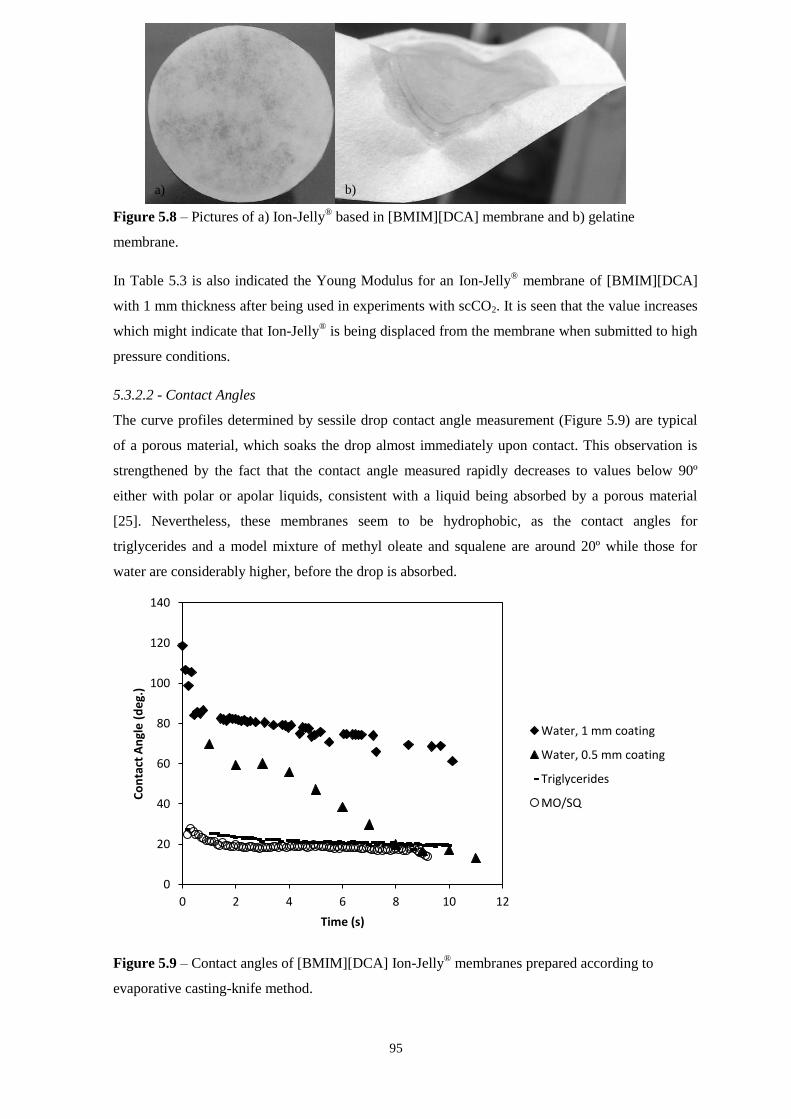
95
Figure 5.8 – Pictures of a) Ion-Jelly® based in [BMIM][DCA] membrane and b) gelatine
membrane.
In Table 5.3 is also indicated the Young Modulus for an Ion-Jelly® membrane of [BMIM][DCA]
with 1 mm thickness after being used in experiments with scCO2. It is seen that the value increases
which might indicate that Ion-Jelly® is being displaced from the membrane when submitted to high
pressure conditions.
5.3.2.2 - Contact Angles
The curve profiles determined by sessile drop contact angle measurement (Figure 5.9) are typical
of a porous material, which soaks the drop almost immediately upon contact. This observation is
strengthened by the fact that the contact angle measured rapidly decreases to values below 90º
either with polar or apolar liquids, consistent with a liquid being absorbed by a porous material
[25]. Nevertheless, these membranes seem to be hydrophobic, as the contact angles for
triglycerides and a model mixture of methyl oleate and squalene are around 20º while those for
water are considerably higher, before the drop is absorbed.
Figure 5.9 – Contact angles of [BMIM][DCA] Ion-Jelly® membranes prepared according to
evaporative casting-knife method.
0
20
40
60
80
100
120
140
0 2 4 6 8 10 12
Co
nta
ct A
ngl
e (
de
g.)
Time (s)
Water, 1 mm coating
Water, 0.5 mm coating
Triglycerides
MO/SQ
a) b)
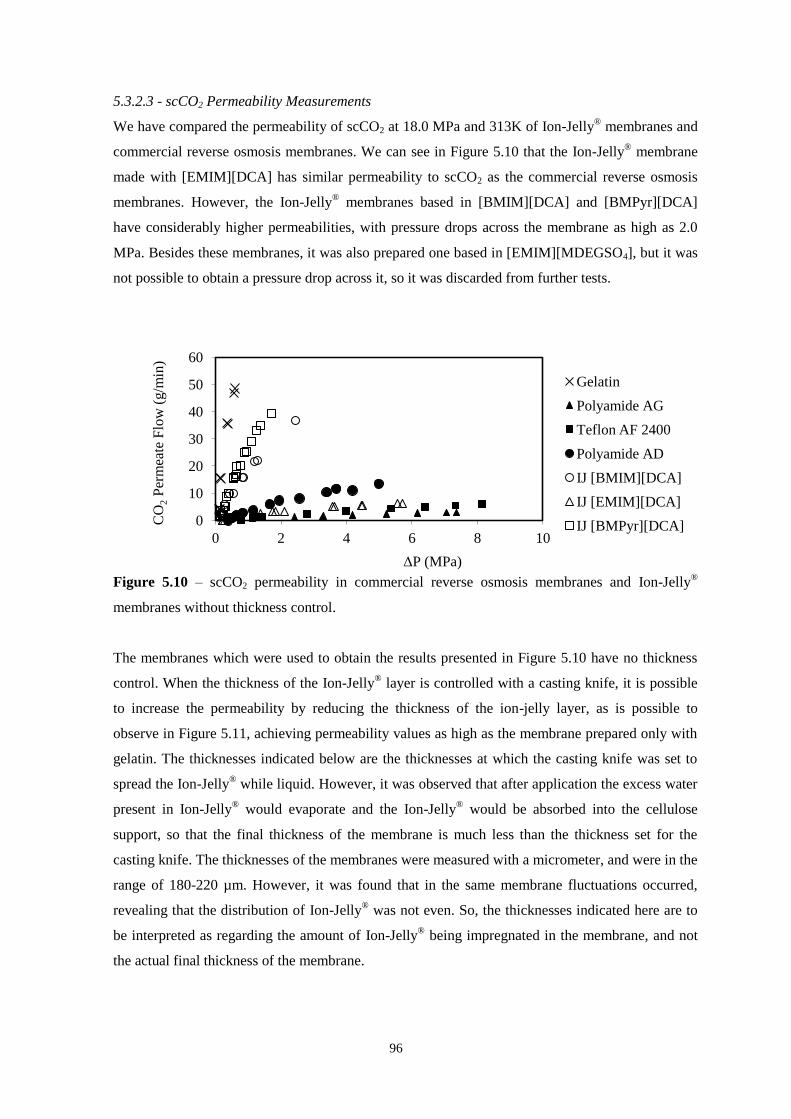
96
5.3.2.3 - scCO2 Permeability Measurements
We have compared the permeability of scCO2 at 18.0 MPa and 313K of Ion-Jelly® membranes and
commercial reverse osmosis membranes. We can see in Figure 5.10 that the Ion-Jelly® membrane
made with [EMIM][DCA] has similar permeability to scCO2 as the commercial reverse osmosis
membranes. However, the Ion-Jelly® membranes based in [BMIM][DCA] and [BMPyr][DCA]
have considerably higher permeabilities, with pressure drops across the membrane as high as 2.0
MPa. Besides these membranes, it was also prepared one based in [EMIM][MDEGSO4], but it was
not possible to obtain a pressure drop across it, so it was discarded from further tests.
Figure 5.10 – scCO2 permeability in commercial reverse osmosis membranes and Ion-Jelly®
membranes without thickness control.
The membranes which were used to obtain the results presented in Figure 5.10 have no thickness
control. When the thickness of the Ion-Jelly® layer is controlled with a casting knife, it is possible
to increase the permeability by reducing the thickness of the ion-jelly layer, as is possible to
observe in Figure 5.11, achieving permeability values as high as the membrane prepared only with
gelatin. The thicknesses indicated below are the thicknesses at which the casting knife was set to
spread the Ion-Jelly® while liquid. However, it was observed that after application the excess water
present in Ion-Jelly® would evaporate and the Ion-Jelly
® would be absorbed into the cellulose
support, so that the final thickness of the membrane is much less than the thickness set for the
casting knife. The thicknesses of the membranes were measured with a micrometer, and were in the
range of 180-220 µm. However, it was found that in the same membrane fluctuations occurred,
revealing that the distribution of Ion-Jelly® was not even. So, the thicknesses indicated here are to
be interpreted as regarding the amount of Ion-Jelly® being impregnated in the membrane, and not
the actual final thickness of the membrane.
0
10
20
30
40
50
60
0 2 4 6 8 10
CO
2 P
erm
eate
Flo
w (
g/m
in)
ΔP (MPa)
Gelatin
Polyamide AG
Teflon AF 2400
Polyamide AD
IJ [BMIM][DCA]
IJ [EMIM][DCA]
IJ [BMPyr][DCA]
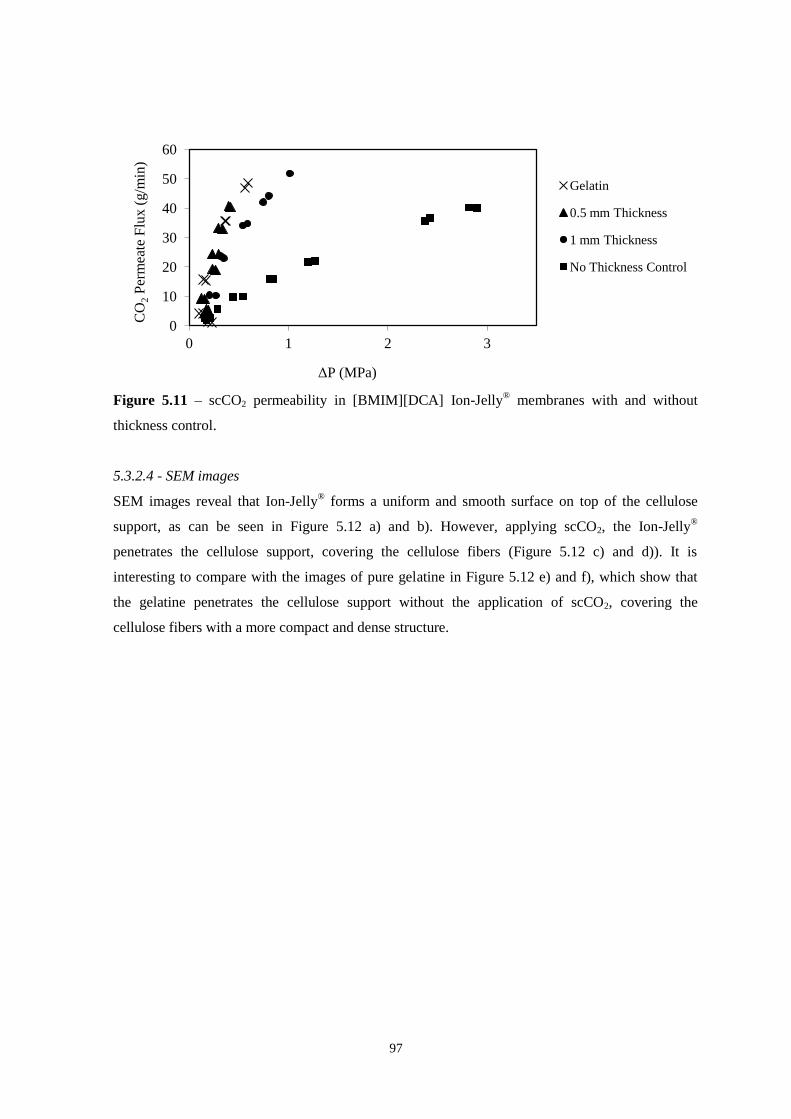
97
Figure 5.11 – scCO2 permeability in [BMIM][DCA] Ion-Jelly® membranes with and without
thickness control.
5.3.2.4 - SEM images
SEM images reveal that Ion-Jelly® forms a uniform and smooth surface on top of the cellulose
support, as can be seen in Figure 5.12 a) and b). However, applying scCO2, the Ion-Jelly®
penetrates the cellulose support, covering the cellulose fibers (Figure 5.12 c) and d)). It is
interesting to compare with the images of pure gelatine in Figure 5.12 e) and f), which show that
the gelatine penetrates the cellulose support without the application of scCO2, covering the
cellulose fibers with a more compact and dense structure.
0
10
20
30
40
50
60
0 1 2 3
CO
2 P
erm
eate
Flu
x (
g/m
in)
ΔP (MPa)
Gelatin
0.5 mm Thickness
1 mm Thickness
No Thickness Control
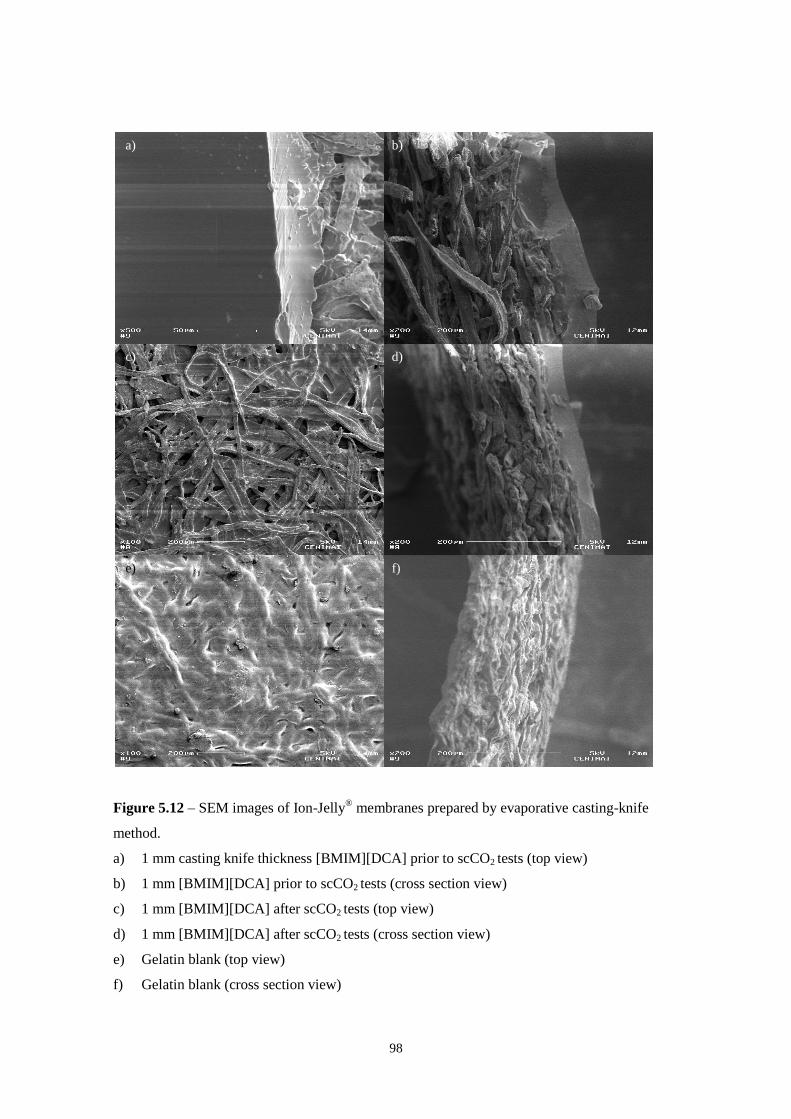
98
Figure 5.12 – SEM images of Ion-Jelly® membranes prepared by evaporative casting-knife
method.
a) 1 mm casting knife thickness [BMIM][DCA] prior to scCO2 tests (top view)
b) 1 mm [BMIM][DCA] prior to scCO2 tests (cross section view)
c) 1 mm [BMIM][DCA] after scCO2 tests (top view)
d) 1 mm [BMIM][DCA] after scCO2 tests (cross section view)
e) Gelatin blank (top view)
f) Gelatin blank (cross section view)
a) b)
c) d)
e) f)
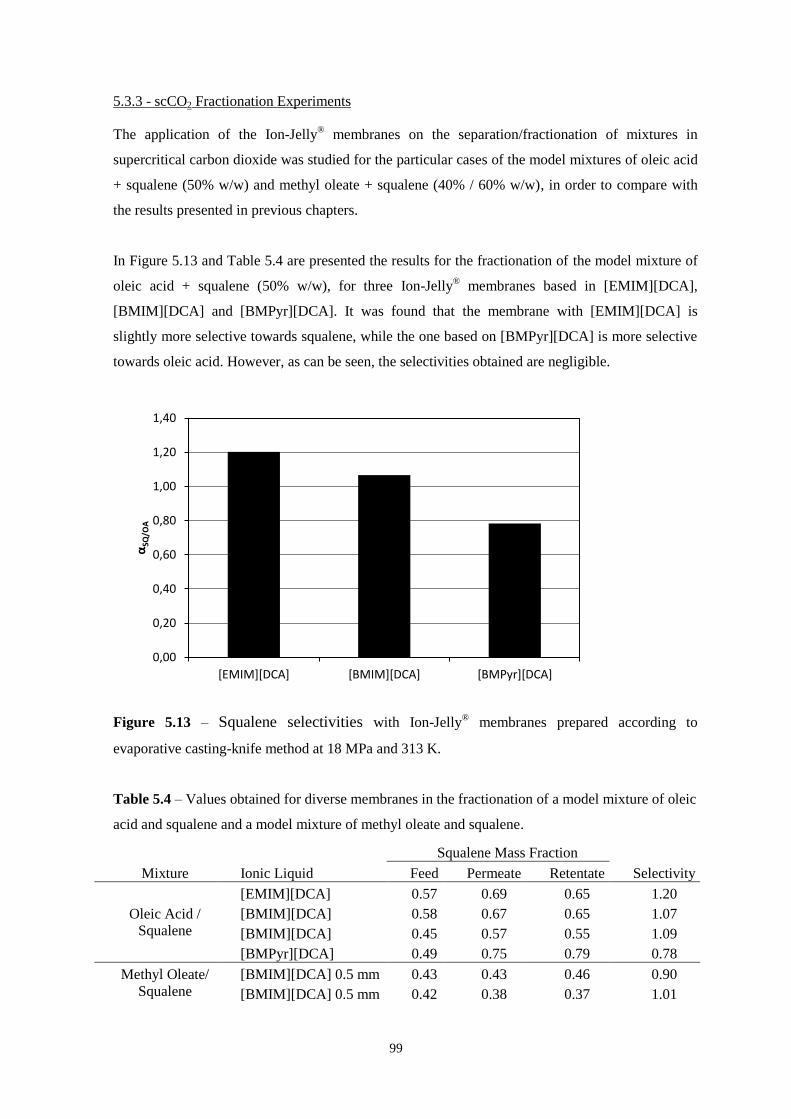
99
5.3.3 - scCO2 Fractionation Experiments
The application of the Ion-Jelly® membranes on the separation/fractionation of mixtures in
supercritical carbon dioxide was studied for the particular cases of the model mixtures of oleic acid
+ squalene (50% w/w) and methyl oleate + squalene (40% / 60% w/w), in order to compare with
the results presented in previous chapters.
In Figure 5.13 and Table 5.4 are presented the results for the fractionation of the model mixture of
oleic acid + squalene (50% w/w), for three Ion-Jelly® membranes based in [EMIM][DCA],
[BMIM][DCA] and [BMPyr][DCA]. It was found that the membrane with [EMIM][DCA] is
slightly more selective towards squalene, while the one based on [BMPyr][DCA] is more selective
towards oleic acid. However, as can be seen, the selectivities obtained are negligible.
Figure 5.13 – Squalene selectivities with Ion-Jelly® membranes prepared according to
evaporative casting-knife method at 18 MPa and 313 K.
Table 5.4 – Values obtained for diverse membranes in the fractionation of a model mixture of oleic
acid and squalene and a model mixture of methyl oleate and squalene.
Squalene Mass Fraction
Mixture Ionic Liquid Feed Permeate Retentate Selectivity
Oleic Acid /
Squalene
[EMIM][DCA] 0.57 0.69 0.65 1.20
[BMIM][DCA] 0.58 0.67 0.65 1.07
[BMIM][DCA] 0.45 0.57 0.55 1.09
[BMPyr][DCA] 0.49 0.75 0.79 0.78
Methyl Oleate/
Squalene
[BMIM][DCA] 0.5 mm 0.43 0.43 0.46 0.90
[BMIM][DCA] 0.5 mm 0.42 0.38 0.37 1.01
0,00
0,20
0,40
0,60
0,80
1,00
1,20
1,40
[EMIM][DCA] [BMIM][DCA] [BMPyr][DCA]
αSQ
/OA
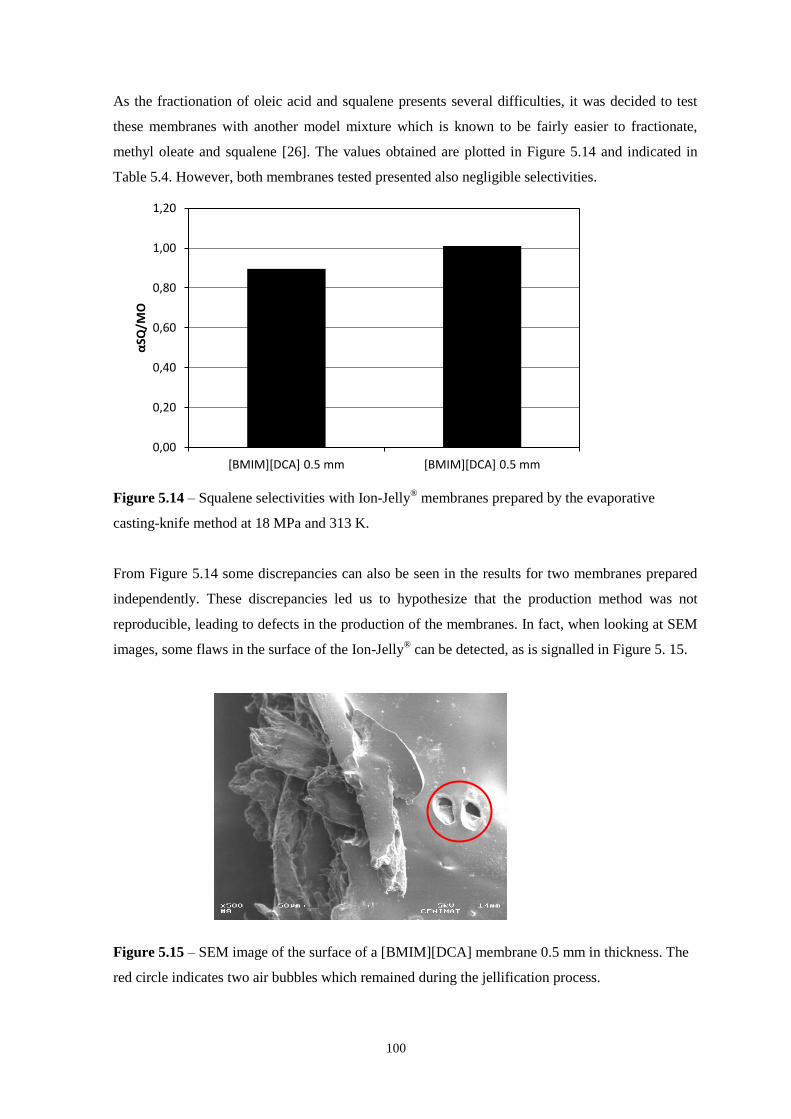
100
As the fractionation of oleic acid and squalene presents several difficulties, it was decided to test
these membranes with another model mixture which is known to be fairly easier to fractionate,
methyl oleate and squalene [26]. The values obtained are plotted in Figure 5.14 and indicated in
Table 5.4. However, both membranes tested presented also negligible selectivities.
Figure 5.14 – Squalene selectivities with Ion-Jelly® membranes prepared by the evaporative
casting-knife method at 18 MPa and 313 K.
From Figure 5.14 some discrepancies can also be seen in the results for two membranes prepared
independently. These discrepancies led us to hypothesize that the production method was not
reproducible, leading to defects in the production of the membranes. In fact, when looking at SEM
images, some flaws in the surface of the Ion-Jelly® can be detected, as is signalled in Figure 5. 15.
Figure 5.15 – SEM image of the surface of a [BMIM][DCA] membrane 0.5 mm in thickness. The
red circle indicates two air bubbles which remained during the jellification process.
0,00
0,20
0,40
0,60
0,80
1,00
1,20
[BMIM][DCA] 0.5 mm [BMIM][DCA] 0.5 mm
αSQ
/MO
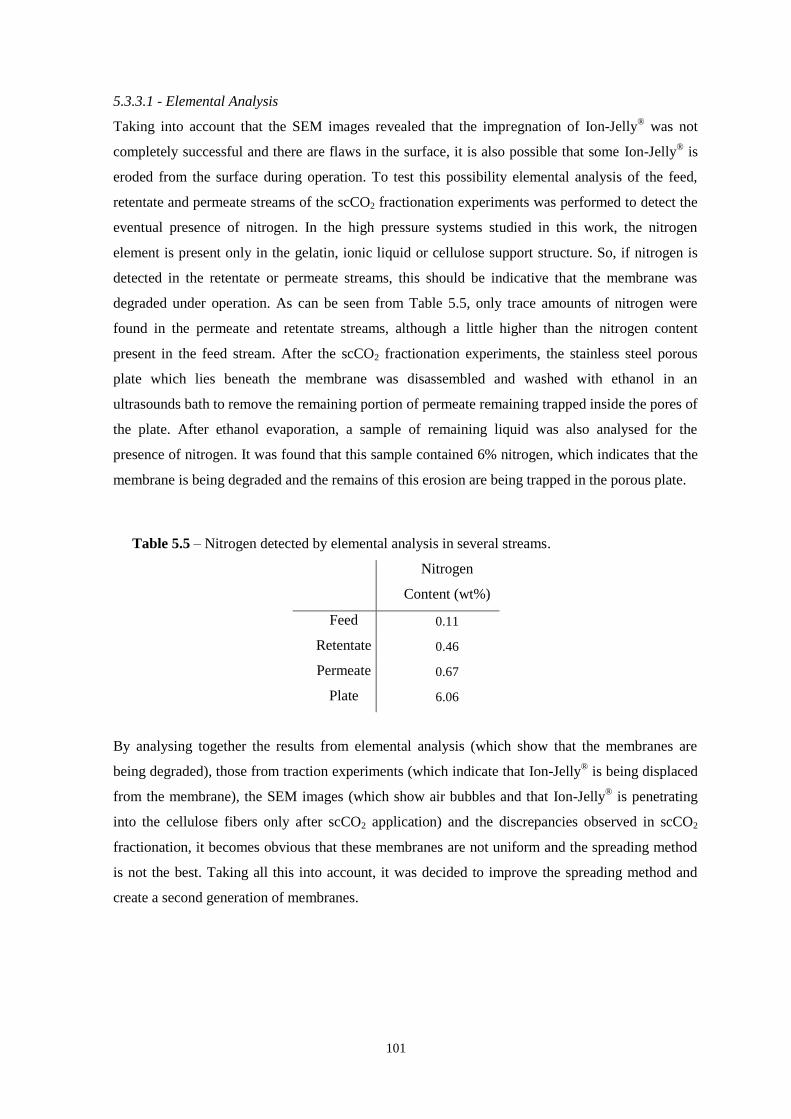
101
5.3.3.1 - Elemental Analysis
Taking into account that the SEM images revealed that the impregnation of Ion-Jelly® was not
completely successful and there are flaws in the surface, it is also possible that some Ion-Jelly® is
eroded from the surface during operation. To test this possibility elemental analysis of the feed,
retentate and permeate streams of the scCO2 fractionation experiments was performed to detect the
eventual presence of nitrogen. In the high pressure systems studied in this work, the nitrogen
element is present only in the gelatin, ionic liquid or cellulose support structure. So, if nitrogen is
detected in the retentate or permeate streams, this should be indicative that the membrane was
degraded under operation. As can be seen from Table 5.5, only trace amounts of nitrogen were
found in the permeate and retentate streams, although a little higher than the nitrogen content
present in the feed stream. After the scCO2 fractionation experiments, the stainless steel porous
plate which lies beneath the membrane was disassembled and washed with ethanol in an
ultrasounds bath to remove the remaining portion of permeate remaining trapped inside the pores of
the plate. After ethanol evaporation, a sample of remaining liquid was also analysed for the
presence of nitrogen. It was found that this sample contained 6% nitrogen, which indicates that the
membrane is being degraded and the remains of this erosion are being trapped in the porous plate.
Table 5.5 – Nitrogen detected by elemental analysis in several streams.
Nitrogen
Content (wt%)
Feed 0.11
Retentate 0.46
Permeate 0.67
Plate 6.06
By analysing together the results from elemental analysis (which show that the membranes are
being degraded), those from traction experiments (which indicate that Ion-Jelly® is being displaced
from the membrane), the SEM images (which show air bubbles and that Ion-Jelly® is penetrating
into the cellulose fibers only after scCO2 application) and the discrepancies observed in scCO2
fractionation, it becomes obvious that these membranes are not uniform and the spreading method
is not the best. Taking all this into account, it was decided to improve the spreading method and
create a second generation of membranes.
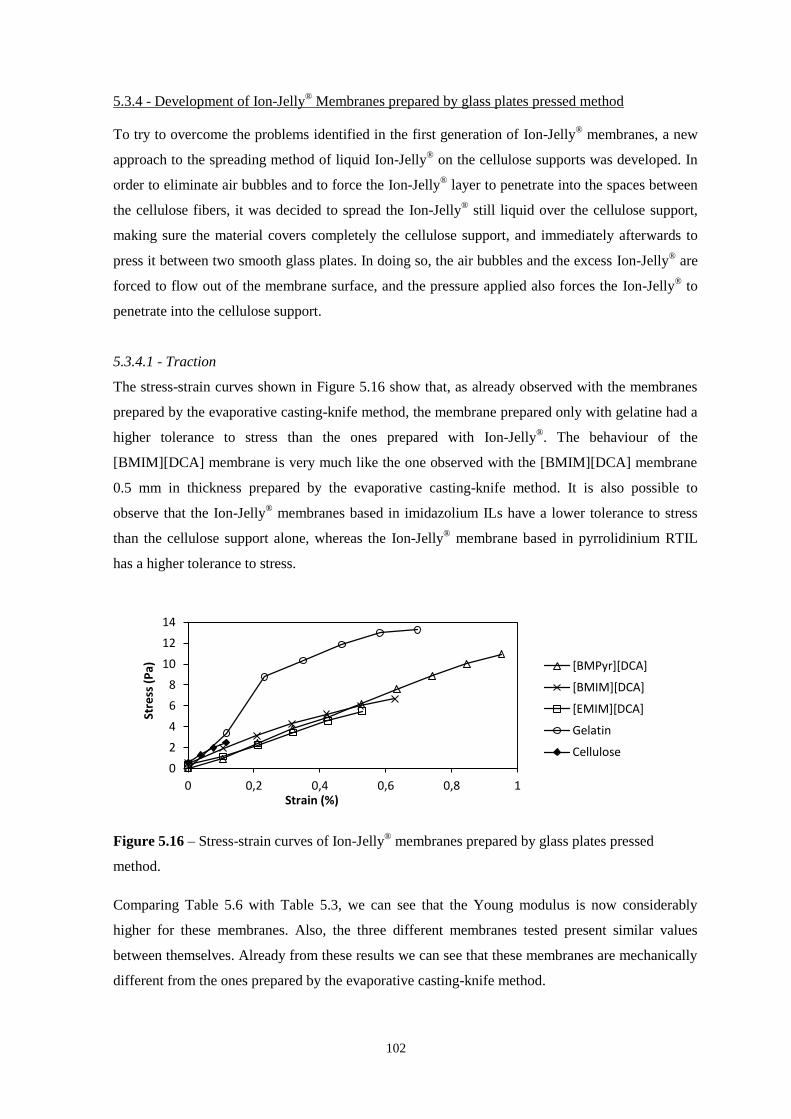
102
5.3.4 - Development of Ion-Jelly® Membranes prepared by glass plates pressed method
To try to overcome the problems identified in the first generation of Ion-Jelly® membranes, a new
approach to the spreading method of liquid Ion-Jelly® on the cellulose supports was developed. In
order to eliminate air bubbles and to force the Ion-Jelly® layer to penetrate into the spaces between
the cellulose fibers, it was decided to spread the Ion-Jelly® still liquid over the cellulose support,
making sure the material covers completely the cellulose support, and immediately afterwards to
press it between two smooth glass plates. In doing so, the air bubbles and the excess Ion-Jelly® are
forced to flow out of the membrane surface, and the pressure applied also forces the Ion-Jelly® to
penetrate into the cellulose support.
5.3.4.1 - Traction
The stress-strain curves shown in Figure 5.16 show that, as already observed with the membranes
prepared by the evaporative casting-knife method, the membrane prepared only with gelatine had a
higher tolerance to stress than the ones prepared with Ion-Jelly®. The behaviour of the
[BMIM][DCA] membrane is very much like the one observed with the [BMIM][DCA] membrane
0.5 mm in thickness prepared by the evaporative casting-knife method. It is also possible to
observe that the Ion-Jelly® membranes based in imidazolium ILs have a lower tolerance to stress
than the cellulose support alone, whereas the Ion-Jelly® membrane based in pyrrolidinium RTIL
has a higher tolerance to stress.
Figure 5.16 – Stress-strain curves of Ion-Jelly® membranes prepared by glass plates pressed
method.
Comparing Table 5.6 with Table 5.3, we can see that the Young modulus is now considerably
higher for these membranes. Also, the three different membranes tested present similar values
between themselves. Already from these results we can see that these membranes are mechanically
different from the ones prepared by the evaporative casting-knife method.
0
2
4
6
8
10
12
14
0 0,2 0,4 0,6 0,8 1
Stre
ss (
Pa)
Strain (%)
[BMPyr][DCA]
[BMIM][DCA]
[EMIM][DCA]
Gelatin
Cellulose
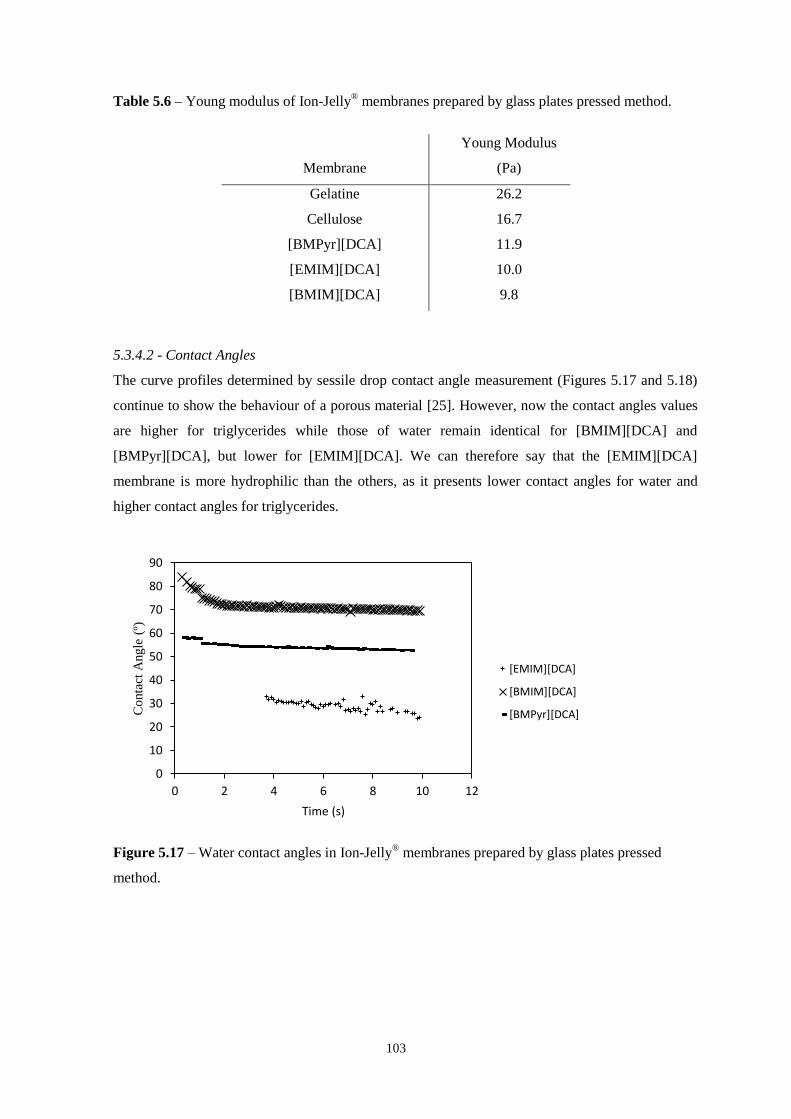
103
Table 5.6 – Young modulus of Ion-Jelly® membranes prepared by glass plates pressed method.
5.3.4.2 - Contact Angles
The curve profiles determined by sessile drop contact angle measurement (Figures 5.17 and 5.18)
continue to show the behaviour of a porous material [25]. However, now the contact angles values
are higher for triglycerides while those of water remain identical for [BMIM][DCA] and
[BMPyr][DCA], but lower for [EMIM][DCA]. We can therefore say that the [EMIM][DCA]
membrane is more hydrophilic than the others, as it presents lower contact angles for water and
higher contact angles for triglycerides.
Figure 5.17 – Water contact angles in Ion-Jelly® membranes prepared by glass plates pressed
method.
0
10
20
30
40
50
60
70
80
90
0 2 4 6 8 10 12
Co
nta
ct A
ngle
(º)
Time (s)
[EMIM][DCA]
[BMIM][DCA]
[BMPyr][DCA]
Membrane
Young Modulus
(Pa)
Gelatine 26.2
Cellulose 16.7
[BMPyr][DCA] 11.9
[EMIM][DCA] 10.0
[BMIM][DCA] 9.8
b)
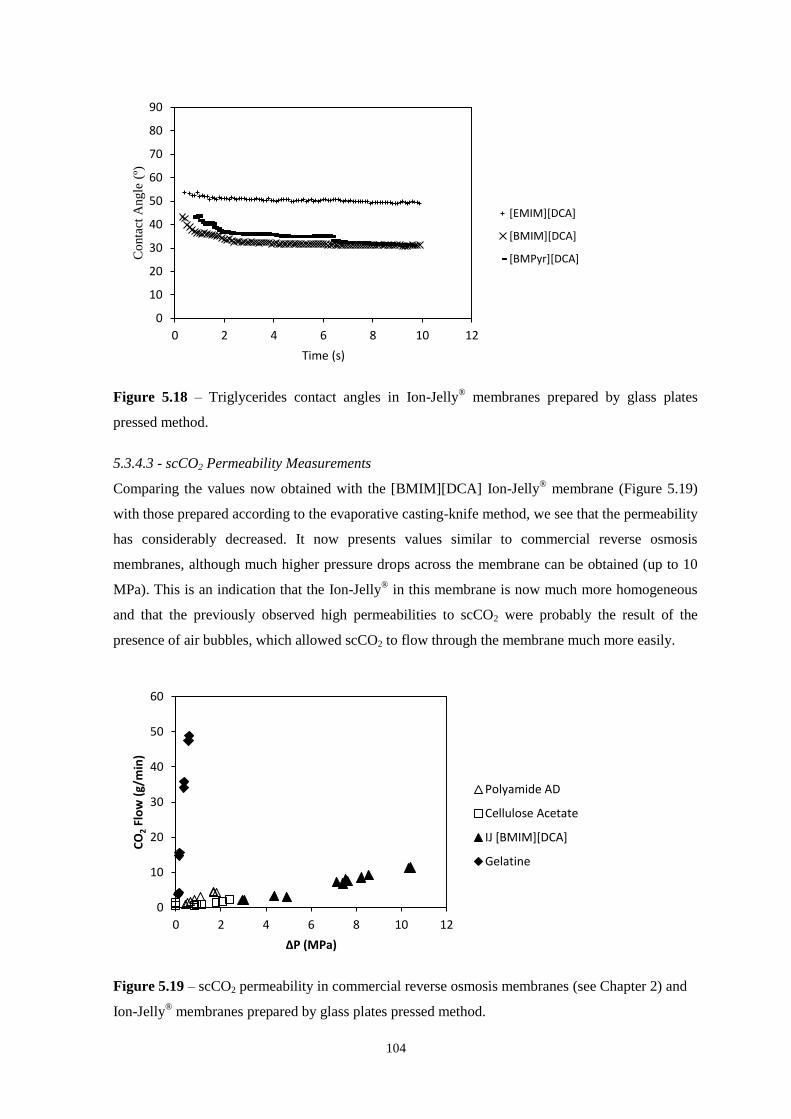
104
Figure 5.18 – Triglycerides contact angles in Ion-Jelly® membranes prepared by glass plates
pressed method.
5.3.4.3 - scCO2 Permeability Measurements
Comparing the values now obtained with the [BMIM][DCA] Ion-Jelly® membrane (Figure 5.19)
with those prepared according to the evaporative casting-knife method, we see that the permeability
has considerably decreased. It now presents values similar to commercial reverse osmosis
membranes, although much higher pressure drops across the membrane can be obtained (up to 10
MPa). This is an indication that the Ion-Jelly® in this membrane is now much more homogeneous
and that the previously observed high permeabilities to scCO2 were probably the result of the
presence of air bubbles, which allowed scCO2 to flow through the membrane much more easily.
Figure 5.19 – scCO2 permeability in commercial reverse osmosis membranes (see Chapter 2) and
Ion-Jelly® membranes prepared by glass plates pressed method.
0
10
20
30
40
50
60
70
80
90
0 2 4 6 8 10 12
Co
nta
ct A
ngle
(º)
Time (s)
[EMIM][DCA]
[BMIM][DCA]
[BMPyr][DCA]
0
10
20
30
40
50
60
0 2 4 6 8 10 12
CO
2 Fl
ow
(g/
min
)
ΔP (MPa)
Polyamide AD
Cellulose Acetate
IJ [BMIM][DCA]
Gelatine
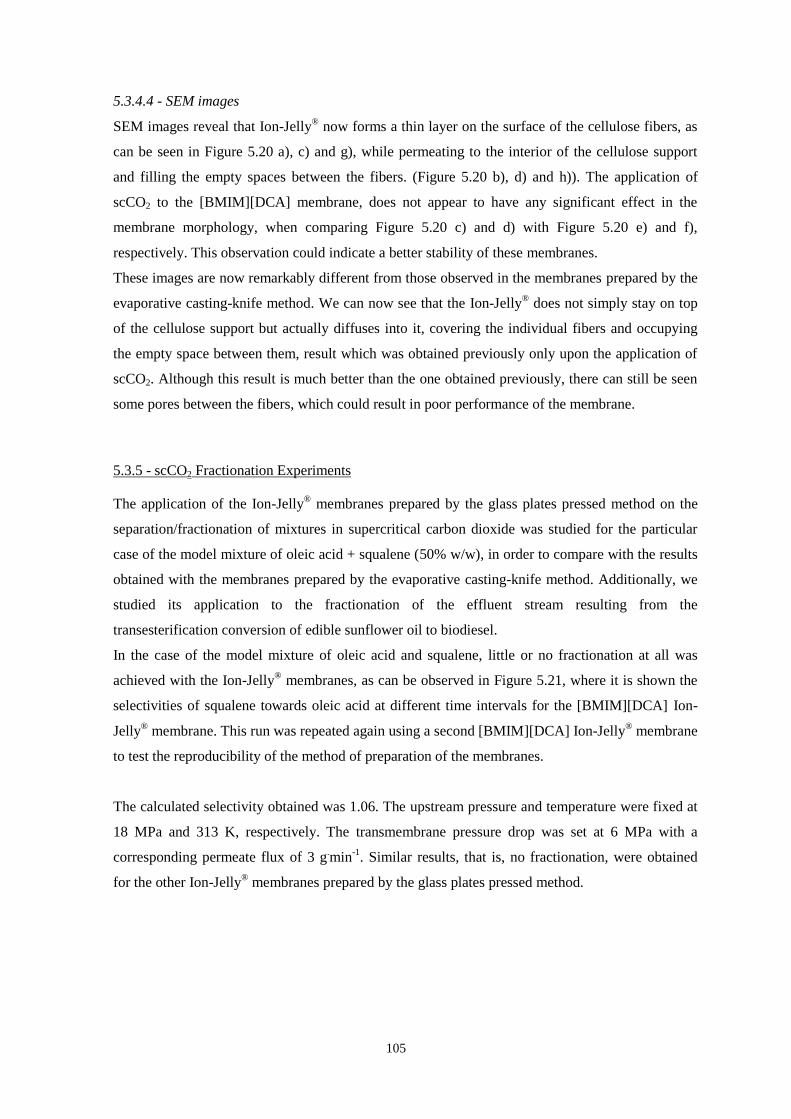
105
5.3.4.4 - SEM images
SEM images reveal that Ion-Jelly® now forms a thin layer on the surface of the cellulose fibers, as
can be seen in Figure 5.20 a), c) and g), while permeating to the interior of the cellulose support
and filling the empty spaces between the fibers. (Figure 5.20 b), d) and h)). The application of
scCO2 to the [BMIM][DCA] membrane, does not appear to have any significant effect in the
membrane morphology, when comparing Figure 5.20 c) and d) with Figure 5.20 e) and f),
respectively. This observation could indicate a better stability of these membranes.
These images are now remarkably different from those observed in the membranes prepared by the
evaporative casting-knife method. We can now see that the Ion-Jelly® does not simply stay on top
of the cellulose support but actually diffuses into it, covering the individual fibers and occupying
the empty space between them, result which was obtained previously only upon the application of
scCO2. Although this result is much better than the one obtained previously, there can still be seen
some pores between the fibers, which could result in poor performance of the membrane.
5.3.5 - scCO2 Fractionation Experiments
The application of the Ion-Jelly® membranes prepared by the glass plates pressed method on the
separation/fractionation of mixtures in supercritical carbon dioxide was studied for the particular
case of the model mixture of oleic acid + squalene (50% w/w), in order to compare with the results
obtained with the membranes prepared by the evaporative casting-knife method. Additionally, we
studied its application to the fractionation of the effluent stream resulting from the
transesterification conversion of edible sunflower oil to biodiesel.
In the case of the model mixture of oleic acid and squalene, little or no fractionation at all was
achieved with the Ion-Jelly® membranes, as can be observed in Figure 5.21, where it is shown the
selectivities of squalene towards oleic acid at different time intervals for the [BMIM][DCA] Ion-
Jelly® membrane. This run was repeated again using a second [BMIM][DCA] Ion-Jelly
® membrane
to test the reproducibility of the method of preparation of the membranes.
The calculated selectivity obtained was 1.06. The upstream pressure and temperature were fixed at
18 MPa and 313 K, respectively. The transmembrane pressure drop was set at 6 MPa with a
corresponding permeate flux of 3 g.min
-1. Similar results, that is, no fractionation, were obtained
for the other Ion-Jelly® membranes prepared by the glass plates pressed method.
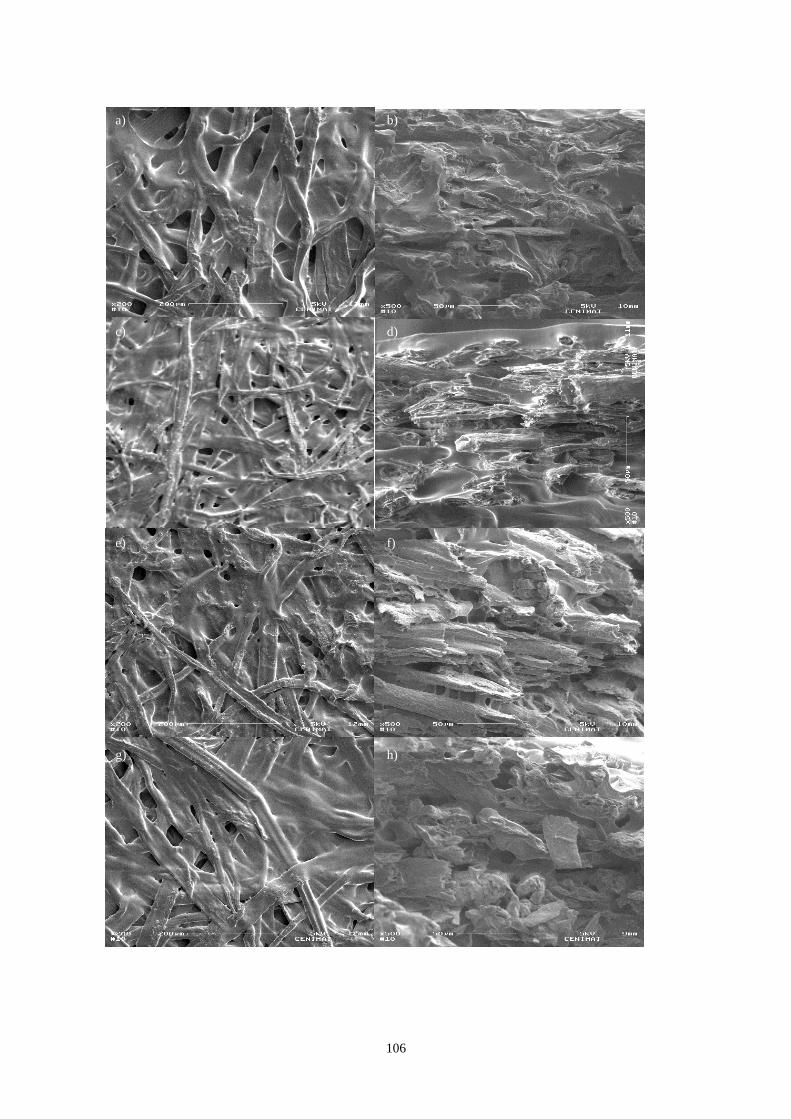
106
e) f)
a) b)
c) d)
g) h)
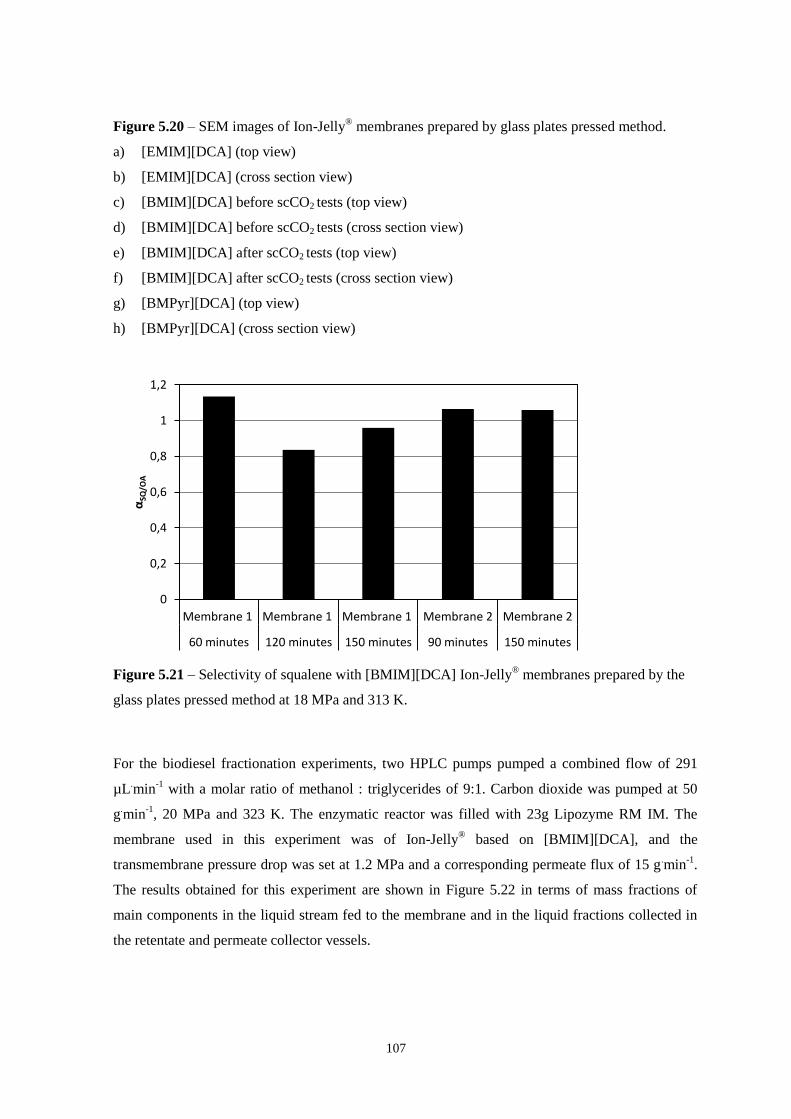
107
Figure 5.20 – SEM images of Ion-Jelly® membranes prepared by glass plates pressed method.
a) [EMIM][DCA] (top view)
b) [EMIM][DCA] (cross section view)
c) [BMIM][DCA] before scCO2 tests (top view)
d) [BMIM][DCA] before scCO2 tests (cross section view)
e) [BMIM][DCA] after scCO2 tests (top view)
f) [BMIM][DCA] after scCO2 tests (cross section view)
g) [BMPyr][DCA] (top view)
h) [BMPyr][DCA] (cross section view)
Figure 5.21 – Selectivity of squalene with [BMIM][DCA] Ion-Jelly® membranes prepared by the
glass plates pressed method at 18 MPa and 313 K.
For the biodiesel fractionation experiments, two HPLC pumps pumped a combined flow of 291
µL.min
-1 with a molar ratio of methanol : triglycerides of 9:1. Carbon dioxide was pumped at 50
g.min
-1, 20 MPa and 323 K. The enzymatic reactor was filled with 23g Lipozyme RM IM. The
membrane used in this experiment was of Ion-Jelly® based on [BMIM][DCA], and the
transmembrane pressure drop was set at 1.2 MPa and a corresponding permeate flux of 15 g.min
-1.
The results obtained for this experiment are shown in Figure 5.22 in terms of mass fractions of
main components in the liquid stream fed to the membrane and in the liquid fractions collected in
the retentate and permeate collector vessels.
0
0,2
0,4
0,6
0,8
1
1,2
Membrane 1 Membrane 1 Membrane 1 Membrane 2 Membrane 2
60 minutes 120 minutes 150 minutes 90 minutes 150 minutes
αSQ
/OA
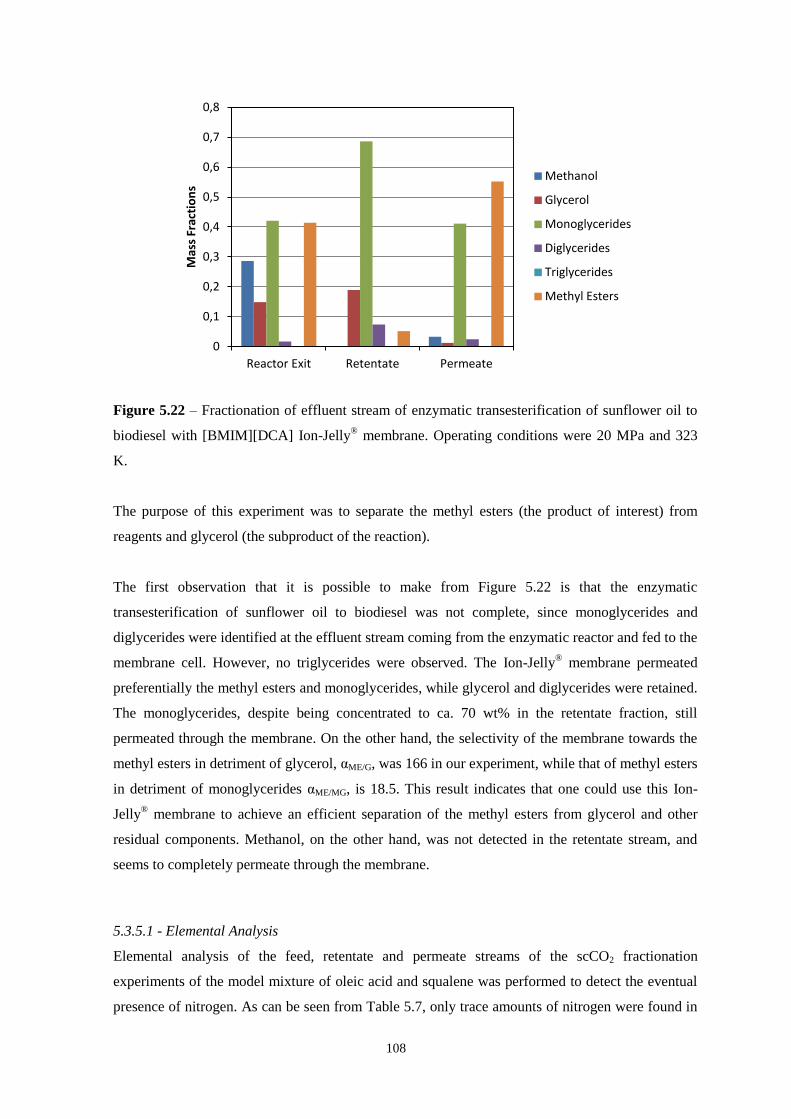
108
Figure 5.22 – Fractionation of effluent stream of enzymatic transesterification of sunflower oil to
biodiesel with [BMIM][DCA] Ion-Jelly® membrane. Operating conditions were 20 MPa and 323
K.
The purpose of this experiment was to separate the methyl esters (the product of interest) from
reagents and glycerol (the subproduct of the reaction).
The first observation that it is possible to make from Figure 5.22 is that the enzymatic
transesterification of sunflower oil to biodiesel was not complete, since monoglycerides and
diglycerides were identified at the effluent stream coming from the enzymatic reactor and fed to the
membrane cell. However, no triglycerides were observed. The Ion-Jelly® membrane permeated
preferentially the methyl esters and monoglycerides, while glycerol and diglycerides were retained.
The monoglycerides, despite being concentrated to ca. 70 wt% in the retentate fraction, still
permeated through the membrane. On the other hand, the selectivity of the membrane towards the
methyl esters in detriment of glycerol, αME/G, was 166 in our experiment, while that of methyl esters
in detriment of monoglycerides αME/MG, is 18.5. This result indicates that one could use this Ion-
Jelly® membrane to achieve an efficient separation of the methyl esters from glycerol and other
residual components. Methanol, on the other hand, was not detected in the retentate stream, and
seems to completely permeate through the membrane.
5.3.5.1 - Elemental Analysis
Elemental analysis of the feed, retentate and permeate streams of the scCO2 fractionation
experiments of the model mixture of oleic acid and squalene was performed to detect the eventual
presence of nitrogen. As can be seen from Table 5.7, only trace amounts of nitrogen were found in
0
0,1
0,2
0,3
0,4
0,5
0,6
0,7
0,8
Reactor Exit Retentate Permeate
Mas
s Fr
acti
on
s Methanol
Glycerol
Monoglycerides
Diglycerides
Triglycerides
Methyl Esters
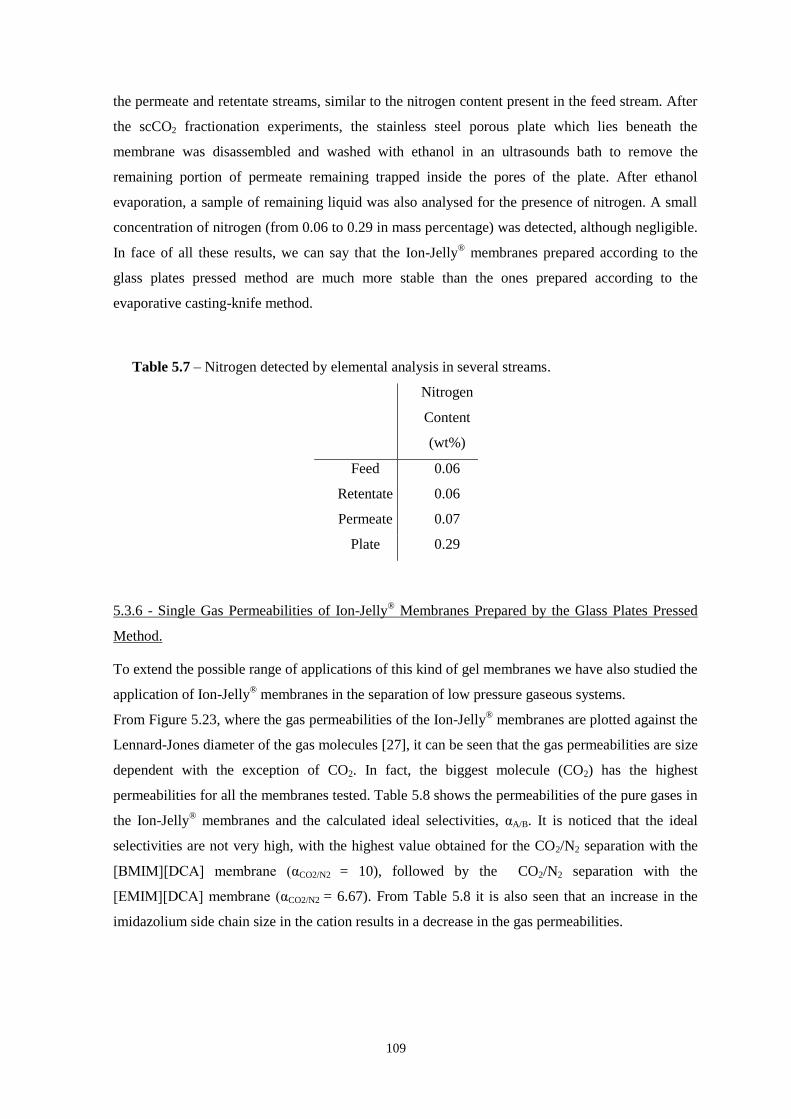
109
the permeate and retentate streams, similar to the nitrogen content present in the feed stream. After
the scCO2 fractionation experiments, the stainless steel porous plate which lies beneath the
membrane was disassembled and washed with ethanol in an ultrasounds bath to remove the
remaining portion of permeate remaining trapped inside the pores of the plate. After ethanol
evaporation, a sample of remaining liquid was also analysed for the presence of nitrogen. A small
concentration of nitrogen (from 0.06 to 0.29 in mass percentage) was detected, although negligible.
In face of all these results, we can say that the Ion-Jelly® membranes prepared according to the
glass plates pressed method are much more stable than the ones prepared according to the
evaporative casting-knife method.
Table 5.7 – Nitrogen detected by elemental analysis in several streams.
Nitrogen
Content
(wt%)
Feed 0.06
Retentate 0.06
Permeate 0.07
Plate 0.29
5.3.6 - Single Gas Permeabilities of Ion-Jelly® Membranes Prepared by the Glass Plates Pressed
Method.
To extend the possible range of applications of this kind of gel membranes we have also studied the
application of Ion-Jelly® membranes in the separation of low pressure gaseous systems.
From Figure 5.23, where the gas permeabilities of the Ion-Jelly® membranes are plotted against the
Lennard-Jones diameter of the gas molecules [27], it can be seen that the gas permeabilities are size
dependent with the exception of CO2. In fact, the biggest molecule (CO2) has the highest
permeabilities for all the membranes tested. Table 5.8 shows the permeabilities of the pure gases in
the Ion-Jelly® membranes and the calculated ideal selectivities, αA/B. It is noticed that the ideal
selectivities are not very high, with the highest value obtained for the CO2/N2 separation with the
[BMIM][DCA] membrane (αCO2/N2 = 10), followed by the CO2/N2 separation with the
[EMIM][DCA] membrane (αCO2/N2 = 6.67). From Table 5.8 it is also seen that an increase in the
imidazolium side chain size in the cation results in a decrease in the gas permeabilities.
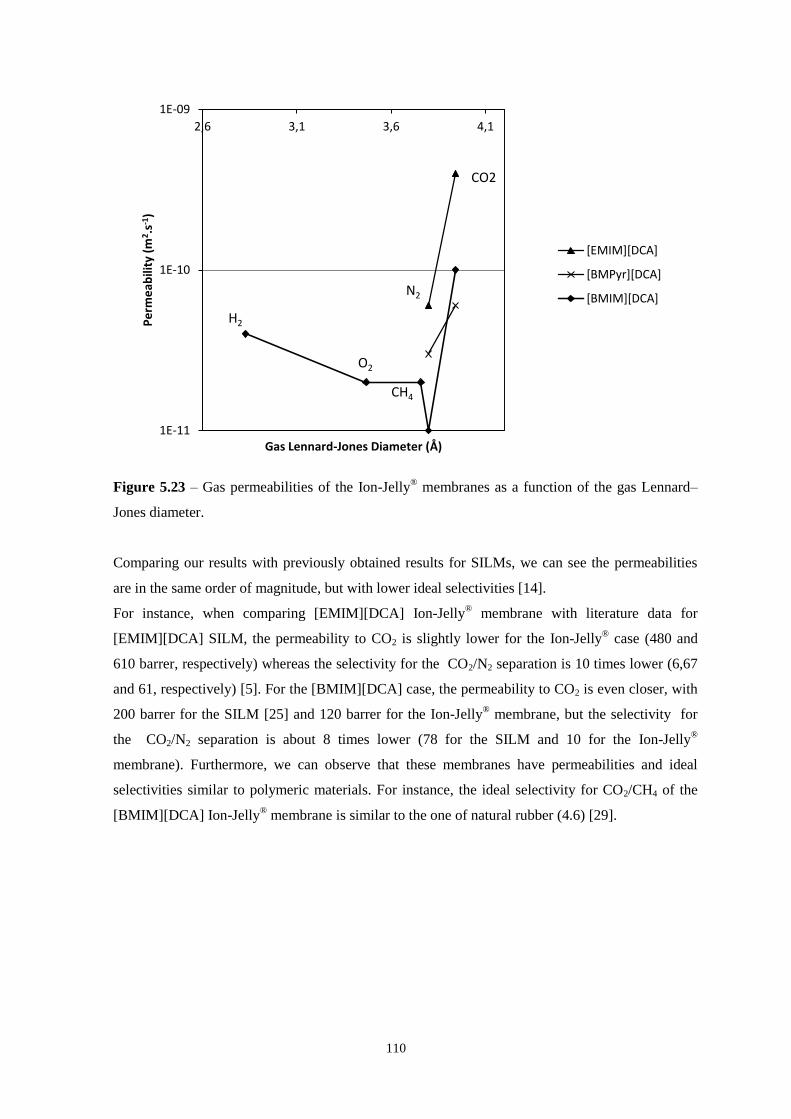
110
Figure 5.23 – Gas permeabilities of the Ion-Jelly® membranes as a function of the gas Lennard–
Jones diameter.
Comparing our results with previously obtained results for SILMs, we can see the permeabilities
are in the same order of magnitude, but with lower ideal selectivities [14].
For instance, when comparing [EMIM][DCA] Ion-Jelly® membrane with literature data for
[EMIM][DCA] SILM, the permeability to CO2 is slightly lower for the Ion-Jelly® case (480 and
610 barrer, respectively) whereas the selectivity for the CO2/N2 separation is 10 times lower (6,67
and 61, respectively) [5]. For the [BMIM][DCA] case, the permeability to CO2 is even closer, with
200 barrer for the SILM [25] and 120 barrer for the Ion-Jelly® membrane, but the selectivity for
the CO2/N2 separation is about 8 times lower (78 for the SILM and 10 for the Ion-Jelly®
membrane). Furthermore, we can observe that these membranes have permeabilities and ideal
selectivities similar to polymeric materials. For instance, the ideal selectivity for CO2/CH4 of the
[BMIM][DCA] Ion-Jelly® membrane is similar to the one of natural rubber (4.6) [29].
1E-11
1E-10
1E-09
2,6 3,1 3,6 4,1
Pe
rme
abili
ty (
m2 .
s-1)
Gas Lennard-Jones Diameter (Å)
[EMIM][DCA]
[BMPyr][DCA]
[BMIM][DCA]
CO2
N2
H2
CH4
O2
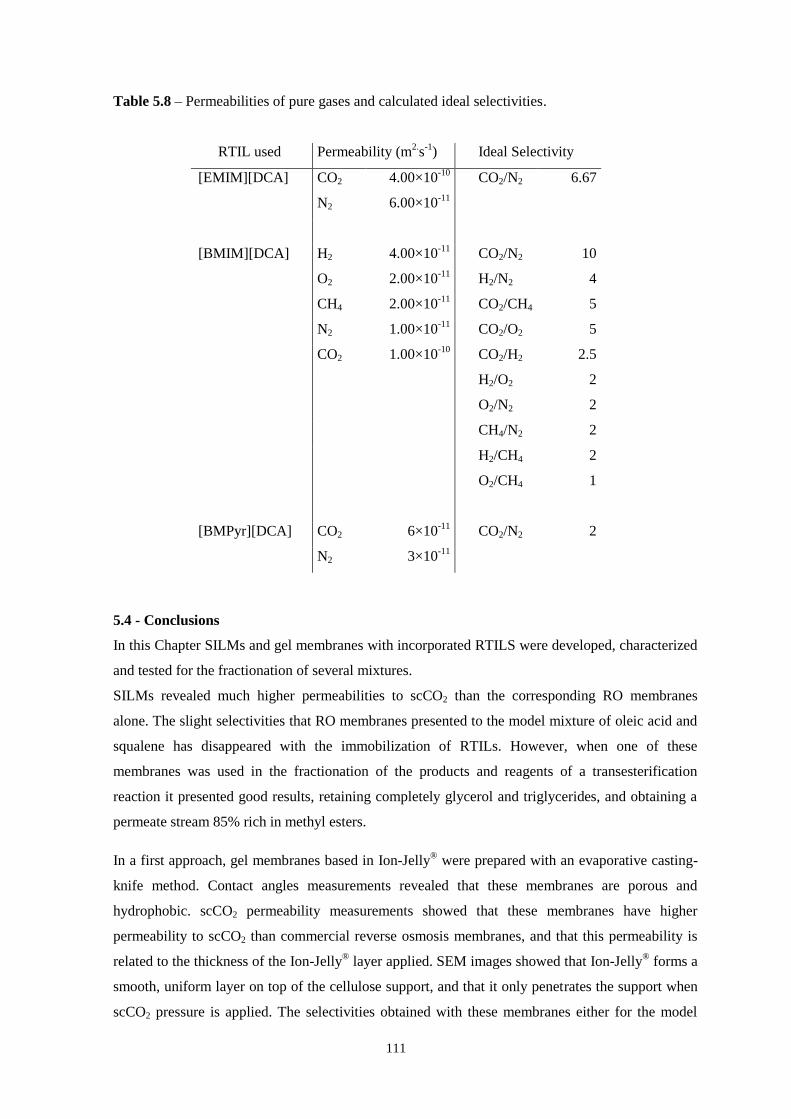
111
Table 5.8 – Permeabilities of pure gases and calculated ideal selectivities.
RTIL used Permeability (m2.s
-1) Ideal Selectivity
[EMIM][DCA] CO2 4.00×10⁻¹⁰
CO2/N2 6.67
N2 6.00×10⁻¹¹
[BMIM][DCA] H2 4.00×10⁻¹¹
CO2/N2 10
O2 2.00×10⁻¹¹
H2/N2 4
CH4 2.00×10⁻¹¹
CO2/CH4 5
N2 1.00×10⁻¹¹
CO2/O2 5
CO2 1.00×10⁻¹⁰
CO2/H2 2.5
H2/O2 2
O2/N2 2
CH4/N2 2
H2/CH4 2
O2/CH4 1
[BMPyr][DCA] CO2 6×10-11
CO2/N2 2
N2 3×10-11
5.4 - Conclusions
In this Chapter SILMs and gel membranes with incorporated RTILS were developed, characterized
and tested for the fractionation of several mixtures.
SILMs revealed much higher permeabilities to scCO2 than the corresponding RO membranes
alone. The slight selectivities that RO membranes presented to the model mixture of oleic acid and
squalene has disappeared with the immobilization of RTILs. However, when one of these
membranes was used in the fractionation of the products and reagents of a transesterification
reaction it presented good results, retaining completely glycerol and triglycerides, and obtaining a
permeate stream 85% rich in methyl esters.
In a first approach, gel membranes based in Ion-Jelly® were prepared with an evaporative casting-
knife method. Contact angles measurements revealed that these membranes are porous and
hydrophobic. scCO2 permeability measurements showed that these membranes have higher
permeability to scCO2 than commercial reverse osmosis membranes, and that this permeability is
related to the thickness of the Ion-Jelly® layer applied. SEM images showed that Ion-Jelly
® forms a
smooth, uniform layer on top of the cellulose support, and that it only penetrates the support when
scCO2 pressure is applied. The selectivities obtained with these membranes either for the model
112
mixture of oleic acid and squalene or the model mixture of methyl oleate and squalene are
negligible. The evidences from elemental analysis, traction experiments, SEM images and from the
discrepancies in scCO2 fractionation revealed that the method of preparation of these membranes is
not reproducible and presents flaws in the surface of the membranes, leading to the decision of
altering the production method.
The glass plates pressed method of preparation of Ion-Jelly® membranes was developed to
overcome the flaws in the membranes production method. The membrane of [EMIM][DCA] Ion-
Jelly® prepared by this method revealed to be more hydrophilic than the membranes prepared with
[BMIM][DCA] and [BMPyr][DCA]. The permeability to scCO2 is now considerably lower than
with the Ion-Jelly® membranes prepared with the previous method, and similar to the ones of
commercial reverse osmosis membranes, although higher pressure drops can now be obtained.
From SEM images is possible to see that Ion-Jelly® penetrates the cellulose support, covering the
cellulose fibers and occupying the empty spaces between them, and that the application of scCO2
presents no significative change in the membrane morphology. But these membranes still present
no appreciable fractionation for the model mixture of oleic acid and squalene. In the fractionation
of products and reactants from an enzymatic transesterification reaction, although this membrane
presents a permeate less rich in methyl esters than that obtained with SILMs, it still presents very
good retention factors for glycerol and monoglycerides. Elemental analysis shows that these
membranes are not degraded with operation in scCO2.
When testing the Ion-Jelly® membranes for the separation of gases, it was found that the
permeabilities were similar to those reported in the literature for the corresponding SILMs.
However, the selectivities are not significative when compared with those obtained with SILMs.
5.5 - References
[1] L. C. Branco, J. G. Crespo and C. A. M. Afonso; Studies on the Selective transport of Organic
Compounds by Using Ionic Liquids as Novel Supported Liquid Membranes; Chem. Eur. J.
2002, 8, Nº. 17, 3865-3871.
[2] E. Miyako, T. Maruyama, N. Kamiya, M. Goto, Use of ionic liquids in a lipase-facilitated
supported liquid membrane, Biotechnol. Lett. 25 (2003) 805-808.
[3] M. Matsumoto, Y. Inomoto, K. Kondo, Selective separation of aromatic hydrocarbons through
supported liquid membranes based on ionic liquids, J. Membr. Sci. 246 (2005) 77–81.
[4] A.P. Ríos, F.J. Hernández-Fernández, H. Presa, D. Gómez, G. Víllora, Tailoring supported
ionic liquid membranes for the selective separation of transesterification reaction compounds, J.
Membr. Sci. 328 (2009) 81–85.
113
[5] P. Scovazzo, J. Kieft, D. Finan, R.D. Noble, C.A. Koval, Gas Separations Using Non-
Hexafluorophosphate [PF6] - Anion Supported Ionic Liquid Membranes, J. Membr. Sci, 238
(2009) 57-64.
[6] Q. Gan, D. Rooney, M. Xue, G. Thompson, Y. Zou; An experimental study of gas transport and
separation properties of ionic liquids supported on nanofiltration membranes; Journal of
Membrane Science 280 (2006) 948–956.
[7] W. Zhao, G. He, L. Zhang, J. Ju, H. Dou, F. Nie, C. Li, H. Liu; Effect of water in ionic liquid
on the separation performance of supported ionic liquid membrane for CO2/N2; Journal of
Membrane Science 350 (2010) 279–285.
[8] Q. Gan, Y. Zou, D. Rooney, P. Nancarrow, J. Thompson, L. Liang, M. Lewis; Theoretical and
experimental correlations of gas dissolution, diffusion, and thermodynamic properties in
determination of gas permeability and selectivity in supported ionic liquid membranes;
Advances in Colloid and Interface Science 164 (2011) 45–55.
[9] A. P. de los Ríos, F. J. Hernández-Fernández, F. Tomás-Alonso, J.M. Palacios, G. Víllora;
Stability studies of supported liquid membranes based on ionic liquids: Effect of surrounding
phase nature; Desalination 245 (2009) 776–782.
[10] F.J. Hérnandez-Férnandez, A.P. de los Ríos, F. Tomás-Alonso, J.M. Palacios, G. Víllora;
Preparation of supported ionic liquid membranes: Influence of the ionic liquid immobilization
method on their operational stability; Journal of Membrane Science 341 (2009) 172–177.
[11] R. Fortunato, C. A.M. Afonso, M.A.M. Reis, J. G. Crespo; Supported liquid membranes using
ionic liquids: study of stability and transport mechanisms; Journal of Membrane Science 242
(2004) 197–209.
[12] R. Fortunato, C. A.M. Afonso, J. Benavente, E. Rodriguez-Castellón, J. G. Crespo; Stability of
supported ionic liquid membranes as studied by X-ray photoelectron spectroscopy; Journal of
Membrane Science 256 (2005) 216–223.
[13] P. Cserjési, N. Nemestóthy, K. Bélafi-Bakó; Gas separation properties of supported liquid
membranes prepared with unconventional ionic liquids; Journal of Membrane Science 349
(2010) 6–11.
[14] L. A. Neves, J. G. Crespo, I. M. Coelhoso; Gas permeation studies in supported ionic liquid
membranes; Journal of Membrane Science 357 (2010) 160–170.
[15] B. A. Voss, J. E. Bara, D. L. Gin, R. D. Noble; Physically Gelled Ionic Liquids: Solid
Membrane Materials with Liquidlike CO2 Gas Transport; Chem. Mater. 2009, 21, 3027–3029.
[16] I.-N. Yoon, S. Yoo, S.-J. Park, J. Won; CO2 separation membranes using ion gels by self-
assembly of a triblock copolymer in ionic liquids; Chemical Engineering Journal 172 (2011)
237– 242.
[17] J. C. Jansen, K. Friess, G. Clarizia, J. Schauer, P. Izák; High Ionic Liquid Content Polymeric
Gel Membranes: Preparation and Performance; Macromolecules 2011, 44, 39–45.
114
[18] P. Vidinha, N. M. T. Lourenço, C. Pinheiro, A. R. Brás, T. Carvalho, T. Santos-Silva, A.
Mukhopadhyay, M. J. Romão, J. Parola, M. Dionisio, J. M. S. Cabral, C. A. M. Afonso and S.
Barreiros; Ion jelly: a tailor-made conducting material for smart electrochemical devices; Chem.
Commun., 2008, 5842–5844.
[19] A. F.R. Pimenta, A. C. Baptista, T. Carvalho, P. Brogueira, N. M.T. Lourenço, C. A.M.
Afonso, S. Barreiros, P. Vidinha, J. P. Borges; Electrospinning of Ion Jelly fibers; Materials
Letters 83 (2012) 161–164.
[20] B.S. Furniss, A.J. Hannaford, P.W.G. Smith, A.R. Tachtell, Vogel’s Textbook of Practical
Organic Chemistry, fifth ed., Longmann Scientific & Technical, England, 1989.
[21] E.L. Cussler, Diffusion, second ed., Cambridge University Press, Cambridge, 1997.
[22] M. S. Manic, A. J. Queimada, E. A. Macedo, V. Najdanovic-Visak; High-pressure solubilities
of carbon dioxide in ionic liquids based on bis(trifluoromethylsulfonyl)imide and chloride; J. of
Supercritical Fluids 65 (2012) 1– 10.
[23] P. Carvalho, V. Álvarez, I. Marrucho, M. Aznar, J. Coutinho; High pressure phase behavior of
carbon dioxide in 1-butyl-3-methylimidazolium bis(trifluoromethylsulfonyl)imide and 1-butyl-
3-methylimidazolium dicyanamide ionic liquids; J. of Supercritical Fluids 50 (2009) 105–111.
[24] W. Zhao, G. He, F. Nie, L. Zhang, H. Feng, H. Liu, Membrane liquid loss mechanism of
supported ionic liquid membrane for gas separation Journal of Membrane Science 411– 412
(2012) 73– 80.
[25] A. Clarke, T. D. Blake, K. Carruthers, A. Woodward; Spreading and Imbibition of Liquid
Droplets on Porous Surfaces; Langmuir 2002, 18, 2980-2984.B.E. Poling, J.M. Prausnitz, J.P.
O’Connell, The Properties of Gases and Liquids, fifth ed., McGraw-Hill International Editions,
2001.
[26] R. Ruivo, A. Paiva, P. Simões; Phase equilibria of the ternary system methyl
oleate/squalene/carbon dioxide at high pressure conditions; J. of Supercritical Fluids 29 (2004)
77–85
[27] B. Poling, J. Prausnitz, J. O’Connel; The Properties of Gases and Liquids; 5th edition,
McGraw-Hill, New York, 2001.
[28] P. Jindaratsamee, Y. Shimoyama, H. Morizaki, A. Ito; Effects of temperature and anion
species on CO2 permeability and CO2/N2 separation coefficient through ionic liquid membranes;
J. Chem. Thermodynamics 43 (2011) 311–314.
[29] M. Mulder; Basic Principles of Membrane Technology; Kluwer Academic Publishers, 1st ed.,
Dordrecht, 1996.

115
Chapter 6
Conclusions and Future Work

116
117
In this thesis were explored fractionations of mixtures with supercritical carbon dioxide (scCO2),
room temperature ionic liquids (RTILs) and membranes. The first case tested was with commercial
reverse osmosis (RO) membranes in scCO2. Then, fractionations with RTILs were performed as a
screening in order to choose adequate RTILs to produce supported ionic liquid membranes
(SILMs). In view of the results obtained with the fractionations with RTILs was developed an
indirect method to probe the polarity of RTILs, in order to explain the fractionations observed.
Finally, SILMs and Ion-Jelly® membranes were developed and tested based on the knowledge
obtained with the previous experiments.
In the experiments with RO membranes it was found that the permeability to scCO2 is not
dependent on the pressure applied on the retentate side of the membrane, in the range of 18 to 22
MPa. It was also found that all membranes are selective towards oleic acid, with polyamide AD
being the less selective and cellulose acetate the more selective, although with lower permeate
fractions obtained.
By coupling supercritical fluid extraction (SFE) in a countercurrent packed column with separation
in Polyamide AD membrane it was possible to obtain an enrichment in squalene of 1.6 times.
When it was tried to separate a mixture analogous to the retentate of the column with membranes, it
was very difficult to achieve results due to the impossibility of pumping liquids with high amounts
of dissolved gas, and to the low contact times of the model mixture with the membrane in these
conditions. In the cases in which it was possible to obtain permeate fraction, either there was no
selectivity or this was negligible.
The fractionation of a model mixture using room temperature ionic liquids as the extracting agent
was investigated for a range of imidazolium, phosphonium and ammonium based ionic liquids. It
was shown that it is possible to adjust the fractionation of the oil mixture by adequately choosing
the type of anion and cation of the room temperature ionic liquid. It was also shown that by altering
the proportions of ionic liquid and mixture to be extracted is possible to further adjust the
fractionation.
In order to explain the effects observed in the fractionation of a model mixture with RTILs, it was
developed an indirect method to probe the polarity of RTILs. This method consisted in the addition
of small quantities of RTILs to common organic solvents with a polarity probe dissolved, and the
deviations in the polarity observed were related to the original polarity of the RTILs.
118
It was seen that the influence in solvent polarity is more linked to the cation than the anion. For all
the cases studied, the polarity of the solvent increased with the addition of RTIL and the continuous
addition is linearly correlated to the increase in polarity. The only exception is [C2OHMIM][BF4],
which decreases the polarity of ethanol with the first addition, but with further additions it also
increased the value of polarity. The increase in polarity in acetonitrile (the solvent with more
RTILs studied) can be generically described following the cation sequence
[(C6)3C14P]<[BDMIM]<[ALIQUAT]<[EMIM]<[BMIM].
Ethanol presented the polarity scale more in accordance with the already published values for pure
RTILs. This is probably a result of closer polarity of ethanol to those of the pure RTILs. It was
concluded that fractionation of oleic acid in RTILs increases with decreasing polarity. However, it
was also seen that ethanol is less sensitive to the changes in polarity than acetonitrile.
SILMs developed in this work revealed much higher permeabilities to scCO2 than the
corresponding RO membranes alone. The slight selectivities that RO membranes presented to the
model mixture of oleic acid and squalene have disappeared with the immobilization of RTILs.
However, when one of these membranes was used in the fractionation of the products and reagents
of a transesterification reaction it presented good results, retaining completely glycerol and
triglycerides, and obtaining a permeate stream 85% rich in methyl esters. One could infer that if the
transesterification reaction would be complete then the permeate would consist only in methyl
esters and methanol.
In a first approach, gel membranes based in Ion-Jelly® were prepared with an evaporative casting-
knife method. Contact angles measurements revealed that these membranes are porous and
hydrophobic. scCO2 permeability measurements showed that these membranes have higher
permeability to scCO2 than commercial reverse osmosis membranes, and that this permeability is
related to the thickness of the Ion-Jelly® layer applied. Scanning electron microscopy (SEM)
images showed that Ion-Jelly® forms a layer on top of the cellulose support, and that it only
penetrates the support when scCO2 pressure is applied. The selectivities obtained with these
membranes either for the model mixture of oleic acid and squalene or the model mixture of methyl
oleate and squalene are negligible. The evidences from elemental analysis, traction experiments,
SEM images and from the discrepancies in scCO2 fractionation of model mixtures revealed that the
method of preparation of these membranes is not reproducible and presents flaws in the surface of
the membranes, leading to the decision of altering the production method.
The glass plates pressed method of preparation of Ion-Jelly® membranes was developed to
overcome the flaws detected with the former membranes production method. The membrane of
119
[EMIM][DCA] Ion-Jelly® prepared by this method revealed to be more hydrophilic than the
membranes prepared with [BMIM][DCA] and [BMPyr][DCA]. The permeability to scCO2 is now
considerably lower than with the Ion-Jelly® membranes prepared with the previous method, and
similar to the ones of commercial reverse osmosis membranes, although higher pressure drops can
now be obtained. From SEM images it is possible to see that ion-jelly penetrates the cellulose
support, covering the cellulose fibers and occupying the empty spaces between them, and that the
application of scCO2 presents no significative change in the membrane morphology. But these
membranes still present no appreciable fractionation for the model mixture of oleic acid and
squalene. In the fractionation of products and reactants from an enzymatic transesterification
reaction, although this membrane presents a permeate less rich in methyl esters than that obtained
with SILMs, it still presents very good retention factors for glycerol and monoglycerides.
Elemental analysis shows that these membranes are not degraded with operation in scCO2. It is thus
proven that gel membranes can be used for fractionations in scCO2 with stability.
When testing the Ion-Jelly® membranes for the separation of gases at low pressures, it was found
that the permeabilities were similar to those reported in the literature for the corresponding SILMs.
However, the selectivities are not significative when compared with those obtained with SILMs.
As future work to be conducted, the influence of feed and solvent flows in the separations with
membranes could be tested. In view of the results obtained in Chapter 5, other mixtures could as
well be tested with RO membranes (for example the products and reactants of the
transesterification reaction).
In the coupling of membranes with SFE in a countercurrent packed column, other pressures,
temperatures and membranes could be tested.
More RTILs should be tested for their influence in solvent polarity with ethanol, as this was the
solvent which presented results more in accordance with published results for pure RTILs. Other
polarity probes could as well be explored. The change in polarity observed in organic solvents with
the addition of RTILs could be explored for the fractionation of mixtures.
Further tests with SILMs could be conducted concerning the coupling of an enzymatic reactor with
SILMs, in order to optimize the process. Parameters like temperature, pressure, flow ratios, reactor
geometry and enzyme content could be explored. Other SILMs could also be tested. Methanol
could be replaced by ethanol and the separation of ethyl esters thus produced could be tested, being
expected that the results should be similar to those obtained with methyl esters. These same tests
are applicable also for IJ membranes.

120
There is probably still space to further improve the process of production of IJ membranes, in order
to increase the reproducibility of the method and to facilitate the elimination of air bubbles. Better
pressing equipment could be used, in order to apply more pressure in a more uniform way. The
fluidity of the Ion-Jelly®, when it is still hot and liquid, could also be assessed in order to eliminate
air bubbles. One approach which might be used could be to apply ultrasounds immediately before
spreading the Ion-Jelly® on top of the cellulose layer.
121
Appendix
Complete ETN Tables

122
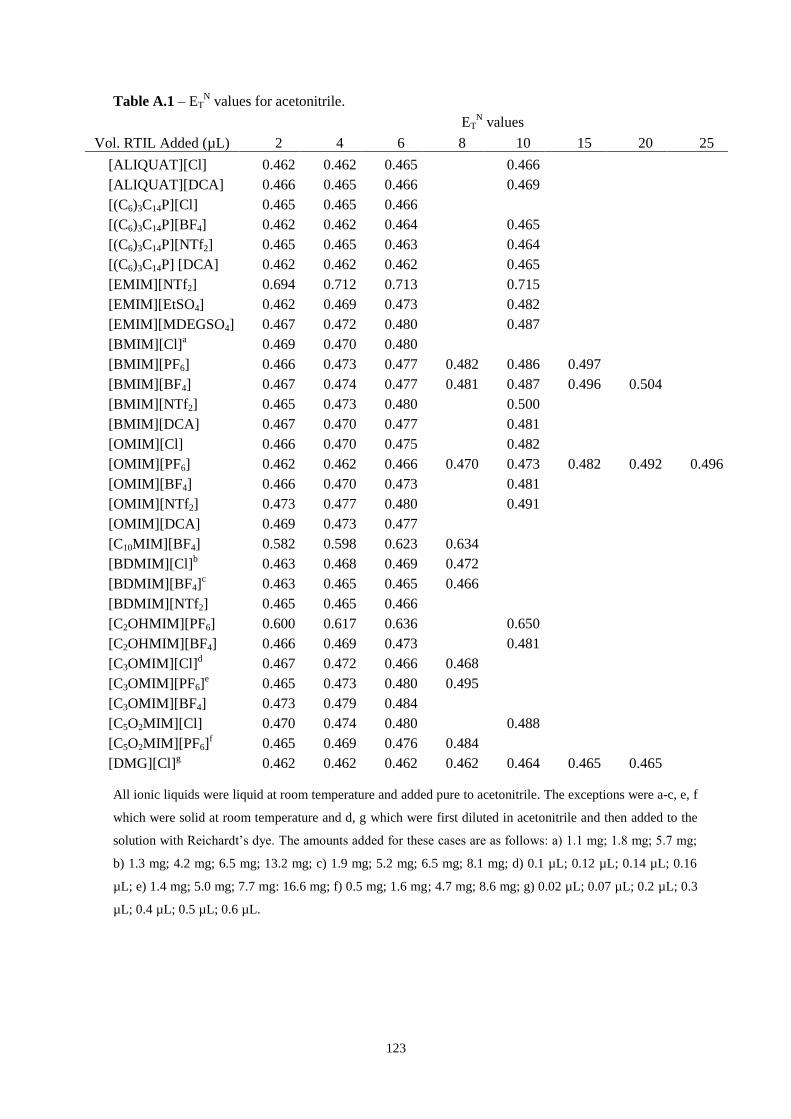
123
Table A.1 – ETN values for acetonitrile.
ETN values
Vol. RTIL Added (µL) 2 4 6 8 10 15 20 25
[ALIQUAT][Cl] 0.462 0.462 0.465
0.466
[ALIQUAT][DCA] 0.466 0.465 0.466
0.469
[(C6)3C14P][Cl] 0.465 0.465 0.466
[(C6)3C14P][BF4] 0.462 0.462 0.464
0.465
[(C6)3C14P][NTf2] 0.465 0.465 0.463
0.464
[(C6)3C14P] [DCA] 0.462 0.462 0.462
0.465
[EMIM][NTf2] 0.694 0.712 0.713
0.715
[EMIM][EtSO4] 0.462 0.469 0.473
0.482
[EMIM][MDEGSO4] 0.467 0.472 0.480
0.487
[BMIM][Cl]a 0.469 0.470 0.480
[BMIM][PF6] 0.466 0.473 0.477 0.482 0.486 0.497
[BMIM][BF4] 0.467 0.474 0.477 0.481 0.487 0.496 0.504
[BMIM][NTf2] 0.465 0.473 0.480
0.500
[BMIM][DCA] 0.467 0.470 0.477
0.481
[OMIM][Cl] 0.466 0.470 0.475 0.482
[OMIM][PF6] 0.462 0.462 0.466 0.470 0.473 0.482 0.492 0.496
[OMIM][BF4] 0.466 0.470 0.473
0.481
[OMIM][NTf2] 0.473 0.477 0.480
0.491
[OMIM][DCA] 0.469 0.473 0.477
[C10MIM][BF4] 0.582 0.598 0.623 0.634
[BDMIM][Cl]b
0.463 0.468 0.469 0.472
[BDMIM][BF4]c
0.463 0.465 0.465 0.466
[BDMIM][NTf2] 0.465 0.465 0.466
[C2OHMIM][PF6] 0.600 0.617 0.636
0.650
[C2OHMIM][BF4] 0.466 0.469 0.473
0.481
[C3OMIM][Cl]d
0.467 0.472 0.466 0.468
[C3OMIM][PF6]e
0.465 0.473 0.480 0.495
[C3OMIM][BF4] 0.473 0.479 0.484
[C5O2MIM][Cl] 0.470 0.474 0.480
0.488
[C5O2MIM][PF6]f
0.465 0.469 0.476 0.484
[DMG][Cl]g
0.462 0.462 0.462 0.462 0.464 0.465 0.465
All ionic liquids were liquid at room temperature and added pure to acetonitrile. The exceptions were a-c, e, f
which were solid at room temperature and d, g which were first diluted in acetonitrile and then added to the
solution with Reichardt’s dye. The amounts added for these cases are as follows: a) 1.1 mg; 1.8 mg; 5.7 mg;
b) 1.3 mg; 4.2 mg; 6.5 mg; 13.2 mg; c) 1.9 mg; 5.2 mg; 6.5 mg; 8.1 mg; d) 0.1 µL; 0.12 µL; 0.14 µL; 0.16
µL; e) 1.4 mg; 5.0 mg; 7.7 mg: 16.6 mg; f) 0.5 mg; 1.6 mg; 4.7 mg; 8.6 mg; g) 0.02 µL; 0.07 µL; 0.2 µL; 0.3
µL; 0.4 µL; 0.5 µL; 0.6 µL.
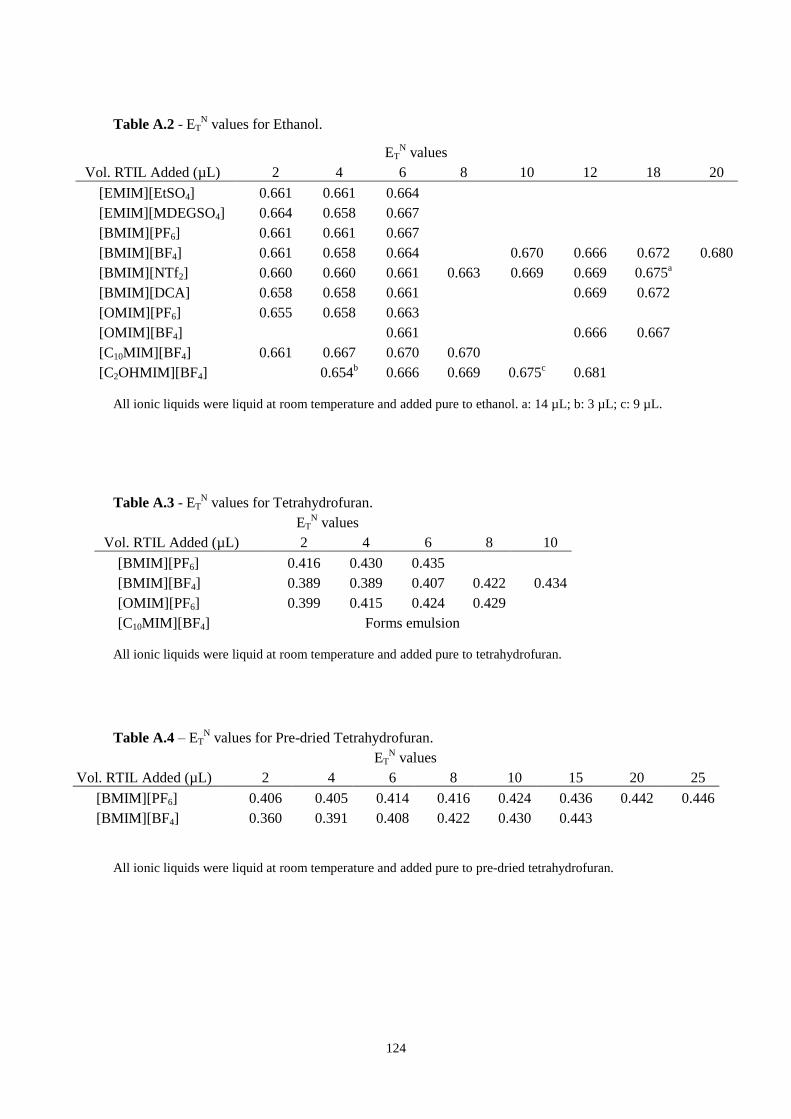
124
Table A.2 - ETN values for Ethanol.
ETN values
Vol. RTIL Added (µL) 2 4 6 8 10 12 18 20
[EMIM][EtSO4] 0.661 0.661 0.664
[EMIM][MDEGSO4] 0.664 0.658 0.667
[BMIM][PF6] 0.661 0.661 0.667
[BMIM][BF4] 0.661 0.658 0.664
0.670 0.666 0.672 0.680
[BMIM][NTf2] 0.660 0.660 0.661 0.663 0.669 0.669 0.675a
[BMIM][DCA] 0.658 0.658 0.661
0.669 0.672
[OMIM][PF6] 0.655 0.658 0.663
[OMIM][BF4]
0.661
0.666 0.667
[C10MIM][BF4] 0.661 0.667 0.670 0.670
[C2OHMIM][BF4]
0.654b
0.666 0.669 0.675c
0.681
All ionic liquids were liquid at room temperature and added pure to ethanol. a: 14 µL; b: 3 µL; c: 9 µL.
Table A.3 - ETN values for Tetrahydrofuran.
ETN values
Vol. RTIL Added (µL) 2 4 6 8 10
[BMIM][PF6] 0.416 0.430 0.435
[BMIM][BF4] 0.389 0.389 0.407 0.422 0.434
[OMIM][PF6] 0.399 0.415 0.424 0.429
[C10MIM][BF4] Forms emulsion
All ionic liquids were liquid at room temperature and added pure to tetrahydrofuran.
Table A.4 – ETN values for Pre-dried Tetrahydrofuran.
ETN values
Vol. RTIL Added (µL) 2 4 6 8 10 15 20 25
[BMIM][PF6] 0.406 0.405 0.414 0.416 0.424 0.436 0.442 0.446
[BMIM][BF4] 0.360 0.391 0.408 0.422 0.430 0.443
All ionic liquids were liquid at room temperature and added pure to pre-dried tetrahydrofuran.
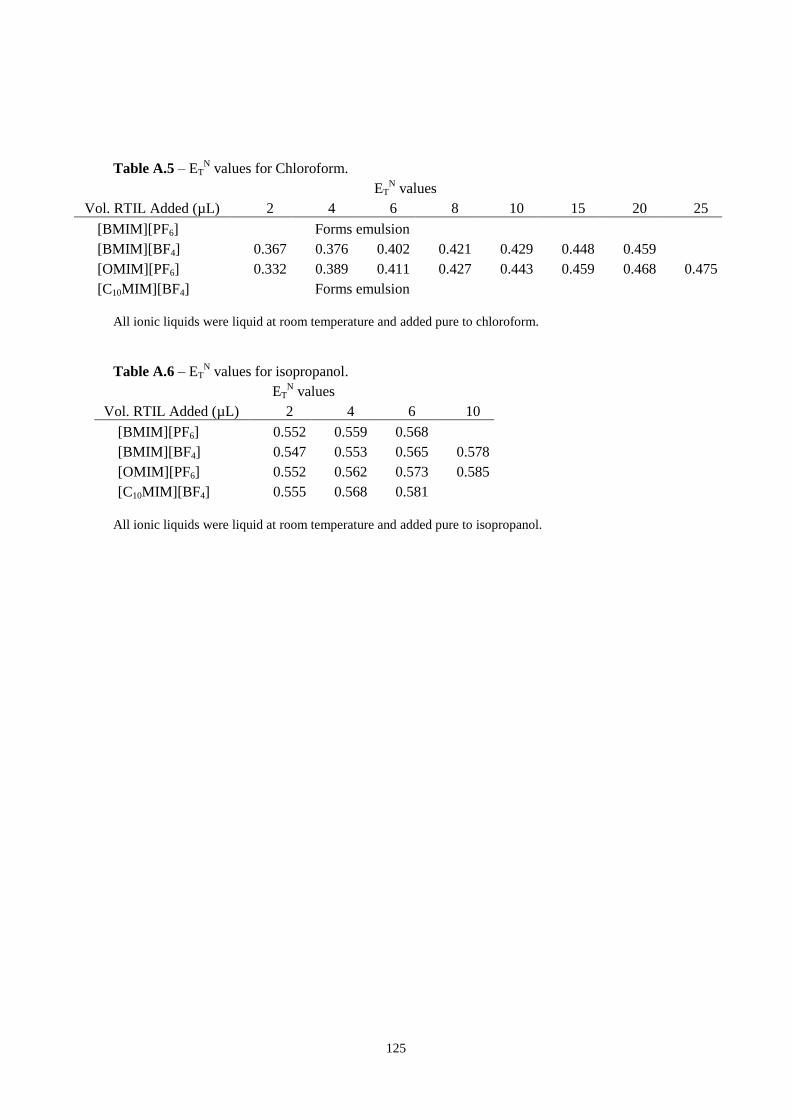
125
Table A.5 – ETN values for Chloroform.
ETN values
Vol. RTIL Added (µL) 2 4 6 8 10 15 20 25
[BMIM][PF6] Forms emulsion
[BMIM][BF4] 0.367 0.376 0.402 0.421 0.429 0.448 0.459
[OMIM][PF6] 0.332 0.389 0.411 0.427 0.443 0.459 0.468 0.475
[C10MIM][BF4] Forms emulsion
All ionic liquids were liquid at room temperature and added pure to chloroform.
Table A.6 – ETN values for isopropanol.
ETN values
Vol. RTIL Added (µL) 2 4 6 10
[BMIM][PF6] 0.552 0.559 0.568
[BMIM][BF4] 0.547 0.553 0.565 0.578
[OMIM][PF6] 0.552 0.562 0.573 0.585
[C10MIM][BF4] 0.555 0.568 0.581
All ionic liquids were liquid at room temperature and added pure to isopropanol.
Recommended