1
Kuwait Institute for Scientific Research معهد الكويت لألبحاث العلمية
Layla Al-Awadi
Abdul Rehman Khan
Kuwait Institute for Scientific Research
Rehabilitation of an industrial mercury
contaminated site as an official Building
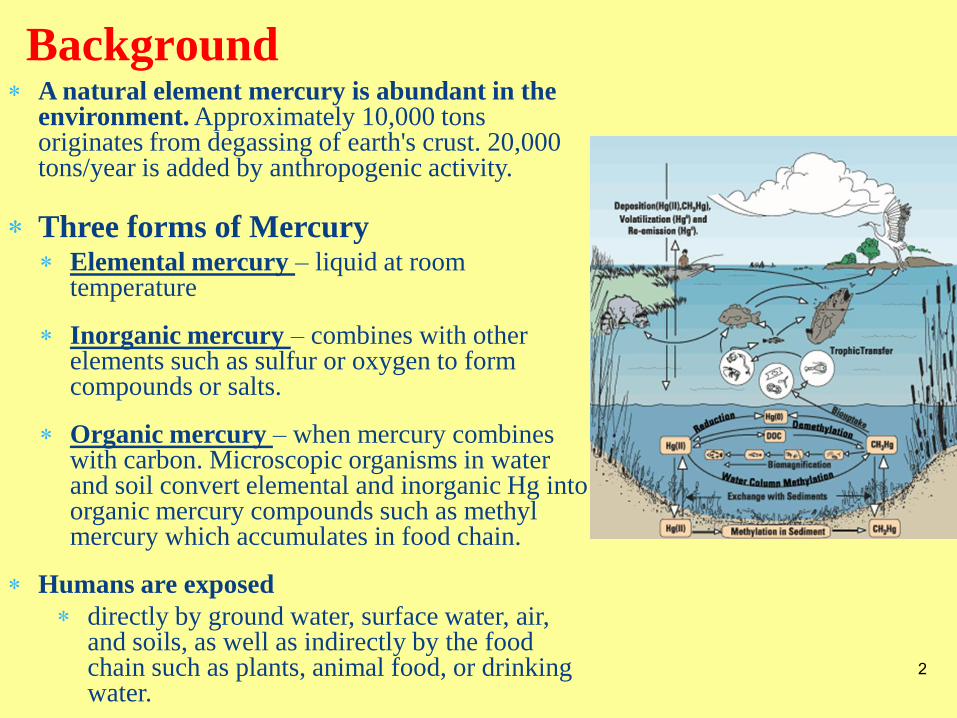
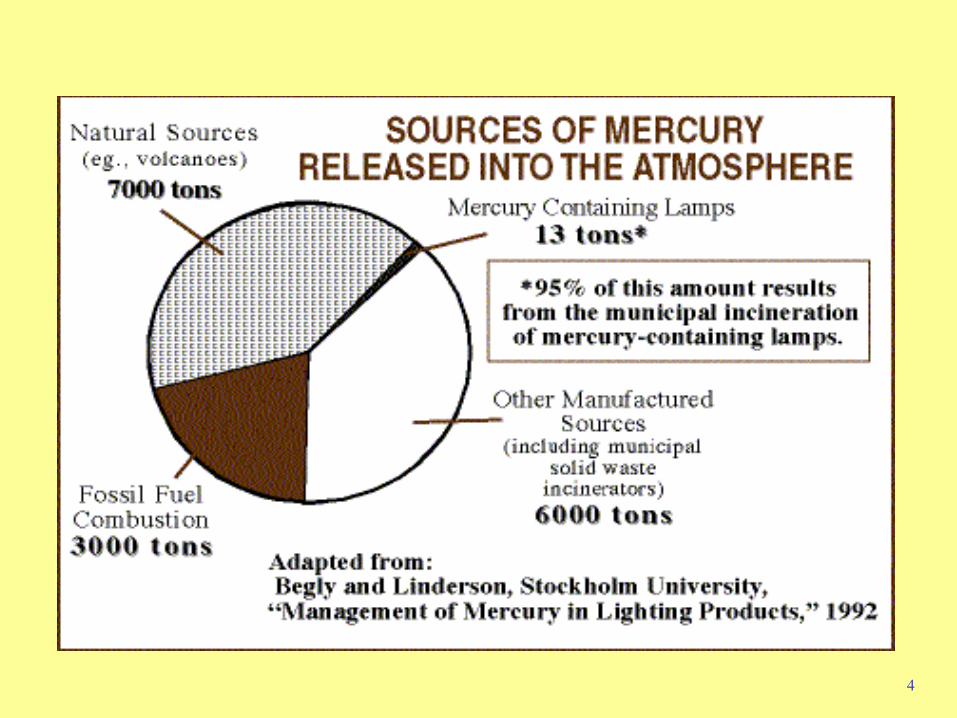
A natural element mercury is abundant in the environment. Approximately 10,000 tons originates from degassing of earth's crust. 20,000 tons/year is added by anthropogenic activity.
Three forms of Mercury Elemental mercury – liquid at room
temperature
Inorganic mercury – combines with other elements such as sulfur or oxygen to form compounds or salts.
Organic mercury – when mercury combines with carbon. Microscopic organisms in water and soil convert elemental and inorganic Hg into organic mercury compounds such as methyl mercury which accumulates in food chain.
Humans are exposed
directly by ground water, surface water, air, and soils, as well as indirectly by the food chain such as plants, animal food, or drinking water.
2
Background
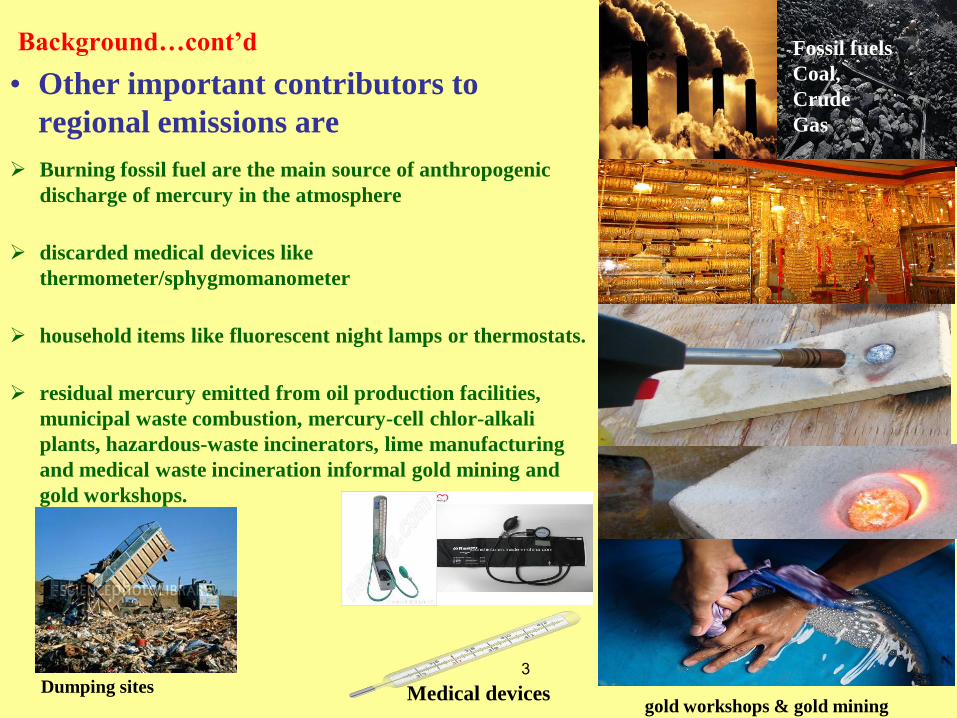
• Other important contributors to
regional emissions are
Burning fossil fuel are the main source of anthropogenic
discharge of mercury in the atmosphere
discarded medical devices like
thermometer/sphygmomanometer
household items like fluorescent night lamps or thermostats.
residual mercury emitted from oil production facilities,
municipal waste combustion, mercury-cell chlor-alkali
plants, hazardous-waste incinerators, lime manufacturing
and medical waste incineration informal gold mining and
gold workshops.
3
Background…cont’d Fossil fuels
Coal,
Crude
Gas
gold workshops & gold mining Medical devices Dumping sites
4
5
Background…cont’d
Bou-Olayan and Al- yakoob (1994 )and Al Majed and
Preston, (2000; 2004) have reported the toxicity of
mercury in fish and in human hair of the fishermen in
Kuwait.
Al-Awadi et al., (2008) and Khan et al., (2006); (2008) and
Massoud, (2002).have discussed mercury presence in
domestic dust and Kuwait Bay coast and the most probable
sources of mercury pollution in the air, water and soil.
6
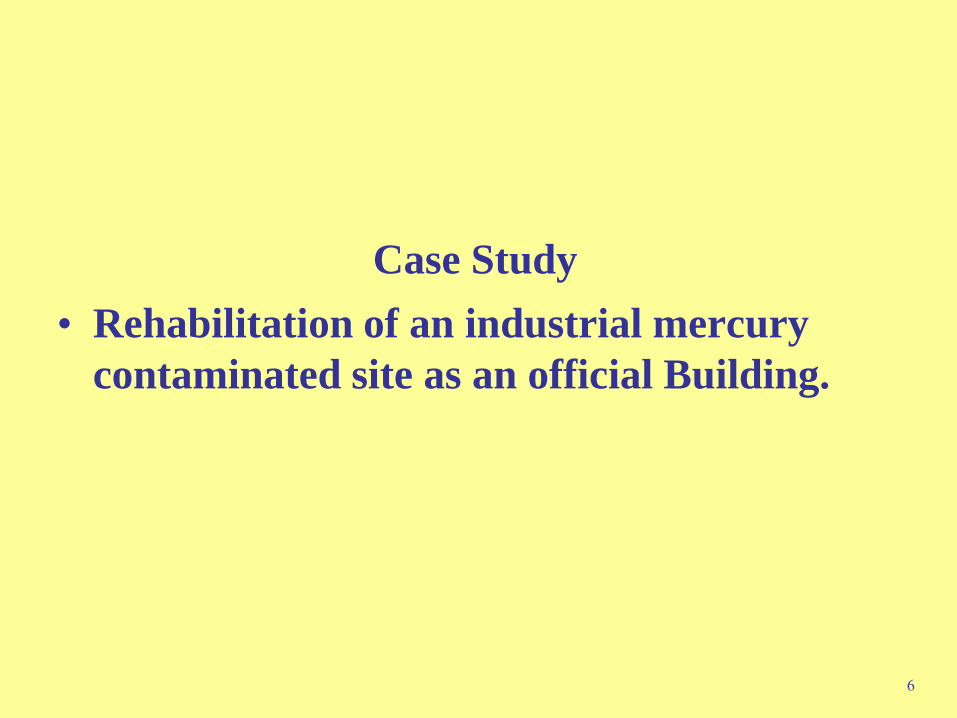
Case Study
• Rehabilitation of an industrial mercury
contaminated site as an official Building.
A. R. Khan Choking, sneezing, coughing? 7
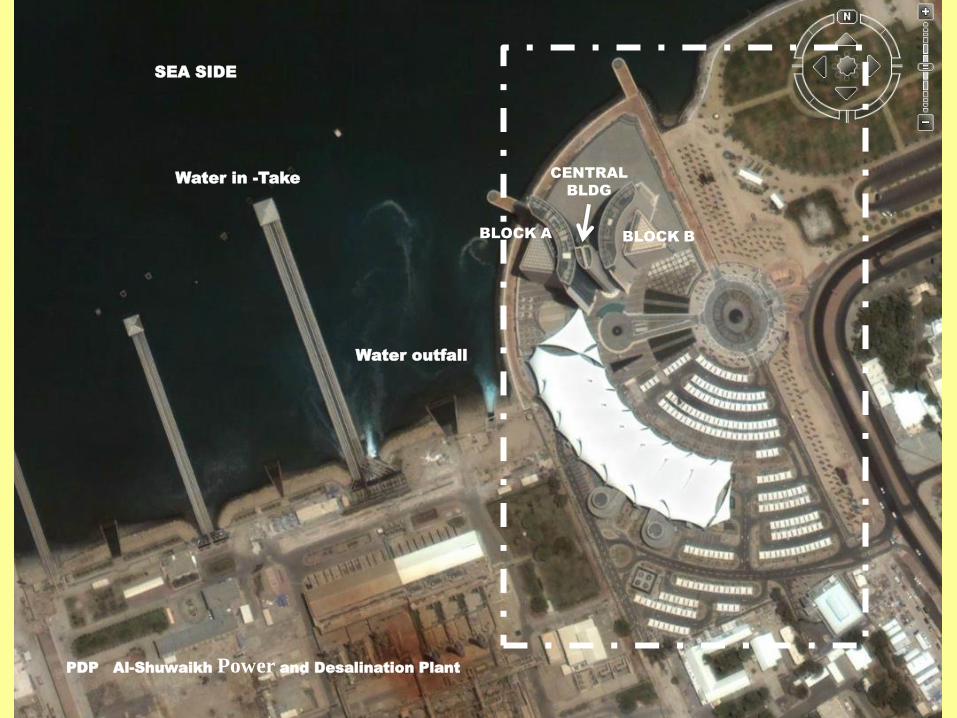
SEA SIDE
CENTRAL
BLDG
BLOCK B BLOCK A
PDP Al-Shuwaikh Power and Desalination Plant
Water in -Take
Water outfall
8
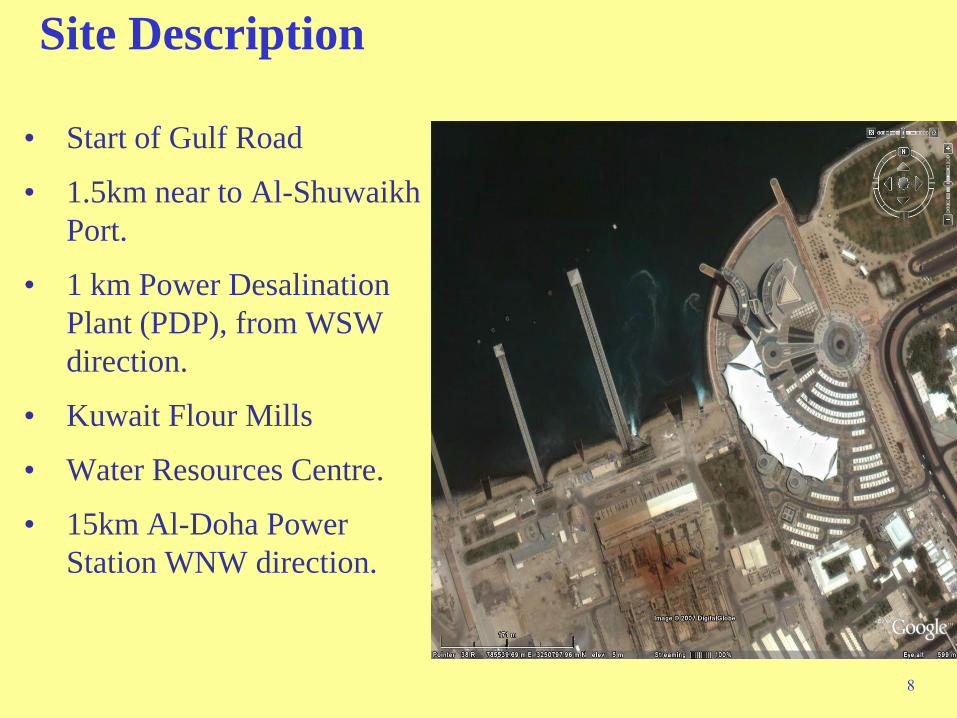
Site Description
• Start of Gulf Road
• 1.5km near to Al-Shuwaikh
Port.
• 1 km Power Desalination
Plant (PDP), from WSW
direction.
• Kuwait Flour Mills
• Water Resources Centre.
• 15km Al-Doha Power
Station WNW direction.
9
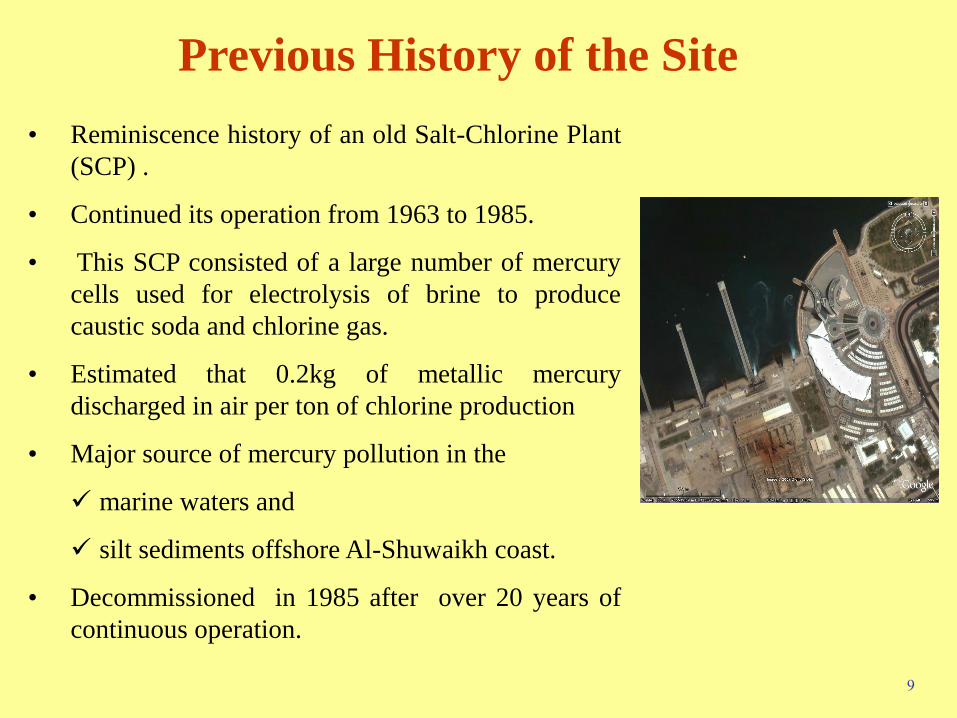
Previous History of the Site
• Reminiscence history of an old Salt-Chlorine Plant
(SCP) .
• Continued its operation from 1963 to 1985.
• This SCP consisted of a large number of mercury
cells used for electrolysis of brine to produce
caustic soda and chlorine gas.
• Estimated that 0.2kg of metallic mercury
discharged in air per ton of chlorine production
• Major source of mercury pollution in the
marine waters and
silt sediments offshore Al-Shuwaikh coast.
• Decommissioned in 1985 after over 20 years of
continuous operation.
Choking, sneezing, coughing? 10
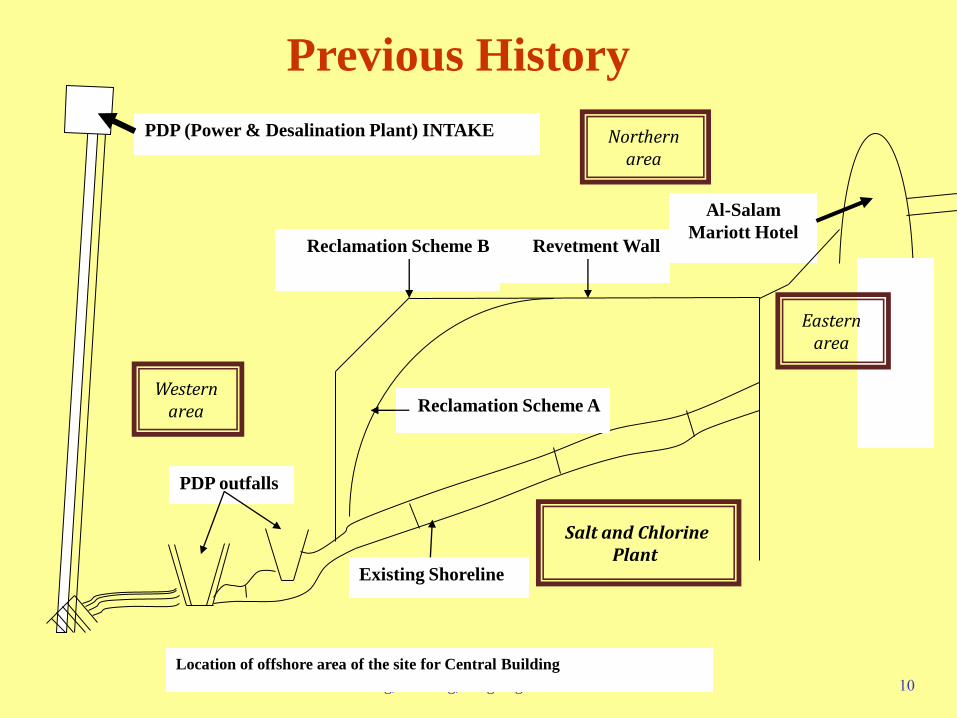
Location of offshore area of the site for Central Building
Al-Salam
Mariott Hotel Reclamation Scheme B Revetment Wall
Reclamation Scheme A
Existing Shoreline
PDP outfalls
PDP (Power & Desalination Plant) INTAKE
Western area
Northern area
Salt and Chlorine Plant
Eastern area
Previous History
11
• The Ministry of Public Works has authorized in 1995, the design
and supervision of the Central Bldg. in the light of
environmental, coastal and geotechnical issues.
• And they request the Central Bldg. to include
the implementation of wave sediment movement model,
predicting wave conditions and
local sediment movements
as a result of design of the revetment and reclamation work
along with the development frontage.
Previous History of the Site
12
• The Central Bldg. has requested Environment Public
Authority (EPA) to conduct extensive study in two phases
(before and after reclamation of the land) which include
water level variation prevailing near and offshore
currents and seabed bathymetry.
11-month study of air quality.
Water quality (143 samples)
A total 361 samples of air, water and sediment was
analyzed.
Previous History of the Site

13
Result from this study
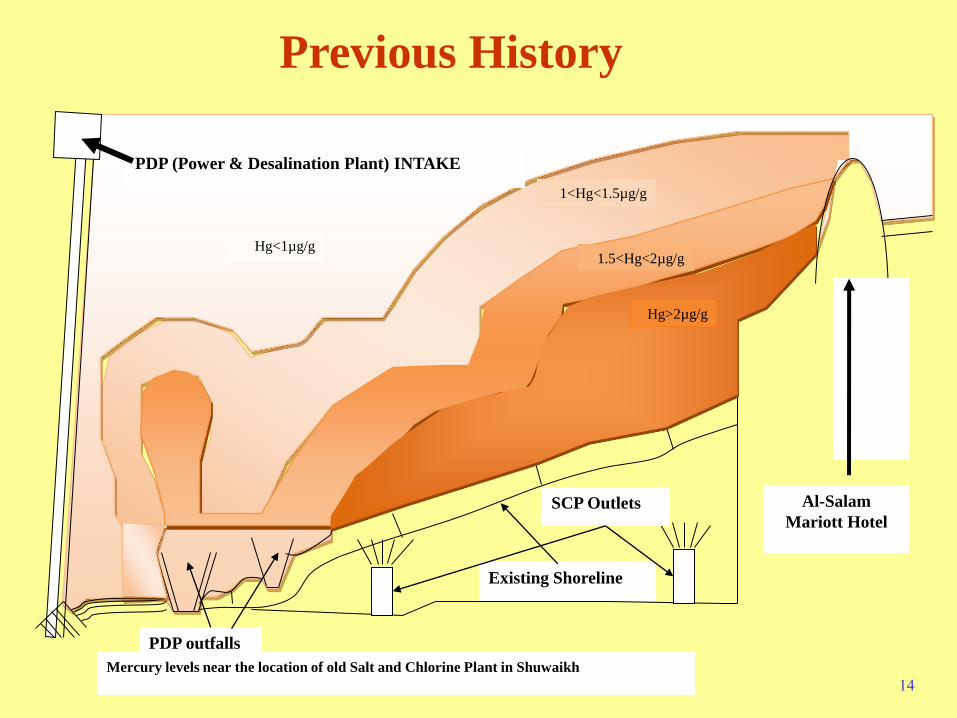
•The silty bottom sediments in the SCP southeastern near shore
area are heavily polluted with mercury.
• Estimated that the contaminated silt sediments (≈10,000 m3)
contain at present 400 kg of mercury (Massoud and Al-Sarawi,
1999).
Previous History of the Site
Choking, sneezing, coughing? 14
Al-Salam
Mariott Hotel
Mercury levels near the location of old Salt and Chlorine Plant in Shuwaikh
Existing Shoreline
PDP outfalls
PDP (Power & Desalination Plant) INTAKE
Hg<1µg/g 1.5<Hg<2µg/g
1<Hg<1.5µg/g
Hg>2µg/g
SCP Outlets
Previous History
15
• 30 cm surface layer of the silt sediment of SCP was
removed and unpolluted sand was used for land
reclamation.
• In Second Phase, air and water and sediment samples
were analyzed (Massoud 2002)
• It confirmed the adequacy of the site for further
development and construction of Central Bldg.
• Project duration was approx 5 years from 1998 to 2002.
Previous History of the Site

16
KISR
•In 2005 the Central Bldg. has requested KISR to check the
suitability of the building to be used officially for Block A
and Block B.
•Two projects were completed
• EC042C - Indoor air quality and Environmental assessment study for
the Central Bldg. (Short duration – a period of 3 months)
• EC056C – Provision of Continuous Monitoring and Reporting
Services indoor and outdoor air quality of the Central Bldg. (a period of 1
year)
The Central Building
17
As the reminisces history of the mercury
pollution, we focus in this presentation on the
baseline study of Hg contamination of the
area.
The Central Building
18
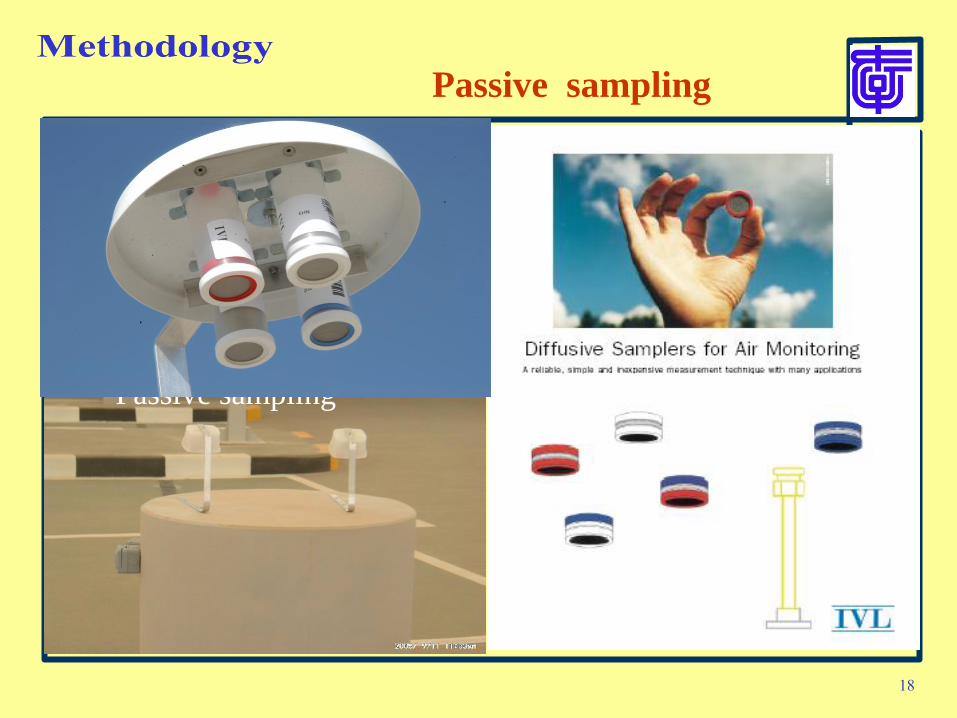
Passive sampling
Passive sampling
19
Methodology
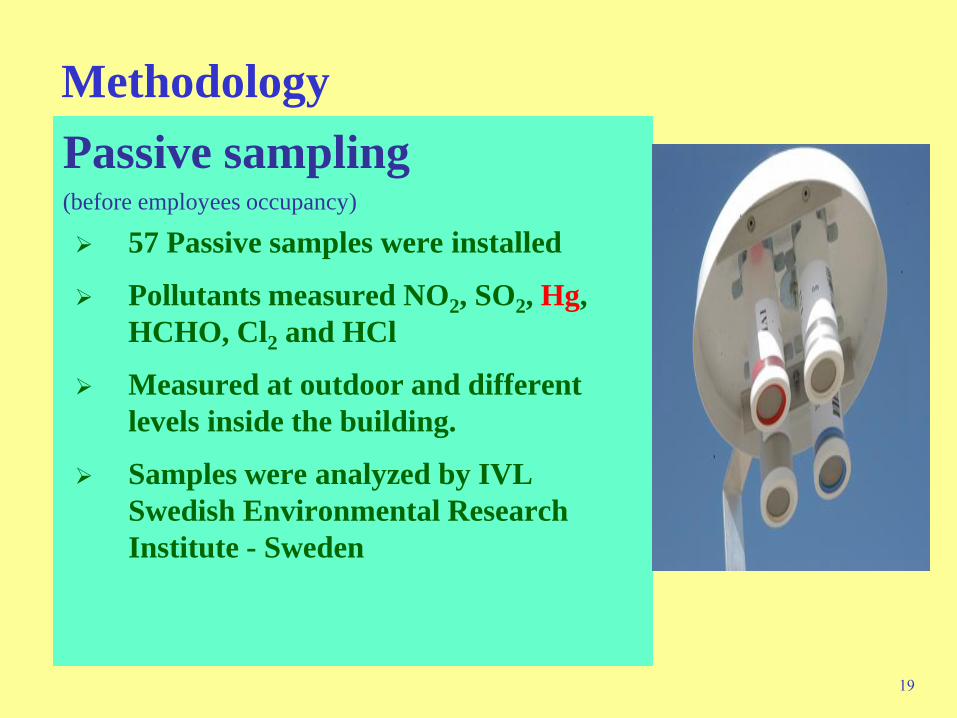
Passive sampling (before employees occupancy)
57 Passive samples were installed
Pollutants measured NO2, SO2, Hg,
HCHO, Cl2 and HCl
Measured at outdoor and different
levels inside the building.
Samples were analyzed by IVL
Swedish Environmental Research
Institute - Sweden

Methodology
• Passive Sampling
(after employees occupancy) 250 Passive samples has been obtained exposed and analyzed
at IVL Swedish Environmental Research Institute – Sweden
(EEC accredited laboratory)
Measured Pollutants are NO, NO2, SO2, H2S, Hg, Cl2 and HCl
BTEX, HCHO are also be measured
Measurements at outdoor and indoor “different levels inside
the building” have been accomplished for two weeks duration
and different waves of study period.
21
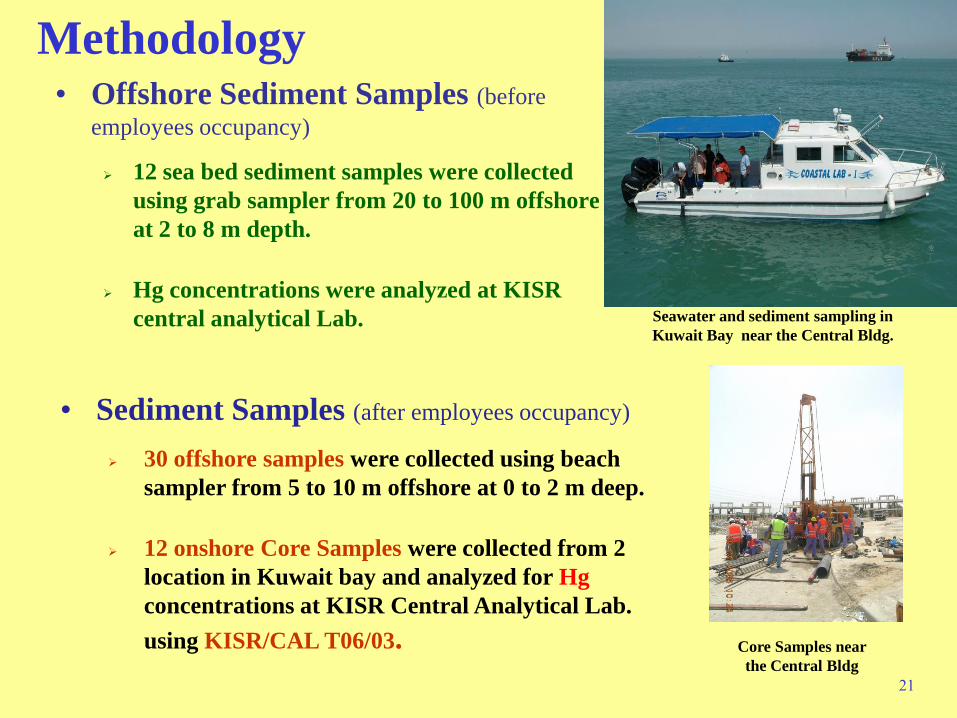
Methodology • Offshore Sediment Samples (before
employees occupancy)
12 sea bed sediment samples were collected
using grab sampler from 20 to 100 m offshore
at 2 to 8 m depth.
Hg concentrations were analyzed at KISR
central analytical Lab. Seawater and sediment sampling in
Kuwait Bay near the Central Bldg.
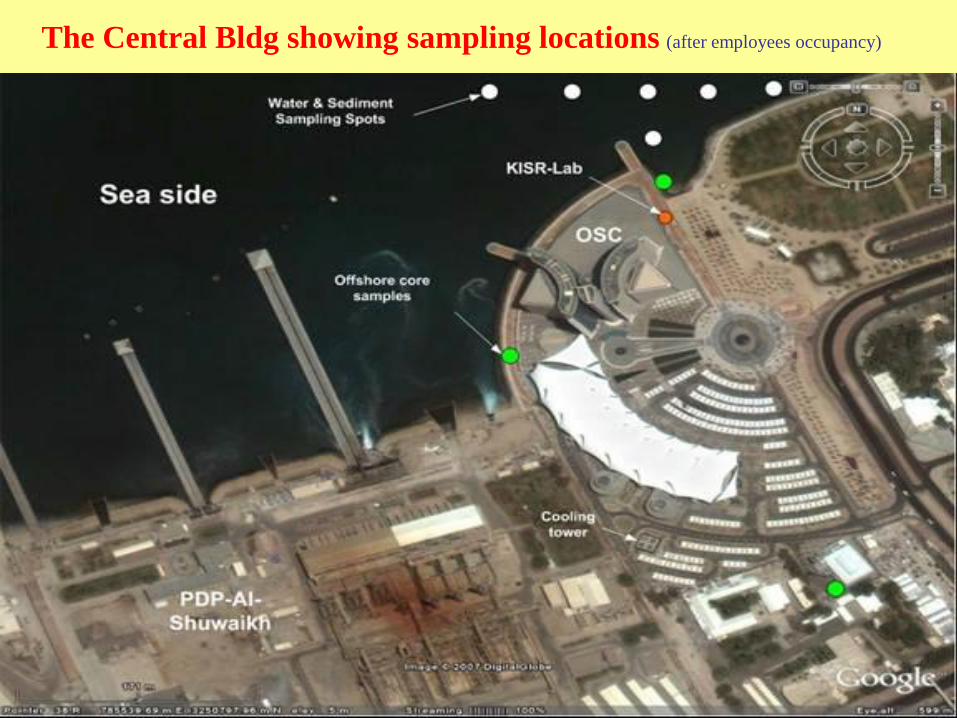
• Sediment Samples (after employees occupancy)
30 offshore samples were collected using beach
sampler from 5 to 10 m offshore at 0 to 2 m deep.
12 onshore Core Samples were collected from 2
location in Kuwait bay and analyzed for Hg
concentrations at KISR Central Analytical Lab.
using KISR/CAL T06/03. Core Samples near
the Central Bldg
22
Methodology
• Water samples (before employees occupancy)
5 sea water samples 2 Shuwaikh power station effluent discharge Samples were analyzed for ANION, CATION and Hg in KISR Labs.
• Water Samples (after employees occupancy)
24 sea water samples collected and analyzed and compared with Kuwait EPA standards.
5 Shuwaikh power station effluent discharge have been analyzed for chemical
additives, anti-foaming, anti-scalent, corrosion inhibitors and others, TPH can include all mentioned contaminants
Results of ANION, CATION and Hg in water samples were examined at KISR
Labs.
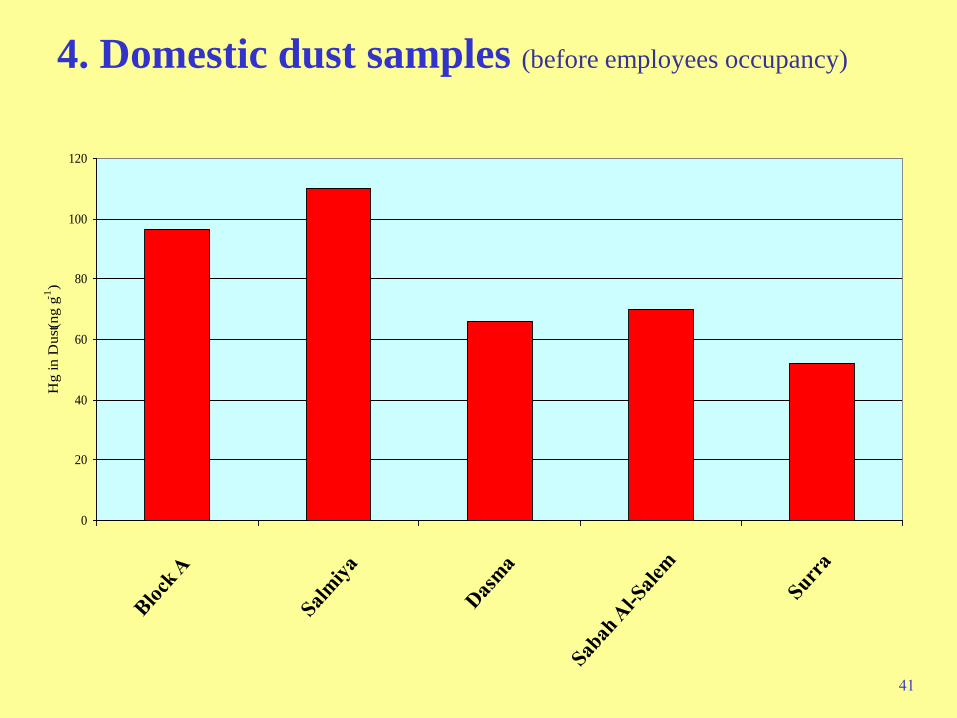
• Domestic dust samples (before employees occupancy)
5 domestic dust samples accumulated from Vacuum cleaners
from different localities in Kuwait
Samples were analyzed for Hg
The results were compared with the dust samples collected
from Block A.
Methodology
24
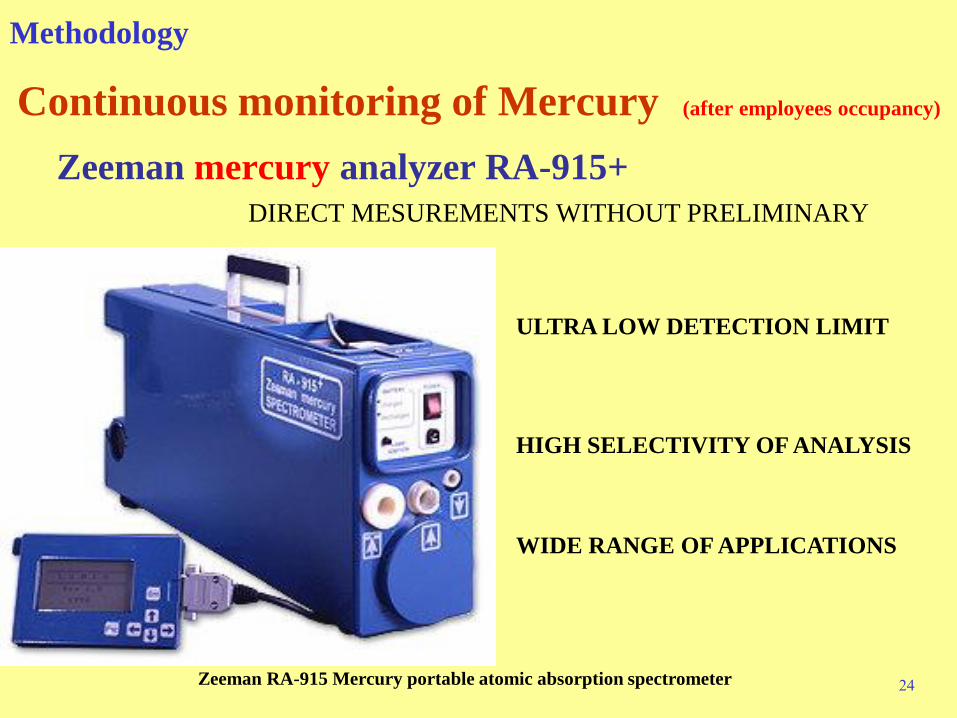
Continuous monitoring of Mercury (after employees occupancy)
Zeeman mercury analyzer RA-915+
DIRECT MESUREMENTS WITHOUT PRELIMINARY
ULTRA LOW DETECTION LIMIT
HIGH SELECTIVITY OF ANALYSIS
WIDE RANGE OF APPLICATIONS
Methodology
Zeeman RA-915 Mercury portable atomic absorption spectrometer

25
Project Results
1. Passive sampling
2. offshore sediment samples
3. Water samples
4. Domestic dust samples
5. Continuous monitoring of Mercury
26
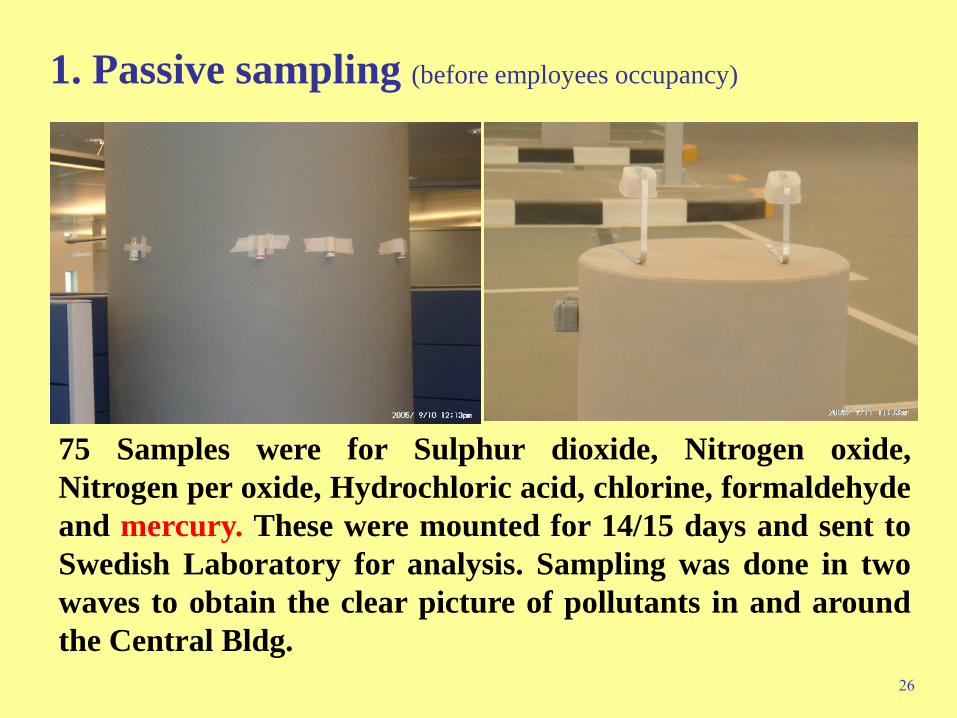
1. Passive sampling (before employees occupancy)
75 Samples were for Sulphur dioxide, Nitrogen oxide,
Nitrogen per oxide, Hydrochloric acid, chlorine, formaldehyde
and mercury. These were mounted for 14/15 days and sent to
Swedish Laboratory for analysis. Sampling was done in two
waves to obtain the clear picture of pollutants in and around
the Central Bldg.
27
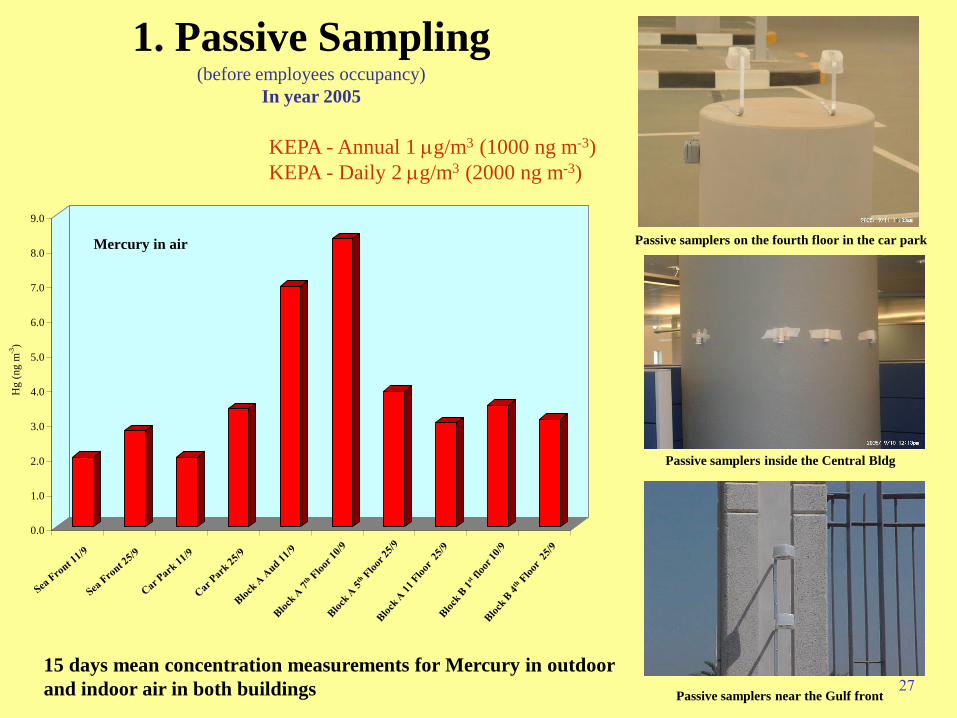
15 days mean concentration measurements for Mercury in outdoor
and indoor air in both buildings
1. Passive Sampling (before employees occupancy)
In year 2005
Passive samplers on the fourth floor in the car park
Passive samplers inside the Central Bldg
Passive samplers near the Gulf front
KEPA - Annual 1 mg/m3 (1000 ng m-3)
KEPA - Daily 2 mg/m3 (2000 ng m-3)
0.0
1.0
2.0
3.0
4.0
5.0
6.0
7.0
8.0
9.0
Hg (
ng m
-3)
Sea F
ront
11/
9
Sea F
ront
25/
9
Car
Par
k 11
/9
Car
Par
k 25
/9
KPC
Aud
11/
9
KPC
7th
10/
9
KPC
5th
25/
9
KPC
11t
h 25
/9
MO
Ist 1
0/9
MO
4th
25/
9
Mercury in air

28
• Mercury results in indoor air year 2005 0.0
2.0
4.0
6.0
8.0
10.
0
1 2 3 4 5 6 7 8 9 10
Hg
(n
g m
-3)
*KEPA - Annual 1 mg/m3 (1000 ng m-3)
KEPA - Daily 2 mg/m3 (2000 ng m-3) # USEPA - Annual Av. 70 ng m-3
USEPA - Daily Av. 140 ng m-3
^ IDLH - 1x10⁷ ng m-3 (10mg/m3) >TLV - 2.5x10⁴ ng m-3(25mg/m3)
1. Passive sampling (before employees occupancy)
* KEPA – Kuwait Environmental Public Authority # USEPA – Massachusetts United States Environmental Public Authority ^ IDLH – Immediate Danger to Life and Health > TLV – Threshold Limited Value

Mercury Passive samples year 2008 (after employees occupancy)
Floor 13: 7.9 ng m-3
Floor 11: 7 ng m-3
Floor 5: 5.8 ng m-3
Floor 3: 6.6 ng m-3
Floor 19: 4.5 ng m-3
Floor 16: 4.2 ng m-3
Floor 14: 11 ng m-3
Floor 7: 5.3 ng m-3
Floor 5: 6.2 ng m-3
Basement: 7 ng m-3
BLOCK A BLOCK B
Average concentration of mercury (ng m-3) at different
floors in Block A and Block B in 2007.
Average concentration of mercury (ng m-3)
at different sites.
16
3.4
44
4.4
5.36.2
7.87
4.24.5
6.65.8 5.3
7
1
10
100
Hg
( mg
m-3
)
Store
PTC Ahm
adi
KIS
R
Mobile
Lab
.
KPC 0
P
KPC 5
KPC 7
KPC 1
4
KPC 1
6
KPC 1
9
MO
O 3
MO
O 5
MO
O 7
MO
O 1
1
30
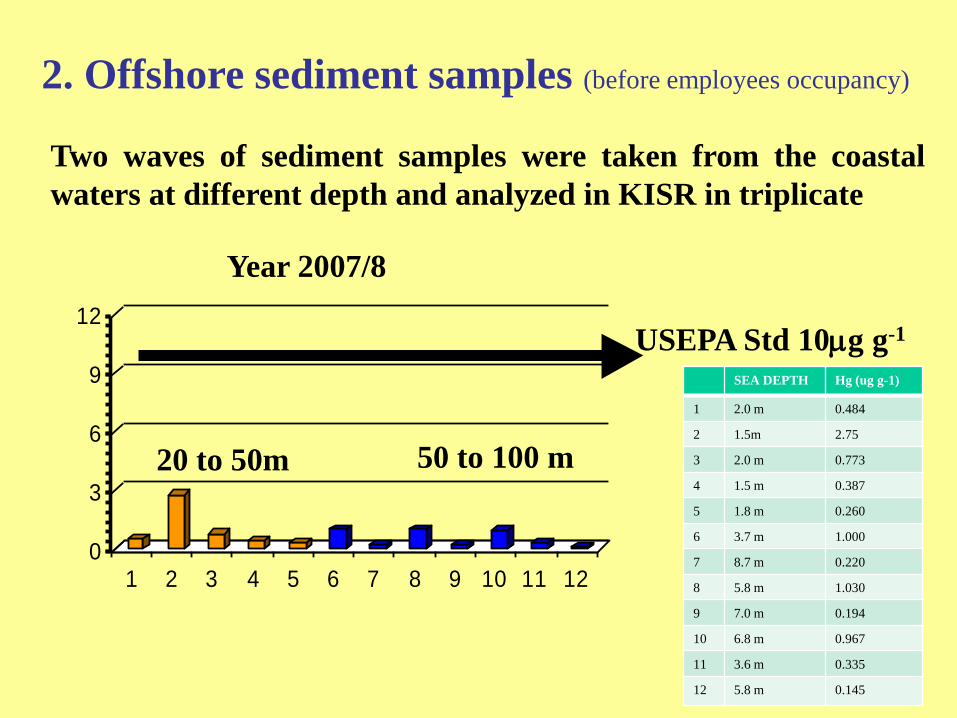
2. Offshore sediment samples (before employees occupancy)
Two waves of sediment samples were taken from the coastal
waters at different depth and analyzed in KISR in triplicate
0
3
6
9
12
1 2 3 4 5 6 7 8 9 10 11 12
USEPA Std 10mg g-1
20 to 50m 50 to 100 m
SEA DEPTH Hg (ug g-1)
1 2.0 m 0.484
2 1.5m 2.75
3 2.0 m 0.773
4 1.5 m 0.387
5 1.8 m 0.260
6 3.7 m 1.000
7 8.7 m 0.220
8 5.8 m 1.030
9 7.0 m 0.194
10 6.8 m 0.967
11 3.6 m 0.335
12 5.8 m 0.145
Year 2007/8
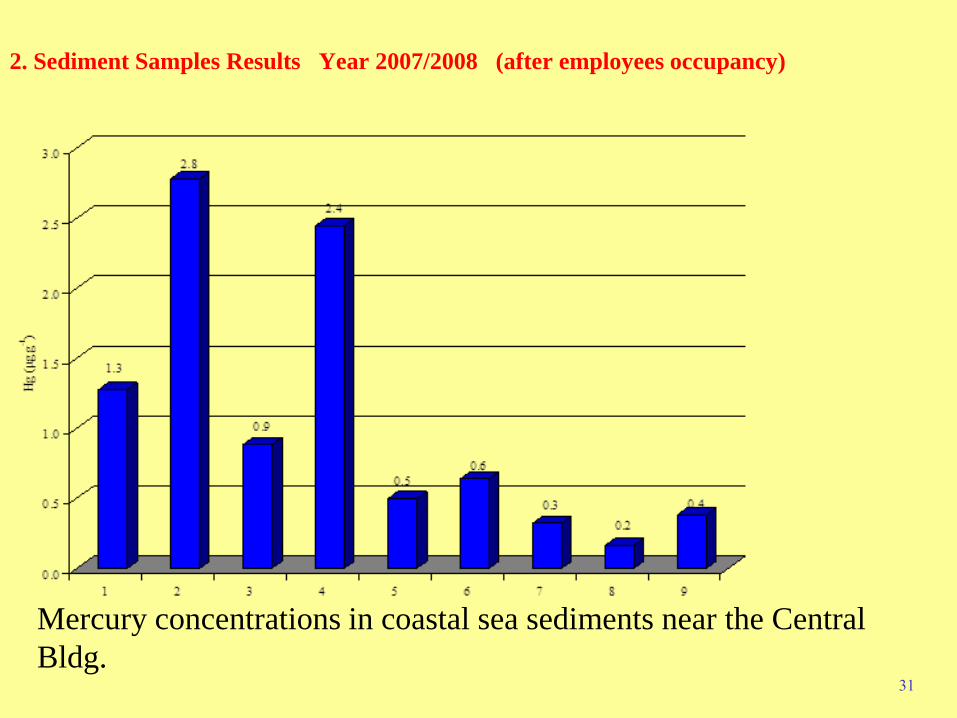
2. Sediment Samples Results Year 2007/2008 (after employees occupancy)
31
Mercury concentrations in coastal sea sediments near the Central
Bldg.
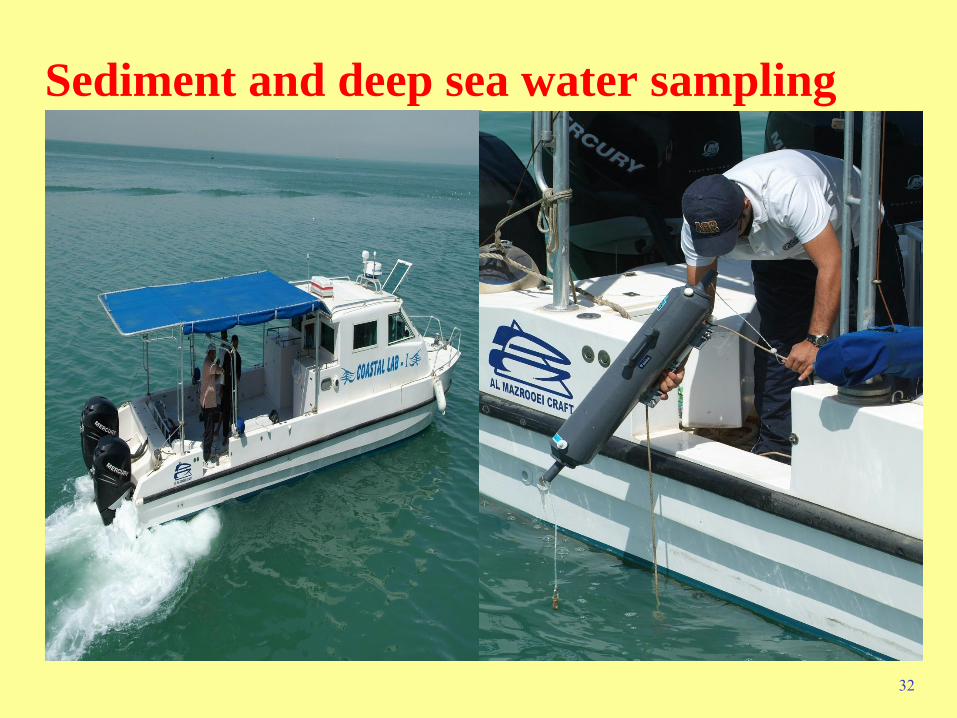
32
Sediment and deep sea water sampling
33
The Central Bldg showing sampling locations (after employees occupancy)

Core Samples

35
Core Sampling near Loading Bay

Beach onshore sampling
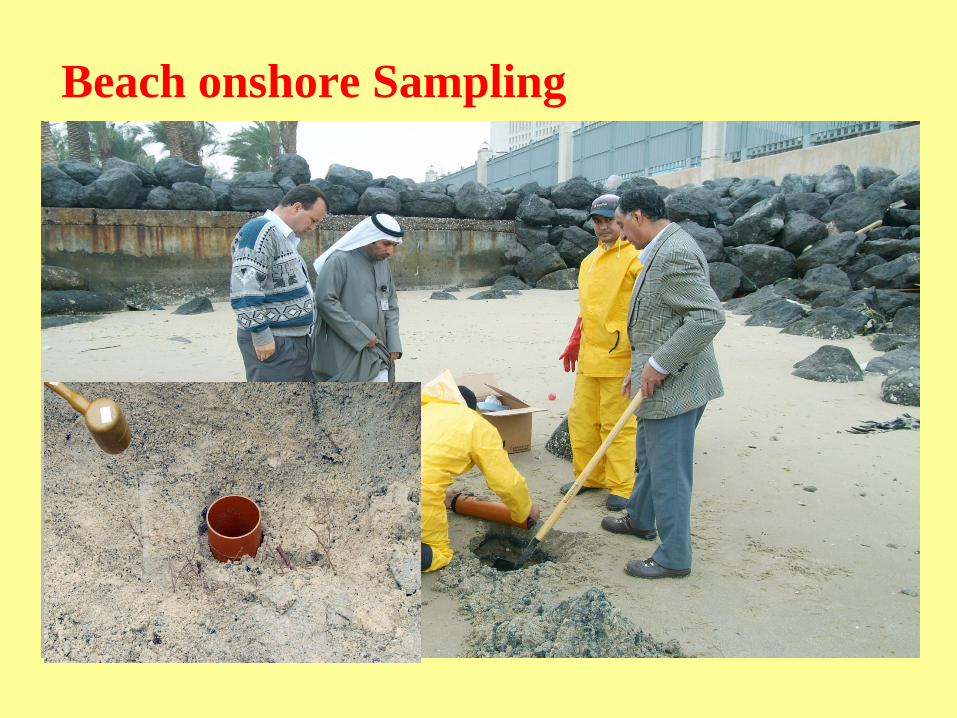
Beach onshore Sampling
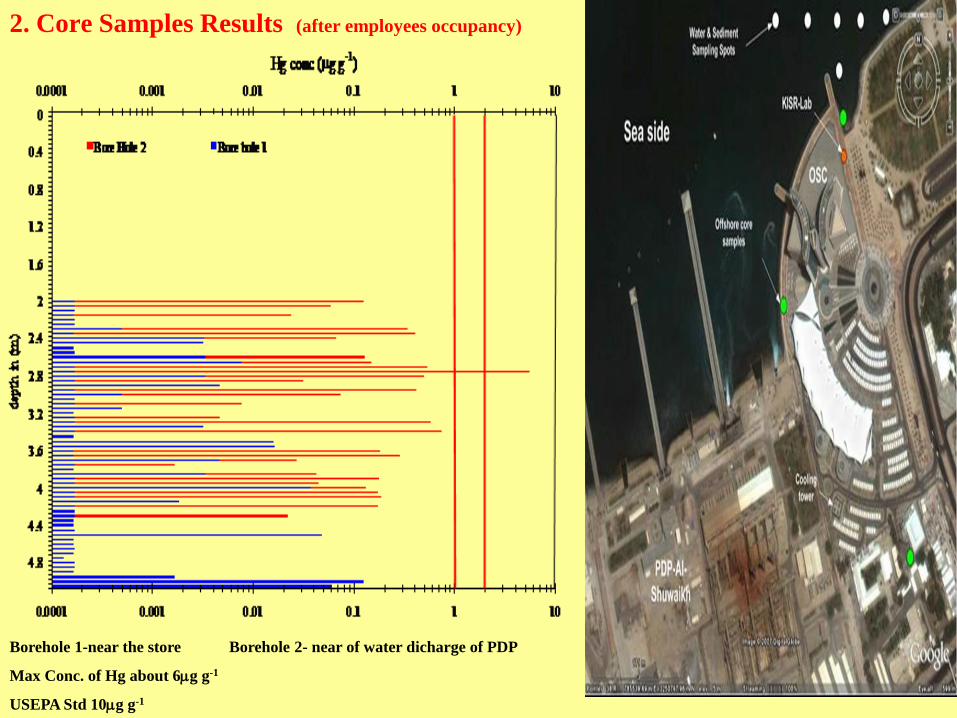
2. Core Samples Results (after employees occupancy)
Borehole 1-near the store Borehole 2- near of water dicharge of PDP
Max Conc. of Hg about 6mg g-1
USEPA Std 10mg g-1
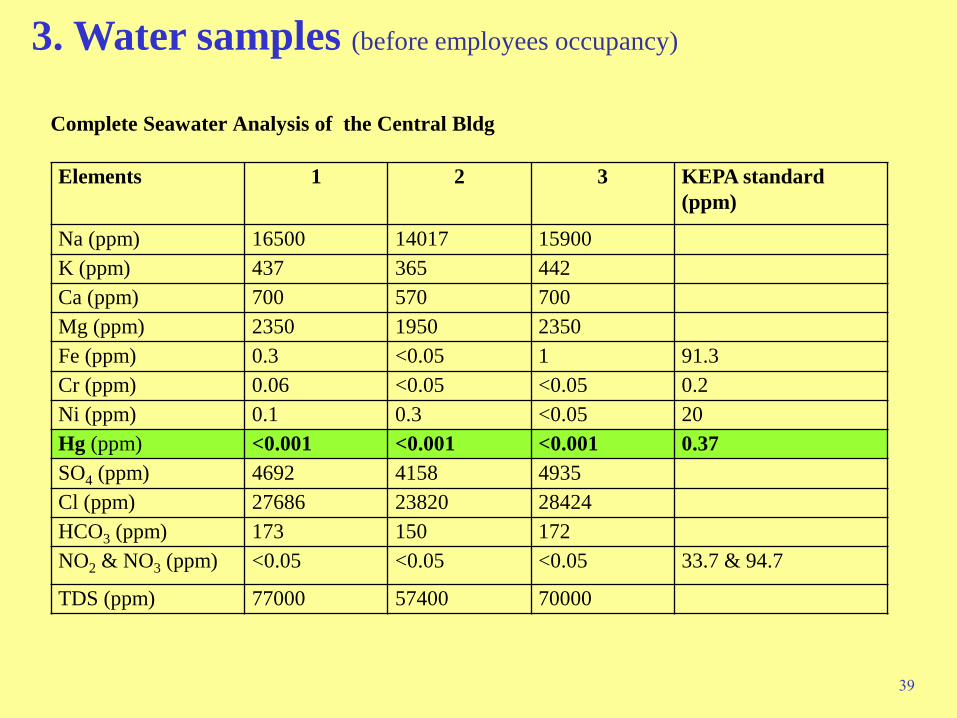
Complete Seawater Analysis of the Central Bldg
Elements 1 2 3 KEPA standard
(ppm)
Na (ppm) 16500 14017 15900
K (ppm) 437 365 442
Ca (ppm) 700 570 700
Mg (ppm) 2350 1950 2350
Fe (ppm) 0.3 <0.05 1 91.3
Cr (ppm) 0.06 <0.05 <0.05 0.2
Ni (ppm) 0.1 0.3 <0.05 20
Hg (ppm) <0.001 <0.001 <0.001 0.37
SO4 (ppm) 4692 4158 4935
Cl (ppm) 27686 23820 28424
HCO3 (ppm) 173 150 172
NO2 & NO3 (ppm) <0.05 <0.05 <0.05 33.7 & 94.7
TDS (ppm) 77000 57400 70000
39
3. Water samples (before employees occupancy)

40
Water Analysis Results (after employees occupancy)
Sample
No.
SO4
(ppm)
Cl
(ppm)
Cd
(ppm)
Pb
(ppm)
Mg
(ppm)
Hg
(ppm)
Ca
(ppm)
BH1A 2787 2273 <0.001 <0.001 57.6 <0.001
182
BH2A 89 228 <0.001 <0.001 43.4 <0.001 154
BH1B 569 2312 <0.001 <0.001 57.8 <0.001 175
BH2B 2770 212 <0.001 <0.001 42 <0.001 141
OA1 2311 23128 <0.001 <0.001 54.5 <0.001 134
OA2 2287 23809 <0.001 <0.001 4.8 <0.001 139
OA3 2256 22279 <0.001 <0.001 54.8 <0.001 135
OB1 2317 23153 <0.001 <0.001 54.5 <0.001 129
OB2 2301 22755 <0.001 <0.001 53.7 <0.001 128
OB3 2292 22681 <0.001 <0.001 53.4 <0.001 146
41
4. Domestic dust samples (before employees occupancy)
0
20
40
60
80
100
120
KPC
Salm
yia
Des
man
Sabah
Al-Sal
em
Surra
Hg in D
ust
(ng g
-1)
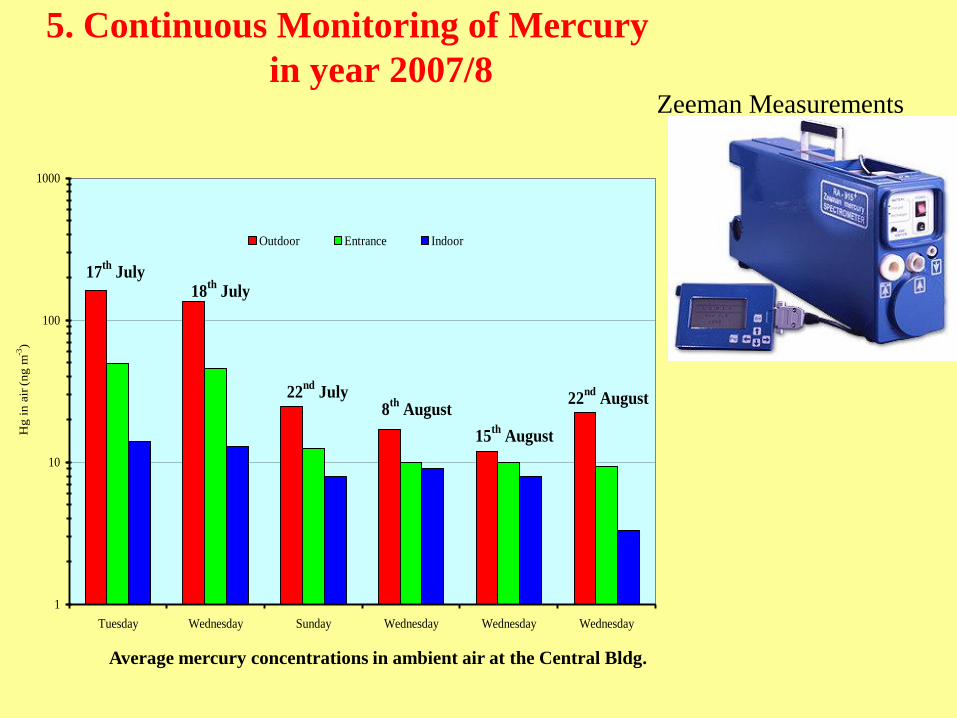
5. Continuous Monitoring of Mercury
in year 2007/8
1
10
100
1000
Tuesday Wednesday Sunday Wednesday Wednesday Wednesday
Hg i
n a
ir (
ng m
-3)
Outdoor Entrance Indoor
17th
July18
th July
22nd
July8
th August
15th
August
22nd
August
Zeeman Measurements
Average mercury concentrations in ambient air at the Central Bldg.

43
Outdoor/Indoor daily average and maximum concentrations of mercury in the ambient air at the Central Bldg.
5. Continuous Monitoring of Mercury
Zeeman Measurements
0.1
1
10
100
1000
7/17
/200
7
7/18
/200
7
7/22
/200
7
7/29
/200
7
8/8/
2007
8/15
/200
7
8/22
/200
7
11/5/2
007
11/7/2
007
11/8/2
007
11/10/
2007
11/12/
2007
11/14/
2007
11/15/
2007
11/18/
2007
11/19/
2007
11/22/
2007
11/25/
2007
11/26/
2007
Hg C
oncentr
ation (
ngm-3
)
10:10hr
1:42hr
1:44hr
3:32hr
17:16hr
10:17hr
14:52hr
3:15hr
14:22hr
11:19hr
15:56hr
21:42hr
2:11hr
2:17hr1:24hr
11:01hr
10:56hr
9:40hr9:47hr
Outdoor
indoor
KEPA - Annual 1 mg/m3 (1000 ng m-3)
KEPA - Daily 2 mg/m3 (2000 ng m-3)
Max Conc. of Hg about 175 ngm-3

44
• Mercury measurements in air, water and soil have eliminated existing of any local source.
• Mercury in ambient air has concentration < 8ng m-3
• Hg in core samples <6mg g-1= (6ppm)
• Hg in sea sediments < 1mg g-1= (1ppm)
• Hg in accumulated dust samples< 1mg g-1 = (1ppm)
• Hg in seawater is below detection limit
• Hg in groundwater is also below detection limit
• Hg in indoor air <10 ng m-3
• Hg in outdoor air reached 175 ng m-3due to distant source (Al-Doha power station when the prevailing wind from NW and wind speed ranged between 1.5 ms-1 and 2.5 ms-1 ) .
• All pollutants concentrations are within KEPA Limits
• Air pollution monitoring should be repeated every five years to notice any changes originating from continuous use with variable levels of occupancy generating constraints on local utilities and to validate our old data.
Findings

45
Kuwait Institute for Scientific Research معهد الكويت لألبحاث العلمية
46
47
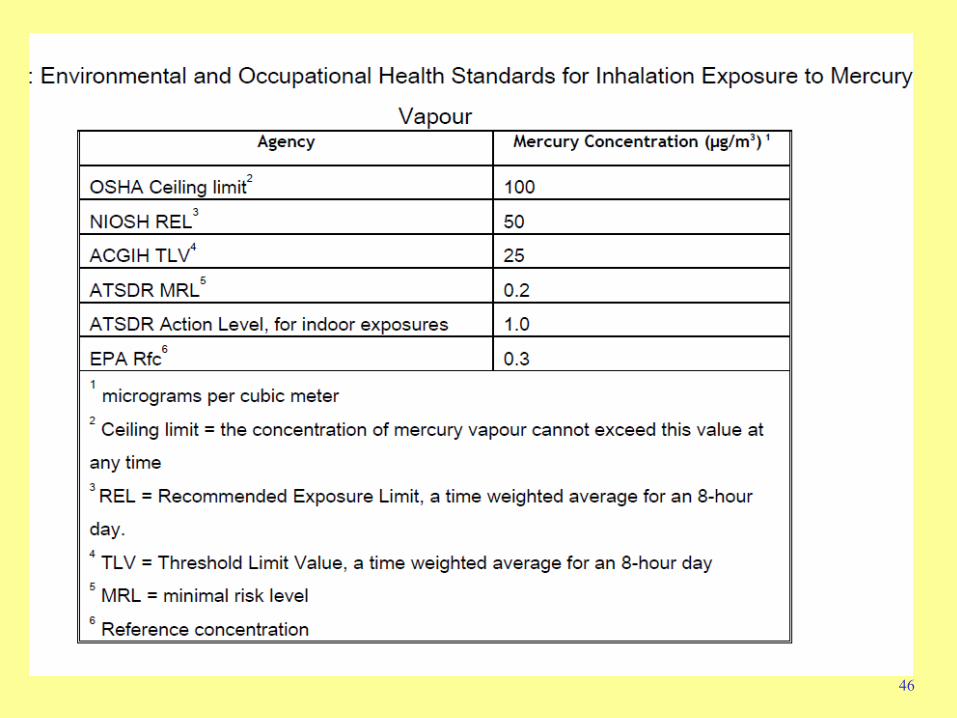
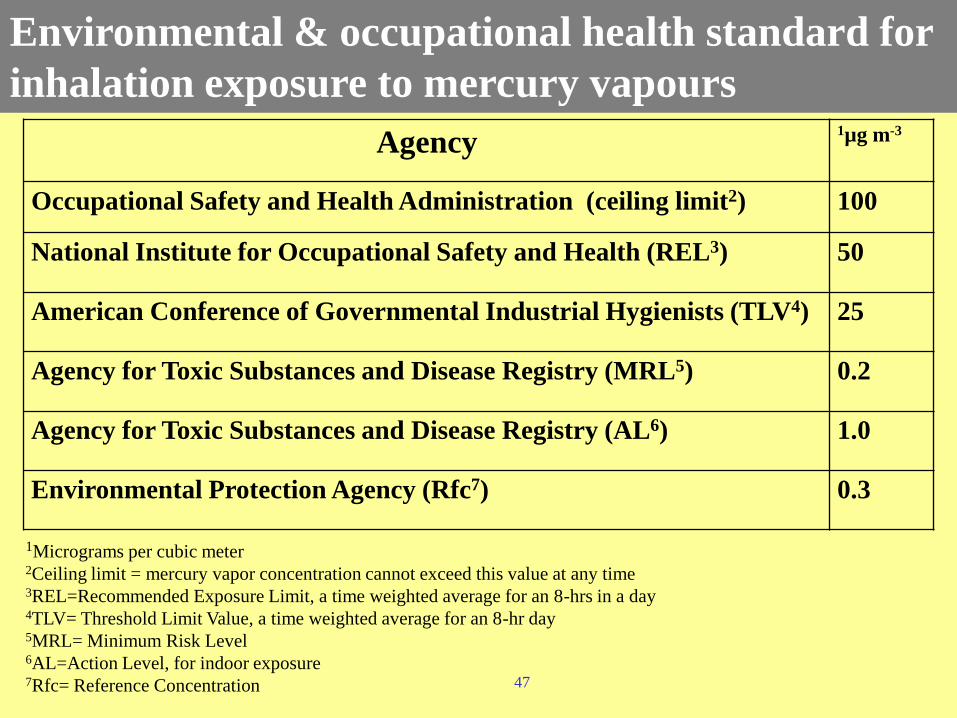
Environmental & occupational health standard for
inhalation exposure to mercury vapours
Agency 1µg m-3
Occupational Safety and Health Administration (ceiling limit2) 100
National Institute for Occupational Safety and Health (REL3) 50
American Conference of Governmental Industrial Hygienists (TLV4) 25
Agency for Toxic Substances and Disease Registry (MRL5) 0.2
Agency for Toxic Substances and Disease Registry (AL6) 1.0
Environmental Protection Agency (Rfc7) 0.3
1Micrograms per cubic meter 2Ceiling limit = mercury vapor concentration cannot exceed this value at any time 3REL=Recommended Exposure Limit, a time weighted average for an 8-hrs in a day 4TLV= Threshold Limit Value, a time weighted average for an 8-hr day 5MRL= Minimum Risk Level 6AL=Action Level, for indoor exposure 7Rfc= Reference Concentration
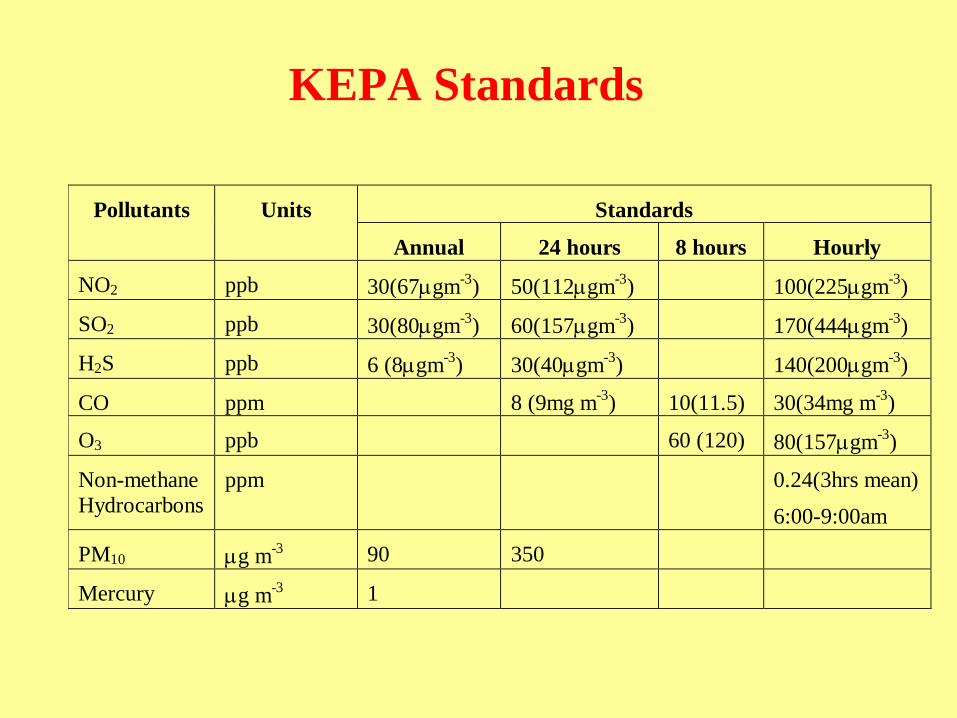
KEPA Standards
Standards Pollutants Units
Annual 24 hours 8 hours Hourly
NO2 ppb 30(67mgm-3
) 50(112mgm-3
) 100(225mgm-3
)
SO2 ppb 30(80mgm-3
) 60(157mgm-3
) 170(444mgm-3
)
H2S ppb 6 (8mgm-3
) 30(40mgm-3
) 140(200mgm-3
)
CO ppm 8 (9mg m-3
) 10(11.5) 30(34mg m-3
)
O3 ppb 60 (120) 80(157mgm-3
)
Non-methane
Hydrocarbons
ppm 0.24(3hrs mean)
6:00-9:00am
PM10 mg m-3
90 350
Mercury mg m-3
1
Recommended