1
In accordance with the applicable regulation, we inform the reader that this material is qualified as a
marketing document. Data as of 03 July 2017, 11 p.m. Paris time.
Equity Solutions
WATCHER
07/05/2017 Weekly Publication
Luxury: a new environment
2
Editorial (1/2)
Contents
2 Editorial
4 Focus: Basket of Stocks
6 Market Dashboard &
Conviction Lists –
Performances
7 Global Conviction List &
Historical Performance
9 Dividend Conviction List
10 Emerging Markets
Overview
11 Regional Conviction Lists
13 Convictions by Sectors
14 Contact Details
15 Rating System
16 Calculation Methodology
17 Glossary
19 Important Disclosures &
Disclaimers
This document presents equity ideas
exclusively provided for potential investments.
This document cannot be considered as
adapted to a person or based on the analysis
of the situation of a person.
Data & recommendations as of 03 July, 2017
close
Luxury: a new environment
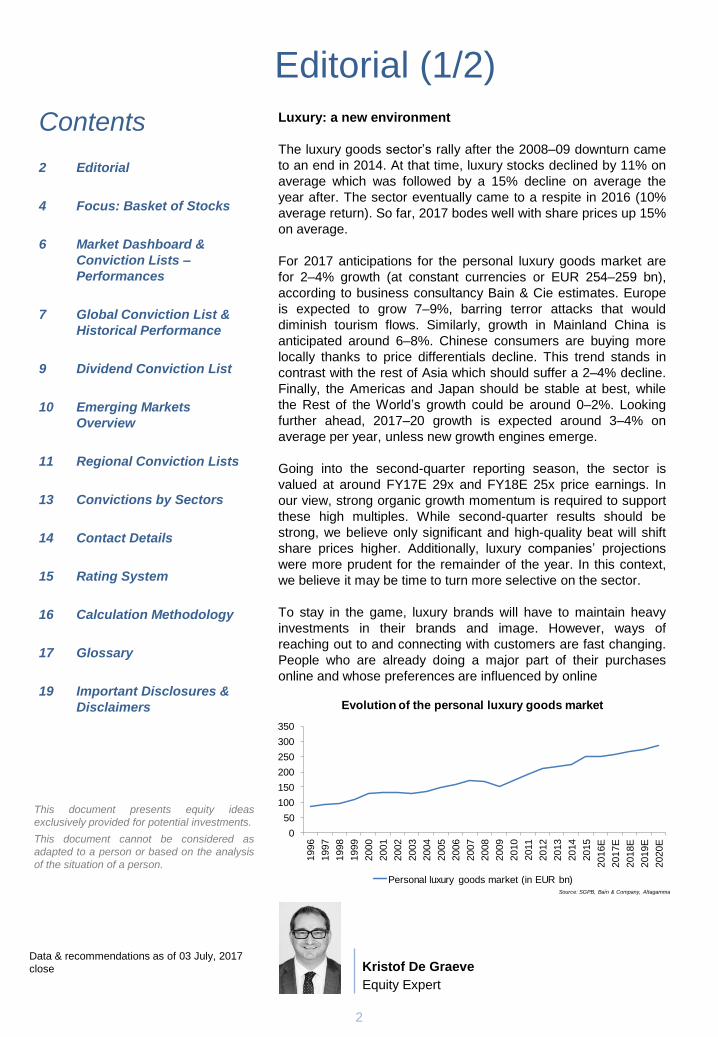
The luxury goods sector’s rally after the 2008–09 downturn came
to an end in 2014. At that time, luxury stocks declined by 11% on
average which was followed by a 15% decline on average the
year after. The sector eventually came to a respite in 2016 (10%
average return). So far, 2017 bodes well with share prices up 15%
on average.
For 2017 anticipations for the personal luxury goods market are
for 2–4% growth (at constant currencies or EUR 254–259 bn),
according to business consultancy Bain & Cie estimates. Europe
is expected to grow 7–9%, barring terror attacks that would
diminish tourism flows. Similarly, growth in Mainland China is
anticipated around 6–8%. Chinese consumers are buying more
locally thanks to price differentials decline. This trend stands in
contrast with the rest of Asia which should suffer a 2–4% decline.
Finally, the Americas and Japan should be stable at best, while
the Rest of the World’s growth could be around 0–2%. Looking
further ahead, 2017–20 growth is expected around 3–4% on
average per year, unless new growth engines emerge.
Going into the second-quarter reporting season, the sector is
valued at around FY17E 29x and FY18E 25x price earnings. In
our view, strong organic growth momentum is required to support
these high multiples. While second-quarter results should be
strong, we believe only significant and high-quality beat will shift
share prices higher. Additionally, luxury companies’ projections
were more prudent for the remainder of the year. In this context,
we believe it may be time to turn more selective on the sector.
To stay in the game, luxury brands will have to maintain heavy
investments in their brands and image. However, ways of
reaching out to and connecting with customers are fast changing.
People who are already doing a major part of their purchases
online and whose preferences are influenced by online
Kristof De Graeve
Equity Expert
0
50
100
150
200
250
300
350
1996
1997
1998
1999
2000
2001
2002
2003
2004
2005
2006
2007
2008
2009
2010
2011
2012
2013
2014
2015
2016E
2017E
2018E
2019E
2020E
Evolution of the personal luxury goods market
Personal luxury goods market (in EUR bn)Source: SGPB, Bain & Company, Altagamma
3
Editorial (2/2)
This document presents equity ideas
exclusively provided for potential investments.
This document cannot be considered as
adapted to a person or based on the analysis
of the situation of a person.
communities instead of celebrities will be tomorrow’s luxury client
target.
Online penetration in luxury goods is only around 7% today, well
below the 12% for the general apparel & footwear segment.
Although most of the luxury brands have an online strategy, until
now their approach has been rather reactive. However
momentum for further expansion is gaining traction. Richemont’s
online luxury retailer Net-A-Porter already teamed up with Yoox in
2015. There are also rumours that Alibaba has shown interest in a
co-operation with the online fashion retailer. Beginning of June,
LVMH launched its luxury ecommerce platform 24 Sèvres.
Competition in the luxury landscape is still increasing with online
revolution lowering entry barriers. However, the development of a
fully-fledged online channel may prove too costly for smaller
brands. Larger cash-rich groups are looking for investment
opportunities in a diversification effort or to complement their offer.
In 2016 LVMH sold Donna Karan to acquire a majority stake in
German premium luggage company Rimowa. In an effort to
simplify the complex corporate structure between Groupe Arnault,
Christian Dior and LVMH, the family holding launched an offer to
buy Christian Dior’s remaining shares. Subsequently Dior Couture
will be sold to LVMH. On the other side of the Atlantic, handbag
maker Coach is in the process of buying its smaller rival Kate
Spade.
Overall, we maintain a preference for strong established brands
that have a solid balance sheet and for which we see future
growth opportunities. In this context, we believe LVMH, Kering,
Burberry and Richemont are best positioned.
4
Burberry (BRBY-GB) – BUY – Target Price: GBP 18.60
Investment Case: Since May 2016, Burberry worked on revamping growth and increasing efficiency. The
new management should accelerate the execution of the strategy aimed at driving top-line growth and
increasing efficiency throughout the organisation. We see scope for significant top-line growth and margin
expansion. Burberry puts great emphasis on shareholder returns. Its priorities for cash flow use are
organic growth, a progressive dividend, strategic investments and return of surplus capital. The generous
shareholder return policy and ecommerce plans distinct Burberry from other luxury companies.
Main Risks: Being a mono-brand company, all of the group’s segments would be impacted should the
brand image be weakened. Its exposure to US outlets could damage brand equity. The group is reliant on
the Asian market. The shares could remain volatile until the new management proves its good grasp on
the company’s operation and issues.
Company Description: Founded in 1856, London-based Burberry is a global luxury brand famous for its
iconic trench coat. The company got publicly quoted in 1920, was acquired in 1955 and was floated again
in 2002. Belgian holding GBL, listed on Euronext, bought a stake in Burberry in 2016 (2.95% at 2016-end)
and disclosed a 3% stake end of February 2017.
For a detailed analysis, please refer to the Burberry Equity Note, which can be found here.
Kering (KER-FR) – BUY – Target Price: EUR 300.00
Investment Case: Kering has a history of actively managing its portfolio of activities. Therefore, we do
not rule out an exit from the sport and lifestyle segment. The repositioning of the Gucci brand is paying off
and the recovery should have further to go. Momentum at YSL is solid. Bottega Veneta (16%) may take
time and effort to realise its potential. In our view, Kering could be in the early stages of a virtuous cycle of
increasing sales, profitability and FCF while reducing debt.
Main Risks: Any deterioration in consumer spending, unfavourable foreign currency movements and a
hike in the tax rate would weigh on Kering’s results. Gucci’s recovery looks promising but could be fragile.
It is not sure that comparable sales growth will help expand margins. Bottega Veneta is underperforming.
Kering has higher financial leverage than its peers.
Company Description: Kering owns Gucci, Bottega Veneta and Yves Saint Laurent (YSL), and is also
active in the sport and lifestyle segment through its 85.81% participation in Puma. Artémis Group,
controlled by the Pinault family, holds 40.9% of the capital and 57.41% of the votes. François-Henri
Pinault is Chairman and CEO.
For a detailed analysis, please refer to the Kering Equity Note, which can be found here.
Focus: Basket of Stocks (1/2)
5
LVMH Moët Hennessy Louis Vuitton (MC-FR) – BUY – Target Price: EUR 235.00
Investment Case: LVMH’s solid balance sheet and FCF generation allow for large advertising
expenditures but also facilitate the financing of retail network expansion, and keep leeway for M&A. LVMH
looks less vulnerable to a downturn in any particular market segment or geography thanks to a diversified
revenue and profit base. LVMH aims to raise prices in Europe in FY17 after the successful repositioning
of Louis Vuitton. With Christian Dior Couture LVMH adds an iconic, large, growing and profitable brand to
its portfolio.
Main Risks: LVMH is very dependent on Louis Vuitton and on Asian consumers/tourists The personal
luxury goods market is growing, yet cyclical. Competition has increased and consumer preferences are
changing rapidly. The retail channel has gained importance introducing higher operating leverage.
Sizeable acquisition targets are scarce and could prove very expensive.
Company Description: LVMH, formed through the 1987 merger of Louis Vuitton and Moët Hennessy, is
the world’s largest luxury group. Moët Hennessy is a 66%/34% joint venture with Diageo. The Arnault
family controls 46.74% of the shares and 63.07% of votes, directly and indirectly (a.o. through Euronext-
listed Christian Dior SE). Bernard Arnault is Chairman and CEO.
For a detailed analysis, please refer to the LVMH Equity Note, which can be found here.
Richemont (CFR-CH) – BUY – Target Price: CHF 85.00
Investment Case: Hard luxury and the watch segment in particular are currently in the doldrums. CFR
has been hit, but we believe it is well-placed to benefit from a market upturn. CFR’s watch portfolio has
very strong brands, positioned in the high-end of the market. Cartier may be on the brink of recovery.
Moreover, the watch category as a whole could have troughed. In jewellery, CFR holds a strong position.
Branded jewellery is still an underpenetrated category, poised for structural growth, in our view.
Main Risks: Hard luxury is the most cyclical segment of the luxury goods market. If the current downturn
isn’t a swing but a structural crisis, CFR’s profitability could be severely pressured and the shares could
significantly de-rate. CFR’s results are heavily dependent on Asian markets, Asian tourist flows, the
Cartier brand and the CHF rate.
Company Description: Richemont (CFR) is positioned as the second luxury group globally and holds the
first position in hard luxury (watches and jewellery) with well-known brands such as Cartier. CFR also has
a 49% capital stake (25% of the votes) in YOOX, the online fashion retail store. Compagnie Financière
Rupert owns 9.1% of CFR’s capital and 50% of the votes.
For a detailed analysis, please refer to the Richemont Equity Note, which can be found here.
Focus: Basket of Stocks (2/2)
6
Conviction Lists1
& Benchmarks
MSCI World AC
Group Ranked Returns
Global Style
Counselling2
1 Conviction lists’ content is detailed on the following pages. 2 Each style is defined according to MSCI standards, detailed in the glossary.
Market Dashboard & Conviction-list Performance
Past performance is not a reliable indicator of the future performance. The amounts indicated above do not include any fees,
duties or other charges which may be added in case of conclusion of an operation.
07/03/2017 Weekly YTD
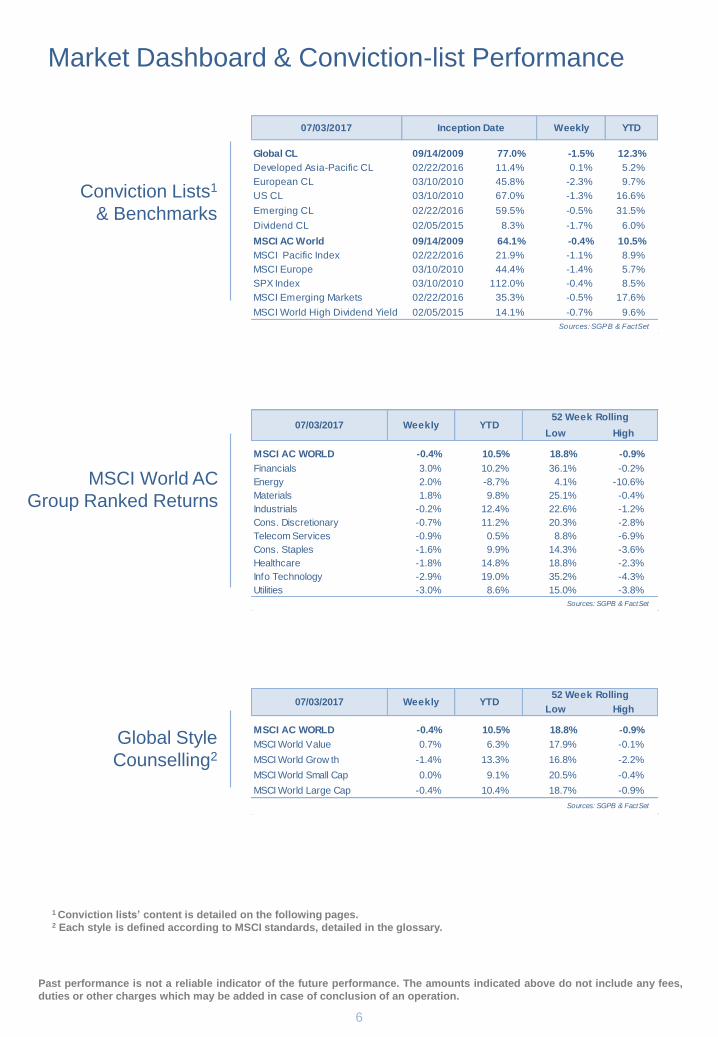
Global CL 09/14/2009 77.0% -1.5% 12.3%
Developed Asia-Pacific CL 02/22/2016 11.4% 0.1% 5.2%
European CL 03/10/2010 45.8% -2.3% 9.7%
US CL 03/10/2010 67.0% -1.3% 16.6%
Emerging CL 02/22/2016 59.5% -0.5% 31.5%
Dividend CL 02/05/2015 8.3% -1.7% 6.0%
MSCI AC World 09/14/2009 64.1% -0.4% 10.5%
MSCI Pacific Index 02/22/2016 21.9% -1.1% 8.9%
MSCI Europe 03/10/2010 44.4% -1.4% 5.7%
SPX Index 03/10/2010 112.0% -0.4% 8.5%
MSCI Emerging Markets 02/22/2016 35.3% -0.5% 17.6%
MSCI World High Dividend Yield 02/05/2015 14.1% -0.7% 9.6%
Sources: SGPB & FactSet
Inception Date
Low High
MSCI AC WORLD -0.4% 10.5% 18.8% -0.9%
Financials 3.0% 10.2% 36.1% -0.2%
Energy 2.0% -8.7% 4.1% -10.6%
Materials 1.8% 9.8% 25.1% -0.4%
Industrials -0.2% 12.4% 22.6% -1.2%
Cons. Discretionary -0.7% 11.2% 20.3% -2.8%
Telecom Services -0.9% 0.5% 8.8% -6.9%
Cons. Staples -1.6% 9.9% 14.3% -3.6%
Healthcare -1.8% 14.8% 18.8% -2.3%
Info Technology -2.9% 19.0% 35.2% -4.3%
Utilities -3.0% 8.6% 15.0% -3.8%
Sources: SGPB & FactSet
07/03/2017 Weekly YTD52 Week Rolling
Low High
MSCI AC WORLD -0.4% 10.5% 18.8% -0.9%
MSCI World Value 0.7% 6.3% 17.9% -0.1%
MSCI World Grow th -1.4% 13.3% 16.8% -2.2%
MSCI World Small Cap 0.0% 9.1% 20.5% -0.4%
MSCI World Large Cap -0.4% 10.4% 18.7% -0.9%
Sources: SGPB & FactSet
07/03/2017 Weekly YTD52 Week Rolling
7
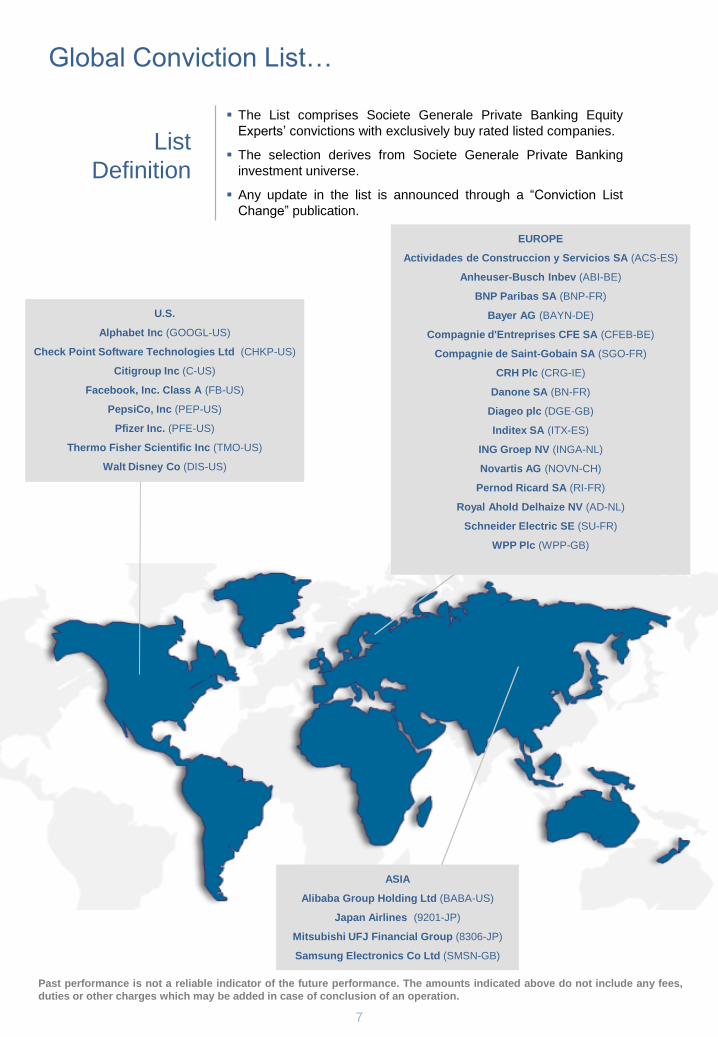
The List comprises Societe Generale Private Banking Equity
Experts’ convictions with exclusively buy rated listed companies.
The selection derives from Societe Generale Private Banking
investment universe.
Any update in the list is announced through a “Conviction List
Change” publication.
List
Definition
U.S.
Alphabet Inc (GOOGL-US)
Check Point Software Technologies Ltd (CHKP-US)
Citigroup Inc (C-US)
Facebook, Inc. Class A (FB-US)
PepsiCo, Inc (PEP-US)
Pfizer Inc. (PFE-US)
Thermo Fisher Scientific Inc (TMO-US)
Walt Disney Co (DIS-US)
EUROPE
Actividades de Construccion y Servicios SA (ACS-ES)
Anheuser-Busch Inbev (ABI-BE)
BNP Paribas SA (BNP-FR)
Bayer AG (BAYN-DE)
Compagnie d'Entreprises CFE SA (CFEB-BE)
Compagnie de Saint-Gobain SA (SGO-FR)
CRH Plc (CRG-IE)
Danone SA (BN-FR)
Diageo plc (DGE-GB)
Inditex SA (ITX-ES)
ING Groep NV (INGA-NL)
Novartis AG (NOVN-CH)
Pernod Ricard SA (RI-FR)
Royal Ahold Delhaize NV (AD-NL)
Schneider Electric SE (SU-FR)
WPP Plc (WPP-GB)
Past performance is not a reliable indicator of the future performance. The amounts indicated above do not include any fees,
duties or other charges which may be added in case of conclusion of an operation.
Global Conviction List…
ASIA
Alibaba Group Holding Ltd (BABA-US)
Japan Airlines (9201-JP)
Mitsubishi UFJ Financial Group (8306-JP)
Samsung Electronics Co Ltd (SMSN-GB)
8
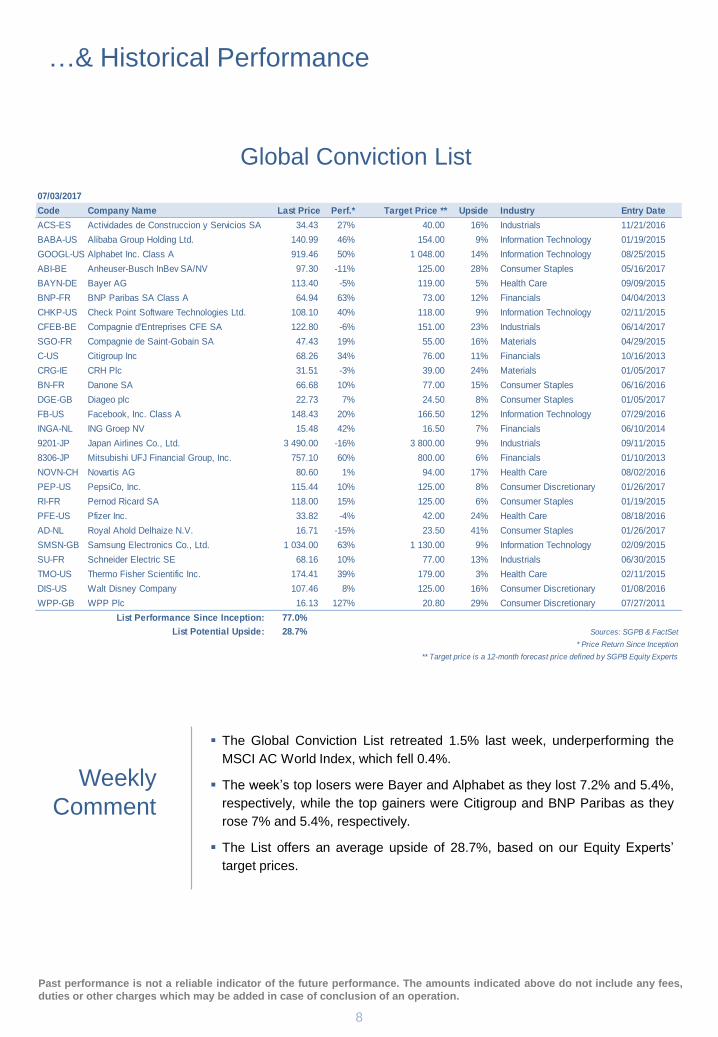
The Global Conviction List retreated 1.5% last week, underperforming the
MSCI AC World Index, which fell 0.4%.
The week’s top losers were Bayer and Alphabet as they lost 7.2% and 5.4%,
respectively, while the top gainers were Citigroup and BNP Paribas as they
rose 7% and 5.4%, respectively.
The List offers an average upside of 28.7%, based on our Equity Experts’
target prices.
Weekly
Comment
Past performance is not a reliable indicator of the future performance. The amounts indicated above do not include any fees,
duties or other charges which may be added in case of conclusion of an operation.
Global Conviction List
…& Historical Performance
07/03/2017
Code Company Name Last Price Perf.* Target Price ** Upside Industry Entry Date
ACS-ES Actividades de Construccion y Servicios SA 34.43 27% 40.00 16% Industrials 11/21/2016
BABA-US Alibaba Group Holding Ltd. 140.99 46% 154.00 9% Information Technology 01/19/2015
GOOGL-US Alphabet Inc. Class A 919.46 50% 1 048.00 14% Information Technology 08/25/2015
ABI-BE Anheuser-Busch InBev SA/NV 97.30 -11% 125.00 28% Consumer Staples 05/16/2017
BAYN-DE Bayer AG 113.40 -5% 119.00 5% Health Care 09/09/2015
BNP-FR BNP Paribas SA Class A 64.94 63% 73.00 12% Financials 04/04/2013
CHKP-US Check Point Software Technologies Ltd. 108.10 40% 118.00 9% Information Technology 02/11/2015
CFEB-BE Compagnie d'Entreprises CFE SA 122.80 -6% 151.00 23% Industrials 06/14/2017
SGO-FR Compagnie de Saint-Gobain SA 47.43 19% 55.00 16% Materials 04/29/2015
C-US Citigroup Inc 68.26 34% 76.00 11% Financials 10/16/2013
CRG-IE CRH Plc 31.51 -3% 39.00 24% Materials 01/05/2017
BN-FR Danone SA 66.68 10% 77.00 15% Consumer Staples 06/16/2016
DGE-GB Diageo plc 22.73 7% 24.50 8% Consumer Staples 01/05/2017
FB-US Facebook, Inc. Class A 148.43 20% 166.50 12% Information Technology 07/29/2016
INGA-NL ING Groep NV 15.48 42% 16.50 7% Financials 06/10/2014
9201-JP Japan Airlines Co., Ltd. 3 490.00 -16% 3 800.00 9% Industrials 09/11/2015
8306-JP Mitsubishi UFJ Financial Group, Inc. 757.10 60% 800.00 6% Financials 01/10/2013
NOVN-CH Novartis AG 80.60 1% 94.00 17% Health Care 08/02/2016
PEP-US PepsiCo, Inc. 115.44 10% 125.00 8% Consumer Discretionary 01/26/2017
RI-FR Pernod Ricard SA 118.00 15% 125.00 6% Consumer Staples 01/19/2015
PFE-US Pfizer Inc. 33.82 -4% 42.00 24% Health Care 08/18/2016
AD-NL Royal Ahold Delhaize N.V. 16.71 -15% 23.50 41% Consumer Staples 01/26/2017
SMSN-GB Samsung Electronics Co., Ltd. 1 034.00 63% 1 130.00 9% Information Technology 02/09/2015
SU-FR Schneider Electric SE 68.16 10% 77.00 13% Industrials 06/30/2015
TMO-US Thermo Fisher Scientific Inc. 174.41 39% 179.00 3% Health Care 02/11/2015
DIS-US Walt Disney Company 107.46 8% 125.00 16% Consumer Discretionary 01/08/2016
WPP-GB WPP Plc 16.13 127% 20.80 29% Consumer Discretionary 07/27/2011
List Performance Since Inception: 77.0%
List Potential Upside: 28.7% Sources: SGPB & FactSet
* Price Return Since Inception
** Target price is a 12-month forecast price defined by SGPB Equity Experts
9
List
Definition
Past performance is not a reliable indicator of the future performance. The amounts indicated above do not include any fees,
duties or other charges which may be added in case of conclusion of an operation.
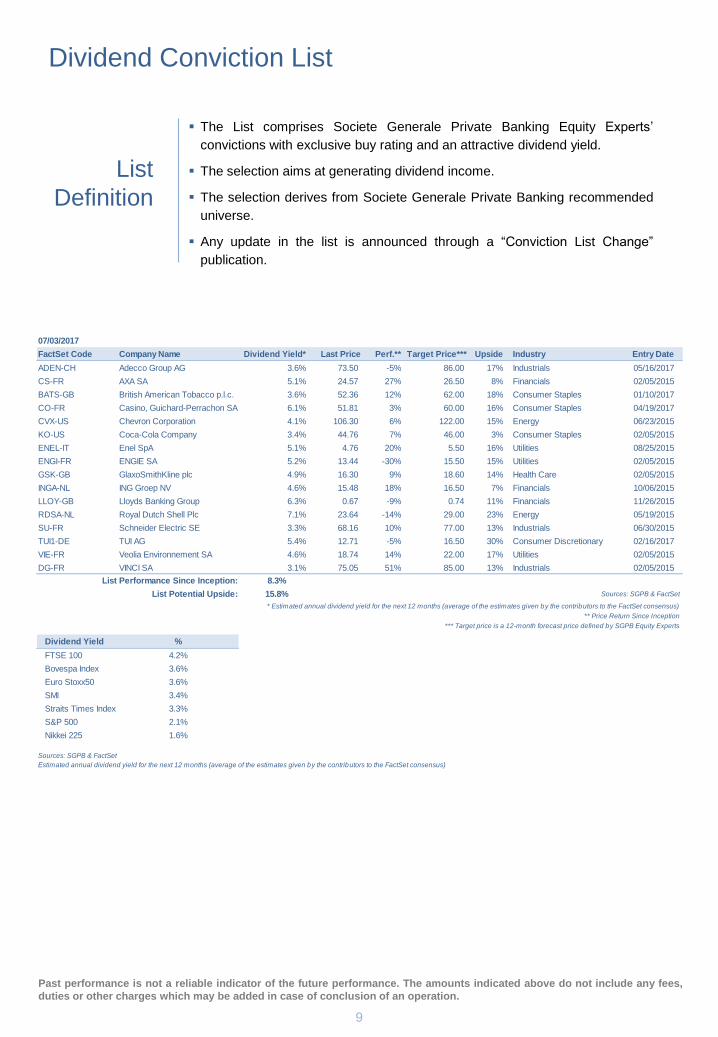
The List comprises Societe Generale Private Banking Equity Experts’
convictions with exclusive buy rating and an attractive dividend yield.
The selection aims at generating dividend income.
The selection derives from Societe Generale Private Banking recommended
universe.
Any update in the list is announced through a “Conviction List Change”
publication.
Dividend Conviction List
07/03/2017
FactSet Code Company Name Dividend Yield* Last Price Perf.** Target Price*** Upside Industry Entry Date
ADEN-CH Adecco Group AG 3.6% 73.50 -5% 86.00 17% Industrials 05/16/2017
CS-FR AXA SA 5.1% 24.57 27% 26.50 8% Financials 02/05/2015
BATS-GB British American Tobacco p.l.c. 3.6% 52.36 12% 62.00 18% Consumer Staples 01/10/2017
CO-FR Casino, Guichard-Perrachon SA 6.1% 51.81 3% 60.00 16% Consumer Staples 04/19/2017
CVX-US Chevron Corporation 4.1% 106.30 6% 122.00 15% Energy 06/23/2015
KO-US Coca-Cola Company 3.4% 44.76 7% 46.00 3% Consumer Staples 02/05/2015
ENEL-IT Enel SpA 5.1% 4.76 20% 5.50 16% Utilities 08/25/2015
ENGI-FR ENGIE SA 5.2% 13.44 -30% 15.50 15% Utilities 02/05/2015
GSK-GB GlaxoSmithKline plc 4.9% 16.30 9% 18.60 14% Health Care 02/05/2015
INGA-NL ING Groep NV 4.6% 15.48 18% 16.50 7% Financials 10/06/2015
LLOY-GB Lloyds Banking Group 6.3% 0.67 -9% 0.74 11% Financials 11/26/2015
RDSA-NL Royal Dutch Shell Plc 7.1% 23.64 -14% 29.00 23% Energy 05/19/2015
SU-FR Schneider Electric SE 3.3% 68.16 10% 77.00 13% Industrials 06/30/2015
TUI1-DE TUI AG 5.4% 12.71 -5% 16.50 30% Consumer Discretionary 02/16/2017
VIE-FR Veolia Environnement SA 4.6% 18.74 14% 22.00 17% Utilities 02/05/2015
DG-FR VINCI SA 3.1% 75.05 51% 85.00 13% Industrials 02/05/2015
List Performance Since Inception: 8.3%
List Potential Upside: 15.8% Sources: SGPB & FactSet
* Estimated annual dividend yield for the next 12 months (average of the estimates given by the contributors to the FactSet consensus)
** Price Return Since Inception
*** Target price is a 12-month forecast price defined by SGPB Equity Experts
Dividend Yield %
FTSE 100 4.2%
Bovespa Index 3.6%
Euro Stoxx50 3.6%
SMI 3.4%
Straits Times Index 3.3%
S&P 500 2.1%
Nikkei 225 1.6%
Sources: SGPB & FactSet
Estimated annual dividend yield for the next 12 months (average of the estimates given by the contributors to the FactSet consensus)
10
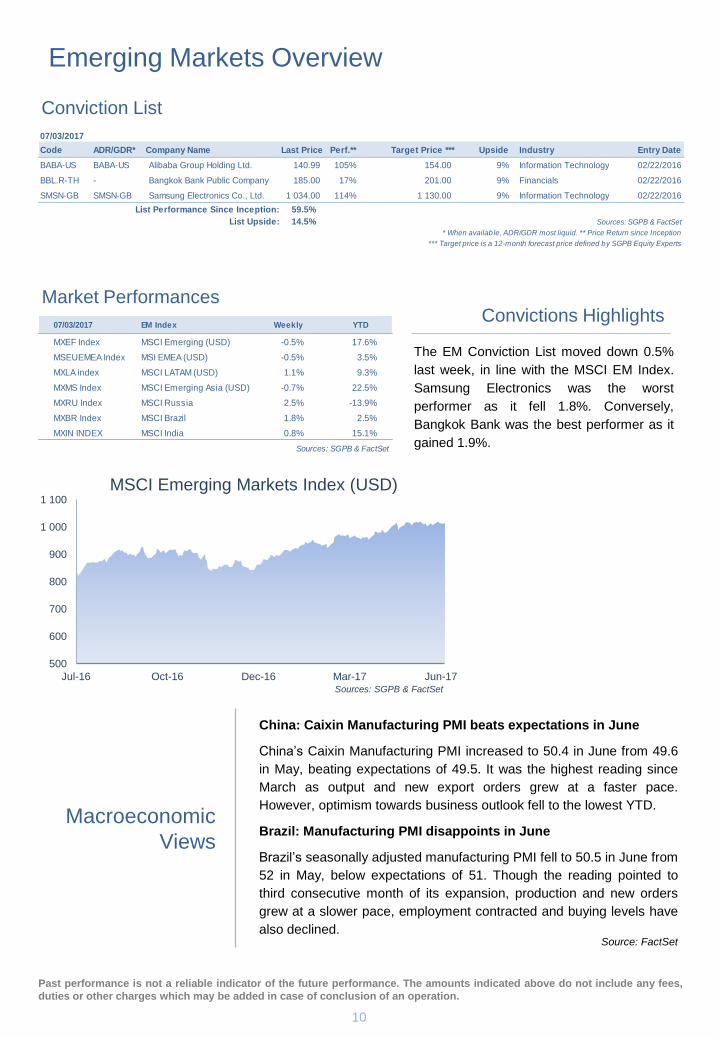
China: Caixin Manufacturing PMI beats expectations in June
China’s Caixin Manufacturing PMI increased to 50.4 in June from 49.6
in May, beating expectations of 49.5. It was the highest reading since
March as output and new export orders grew at a faster pace.
However, optimism towards business outlook fell to the lowest YTD.
Brazil: Manufacturing PMI disappoints in June
Brazil’s seasonally adjusted manufacturing PMI fell to 50.5 in June from
52 in May, below expectations of 51. Though the reading pointed to
third consecutive month of its expansion, production and new orders
grew at a slower pace, employment contracted and buying levels have
also declined.
Conviction List
Market Performances Convictions Highlights
The EM Conviction List moved down 0.5%
last week, in line with the MSCI EM Index.
Samsung Electronics was the worst
performer as it fell 1.8%. Conversely,
Bangkok Bank was the best performer as it
gained 1.9%. 12/15/2014 EM Index Weekly YTD
MXEF Index MSCI Emerging (USD) -5.40% -7.84%
MSEUEMEA Index MSI EMEA (USD) -9.09% -21.37%
MXLA index MSCI LATAM (USD) -9.41% -20.84%
MXMS Index MSCI Emerging Asia (USD) -3.41% 0.30%
MXRU Index MSCI Russia -18.12% -50.50%
MXBR Index MSCI Brazil -9.71% -23.23%
MXIN Index MSCI India -3.14% 22.63%
Macroeconomic
Views
Source: FactSet
Emerging Markets Overview
Past performance is not a reliable indicator of the future performance. The amounts indicated above do not include any fees,
duties or other charges which may be added in case of conclusion of an operation.
07/03/2017
Code ADR/GDR* Company Name Last Price Perf.** Target Price *** Upside Industry Entry Date
BABA-US BABA-US Alibaba Group Holding Ltd. 140.99 105% 154.00 9% Information Technology 02/22/2016
BBL.R-TH - Bangkok Bank Public Company 185.00 17% 201.00 9% Financials 02/22/2016
SMSN-GB SMSN-GB Samsung Electronics Co., Ltd. 1 034.00 114% 1 130.00 9% Information Technology 02/22/2016
List Performance Since Inception: 59.5%
List Upside: 14.5% Sources: SGPB & FactSet
* When available, ADR/GDR most liquid. ** Price Return since Inception
*** Target price is a 12-month forecast price defined by SGPB Equity Experts
07/03/2017 EM Index Weekly YTD
MXEF Index MSCI Emerging (USD) -0.5% 17.6%
MSEUEMEA Index MSI EMEA (USD) -0.5% 3.5%
MXLA index MSCI LATAM (USD) 1.1% 9.3%
MXMS Index MSCI Emerging Asia (USD) -0.7% 22.5%
MXRU Index MSCI Russia 2.5% -13.9%
MXBR Index MSCI Brazil 1.8% 2.5%
MXIN INDEX MSCI India 0.8% 15.1%
Sources: SGPB & FactSet
500
600
700
800
900
1 000
1 100
Jul-16 Oct-16 Dec-16 Mar-17 Jun-17
MSCI Emerging Markets Index (USD)
Sources: SGPB & FactSet
11
List
Definition
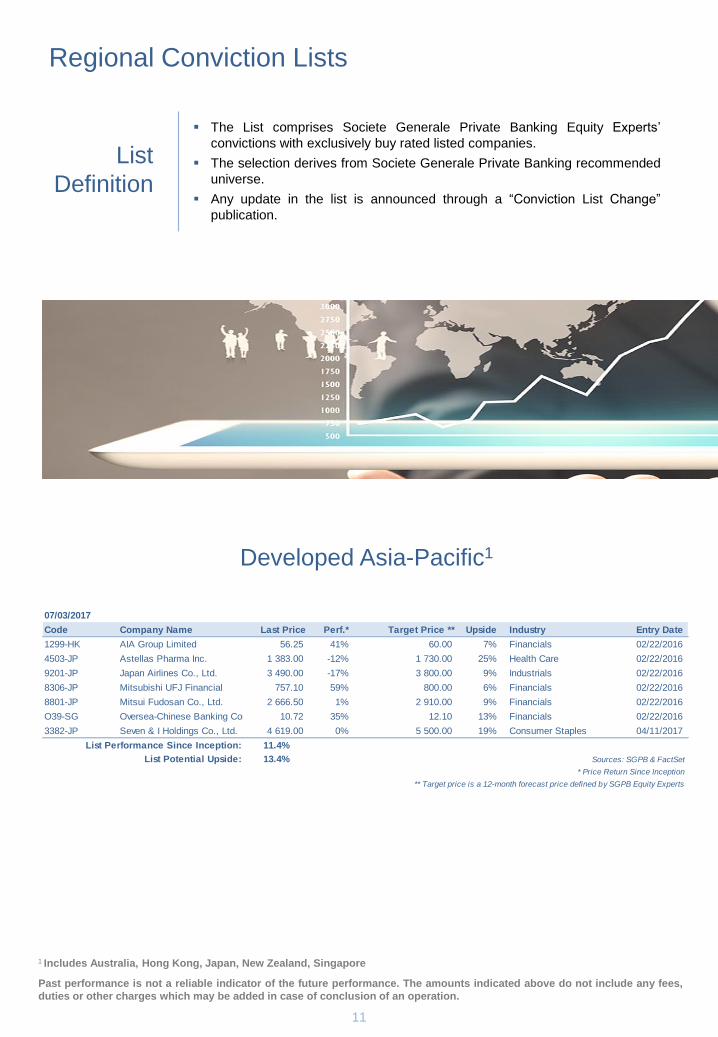
Developed Asia-Pacific1
The List comprises Societe Generale Private Banking Equity Experts’
convictions with exclusively buy rated listed companies.
The selection derives from Societe Generale Private Banking recommended
universe.
Any update in the list is announced through a “Conviction List Change”
publication.
Regional Conviction Lists
Past performance is not a reliable indicator of the future performance. The amounts indicated above do not include any fees,
duties or other charges which may be added in case of conclusion of an operation.
1 Includes Australia, Hong Kong, Japan, New Zealand, Singapore
07/03/2017
Code Company Name Last Price Perf.* Target Price ** Upside Industry Entry Date
1299-HK AIA Group Limited 56.25 41% 60.00 7% Financials 02/22/2016
4503-JP Astellas Pharma Inc. 1 383.00 -12% 1 730.00 25% Health Care 02/22/2016
9201-JP Japan Airlines Co., Ltd. 3 490.00 -17% 3 800.00 9% Industrials 02/22/2016
8306-JP Mitsubishi UFJ Financial 757.10 59% 800.00 6% Financials 02/22/2016
8801-JP Mitsui Fudosan Co., Ltd. 2 666.50 1% 2 910.00 9% Financials 02/22/2016
O39-SG Oversea-Chinese Banking Corp. 10.72 35% 12.10 13% Financials 02/22/2016
3382-JP Seven & I Holdings Co., Ltd. 4 619.00 0% 5 500.00 19% Consumer Staples 04/11/2017
List Performance Since Inception: 11.4%
List Potential Upside: 13.4% Sources: SGPB & FactSet
* Price Return Since Inception
** Target price is a 12-month forecast price defined by SGPB Equity Experts
12
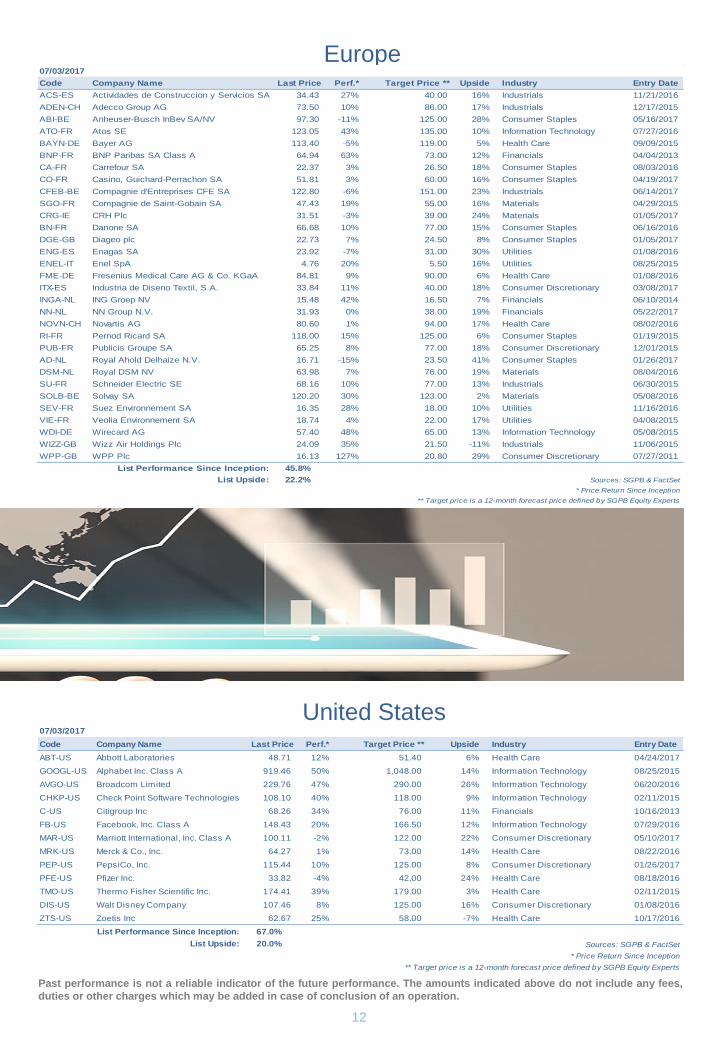
United States
Past performance is not a reliable indicator of the future performance. The amounts indicated above do not include any fees,
duties or other charges which may be added in case of conclusion of an operation.
Europe 07/03/2017
Code Company Name Last Price Perf.* Target Price ** Upside Industry Entry Date
ACS-ES Actividades de Construccion y Servicios SA 34.43 27% 40.00 16% Industrials 11/21/2016
ADEN-CH Adecco Group AG 73.50 10% 86.00 17% Industrials 12/17/2015
ABI-BE Anheuser-Busch InBev SA/NV 97.30 -11% 125.00 28% Consumer Staples 05/16/2017
ATO-FR Atos SE 123.05 43% 135.00 10% Information Technology 07/27/2016
BAYN-DE Bayer AG 113.40 -5% 119.00 5% Health Care 09/09/2015
BNP-FR BNP Paribas SA Class A 64.94 63% 73.00 12% Financials 04/04/2013
CA-FR Carrefour SA 22.37 3% 26.50 18% Consumer Staples 08/03/2016
CO-FR Casino, Guichard-Perrachon SA 51.81 3% 60.00 16% Consumer Staples 04/19/2017
CFEB-BE Compagnie d'Entreprises CFE SA 122.80 -6% 151.00 23% Industrials 06/14/2017
SGO-FR Compagnie de Saint-Gobain SA 47.43 19% 55.00 16% Materials 04/29/2015
CRG-IE CRH Plc 31.51 -3% 39.00 24% Materials 01/05/2017
BN-FR Danone SA 66.68 10% 77.00 15% Consumer Staples 06/16/2016
DGE-GB Diageo plc 22.73 7% 24.50 8% Consumer Staples 01/05/2017
ENG-ES Enagas SA 23.92 -7% 31.00 30% Utilities 01/08/2016
ENEL-IT Enel SpA 4.76 20% 5.50 16% Utilities 08/25/2015
FME-DE Fresenius Medical Care AG & Co. KGaA 84.81 9% 90.00 6% Health Care 01/08/2016
ITX-ES Industria de Diseno Textil, S.A. 33.84 11% 40.00 18% Consumer Discretionary 03/08/2017
INGA-NL ING Groep NV 15.48 42% 16.50 7% Financials 06/10/2014
NN-NL NN Group N.V. 31.93 0% 38.00 19% Financials 05/22/2017
NOVN-CH Novartis AG 80.60 1% 94.00 17% Health Care 08/02/2016
RI-FR Pernod Ricard SA 118.00 15% 125.00 6% Consumer Staples 01/19/2015
PUB-FR Publicis Groupe SA 65.25 8% 77.00 18% Consumer Discretionary 12/01/2015
AD-NL Royal Ahold Delhaize N.V. 16.71 -15% 23.50 41% Consumer Staples 01/26/2017
DSM-NL Royal DSM NV 63.98 7% 76.00 19% Materials 08/04/2016
SU-FR Schneider Electric SE 68.16 10% 77.00 13% Industrials 06/30/2015
SOLB-BE Solvay SA 120.20 30% 123.00 2% Materials 05/08/2016
SEV-FR Suez Environnement SA 16.35 28% 18.00 10% Utilities 11/16/2016
VIE-FR Veolia Environnement SA 18.74 4% 22.00 17% Utilities 04/08/2015
WDI-DE Wirecard AG 57.40 48% 65.00 13% Information Technology 05/08/2015
WIZZ-GB Wizz Air Holdings Plc 24.09 35% 21.50 -11% Industrials 11/06/2015
WPP-GB WPP Plc 16.13 127% 20.80 29% Consumer Discretionary 07/27/2011
List Performance Since Inception: 45.8%
List Upside: 22.2% Sources: SGPB & FactSet
* Price Return Since Inception
** Target price is a 12-month forecast price defined by SGPB Equity Experts
07/03/2017
Code Company Name Last Price Perf.* Target Price ** Upside Industry Entry Date
ABT-US Abbott Laboratories 48.71 12% 51.40 6% Health Care 04/24/2017
GOOGL-US Alphabet Inc. Class A 919.46 50% 1,048.00 14% Information Technology 08/25/2015
AVGO-US Broadcom Limited 229.76 47% 290.00 26% Information Technology 06/20/2016
CHKP-US Check Point Software Technologies Ltd. 108.10 40% 118.00 9% Information Technology 02/11/2015
C-US Citigroup Inc 68.26 34% 76.00 11% Financials 10/16/2013
FB-US Facebook, Inc. Class A 148.43 20% 166.50 12% Information Technology 07/29/2016
MAR-US Marriott International, Inc. Class A 100.11 -2% 122.00 22% Consumer Discretionary 05/10/2017
MRK-US Merck & Co., Inc. 64.27 1% 73.00 14% Health Care 08/22/2016
PEP-US PepsiCo, Inc. 115.44 10% 125.00 8% Consumer Discretionary 01/26/2017
PFE-US Pfizer Inc. 33.82 -4% 42.00 24% Health Care 08/18/2016
TMO-US Thermo Fisher Scientific Inc. 174.41 39% 179.00 3% Health Care 02/11/2015
DIS-US Walt Disney Company 107.46 8% 125.00 16% Consumer Discretionary 01/08/2016
ZTS-US Zoetis Inc 62.67 25% 58.00 -7% Health Care 10/17/2016
List Performance Since Inception: 67.0%
List Upside: 20.0% Sources: SGPB & FactSet
* Price Return Since Inception
** Target price is a 12-month forecast price defined by SGPB Equity Experts
13
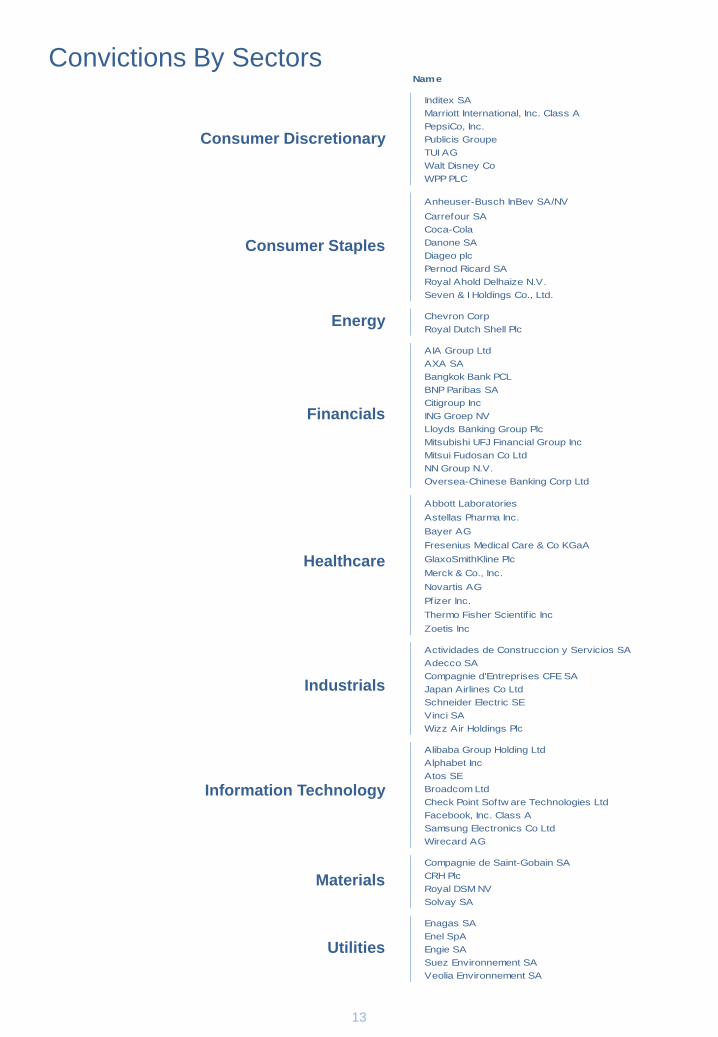
Convictions By Sectors
Financials
Consumer Staples
Consumer Discretionary
Healthcare
Information Technology
Industrials
Materials
Energy
Utilities
Name
Inditex SA
Marriott International, Inc. Class A
PepsiCo, Inc.
Publicis Groupe
TUI AG
Walt Disney Co
WPP PLC
Anheuser-Busch InBev SA/NV
Carrefour SA
Coca-Cola
Danone SA
Diageo plc
Pernod Ricard SA
Royal Ahold Delhaize N.V.
Seven & I Holdings Co., Ltd.
Chevron Corp
Royal Dutch Shell Plc
AIA Group Ltd
AXA SA
Bangkok Bank PCL
BNP Paribas SA
Citigroup Inc
ING Groep NV
Lloyds Banking Group Plc
Mitsubishi UFJ Financial Group Inc
Mitsui Fudosan Co Ltd
NN Group N.V.
Oversea-Chinese Banking Corp Ltd
Abbott Laboratories
Astellas Pharma Inc.
Bayer AG
Fresenius Medical Care & Co KGaA
GlaxoSmithKline Plc
Merck & Co., Inc.
Novartis AG
Pfizer Inc.
Thermo Fisher Scientif ic Inc
Zoetis Inc
Actividades de Construccion y Servicios SA
Adecco SA
Compagnie d'Entreprises CFE SA
Japan Airlines Co Ltd
Schneider Electric SE
Vinci SA
Wizz Air Holdings Plc
Alibaba Group Holding Ltd
Alphabet Inc
Atos SE
Broadcom Ltd
Check Point Softw are Technologies Ltd
Facebook, Inc. Class A
Samsung Electronics Co Ltd
Wirecard AG
Compagnie de Saint-Gobain SA
CRH Plc
Royal DSM NV
Solvay SA
Enagas SA
Enel SpA
Engie SA
Suez Environnement SA
Veolia Environnement SA

14
Jérôme Matt
Head of Equity Solutions, Paris
Danny Van Quaethem
Local Head of Equity Solutions,
Belgium
Shishir Malik
Head of Equity Solutions, Bangalore
Contact Details
Kristof De Graeve
Equity Expert, Belgium
15
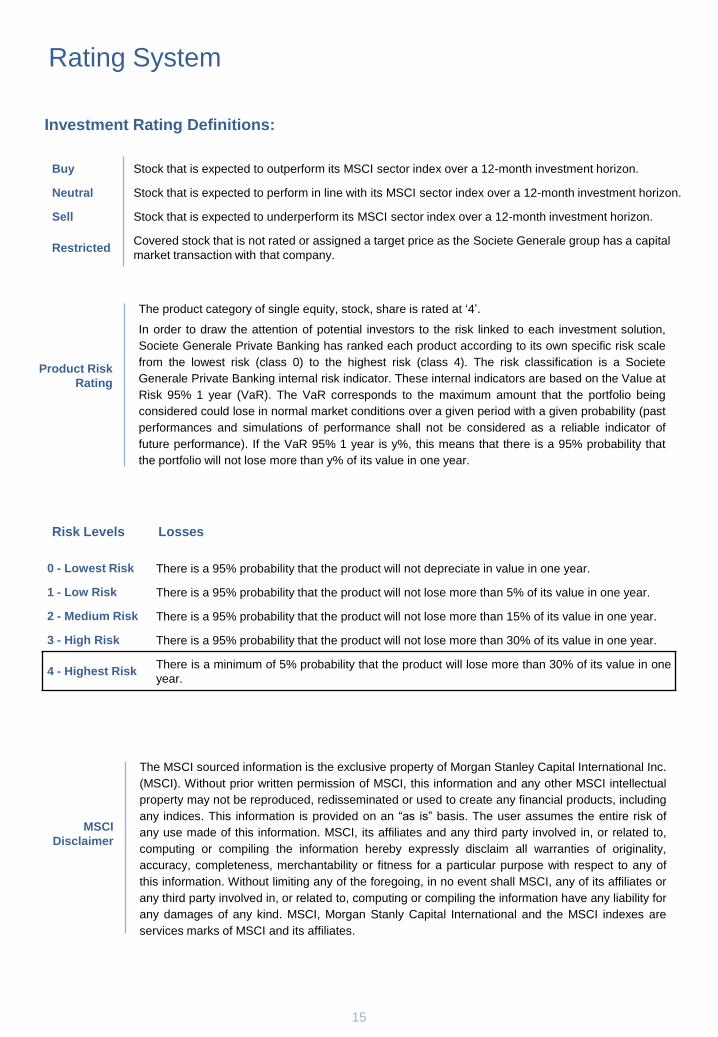
0 - Lowest Risk There is a 95% probability that the product will not depreciate in value in one year.
1 - Low Risk There is a 95% probability that the product will not lose more than 5% of its value in one year.
2 - Medium Risk There is a 95% probability that the product will not lose more than 15% of its value in one year.
3 - High Risk There is a 95% probability that the product will not lose more than 30% of its value in one year.
4 - Highest Risk There is a minimum of 5% probability that the product will lose more than 30% of its value in one
year.
Investment Rating Definitions:
Risk Levels Losses
Rating System
Buy Stock that is expected to outperform its MSCI sector index over a 12-month investment horizon.
Neutral Stock that is expected to perform in line with its MSCI sector index over a 12-month investment horizon.
Sell Stock that is expected to underperform its MSCI sector index over a 12-month investment horizon.
Restricted Covered stock that is not rated or assigned a target price as the Societe Generale group has a capital
market transaction with that company.
The product category of single equity, stock, share is rated at ‘4’.
In order to draw the attention of potential investors to the risk linked to each investment solution,
Societe Generale Private Banking has ranked each product according to its own specific risk scale
from the lowest risk (class 0) to the highest risk (class 4). The risk classification is a Societe
Generale Private Banking internal risk indicator. These internal indicators are based on the Value at
Risk 95% 1 year (VaR). The VaR corresponds to the maximum amount that the portfolio being
considered could lose in normal market conditions over a given period with a given probability (past
performances and simulations of performance shall not be considered as a reliable indicator of
future performance). If the VaR 95% 1 year is y%, this means that there is a 95% probability that
the portfolio will not lose more than y% of its value in one year.
Product Risk
Rating
The MSCI sourced information is the exclusive property of Morgan Stanley Capital International Inc.
(MSCI). Without prior written permission of MSCI, this information and any other MSCI intellectual
property may not be reproduced, redisseminated or used to create any financial products, including
any indices. This information is provided on an “as is” basis. The user assumes the entire risk of
any use made of this information. MSCI, its affiliates and any third party involved in, or related to,
computing or compiling the information hereby expressly disclaim all warranties of originality,
accuracy, completeness, merchantability or fitness for a particular purpose with respect to any of
this information. Without limiting any of the foregoing, in no event shall MSCI, any of its affiliates or
any third party involved in, or related to, computing or compiling the information have any liability for
any damages of any kind. MSCI, Morgan Stanly Capital International and the MSCI indexes are
services marks of MSCI and its affiliates.
MSCI
Disclaimer
16
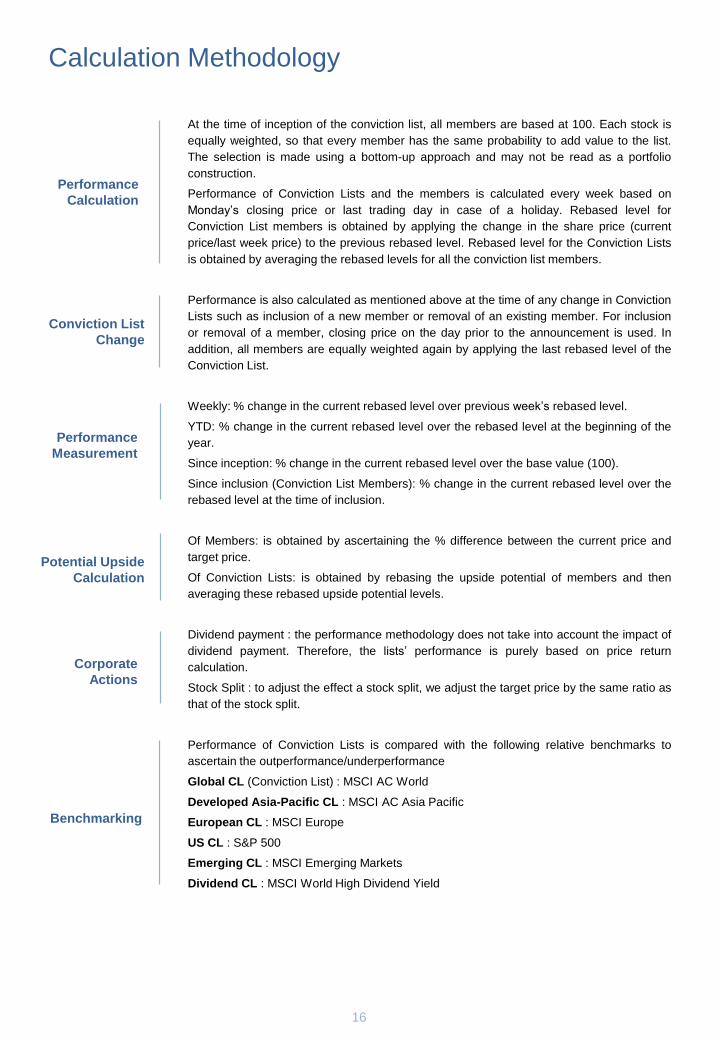
Calculation Methodology
Performance
Calculation
Potential Upside
Calculation
Conviction List
Change
Corporate
Actions
Benchmarking
Performance
Measurement
At the time of inception of the conviction list, all members are based at 100. Each stock is
equally weighted, so that every member has the same probability to add value to the list.
The selection is made using a bottom-up approach and may not be read as a portfolio
construction.
Performance of Conviction Lists and the members is calculated every week based on
Monday’s closing price or last trading day in case of a holiday. Rebased level for
Conviction List members is obtained by applying the change in the share price (current
price/last week price) to the previous rebased level. Rebased level for the Conviction Lists
is obtained by averaging the rebased levels for all the conviction list members.
Performance is also calculated as mentioned above at the time of any change in Conviction
Lists such as inclusion of a new member or removal of an existing member. For inclusion
or removal of a member, closing price on the day prior to the announcement is used. In
addition, all members are equally weighted again by applying the last rebased level of the
Conviction List.
Weekly: % change in the current rebased level over previous week’s rebased level.
YTD: % change in the current rebased level over the rebased level at the beginning of the
year.
Since inception: % change in the current rebased level over the base value (100).
Since inclusion (Conviction List Members): % change in the current rebased level over the
rebased level at the time of inclusion.
Of Members: is obtained by ascertaining the % difference between the current price and
target price.
Of Conviction Lists: is obtained by rebasing the upside potential of members and then
averaging these rebased upside potential levels.
Dividend payment : the performance methodology does not take into account the impact of
dividend payment. Therefore, the lists’ performance is purely based on price return
calculation.
Stock Split : to adjust the effect a stock split, we adjust the target price by the same ratio as
that of the stock split.
Performance of Conviction Lists is compared with the following relative benchmarks to
ascertain the outperformance/underperformance
Global CL (Conviction List) : MSCI AC World
Developed Asia-Pacific CL : MSCI AC Asia Pacific
European CL : MSCI Europe
US CL : S&P 500
Emerging CL : MSCI Emerging Markets
Dividend CL : MSCI World High Dividend Yield
17
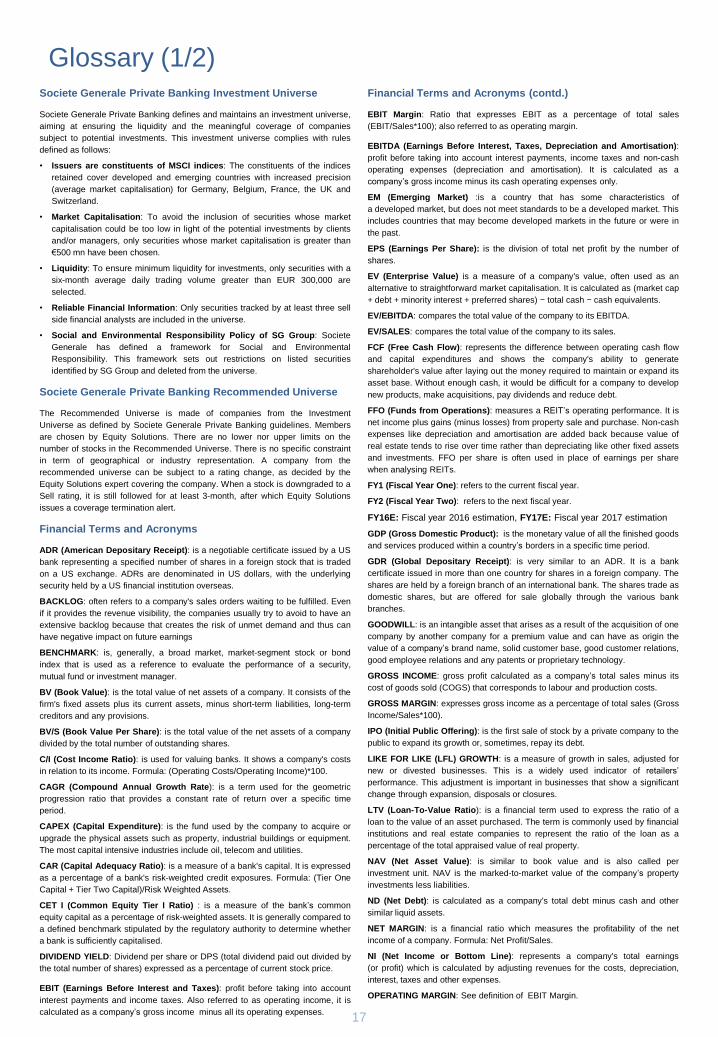
Glossary (1/2) Societe Generale Private Banking Investment Universe
Societe Generale Private Banking defines and maintains an investment universe,
aiming at ensuring the liquidity and the meaningful coverage of companies
subject to potential investments. This investment universe complies with rules
defined as follows:
• Issuers are constituents of MSCI indices: The constituents of the indices
retained cover developed and emerging countries with increased precision
(average market capitalisation) for Germany, Belgium, France, the UK and
Switzerland.
• Market Capitalisation: To avoid the inclusion of securities whose market
capitalisation could be too low in light of the potential investments by clients
and/or managers, only securities whose market capitalisation is greater than
€500 mn have been chosen.
• Liquidity: To ensure minimum liquidity for investments, only securities with a
six-month average daily trading volume greater than EUR 300,000 are
selected.
• Reliable Financial Information: Only securities tracked by at least three sell
side financial analysts are included in the universe.
• Social and Environmental Responsibility Policy of SG Group: Societe
Generale has defined a framework for Social and Environmental
Responsibility. This framework sets out restrictions on listed securities
identified by SG Group and deleted from the universe.
Societe Generale Private Banking Recommended Universe
The Recommended Universe is made of companies from the Investment
Universe as defined by Societe Generale Private Banking guidelines. Members
are chosen by Equity Solutions. There are no lower nor upper limits on the
number of stocks in the Recommended Universe. There is no specific constraint
in term of geographical or industry representation. A company from the
recommended universe can be subject to a rating change, as decided by the
Equity Solutions expert covering the company. When a stock is downgraded to a
Sell rating, it is still followed for at least 3-month, after which Equity Solutions
issues a coverage termination alert.
Financial Terms and Acronyms
ADR (American Depositary Receipt): is a negotiable certificate issued by a US
bank representing a specified number of shares in a foreign stock that is traded
on a US exchange. ADRs are denominated in US dollars, with the underlying
security held by a US financial institution overseas.
BACKLOG: often refers to a company's sales orders waiting to be fulfilled. Even
if it provides the revenue visibility, the companies usually try to avoid to have an
extensive backlog because that creates the risk of unmet demand and thus can
have negative impact on future earnings
BENCHMARK: is, generally, a broad market, market-segment stock or bond
index that is used as a reference to evaluate the performance of a security,
mutual fund or investment manager.
BV (Book Value): is the total value of net assets of a company. It consists of the
firm's fixed assets plus its current assets, minus short-term liabilities, long-term
creditors and any provisions.
BV/S (Book Value Per Share): is the total value of the net assets of a company
divided by the total number of outstanding shares.
C/I (Cost Income Ratio): is used for valuing banks. It shows a company's costs
in relation to its income. Formula: (Operating Costs/Operating Income)*100.
CAGR (Compound Annual Growth Rate): is a term used for the geometric
progression ratio that provides a constant rate of return over a specific time
period.
CAPEX (Capital Expenditure): is the fund used by the company to acquire or
upgrade the physical assets such as property, industrial buildings or equipment.
The most capital intensive industries include oil, telecom and utilities.
CAR (Capital Adequacy Ratio): is a measure of a bank's capital. It is expressed
as a percentage of a bank's risk-weighted credit exposures. Formula: (Tier One
Capital + Tier Two Capital)/Risk Weighted Assets.
CET I (Common Equity Tier I Ratio) : is a measure of the bank’s common
equity capital as a percentage of risk-weighted assets. It is generally compared to
a defined benchmark stipulated by the regulatory authority to determine whether
a bank is sufficiently capitalised.
DIVIDEND YIELD: Dividend per share or DPS (total dividend paid out divided by
the total number of shares) expressed as a percentage of current stock price.
EBIT (Earnings Before Interest and Taxes): profit before taking into account
interest payments and income taxes. Also referred to as operating income, it is
calculated as a company’s gross income minus all its operating expenses.
Financial Terms and Acronyms (contd.)
EBIT Margin: Ratio that expresses EBIT as a percentage of total sales
(EBIT/Sales*100); also referred to as operating margin.
EBITDA (Earnings Before Interest, Taxes, Depreciation and Amortisation):
profit before taking into account interest payments, income taxes and non-cash
operating expenses (depreciation and amortisation). It is calculated as a
company’s gross income minus its cash operating expenses only.
EM (Emerging Market) :is a country that has some characteristics of
a developed market, but does not meet standards to be a developed market. This
includes countries that may become developed markets in the future or were in
the past.
EPS (Earnings Per Share): is the division of total net profit by the number of
shares.
EV (Enterprise Value) is a measure of a company's value, often used as an
alternative to straightforward market capitalisation. It is calculated as (market cap
+ debt + minority interest + preferred shares) − total cash − cash equivalents.
EV/EBITDA: compares the total value of the company to its EBITDA.
EV/SALES: compares the total value of the company to its sales.
FCF (Free Cash Flow): represents the difference between operating cash flow
and capital expenditures and shows the company's ability to generate
shareholder's value after laying out the money required to maintain or expand its
asset base. Without enough cash, it would be difficult for a company to develop
new products, make acquisitions, pay dividends and reduce debt.
FFO (Funds from Operations): measures a REIT’s operating performance. It is
net income plus gains (minus losses) from property sale and purchase. Non-cash
expenses like depreciation and amortisation are added back because value of
real estate tends to rise over time rather than depreciating like other fixed assets
and investments. FFO per share is often used in place of earnings per share
when analysing REITs.
FY1 (Fiscal Year One): refers to the current fiscal year.
FY2 (Fiscal Year Two): refers to the next fiscal year.
FY16E: Fiscal year 2016 estimation, FY17E: Fiscal year 2017 estimation
GDP (Gross Domestic Product): is the monetary value of all the finished goods
and services produced within a country’s borders in a specific time period.
GDR (Global Depositary Receipt): is very similar to an ADR. It is a bank
certificate issued in more than one country for shares in a foreign company. The
shares are held by a foreign branch of an international bank. The shares trade as
domestic shares, but are offered for sale globally through the various bank
branches.
GOODWILL: is an intangible asset that arises as a result of the acquisition of one
company by another company for a premium value and can have as origin the
value of a company’s brand name, solid customer base, good customer relations,
good employee relations and any patents or proprietary technology.
GROSS INCOME: gross profit calculated as a company’s total sales minus its
cost of goods sold (COGS) that corresponds to labour and production costs.
GROSS MARGIN: expresses gross income as a percentage of total sales (Gross
Income/Sales*100).
IPO (Initial Public Offering): is the first sale of stock by a private company to the
public to expand its growth or, sometimes, repay its debt.
LIKE FOR LIKE (LFL) GROWTH: is a measure of growth in sales, adjusted for
new or divested businesses. This is a widely used indicator of retailers’
performance. This adjustment is important in businesses that show a significant
change through expansion, disposals or closures.
LTV (Loan-To-Value Ratio): is a financial term used to express the ratio of a
loan to the value of an asset purchased. The term is commonly used by financial
institutions and real estate companies to represent the ratio of the loan as a
percentage of the total appraised value of real property.
NAV (Net Asset Value): is similar to book value and is also called per
investment unit. NAV is the marked-to-market value of the company’s property
investments less liabilities.
ND (Net Debt): is calculated as a company's total debt minus cash and other
similar liquid assets.
NET MARGIN: is a financial ratio which measures the profitability of the net
income of a company. Formula: Net Profit/Sales.
NI (Net Income or Bottom Line): represents a company's total earnings
(or profit) which is calculated by adjusting revenues for the costs, depreciation,
interest, taxes and other expenses.
OPERATING MARGIN: See definition of EBIT Margin.
18
Glossary (2/2) ORGANIC GROWTH: is the growth rate that a company can achieve by
increasing its output and enhancing sales, excluding any profits or growth from
takeovers or M&A activities.
P/E or PER (Price Earnings Ratio): reflects the trading price of a share in
relation to the expected earnings. Formula: Share Price/Earnings Per Share.
P/TBVS (Price To Tangible Book Value): expresses the share price with regard
to the accounting value of the company. Formula: Share Price/Tangible Book
Value Per Share.
PAYOUT RATIO: is the proportion of earnings paid out as dividends to
shareholders and typically expressed as a percentage. A lower payout ratio is
generally preferable to a higher payout ratio. A ratio greater than 100% indicates
the company is paying out more in dividends than it makes in net income.
PMI (Purchasing Managers Index): is an indicator of the economic health of the
manufacturing sector. The PMI is based on five major indicators: new orders,
inventory levels, production, supplier deliveries and the employment environment
PROFIT WARNING: is the announcement made by the company before its
earnings release indicating the investors that its earnings would not meet the
analysts' expectations.
RWA (Risk Weighted Assets): is a measure of the bank’s assets, weighted
according to their risk. It involves the risk weighting of both on and off-balance-
sheet exposures. It is generally used to calculate risk-based capital ratio which is
the ratio of a bank’s capital to its risk weighted assets.
REVENUE GROWTH: Illustrates the growth of sales over a given period.
ROA (Return on assets): a financial ratio that is calculated as net income
divided by total assets and shows how profitable a company is relative to its total
assets
ROC (Return on invested capital): a profitability ratio which is calculated as net
income minus dividends divided by total invested capital.
ROE (Return On Equity): The amount of net income returned as a percentage of
shareholders’ equity. Return on equity measures a corporation's profitability by
disclosing how much profit a company generates with the money shareholders
have invested.
SHARE BUYBACK (Share Repurchase): A program by which a company buys
back its own shares from the marketplace, reducing the number of outstanding
shares. It usually indicates that the company's shares are undervalued and
pushes the share prices up. SHAREHOLDER’S EQUITY: is the amount of the
funds contributed by the owners (the stockholders) plus the retained earnings (or
losses).
STOCK SPLIT: is a corporate action in which the company divides its existing
shares into multiple shares to make shares seem more affordable for small
investors without changing the underlying value of the company.
TBV (Tangible Book Value): is the book value excluding intangible assets.
TBV/S (Tangible Book Value Per Share): allows to estimate the accounting
value of a company by measuring its stockholders' equity per share. Formula:
Re-valued Net Assets/Total Shares of Company.
WACC (Weighted Average Cost of Capital): also referred to as the firm's cost
of capital, it is the rate that a company is expected to pay on an average to all its
security holders to finance its assets.
WORKING CAPITAL: is the difference between a company's current assets and
current liabilities and shows whether the company has sufficient short-term
assets to cover its short-term debts.
Indices
MSCI AC WORLD: is a free float-adjusted market capitalisation weighted index
that is designed to measure the equity market performance of developed
markets. The MSCI World Index consists of the following 23 developed market
country indexes: Australia, Austria, Belgium, Canada, Denmark, Finland, France,
Germany, Hong Kong, Ireland, Israel, Italy, Japan, the Netherlands, New
Zealand, Norway, Portugal, Singapore, Spain, Sweden, Switzerland, the UK, and
the US (as of 2 June 2014).
MSCI AC ASIA PACIFIC: is a free float-adjusted market capitalisation weighted
index that is designed to measure the equity market performance of the
developed and emerging markets in the Pacific region. The MSCI AC Pacific
Free Index consists of the following 12 developed and emerging market
countries: Australia, China, Hong Kong, Indonesia, Japan, Korea, Malaysia, New
Zealand, the Philippines, Singapore, Taiwan, and Thailand (as of 2 June 2014).
MSCI EUROPE: is a free float-adjusted market capitalisation weighted index that
is designed to measure the equity market performance of the developed markets
in Europe. The MSCI Europe Index consists of the following 15 developed market
country indexes: Austria, Belgium, Denmark, Finland, France, Germany, Ireland,
Italy, the Netherlands, Norway, Portugal, Spain, Sweden, Switzerland, and the
UK (as of 2 June 2014).
MSCI EMERGING MARKETS: is a free float-adjusted market capitalisation index
that is designed to measure equity market performance of emerging markets.
The MSCI Emerging Markets Index consists of the following 23 emerging market
country indexes: Brazil, Chile, China, Colombia, the Czech Republic, Egypt,
Greece, Hungary, India, Indonesia, Korea, Malaysia, Mexico, Peru, the
Philippines, Poland, Qatar, Russia, South Africa, Taiwan, Thailand, Turkey* and
the UAE (as of 2 June 2014).
MSCI WORLD HIGH DIVIDEND YIELD: is based on the MSCI World Index, its
parent index, and includes large- and mid-cap stocks across 23 Developed
Markets (DM) countries (as of 31 March 2014). The index is designed to reflect
the performance of equities in the parent index (excluding REITs) with higher
dividend income and quality characteristics than average dividend yields that are
both sustainable and persistent.
MSCI WORLD VALUE: captures large- and mid-cap securities exhibiting overall
value style characteristics across 23 Developed Markets countries (as of 31
March 2014). The value investment style characteristics for index construction
are defined using three variables: book value to price, 12-month forward earnings
to price and dividend yield. With 853 constituents, the index targets 50%
coverage of the free float-adjusted market capitalisation of the MSCI World Index.
MSCI WORLD GROWTH: captures large- and mid-cap securities exhibiting
overall growth style characteristics across 23 Developed Markets countries (as of
31 March 2014). The growth investment style characteristics for index
construction are defined using five variables: long-term forward EPS growth rate,
short-term forward EPS growth rate, current internal growth rate and long-term
historical EPS growth trend and long-term historical sales per share growth trend.
MSCI WORLD SMALL CAP: captures small cap representation across 23
Developed Markets (DM) countries (as of 31 March 2014). With 4,302
constituents, the index covers approximately 14% of the free float-adjusted
market capitalisation in each country.
MSCI WORLD LARGE CAP: captures large-cap representation across 23
Developed Markets (DM) countries (as of 31 March 2014). With 737 constituents,
the index covers approximately 70% of the free float-adjusted market
capitalisation in each country.
MSCI EMEA: is a free float-adjusted market capitalisation weighted index that is
designed to measure the equity market performance of the emerging market
countries of Europe, the Middle East and Africa. The MSCI EM EMEA
Index consists of the following 10 emerging market country indexes: the Czech
Republic, Greece, Hungary, Poland, Russia, Turkey, Egypt, South Africa, Qatar
and the UAE.
MSCI LATAM: captures large- and mid-cap representation across five emerging
market (EM) countries (as of 31 March 2014) in Latin America. With 137
constituents, the index covers approximately 85% of the free float-adjusted
market capitalisation in each country.
MSCI EMERGING ASIA: captures large and mid-cap representation across eight
EM countries (as of 31 March 2014). With 537 constituents, the index covers
approximately 85% of the free float-adjusted market capitalisation in each
country.
MSCI RUSSIA: is designed to measure the performance of the large- and mid-
cap segments of the Russian market. With 22 constituents, the index covers
approximately 85% of the free float-adjusted market capitalisation in Russia.
MSCI BRAZIL: is designed to measure the performance of the large- and mid-
cap segments of the Brazilian market. With 70 constituents, the index covers
about 85% of the Brazilian equity universe.
MSCI INDIA: is designed to measure the performance of the large- and mid-cap
segments of the Indian market. With 64 constituents, the index covers
approximately 85% of the Indian equity universe.
Euro Stoxx 50: is the leading blue-chip index for the eurozone and provides a
blue-chip representation of supersector leaders in the Eurozone. The index
covers 50 stocks from 12 Eurozone countries. The Index is licensed to financial
institutions to serve as underlying for a wide range of investment products such
as Exchange Traded Funds (ETF), Futures and Options and structured products.
FTSE 100: comprises the 100 most highly capitalised blue chip companies,
representing approximately 81% of the UK market. It is used extensively as a
basis for investment products, such as derivatives and exchange-traded funds.
S&P 500: includes 500 leading companies in the leading industries of the US
economy. It is a core component of the US indices that could be used as building
blocks for portfolio construction. It is also the US component of S&P Global 1200.
Nikkei 225: is the leading index of Japanese stocks. It is a price-weighted index
comprised of Japan's top 225 blue-chip companies on the Tokyo Stock
Exchange. The Nikkei is equivalent to the Dow Jones Industrial Average Index in
the US.
Sources: FactSet, MSCI global equity indexes, SGPB
19
Important Disclosures SG acted as passive bookrunner in Abbott Labs' senior bond issue.
SG acted as Financial advisor for ACS in the sale of Urbaser.
SG acted as joint bookrunner in Adecco's bond issue and joint dealer manager in Adecco's bond tender offer (Target notes:
XS0616395199 and XS0953093308).
SG acted as joint lead manager in Axa's bond issue (USD, Perpetual).
SG acted as jointbookrunner in Axa Bank Europe's bond issue (5y covered).
SG acted as global coordinator and joint bookrunner in the disposal of Euronext shares held by Société Générale and BNP Paribas
SG is acting as joint global coordinator and joint bookrunner in Carmila's IPO sold by Carrefour
SG acted as co-manager in Citigroup's bond issuance (12y HG SEC reg).
SG acted as joint lead manager in Citigroup bond issue (EUR, 7-12yr)
SG acted as co-manager in Citigroup's bond issue (5yr SEC sr).
SG acted as co-manager in Citigroup's notes issue.
SG acting as co-manager in Citigroup's senior high grade bond issue
SG acted as joint bookrunner in CRH's bond issue (12y, EUR).
SG acted as Active Joint Bookrunner on Danone'Bond issue (EUR 2y, 4y, 6y, 8y, 12y).
SG acted as co-manager in Disney's bond issue
SG acted as Passive Bookrunner on Enagas Bond isuue (EUR 10y)
SG makes a market in Enel warrants
SG acted as joint bookrunner in Enel's bond issue (5y, 10y, 30y, USD).
SG acted as joint bookrunner in the disposal of Engie's stakes by Government of France (APE).
SG acted as sole global coordinateur and joint bookrunner in Engie's tender offer (FR0011289230, FR0000472334,
FR0010678185, FR0010709451, FR0010721704, FR0010952770, FR0011261924) and joint dealer manager and structuring
advisor in the new bonds issue (EUR, 7-11yr).
SG acted as passive bookrunner in Fresenius' bond issue (Senior, Unsecured, Reg S, multi-tranche, 5y, 7y, 10y, 15y).
SG acted as joint global coordinator and joint bookrunner in the Fresenius bond issue (EUR, 7y, Convertible)
SG acted as joint bookrunner in ING Group's bond issue (EUR, RegS, 12yr).
SG acted as global coordinator and joint bookrunner in Kering 's bond issue (EUR 300m, 10y)
SG acted as co-manager in Mitsubishi UFJ's bond issue (USD, 5-7-10yr).
SG acted as co-manager in Novartis' bond issue (7y, 12y Eur).
SG acted as Co-manager in Novartis Finance's Bond issue(EUR;RegS;4yr/10.5yr)
SG acted as co-manager in Pepsi's bond issue (EUR,12yr).
SG acted acting as co-manager in PepsiCo's senior notes issue.
SG acted as Co-Manager in PepsiCo's bond issue (USD, 2yr, 5y, 30y).
SG acted as passive bookrunner in Publicis' bond issue (7y, EUR Benchmark).
SG acted as joint bookrunner in Saint Gobain's bond issue (EUR Benchmark, 3.5yr).
SG acted as joint bookrunner in Schneider Electric's bond issue (EUR Benchmark, 8yr).
SG acted as joint bookrunner in the diposal of BPI France's stake into Schneider Electric
SG provided bridge loan financing to Suez for the acquisition of GE Water, sold by General Electric.
SG is acting as buy-side adviser to Suez for the acquisition of GE Water, sold by General Electric.
SG acted as joint bookrunner in Suez's bond issue (EUR, 8y, 12y).
SG acted as joint bookrunner in Suez's hybrid bond issue (EUR; 7yr).
SG acted as joint global coordinator and joint bookrunner in Suez's capital increase via Accelerated Bookbuilding (ABB)
SG acted as joint bookrunner in TUI's High Yield Bond issuance (EUR, 5yr)
SG acted as joint Global Coordinator in Cofiroute's bond issue (RegS, 10y or 8y+12y).
SG acted as joint bookrunner in Vinci's convertible bond issue (USD, 5yr).
20
Societe Generale Private Banking is a division of the Societe Generale Group operating
through its head office within Societe Generale S.A. and its network (subsidiaries or
branches or departments of Societe Generale S.A.), located in various countries,
hereinafter mentioned, acting under the “Societe Generale Private Banking” brand, and
distributors of the document.
Subject of the document
The present document has been prepared by the experts of the Societe Generale Group
and more particularly of Societe Generale Private Banking division, to provide you with
information relating to some financial and economic data. The name and function of the
people having prepared this document are indicated in the first pages of this document.
In order to read and understand the financial and economic information included in this
document, you will need to have knowledge and experience of financial markets. The
content of this document only aims to provide simple information to help you to make
your investments or disinvestments decisions, and it shall not constitute a personal
recommendation. You keep the liability of your asset’s management, and you remain
free concerning your investment decisions.
Moreover, the document may mention financial products / asset classes that are not
authorized / marketable in certain countries, and / or which might be reserved for certain
categories of investors. Therefore, should you wish to make an investment, as the case
may be and according to the applicable laws, your advisor within your Societe Generale
Private Banking entity will check whether this investment is possible within your
jurisdiction and whether it corresponds to your investment profile.
Conflict of interest
This document contains the views of Societe Generale Private Banking’s experts.
Societe Generale Private Banking trading desks may trade, or have traded, as principal
on the basis of the expert(s) views and reports. In addition, Societe Generale Private
Banking’s experts receive compensation based, in part, on the quality and accuracy of
their analysis, client feedback, revenues of their entity of the Societe Generale Group
and competitive factors.
As a general matter, entities within the Societe Generale Group may make a market or
act as a principal trader in securities referred to in this report and can provide banking
services to the companies mentioned in that document, and to their subsidiary. Entities
within the Societe Generale Group may from time to time deal in, profit from trading on,
hold on a principal basis, or act as advisers or brokers or bankers in relation to securities,
or derivatives thereof, or asset class(es) mentioned in this document.
Entities within the Societe Generale Group may be represented on the supervisory board
or on the executive board of such persons, firms or entities. Employees of the Societe
Generale Group, or persons/entities connected to them, may from time to time have
positions in or hold any of the investment products/ asset class(es) mentioned in this
document.
Entities within the Societe Generale Group may acquire or liquidate from time to time
positions in the securities and/or underlying assets (including derivatives thereof)
referred to herein, if any, or in any other asset, and therefore any return to prospective
investor(s) may directly or indirectly be affected.
Entities within the Societe Generale Group are under no obligation to disclose or take
into account this document when advising or dealing with or on behalf of customers.In
addition, entities within the Societe Generale Group may issue other reports that are
inconsistent with, and reach different conclusions from the information presented in this
report and is under no obligation to ensure that such other reports are brought to the
attention of any recipient of this report.
Societe Generale Group maintains and operates effective organisational and
administrative arrangements taking all reasonable steps to identify, monitor and manage
conflicts of interest. To help the Societe Generale Private Banking entities to do this, they
have put in place a management of conflicts of interest policy designed to prevent
conflicts of interest giving rise to a material risk of damage to the interests of Societe
Generale Private Banking’s clients. For further information, Societe Generale Private
Banking’s clients can refer to the management of conflicts of interest’s policy, which was
provided to them by the Societe Generale Private Banking entity of which they are clients
General Warning
This document is subject to modifications and is given for purely informative purposes; it
does not constitute a contract. It is not intended to provide investment advice nor any
other investment service and the document does not constitute and under no
circumstances should it be considered in whole or in part as an offer, a solicitation,
advice, a personal recommendation, nor an invitation to invest in the investment products
and/or in any class of assets mentioned herein from any of the Societe Generale Private
Banking entities. The information indicated in this document shall not be considered as
legal or tax or accounting advice.
The analysis made in this document is made as a whole and cannot be dealt with
separately.
You should be aware that the investment to which this material relates may involve
numerous risks. The amount of risk may vary but can expose you to a significant risk of
losing all of your capital, including a potential unlimited loss. Accordingly these products
or services may be reserved only for a certain category of eligible investors such as
those who are sophisticated and familiar with these types of investment and who
understand the risks involved.
Accordingly, before making an investment decision, as the case may be and according to
the applicable laws, the potential investor will be questioned by his advisor of the Societe
Generale Private Banking entity of which he is the client, as to his eligibility for the
envisaged investment, and the compatibility of the investment with his investment profile
and objectives. He should also consult his own independent financial, legal and tax
advisers to obtain all the financial, legal and tax information which will allow him to
appraise the characteristics and the risks of the envisaged investment, as well as his tax
treatment, in light of his own circumstances.
The full understanding and agreement to the related contractual and informative
documentation including the documentation relating to the relevant risks is required from
the potential investor prior to any investment. The potential investor has to remember
that he should not base any investment decision and/or instructions solely on the basis of
this document. Any investment may have tax consequences and it is important to bear in
mind that the Societe Generale Private Banking entities do not provide tax advice. A
potential investor should consider seeking independent tax advice (where appropriate).
The level of taxation depends on individual circumstances and such levels and bases of
taxation can change.
The investment product(s)/asset class(es) described in this document may not be eligible
for sale or subscription in all jurisdictions or to certain categories of investors. It is the
responsibility of any person in possession of this document to inform to be aware of and
to observe all applicable laws and regulations of relevant jurisdictions.
This document is not intended to be distributed to a person or in a jurisdiction where
such distribution would be restricted or illegal. This document is in no way intended to be
distributed in or into the United States of America nor directly or indirectly to any U.S.
person.
The price and value of investments and the income derived from them can go down as
well as up. Changes in inflation, interest rates and exchange rates may have an adverse
effect on the value, price and income of investments issued in a different currency from
that of the client. The simulations and examples included in this document are provided
only for informational and illustration purposes alone. The present information may
change with market fluctuations and views reflected in this document may change.
The Societe Generale Private Banking entities disclaim any responsibility to update or
make any revisions to this document. The purpose of this document is to inform investors
who shall make their investment decisions without overly relying on the document. The
Societe Generale Private Banking entities disclaim any responsibility for direct or indirect
losses related to any use of this publication or its content. The Societe Generale Private
Banking entities offer no implicit or explicit guarantees as to the accuracy or exhaustivity
of the information or as to the profitability or performance of the asset classes, countries
and relevant markets.
The investment product(s)/asset class(es) described herein may be issued by issuer(s)
whose credit rating is provided by a rating agency and which can vary. The Societe
Generale Private Banking entities are not responsible for any risk in respect of such
issuer(s) including but not limited to risk of default of such issuer(s).
This document does not purport to list or summarize all of the financial products’ terms
and conditions, nor to identify or define all or any of the risks that would be associated
with the purchase or sale of the financial product(s)/asset class(es) described herein.
The historical data and information herein, including any quoted expression of opinion,
have been obtained from, or are based upon, external sources that the Societe Generale
Private Banking entities believe to be reliable but have not been independently verified
and are not guaranteed as to their accuracy or completeness. The Societe Generale
Private Banking entities shall not be liable for the accuracy, relevance or exhaustiveness
of this information. Information about past performance is not a guide to future
performance and may not be repeated. Investment value is not guaranteed and the value
of investments may fluctuate. Estimates of future performance are based on assumptions
that may not be realised, and should not be deemed an assurance or guarantee as to the
expected results of investment in such investment products and/or asset class(es).
This document is confidential, intended exclusively to the person to whom it is given, and
may not be communicated nor notified to any third party (with the exception of external
advisors on the condition they themselves respect this confidentiality undertaking) and
may not be copied in whole or in part, without the prior written consent of the relevant
Societe Generale Private Banking entity.
Risk level (cf above Rating System section): In order to draw the attention of potential
investors to the risk linked to each investment solution, Societe Generale Private
Banking has ranked each product according to its own specific risk scale from the lowest
risk (class 0) to the highest risk (class 4). The risk classification is a Societe Generale
Private Banking internal risk indicator.
This document is non-independent research and is a marketing communication.
It has not been prepared in accordance with legal requirements designed to
promote the independence of investment research and the investment service
provider is not subject to any prohibition on dealing ahead of the dissemination
of investment research
Important Disclaimer (1/2)
21
Risk Classification:
R0: Lowest Risk
R1: Low Risk
R2: Medium Risk
R3: High Risk
R4: Highest Risk
These internal indicators are based on the Value at Risk 95% 1 year (VaR). The VaR
corresponds to the maximum amount that the portfolio being considered could lose in
normal market conditions over a given period with a given probability (past performances
and simulations of performance shall not be considered as a reliable indicator of future
performance). If the VaR 95% 1 year is y%, this means that there is a 95% probability
that the portfolio will not lose more than y% of its value in one year.
Potential risks in case of an investment
Risk of loss of the total amount invested, volatility risk, risk linked to small and mid
capitalization, credit risk, counterpart risk, issuer’s risk, liquidity risk, risk linked to
discretionary management, change risk, market risk.
Specific warnings per jurisdiction (SGPB)
France: France: Unless otherwise expressly indicated, this document has been issued
and distributed by Societe Generale, a French bank authorised and supervised by the
Autorité de Contrôle Prudentiel et de Résolution, located at 61, rue Taitbout, 75436 Paris
Cedex 09, under the prudential supervision of the European Central Bank (“ECB”), and
under the control of the Autorité des Marchés Financiers (“AMF”). Societe Generale is
also registered at ORIAS as an insurance intermediary under the number 07 022 493
orias.fr. Societe generale is a French Société Anonyme with its registered address at 29
boulevard Haussman, 75009 Paris, with a capital of EUR 1,009,641,917.50 on 31
December 2016 and unique identification number 552 120 222 R.C.S. Paris. Further
details are available on request or can be found at www.
http://www.privatebanking.societegenerale.fr/..
Belgium: This document has been distributed in Belgium by Societe Generale Private
Banking SA/NV, a Belgian credit institution according to Belgian law and controlled and
supervised by the National Bank of Belgium (“NBB”) and the Financial Services and
Markets Authority (“FSMA”), and under the prudential supervision of the European
Central Bank (“ECB”). Societe Generale Private Banking SA/NV is registered as an
insurance broker at the FSMA under the number 61033A. Societe Generale Private
Banking SA/NV has its registered address at 9000 Ghent, Kortrijksesteenweg 302,
registered at the RPM Ghent, under the number VAT BE 0415.835.337. Further details
are available on request or can be found at www.privatebanking.societegenerale.be.
Luxembourg: This document has been distributed in Luxembourg by Societe Generale
Bank and Trust (“SGBT”), a credit institution which is authorised and regulated by the
Commission de Surveillance du Secteur Financier (“CSSF”), under the prudential
supervision of the European Central Bank (“ECB”), and whose head office is located at
11 avenue Emile Reuter – L 2420 Luxembourg. Further details are available on request
or can be found at www.sgbt.lu. No investment decision whatsoever may result from
solely reading this document. SGBT accepts no responsibility for the accuracy or
otherwise of information contained in this document. SGBT accepts no liability or
otherwise in respect of actions taken by recipients on the basis of this document only and
SGBT does not hold itself out as providing any advice, particularly in relation to
investment services. The opinions, views and forecasts expressed in this document
(including any attachments thereto) reflect the personal views of the author(s) and do not
reflect the views of any other person or SGBT unless otherwise mentioned. SGBT has
neither verified nor independently analysed the information contained in this document.
The CSSF has neither verified nor analysed the information contained in this document.
Monaco: The present document has been distributed in Monaco by Societe Generale
Private Banking (Monaco) S.A.M., located 13, 15 Bd des Moulins, 98000 Monaco,
Principality of Monaco, governed by the Autorité de Contrôle Prudentiel et de Résolution
and the Commission de Contrôle des Activités Financières. The Financial products
marketed in Monaco can be reserved for qualified investors in accordance with Law No.
1339 of 07/09/2007 and Sovereign Ordinance No 1.285 of 10/09/2007. Further details
are available upon request or on www.privatebanking.societegenerale.mc.
Switzerland: This document has been communicated in Switzerland by Societe
Generale Private Banking (Suisse) SA (« SGPBS »), whose head office is located at rue
du Rhône 8, CP 5022, CH-1211 Geneva 11. SGPBS is a bank authorized by the Swiss
Financial Market Supervisory Authority (“FINMA”). Further details are available on
request or can be found at www.privatebanking.societegenerale.ch. Unless it expressly
appears from this document that it was drafted with the involvement of SGPBS, this
document was issued outside of Switzerland for the « Private Banking » and is not the
result of SGPBS’ own financial analysis. The Directives of the Swiss Bankers Association
(SBA) on the Independence of Financial Research (the « Directives ») do not apply to
this document. SGPBS did not verify nor independently analyzed the information
contained in this document. SGPBS accepts no responsibility for the accuracy or
otherwise of information contained in this document. The opinions, views and forecasts
expressed in this document reflect the personal views of the relevant author(s) and shall
not engage SGPBS' liability. if it expressly appears from this document that it was drafted
with the involvement of SGPBS, the Directives only apply if and to the extent this
document includes an opinion or a recommendation about a company or a security. This
document is not a prospectus within the meaning of articles 652a and 1156 of the Swiss
Code of Obligations.
United Kingdom: This document has been distributed in the United Kingdom by SG
Hambros Bank Limited, whose head office is located at 8 St. James’s Square, London
SW1Y 4JU (“SGPB Hambros”). SGPB Hambros is authorised by the Prudential
Regulation Authority and regulated by the Financial Conduct Authority and the Prudential
Regulation Authority. The availability of the products or services described in this
document in the United Kingdom may be restricted by law. Further details are available
on request.
Jersey: This document has been distributed in Jersey by SG Hambros Bank (Channel
Islands) Limited (“SGH CI Limited”), whose registered office address is PO Box 78, SG
Hambros House, 18 Esplanade, St Helier, Jersey JE4 8PR. This document has not been
authorised or reviewed by the Jersey Financial Services Commission (“JFSC”). SGH CI
Limited is authorised by the JFSC for the conduct of investment business.
Guernsey: This document has been distributed in or from within the Bailiwick of
Guernsey by SG Hambros Bank (Channel Islands) Limited – Guernsey Branch, whose
principal address in Guernsey is PO Box 6, Hambros House, St Julian’s Avenue, St
Peter Port, Guernsey, GY1 3AE. SG Hambros Bank (Channel Islands) Limited –
Guernsey Branch is licensed under the Banking Supervision (Bailiwick of Guernsey)
Law, 1994, and the Protection of Investors (Bailiwick of Guernsey) Law, 1987.
Gibraltar: This document has been distributed in Gibraltar by SG Hambros Bank
(Gibraltar) Limited, whose head office is located at Hambros House, 32 Line Wall Road,
Gibraltar (“SG Hambros Gibraltar”). SG Hambros Gibraltar is authorised and regulated by
the Gibraltar Financial Services Commission for the conduct of banking, investment and
insurance mediation business. The availability of the products or services described in
the document in Gibraltar may be restricted by law. Further details are available on
request.
Societe Generale Private Banking Hambros is part of the wealth management arm of the
Societe Generale Group, Societe Generale Private Banking. Societe Generale is a
French bank authorised in France by the Autorité de Contrôle Prudentiel et de
Résolution, located at 61, rue Taitbout, 75436 Paris Cedex 09, and under the prudential
supervision of the European Central Bank (“ECB”). It is also authorised by the Prudential
Regulation Authority and regulated by the Financial Conduct Authority and the Prudential
Regulation Authority. Further information on the SGPB Hambros Group including
additional legal and regulatory details can be found on
www.privatebanking.societegenerale.com/hambros.
http://www.privatebanking.societegenerale.com.
© Copyright Societe Generale Group 2017. All rights reserved. Any unauthorized use,
duplication, redistribution or disclosure in whole or in part is prohibited without the prior
consent of Societe Generale. The key symbols, Societe Generale, Societe Generale
Private Banking are registered trademarks of Societe Generale. All rights reserved.
Important Disclaimer (2/2)
Equity Solutions Team:
Asia: Bangalore: Shishir Malik, Abhishek Iyer, Anirudh Srivastava, Harini Naidu,
Jyotiraditya Sharma, Neeraj Mendiratta, Ravi Kumar, Saurabh Lohariwala, Shalinee G,
Shekhar Kedia, Sriram Chellappa.
Europe: Jérôme Matt, Danny Van Quaethem, Kristof De Graeve, Mathieu Balleron.

22
Societe Generale Private Banking
Tour Alicante
17, Cours Valmy
92043 Paris La Défense Cedex
France
www.sgprivatebanking.com
Societe Generale S.A.
Share Capital of: EUR 1,009,641,917.50 at 31 December 2016
Registered under # 552 120 222
Recommended