PRIMERGYPRIMERGY FC スイッチブレード (8Gbps 18/8)PRIMERGY FC スイッチブレード (8Gbps 18/8)&FC ポートアップグレードPRIMERGY FC スイッチブレード (8Gbps 18/8)&拡張ライセンスオプションPRIMERGY BX Fibre Channel Switch 8Gbit/s 18/8(Brocade 5450)
Fabric Watch 管理者ガイド
Fabric OS v7.0.0
CA92344-0161-01

本書をお読みになる前に外国為替及び外国貿易法に基づく特定技術について
当社のドキュメントには「外国為替および外国貿易管理法」に基づく特定技術が含まれていることがあります。特定技術が含まれて
いる場合は、当該ドキュメントを輸出または非居住者に提供するとき、同法に基づく許可が必要となります。
本書の内容について
このたびは、弊社の PRIMERGY FC スイッチブレード(8Gbps 18/8)をお買い上げいただき、誠にありがとうございます。
本書は、本製品のFabric Watchの使用方法を示した、Fabric Watch管理者ガイドです。なお、本文は英語で記載してい
ます。
本書をよくお読みになり、正しい取り扱いをされますようお願いいたします。
53-1002153-0129 April 2011
®
Fabric WatchAdministrator’s Guide
Supporting Fabric OS v7.0.0
Copyright © 2000, 2002-2011 Brocade Communications Systems, Inc. All Rights Reserved.
Brocade, the B-wing symbol, BigIron, DCFM, DCX, Fabric OS, FastIron, IronView, NetIron, SAN Health, ServerIron, TurboIron, and Wingspan are registered trademarks, and Brocade Assurance, Brocade NET Health, Brocade One, Extraordinary Networks, MyBrocade, and VCS are trademarks of Brocade Communications Systems, Inc., in the United States and/or in other countries. Other brands, products, or service names mentioned are or may be trademarks or service marks of their respective owners.
Notice: This document is for informational purposes only and does not set forth any warranty, expressed or implied, concerning any equipment, equipment feature, or service offered or to be offered by Brocade. Brocade reserves the right to make changes to this document at any time, without notice, and assumes no responsibility for its use. This informational document describes features that may not be currently available. Contact a Brocade sales office for information on feature and product availability. Export of technical data contained in this document may require an export license from the United States government.
The authors and Brocade Communications Systems, Inc. shall have no liability or responsibility to any person or entity with respect to any loss, cost, liability, or damages arising from the information contained in this book or the computer programs that accompany it.
The product described by this document may contain “open source” software covered by the GNU General Public License or other open source license agreements. To find out which open source software is included in Brocade products, view the licensing terms applicable to the open source software, and obtain a copy of the programming source code, please visit http://www.brocade.com/support/oscd.
Brocade Communications Systems, Incorporated
Corporate and Latin American HeadquartersBrocade Communications Systems, Inc.130 Holger WaySan Jose, CA 95134 Tel: 1-408-333-8000 Fax: 1-408-333-8101 E-mail: [email protected]
Asia-Pacific HeadquartersBrocade Communications Systems China HK, Ltd.No. 1 Guanghua RoadChao Yang DistrictUnits 2718 and 2818Beijing 100020, ChinaTel: +8610 6588 8888Fax: +8610 6588 9999E-mail: [email protected]
European HeadquartersBrocade Communications Switzerland SàrlCentre SwissairTour B - 4ème étage29, Route de l'AéroportCase Postale 105CH-1215 Genève 15Switzerland Tel: +41 22 799 5640Fax: +41 22 799 5641E-mail: [email protected]
Asia-Pacific HeadquartersBrocade Communications Systems Co., Ltd. (Shenzhen WFOE)Citic PlazaNo. 233 Tian He Road NorthUnit 1308 – 13th FloorGuangzhou, ChinaTel: +8620 3891 2000Fax: +8620 3891 2111E-mail: [email protected]
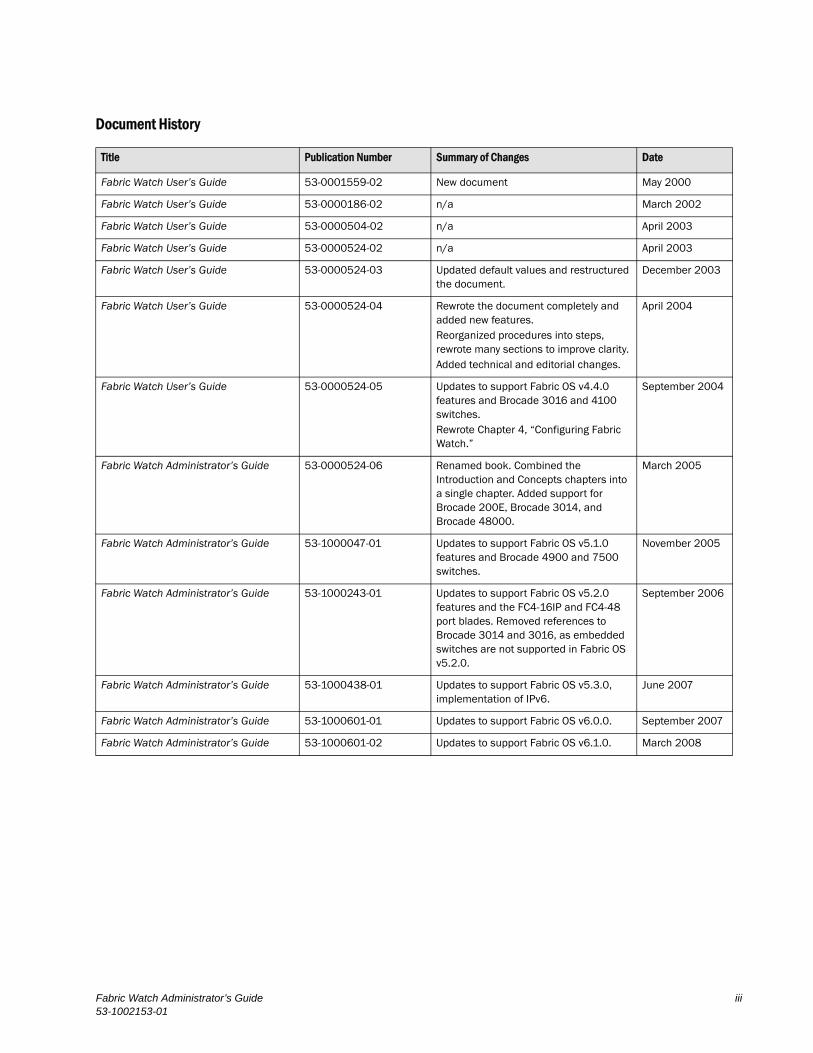
Document History
Title Publication Number Summary of Changes Date
Fabric Watch User’s Guide 53-0001559-02 New document May 2000
Fabric Watch User’s Guide 53-0000186-02 n/a March 2002
Fabric Watch User’s Guide 53-0000504-02 n/a April 2003
Fabric Watch User’s Guide 53-0000524-02 n/a April 2003
Fabric Watch User’s Guide 53-0000524-03 Updated default values and restructured the document.
December 2003
Fabric Watch User’s Guide 53-0000524-04 Rewrote the document completely and added new features.Reorganized procedures into steps, rewrote many sections to improve clarity.Added technical and editorial changes.
April 2004
Fabric Watch User’s Guide 53-0000524-05 Updates to support Fabric OS v4.4.0 features and Brocade 3016 and 4100 switches.Rewrote Chapter 4, “Configuring Fabric Watch.”
September 2004
Fabric Watch Administrator’s Guide 53-0000524-06 Renamed book. Combined the Introduction and Concepts chapters into a single chapter. Added support for Brocade 200E, Brocade 3014, and Brocade 48000.
March 2005
Fabric Watch Administrator’s Guide 53-1000047-01 Updates to support Fabric OS v5.1.0 features and Brocade 4900 and 7500 switches.
November 2005
Fabric Watch Administrator’s Guide 53-1000243-01 Updates to support Fabric OS v5.2.0 features and the FC4-16IP and FC4-48 port blades. Removed references to Brocade 3014 and 3016, as embedded switches are not supported in Fabric OS v5.2.0.
September 2006
Fabric Watch Administrator’s Guide 53-1000438-01 Updates to support Fabric OS v5.3.0, implementation of IPv6.
June 2007
Fabric Watch Administrator’s Guide 53-1000601-01 Updates to support Fabric OS v6.0.0. September 2007
Fabric Watch Administrator’s Guide 53-1000601-02 Updates to support Fabric OS v6.1.0. March 2008
Fabric Watch Administrator’s Guide iii53-1002153-01
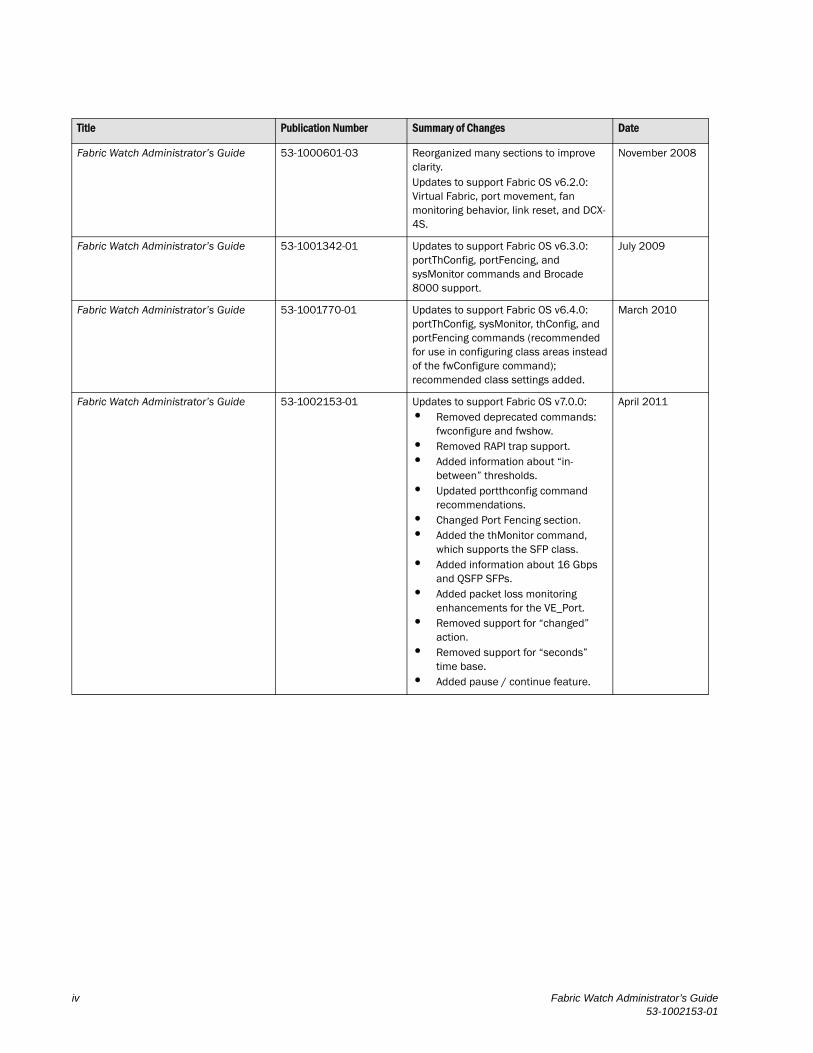
Fabric Watch Administrator’s Guide 53-1000601-03 Reorganized many sections to improve clarity.Updates to support Fabric OS v6.2.0: Virtual Fabric, port movement, fan monitoring behavior, link reset, and DCX-4S.
November 2008
Fabric Watch Administrator’s Guide 53-1001342-01 Updates to support Fabric OS v6.3.0: portThConfig, portFencing, and sysMonitor commands and Brocade 8000 support.
July 2009
Fabric Watch Administrator’s Guide 53-1001770-01 Updates to support Fabric OS v6.4.0: portThConfig, sysMonitor, thConfig, and portFencing commands (recommended for use in configuring class areas instead of the fwConfigure command); recommended class settings added.
March 2010
Fabric Watch Administrator’s Guide 53-1002153-01 Updates to support Fabric OS v7.0.0:• Removed deprecated commands:
fwconfigure and fwshow. • Removed RAPI trap support.• Added information about “in-
between” thresholds.• Updated portthconfig command
recommendations.• Changed Port Fencing section.• Added the thMonitor command,
which supports the SFP class.• Added information about 16 Gbps
and QSFP SFPs.• Added packet loss monitoring
enhancements for the VE_Port.• Removed support for “changed”
action.• Removed support for “seconds”
time base.• Added pause / continue feature.
April 2011
Title Publication Number Summary of Changes Date
iv Fabric Watch Administrator’s Guide53-1002153-01
Contents
About This Document
In this chapter . . . . . . . . . . . . . . . . . . . . . . . . . . . . . . . . . . . . . . . . . . . xv
How this document is organized . . . . . . . . . . . . . . . . . . . . . . . . . . . . xv
Supported hardware and software . . . . . . . . . . . . . . . . . . . . . . . . . . xvi
Deprecated hardware platform support. . . . . . . . . . . . . . . . . . xvii
What’s new in this document . . . . . . . . . . . . . . . . . . . . . . . . . . . . . . xvii
New information. . . . . . . . . . . . . . . . . . . . . . . . . . . . . . . . . . . . . xvii
Changed information . . . . . . . . . . . . . . . . . . . . . . . . . . . . . . . . . xviii
Removed information . . . . . . . . . . . . . . . . . . . . . . . . . . . . . . . . xviii
Document conventions . . . . . . . . . . . . . . . . . . . . . . . . . . . . . . . . . . . xviii
Text formatting . . . . . . . . . . . . . . . . . . . . . . . . . . . . . . . . . . . . . . xviii
Notes, cautions, and warnings . . . . . . . . . . . . . . . . . . . . . . . . . . xix
Key terms . . . . . . . . . . . . . . . . . . . . . . . . . . . . . . . . . . . . . . . . . . . xix
Additional information. . . . . . . . . . . . . . . . . . . . . . . . . . . . . . . . . . . . . xix
Other industry resources . . . . . . . . . . . . . . . . . . . . . . . . . . . . . . . xx
Getting technical help . . . . . . . . . . . . . . . . . . . . . . . . . . . . . . . . . . . . . .xx
Document feedback . . . . . . . . . . . . . . . . . . . . . . . . . . . . . . . . . . . . . . xxi
Chapter 1 Fabric Watch
In this chapter . . . . . . . . . . . . . . . . . . . . . . . . . . . . . . . . . . . . . . . . . . . . 1
Fabric health . . . . . . . . . . . . . . . . . . . . . . . . . . . . . . . . . . . . . . . . . . . . . 1
Fabric Watch overview . . . . . . . . . . . . . . . . . . . . . . . . . . . . . . . . . . . . . 2
Role-based access control . . . . . . . . . . . . . . . . . . . . . . . . . . . . . . . . . . 2
Fabric Watch licensing . . . . . . . . . . . . . . . . . . . . . . . . . . . . . . . . . . . . . 2
Reasons to customize Fabric Watch settings . . . . . . . . . . . . . . . . . . . 3
Monitoring . . . . . . . . . . . . . . . . . . . . . . . . . . . . . . . . . . . . . . . . . . . 3
Threshold and action configuration . . . . . . . . . . . . . . . . . . . . . . . 3
Event behavior configuration . . . . . . . . . . . . . . . . . . . . . . . . . . . . 4
Time base configuration . . . . . . . . . . . . . . . . . . . . . . . . . . . . . . . . 4
Alert configuration . . . . . . . . . . . . . . . . . . . . . . . . . . . . . . . . . . . . . 4
Post-processing of messages . . . . . . . . . . . . . . . . . . . . . . . . . . . . 4
Class, area, and element hierarchy . . . . . . . . . . . . . . . . . . . . . . . . . . . 5
Fabric Watch Administrator’s Guide v53-1002153-01
Switch monitoring components . . . . . . . . . . . . . . . . . . . . . . . . . . . . . . 5
Fabric events monitoring . . . . . . . . . . . . . . . . . . . . . . . . . . . . . . . . 5
Performance monitoring . . . . . . . . . . . . . . . . . . . . . . . . . . . . . . . . 5
Security monitoring . . . . . . . . . . . . . . . . . . . . . . . . . . . . . . . . . . . . 6
SFP monitoring. . . . . . . . . . . . . . . . . . . . . . . . . . . . . . . . . . . . . . . . 6
Port monitoring . . . . . . . . . . . . . . . . . . . . . . . . . . . . . . . . . . . . . . . 6
System resource monitoring . . . . . . . . . . . . . . . . . . . . . . . . . . . . . 8
Switch policies . . . . . . . . . . . . . . . . . . . . . . . . . . . . . . . . . . . . . . . . 8
Logical switch support . . . . . . . . . . . . . . . . . . . . . . . . . . . . . . . . . . . . . 8
Threshold monitoring using SNMP tables . . . . . . . . . . . . . . . . . . . . . . 9
MIB capability configuration parameters . . . . . . . . . . . . . . . . . . . 9
Fabric Watch event settings . . . . . . . . . . . . . . . . . . . . . . . . . . . . . . . . . 9
Triggered event behavior . . . . . . . . . . . . . . . . . . . . . . . . . . . . . . . 10
Fabric Watch notification types . . . . . . . . . . . . . . . . . . . . . . . . . . . . .11
E-mail alert . . . . . . . . . . . . . . . . . . . . . . . . . . . . . . . . . . . . . . . . . .11
SNMP traps . . . . . . . . . . . . . . . . . . . . . . . . . . . . . . . . . . . . . . . . .11
RASlog (switch event) . . . . . . . . . . . . . . . . . . . . . . . . . . . . . . . . .12
Locked port log. . . . . . . . . . . . . . . . . . . . . . . . . . . . . . . . . . . . . . .12
Fabric Watch audit messages . . . . . . . . . . . . . . . . . . . . . . . . . . . . . .12
Data values . . . . . . . . . . . . . . . . . . . . . . . . . . . . . . . . . . . . . . . . . . . . .13
Fabric Watch support in Access Gateway mode . . . . . . . . . . . . . . . .13
Chapter 2 Fabric Watch Thresholds
In this chapter . . . . . . . . . . . . . . . . . . . . . . . . . . . . . . . . . . . . . . . . . . .15
Threshold values . . . . . . . . . . . . . . . . . . . . . . . . . . . . . . . . . . . . . . . . .15
In-between buffer values. . . . . . . . . . . . . . . . . . . . . . . . . . . . . . . 16
Audit and RASlog messages . . . . . . . . . . . . . . . . . . . . . . . . . . . . 16
Time bases . . . . . . . . . . . . . . . . . . . . . . . . . . . . . . . . . . . . . . . . . . . . . 17
Time base set to none . . . . . . . . . . . . . . . . . . . . . . . . . . . . . . . . . 17
Time base set to other than none. . . . . . . . . . . . . . . . . . . . . . . . 17
Threshold triggers . . . . . . . . . . . . . . . . . . . . . . . . . . . . . . . . . . . . . . . .18
Above event trigger . . . . . . . . . . . . . . . . . . . . . . . . . . . . . . . . . . .19
Below event trigger . . . . . . . . . . . . . . . . . . . . . . . . . . . . . . . . . . .19
Fabric Watch alarm behavior . . . . . . . . . . . . . . . . . . . . . . . . . . . . . . .19
Chapter 3 Fabric Watch Threshold Components
In this chapter . . . . . . . . . . . . . . . . . . . . . . . . . . . . . . . . . . . . . . . . . . . 21
vi Fabric Watch Administrator’s Guide53-1002153-01
Fabric Watch classes, areas, and elements . . . . . . . . . . . . . . . . . . 21
Classes . . . . . . . . . . . . . . . . . . . . . . . . . . . . . . . . . . . . . . . . . . . . 21
Class areas . . . . . . . . . . . . . . . . . . . . . . . . . . . . . . . . . . . . . . . . . 21
Elements . . . . . . . . . . . . . . . . . . . . . . . . . . . . . . . . . . . . . . . . . . . 22
Chapter 4 Fabric Watch Activation
In this chapter . . . . . . . . . . . . . . . . . . . . . . . . . . . . . . . . . . . . . . . . . . 25
Interfaces for activating Fabric Watch . . . . . . . . . . . . . . . . . . . . . . . 25
Activating Fabric Watch using a Telnet session . . . . . . . . . . . . 25
Activating Fabric Watch using SNMP. . . . . . . . . . . . . . . . . . . . . 26
Activating Fabric Watch using Web Tools . . . . . . . . . . . . . . . . . 30
Chapter 5 Fabric Watch Configuration
In this chapter . . . . . . . . . . . . . . . . . . . . . . . . . . . . . . . . . . . . . . . . . . 31
Fabric Watch configuration tasks . . . . . . . . . . . . . . . . . . . . . . . . . . . 31
Setting Fabric Watch custom and default values . . . . . . . . . . . . . . 33
E-mail notification configuration . . . . . . . . . . . . . . . . . . . . . . . . . . . . 33
Showing e-mail configuration information . . . . . . . . . . . . . . . . 33
Disabling an e-mail alert . . . . . . . . . . . . . . . . . . . . . . . . . . . . . . 34
Enabling an e-mail alert . . . . . . . . . . . . . . . . . . . . . . . . . . . . . . . 34
Sending a test e-mail message . . . . . . . . . . . . . . . . . . . . . . . . . 35
Setting recipient e-mail address for e-mail alert . . . . . . . . . . . 35
Setting the relay host IP address. . . . . . . . . . . . . . . . . . . . . . . . 35
Displaying the relay host configuration . . . . . . . . . . . . . . . . . . . 36
Removing the relay host configuration . . . . . . . . . . . . . . . . . . . 36
Notification configuration . . . . . . . . . . . . . . . . . . . . . . . . . . . . . . . . . 36
Configuring alarm notifications . . . . . . . . . . . . . . . . . . . . . . . . . 36
Chapter 6 Fabric, Security, SFP, and Performance Monitoring
In this chapter . . . . . . . . . . . . . . . . . . . . . . . . . . . . . . . . . . . . . . . . . . 39
Fabric monitoring guidelines and default settings . . . . . . . . . . . . . 39
Fabric class areas. . . . . . . . . . . . . . . . . . . . . . . . . . . . . . . . . . . . 39
Fabric monitoring setting guidelines . . . . . . . . . . . . . . . . . . . . . 40
Fabric class default settings . . . . . . . . . . . . . . . . . . . . . . . . . . . 41
Security monitoring guidelines and default settings . . . . . . . . . . . . 42
Security class areas . . . . . . . . . . . . . . . . . . . . . . . . . . . . . . . . . . 42
Security monitoring default settings . . . . . . . . . . . . . . . . . . . . . 42
Fabric Watch Administrator’s Guide vii53-1002153-01
SFP monitoring guidelines and default settings . . . . . . . . . . . . . . . .45
SFP class areas . . . . . . . . . . . . . . . . . . . . . . . . . . . . . . . . . . . . . .45
SFP monitoring default settings . . . . . . . . . . . . . . . . . . . . . . . . .46
Performance monitoring guidelines and default settings . . . . . . . . 47
Performance Monitor class areas. . . . . . . . . . . . . . . . . . . . . . . . 47
Performance monitoring setting guidelines . . . . . . . . . . . . . . . . 47
Performance Monitor class default settings . . . . . . . . . . . . . . . 47
thConfig command . . . . . . . . . . . . . . . . . . . . . . . . . . . . . . . . . . . . . . .48
thConfig command examples . . . . . . . . . . . . . . . . . . . . . . . . . . .50
16 Gbps and QSFP monitoring . . . . . . . . . . . . . . . . . . . . . . . . . .50
Recommended settings for Fabric, SFP, Performance, Security classes. . . . . . . . . . . . . . . . . . . . . . . . . . . . . . . . . . . . . . . . . .54
Chapter 7 Port Monitoring
In this chapter . . . . . . . . . . . . . . . . . . . . . . . . . . . . . . . . . . . . . . . . . . . 57
Port class areas. . . . . . . . . . . . . . . . . . . . . . . . . . . . . . . . . . . . . . . . . . 57
Port class guidelines and default settings . . . . . . . . . . . . . . . . . . . .58
Physical port setting guidelines . . . . . . . . . . . . . . . . . . . . . . . . .58
Port class default settings. . . . . . . . . . . . . . . . . . . . . . . . . . . . . .59
Port configuration . . . . . . . . . . . . . . . . . . . . . . . . . . . . . . . . . . . . . . . .60
Custom port settings . . . . . . . . . . . . . . . . . . . . . . . . . . . . . . . . . .60
Using the nosave command . . . . . . . . . . . . . . . . . . . . . . . . . . . . 61
portThConfig command procedures . . . . . . . . . . . . . . . . . . . . . . . . . 61
Port type: physical port . . . . . . . . . . . . . . . . . . . . . . . . . . . . . . . . 61
E_Port subclass setting guidelines. . . . . . . . . . . . . . . . . . . . . . .63
E_Port class default settings. . . . . . . . . . . . . . . . . . . . . . . . . . . .64
FOP_Port and FCU_Port subclass setting guidelines . . . . . . . .66
FOP_Port and FCU_Port subclass default settings . . . . . . . . . .67
VE_Port class default settings . . . . . . . . . . . . . . . . . . . . . . . . . .69
Port type: E_Port, FOP_Port, or FCU_Port . . . . . . . . . . . . . . . . .69
Setting the port persistence time . . . . . . . . . . . . . . . . . . . . . . . .69
Port fencing . . . . . . . . . . . . . . . . . . . . . . . . . . . . . . . . . . . . . . . . . . . . .70
Port fencing configuration . . . . . . . . . . . . . . . . . . . . . . . . . . . . . . 71
Port fencing configuration using DCFM . . . . . . . . . . . . . . . . . . .72
Recommended port configuration settings. . . . . . . . . . . . . . . . . . . . 74
Chapter 8 System Monitoring
In this chapter . . . . . . . . . . . . . . . . . . . . . . . . . . . . . . . . . . . . . . . . . . . 77
viii Fabric Watch Administrator’s Guide53-1002153-01
Environment monitoring . . . . . . . . . . . . . . . . . . . . . . . . . . . . . . . . . . 77
Environment class area . . . . . . . . . . . . . . . . . . . . . . . . . . . . . . . 77
Environment monitoring setting guidelines . . . . . . . . . . . . . . . 78
Environment class default settings . . . . . . . . . . . . . . . . . . . . . . 78
Resource class settings. . . . . . . . . . . . . . . . . . . . . . . . . . . . . . . . . . . 79
Resource class area . . . . . . . . . . . . . . . . . . . . . . . . . . . . . . . . . . 79
Resource class setting guidelines . . . . . . . . . . . . . . . . . . . . . . . 79
Resource class default settings. . . . . . . . . . . . . . . . . . . . . . . . . 79
System monitoring using the sysMonitor command . . . . . . . . . . . . 80
Using the nosave command. . . . . . . . . . . . . . . . . . . . . . . . . . . . 80
Examples of the sysMonitor command . . . . . . . . . . . . . . . . . . . . . . 81
Environment class settings . . . . . . . . . . . . . . . . . . . . . . . . . . . . 81
Resource class settings . . . . . . . . . . . . . . . . . . . . . . . . . . . . . . . 81
CPU and memory . . . . . . . . . . . . . . . . . . . . . . . . . . . . . . . . . . . . 82
Examples of the CPU and memory commands . . . . . . . . . . . . 82
Recommended environment and resource monitoring settings . . 83
Switch monitoring . . . . . . . . . . . . . . . . . . . . . . . . . . . . . . . . . . . . . . . 83
Switch status policy planning. . . . . . . . . . . . . . . . . . . . . . . . . . . 84
FRU monitoring. . . . . . . . . . . . . . . . . . . . . . . . . . . . . . . . . . . . . . . . . . 85
FRU class areas . . . . . . . . . . . . . . . . . . . . . . . . . . . . . . . . . . . . . 86
Configuring FRUs . . . . . . . . . . . . . . . . . . . . . . . . . . . . . . . . . . . . 86
Specifying triggers for FRU alarms . . . . . . . . . . . . . . . . . . . . . . 87
Recommended FRU settings . . . . . . . . . . . . . . . . . . . . . . . . . . . 87
Chapter 9 Fabric Watch Configuration Using Web Tools
In this chapter . . . . . . . . . . . . . . . . . . . . . . . . . . . . . . . . . . . . . . . . . . 89
Fabric Watch Configuration Using Web Tools. . . . . . . . . . . . . . . . . . 89
Opening the Fabric Watch window . . . . . . . . . . . . . . . . . . . . . . 89
System Monitor . . . . . . . . . . . . . . . . . . . . . . . . . . . . . . . . . . . . . . 90
Fabric Watch threshold configuration . . . . . . . . . . . . . . . . . . . . 91
Configuring alarms for FRUs . . . . . . . . . . . . . . . . . . . . . . . . . . . 94
Configuring alarm filters. . . . . . . . . . . . . . . . . . . . . . . . . . . . . . . 94
Fabric Watch alarm information . . . . . . . . . . . . . . . . . . . . . . . . 95
E-mail notification . . . . . . . . . . . . . . . . . . . . . . . . . . . . . . . . . . . . 96
Chapter 10 Fabric Watch Reports
In this chapter . . . . . . . . . . . . . . . . . . . . . . . . . . . . . . . . . . . . . . . . . . 99
Fabric Watch Administrator’s Guide ix53-1002153-01
Fabric Watch reports. . . . . . . . . . . . . . . . . . . . . . . . . . . . . . . . . . . . . .99
Switch Availability Monitor report. . . . . . . . . . . . . . . . . . . . . . . . . . .100
Generating a Switch Availability Monitor report. . . . . . . . . . . .100
Switch Health report . . . . . . . . . . . . . . . . . . . . . . . . . . . . . . . . . . . . .101
Generating a Switch Health report . . . . . . . . . . . . . . . . . . . . . .101
Switch Status Policy report. . . . . . . . . . . . . . . . . . . . . . . . . . . . . . . .102
Generating a Switch Status Policy report. . . . . . . . . . . . . . . . .102
Port Detail report. . . . . . . . . . . . . . . . . . . . . . . . . . . . . . . . . . . . . . . .103
Generating a Port Detail report. . . . . . . . . . . . . . . . . . . . . . . . .103
Index
x Fabric Watch Administrator’s Guide53-1002153-01
Tables
Table 1 Fabric Watch classes . . . . . . . . . . . . . . . . . . . . . . . . . . . . . . . . . . . . . . . . . . . . . . . 22
Table 2 Fabric Watch configuration tasks . . . . . . . . . . . . . . . . . . . . . . . . . . . . . . . . . . . . . 31
Table 3 Fabric class areas. . . . . . . . . . . . . . . . . . . . . . . . . . . . . . . . . . . . . . . . . . . . . . . . . . 39
Table 4 Fabric class default settings . . . . . . . . . . . . . . . . . . . . . . . . . . . . . . . . . . . . . . . . . 41
Table 5 Security class areas . . . . . . . . . . . . . . . . . . . . . . . . . . . . . . . . . . . . . . . . . . . . . . . . 42
Table 6 Security class area default settings . . . . . . . . . . . . . . . . . . . . . . . . . . . . . . . . . . . 43
Table 7 SFP class areas. . . . . . . . . . . . . . . . . . . . . . . . . . . . . . . . . . . . . . . . . . . . . . . . . . . . 45
Table 8 SFP class default settings . . . . . . . . . . . . . . . . . . . . . . . . . . . . . . . . . . . . . . . . . . . 46
Table 9 Performance Monitor class areas . . . . . . . . . . . . . . . . . . . . . . . . . . . . . . . . . . . . . 47
Table 10 Performance Monitor class default settings. . . . . . . . . . . . . . . . . . . . . . . . . . . . . 47
Table 11 End-to-End Performance Monitor class default settings . . . . . . . . . . . . . . . . . . . 48
Table 12 Configuration options for thConfig command. . . . . . . . . . . . . . . . . . . . . . . . . . . . 49
Table 13 16 Gbps and QSFP configurable SFP types . . . . . . . . . . . . . . . . . . . . . . . . . . . . . 53
Table 14 Recommended settings for Fabric, SFP, Performance, and Security classes . . 54
Table 15 Port class areas . . . . . . . . . . . . . . . . . . . . . . . . . . . . . . . . . . . . . . . . . . . . . . . . . . . 57
Table 16 Port class default settings . . . . . . . . . . . . . . . . . . . . . . . . . . . . . . . . . . . . . . . . . . . 59
Table 17 E_Port class default settings . . . . . . . . . . . . . . . . . . . . . . . . . . . . . . . . . . . . . . . . . 64
Table 18 FOP_Port and FCU_Port class default settings. . . . . . . . . . . . . . . . . . . . . . . . . . . 67
Table 19 VE_Port class default settings . . . . . . . . . . . . . . . . . . . . . . . . . . . . . . . . . . . . . . . . 69
Table 20 Port fencing class and subclass areas . . . . . . . . . . . . . . . . . . . . . . . . . . . . . . . . . 70
Table 21 Recommended port fencing thresholds . . . . . . . . . . . . . . . . . . . . . . . . . . . . . . . . 71
Table 22 Recommended configuration for the Port class. . . . . . . . . . . . . . . . . . . . . . . . . . 74
Table 23 Environment class area . . . . . . . . . . . . . . . . . . . . . . . . . . . . . . . . . . . . . . . . . . . . . 77
Table 24 Environment class default settings . . . . . . . . . . . . . . . . . . . . . . . . . . . . . . . . . . . . 78
Table 25 Resource class area . . . . . . . . . . . . . . . . . . . . . . . . . . . . . . . . . . . . . . . . . . . . . . . . 79
Table 26 Resource class default settings. . . . . . . . . . . . . . . . . . . . . . . . . . . . . . . . . . . . . . . 79
Table 27 Recommended Environment and Resource class settings . . . . . . . . . . . . . . . . . 83
Table 28 Switch status policy factors . . . . . . . . . . . . . . . . . . . . . . . . . . . . . . . . . . . . . . . . . . 84
Table 29 FRU class areas . . . . . . . . . . . . . . . . . . . . . . . . . . . . . . . . . . . . . . . . . . . . . . . . . . . 86
Table 30 Recommended FRU settings . . . . . . . . . . . . . . . . . . . . . . . . . . . . . . . . . . . . . . . . . 87
Table 31 Alarm notification table fields . . . . . . . . . . . . . . . . . . . . . . . . . . . . . . . . . . . . . . . . 95
Table 32 Fabric OS commands to view Fabric Watch reports . . . . . . . . . . . . . . . . . . . . . . 99
Table 33 Port Detail report columns . . . . . . . . . . . . . . . . . . . . . . . . . . . . . . . . . . . . . . . . . . 104
Fabric Watch Administrator’s Guide xi53-1002153-01

xii Fabric Watch Administrator’s Guide53-1002153-01
Figures
Figure 1 In-between buffer values . . . . . . . . . . . . . . . . . . . . . . . . . . . . . . . . . . . . . . . . . . . . 16
Figure 2 Time base set to none . . . . . . . . . . . . . . . . . . . . . . . . . . . . . . . . . . . . . . . . . . . . . . 17
Figure 3 Event trigger . . . . . . . . . . . . . . . . . . . . . . . . . . . . . . . . . . . . . . . . . . . . . . . . . . . . . . 18
Figure 4 Above event trigger with buffer zone. . . . . . . . . . . . . . . . . . . . . . . . . . . . . . . . . . . 19
Figure 5 Configuring Fabric Watch using SNMP . . . . . . . . . . . . . . . . . . . . . . . . . . . . . . . . . 26
Figure 6 Example OID tree . . . . . . . . . . . . . . . . . . . . . . . . . . . . . . . . . . . . . . . . . . . . . . . . . . 29
Figure 7 Fabric Watch dialog box . . . . . . . . . . . . . . . . . . . . . . . . . . . . . . . . . . . . . . . . . . . . . 90
Fabric Watch Administrator’s Guide xiii53-1002153-01

xiv Fabric Watch Administrator’s Guide53-1002153-01
About This Document
In this chapter
•How this document is organized . . . . . . . . . . . . . . . . . . . . . . . . . . . . . . . . . . xv
•Supported hardware and software. . . . . . . . . . . . . . . . . . . . . . . . . . . . . . . . . xvi
•What’s new in this document . . . . . . . . . . . . . . . . . . . . . . . . . . . . . . . . . . . . xvii
•Document conventions . . . . . . . . . . . . . . . . . . . . . . . . . . . . . . . . . . . . . . . . . xviii
•Additional information. . . . . . . . . . . . . . . . . . . . . . . . . . . . . . . . . . . . . . . . . . . xix
•Getting technical help . . . . . . . . . . . . . . . . . . . . . . . . . . . . . . . . . . . . . . . . . . . xx
•Document feedback . . . . . . . . . . . . . . . . . . . . . . . . . . . . . . . . . . . . . . . . . . . . xxi
How this document is organized
This document is organized to help you find the information that you want as quickly and easily as possible.
This document contains the following components:
• Chapter 1, “Fabric Watch,” provides an introduction to Fabric Watch and the benefits of its use. It also defines concepts that are useful in Fabric Watch configuration.
• Chapter 2, “Fabric Watch Thresholds,” explains the concept of high and low thresholds and buffer values and provides examples of various threshold settings.
• Chapter 3, “Fabric Watch Threshold Components,” describes the components (class, area, and element) associated with every monitored behavior.
• Chapter 4, “Fabric Watch Activation,” describes the Fabric Watch requirements, provides an overview of the interfaces, and explains the methods of accessing Fabric Watch through each interface.
• Chapter 5, “Fabric Watch Configuration,” provides a comprehensive table that lists the commands you can use to create custom threshold configurations. This chapter discusses configuration files, setting the port persistence time, custom and default values, and e-mail notifications.
• Chapter 6, “Fabric, Security, SFP, and Performance Monitoring,” describes how to configure high and low thresholds for Fabric Watch event monitoring for SFP, Fabric, Performance, and Security classes using the thConfig command.
• Chapter 7, “Port Monitoring,” describes how to configure high and low thresholds, buffers, triggers, and actions on specified ports using the portThConfig command.
Fabric Watch Administrator’s Guide xv53-1002153-01
• Chapter 8, “System Monitoring,” describes how to configure system memory and CPU values using the sysMonitor command. This chapter also lists the switch status policy factors that affect the health of the switch, describes how to set and view switch status policies, and details how to configure FRUs.
• Chapter 9, “Fabric Watch Configuration Using Web Tools,”provides information about how to use Web Tools to configure Fabric Watch settings, an alternative to using the command line interface.
• Chapter 10, “Fabric Watch Reports,” describes the reports available through Fabric Watch and the methods of accessing each report.
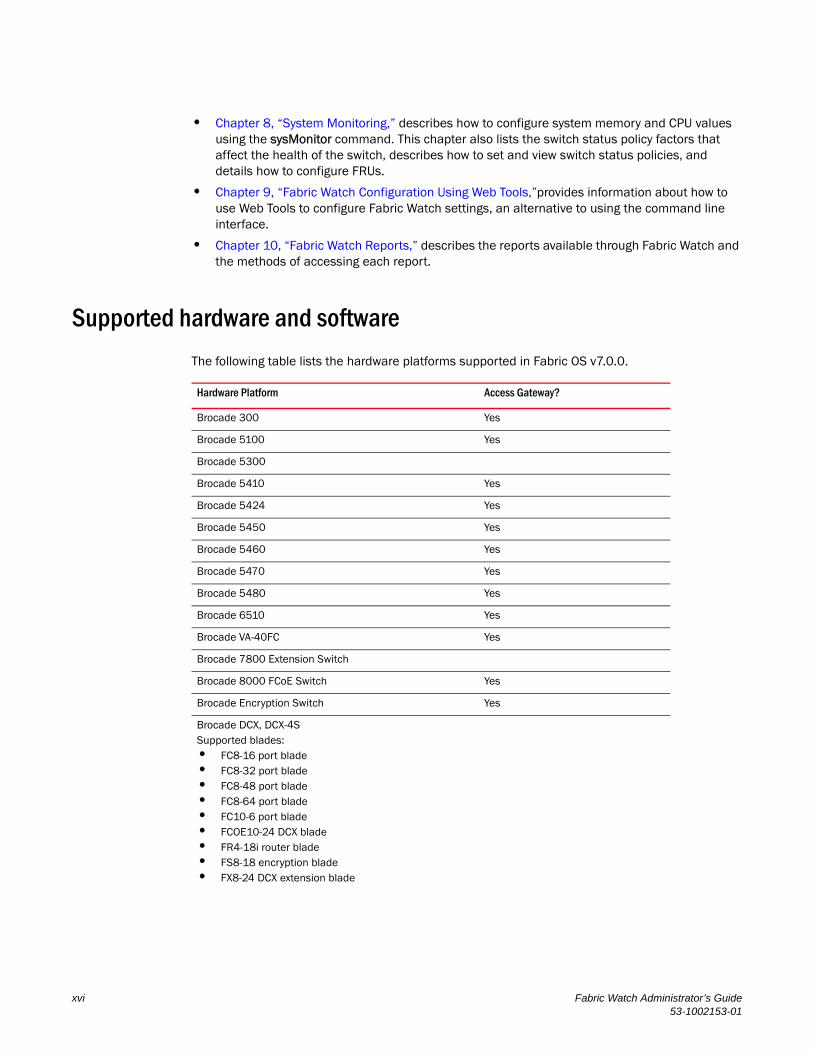
Supported hardware and software
The following table lists the hardware platforms supported in Fabric OS v7.0.0.
Hardware Platform Access Gateway?
Brocade 300 Yes
Brocade 5100 Yes
Brocade 5300
Brocade 5410 Yes
Brocade 5424 Yes
Brocade 5450 Yes
Brocade 5460 Yes
Brocade 5470 Yes
Brocade 5480 Yes
Brocade 6510 Yes
Brocade VA-40FC Yes
Brocade 7800 Extension Switch
Brocade 8000 FCoE Switch Yes
Brocade Encryption Switch Yes
Brocade DCX, DCX-4SSupported blades:• FC8-16 port blade• FC8-32 port blade• FC8-48 port blade• FC8-64 port blade• FC10-6 port blade• FCOE10-24 DCX blade• FR4-18i router blade• FS8-18 encryption blade• FX8-24 DCX extension blade
xvi Fabric Watch Administrator’s Guide53-1002153-01
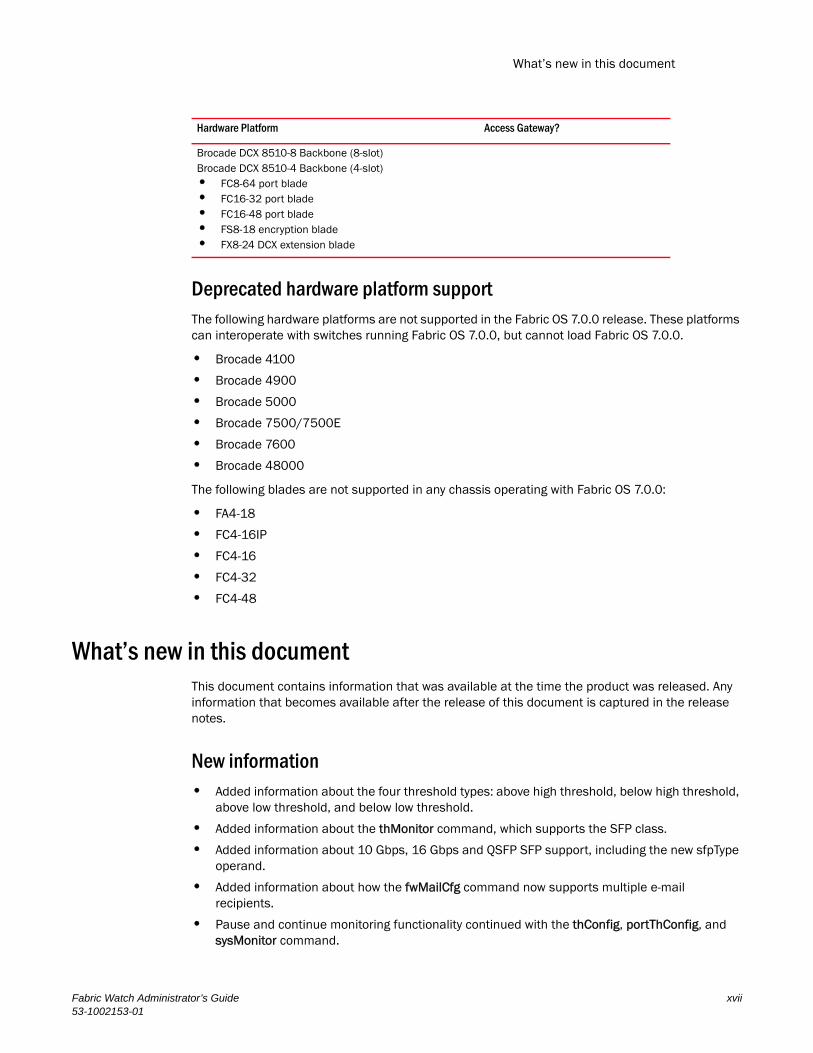
What’s new in this document
Deprecated hardware platform supportThe following hardware platforms are not supported in the Fabric OS 7.0.0 release. These platforms can interoperate with switches running Fabric OS 7.0.0, but cannot load Fabric OS 7.0.0.
• Brocade 4100
• Brocade 4900
• Brocade 5000
• Brocade 7500/7500E
• Brocade 7600
• Brocade 48000
The following blades are not supported in any chassis operating with Fabric OS 7.0.0:
• FA4-18
• FC4-16IP
• FC4-16
• FC4-32
• FC4-48
What’s new in this documentThis document contains information that was available at the time the product was released. Any information that becomes available after the release of this document is captured in the release notes.
New information• Added information about the four threshold types: above high threshold, below high threshold,
above low threshold, and below low threshold.
• Added information about the thMonitor command, which supports the SFP class.
• Added information about 10 Gbps, 16 Gbps and QSFP SFP support, including the new sfpType operand.
• Added information about how the fwMailCfg command now supports multiple e-mail recipients.
• Pause and continue monitoring functionality continued with the thConfig, portThConfig, and sysMonitor command.
Brocade DCX 8510-8 Backbone (8-slot)Brocade DCX 8510-4 Backbone (4-slot)• FC8-64 port blade• FC16-32 port blade• FC16-48 port blade• FS8-18 encryption blade• FX8-24 DCX extension blade
Hardware Platform Access Gateway?
Fabric Watch Administrator’s Guide xvii53-1002153-01
What’s new in this document
• Packet loss monitoring enhancements on the VE_Port.
Changed information• Updated port fencing section and included moderate, aggressive, and conservative threshold
settings.
• Recommended settings for Port areas using the portThConfig command.
• Buffer settings which now enable the user to configure “in-between” buffer values for thresholds that fall between the below high threshold and the above low threshold boundaries.
Removed information• All references to deprecated fwconfigure and fwshow commands
• Seconds timebase
• “In-between” and “Changed” default alarm setting options
Document conventions
This section describes text formatting conventions and important notices formats.
Text formattingThe narrative-text formatting conventions that are used in this document are as follows:
bold text Identifies command namesIdentifies the names of user-manipulated GUI elementsIdentifies keywords and operandsIdentifies text to enter at the GUI or CLI
italic text Provides emphasisIdentifies variablesIdentifies paths and Internet addressesIdentifies document titles
code text Identifies CLI outputIdentifies syntax examples
For readability, command names in the narrative portions of this guide are presented in mixed lettercase: for example, switchShow. In actual examples, command lettercase is often all lowercase. Otherwise, this manual specifically notes those cases in which a command is case sensitive.
xviii Fabric Watch Administrator’s Guide53-1002153-01
What’s new in this document
Notes, cautions, and warningsThe following notices and statements are used in this manual. They are listed below in order of increasing severity of potential hazards.
NOTEA note provides a tip, guidance, or advice, emphasizes important information, or provides a reference to related information.
ATTENTIONAn Attention statement indicates potential damage to hardware or data.
CAUTION
A Caution statement alerts you to situations that can be potentially hazardous to you or cause damage to hardware, firmware, software, or data.
DANGER
A Danger statement indicates conditions or situations that can be potentially lethal or extremely hazardous to you. Safety labels are also attached directly to products to warn of these conditions or situations.
Key terms For definitions specific to Brocade and Fibre Channel, see the Brocade Glossary.
For definitions of SAN-specific terms, visit the Storage Networking Industry Association online dictionary at http://www.snia.org/education/dictionary.
Additional information
This section lists additional Brocade and industry-specific documentation that you might find helpful.
To get up-to-the-minute information, go to http://my.brocade.com to register at no cost for a user ID and password.
White papers, online demonstrations, and data sheets are available through the Brocade website at:
http://www.brocade.com/products-solutions/products/index.page
For additional Brocade documentation, visit the Brocade website:
http://www.brocade.com
Release notes are available on the MyBrocade website and are also bundled with the Fabric OS firmware.
Fabric Watch Administrator’s Guide xix53-1002153-01
What’s new in this document
Other industry resourcesFor additional resource information, visit the Technical Committee T11 website. This website provides interface standards for high-performance and mass storage applications for Fibre Channel, storage management, and other applications:
http://www.t11.org
For information about the Fibre Channel industry, visit the Fibre Channel Industry Association website:
http://www.fibrechannel.org
Getting technical help
Contact your switch support supplier for hardware, firmware, and software support, including product repairs and part ordering. To expedite your call, have the following information available:
1. General Information
• Switch model
• Switch operating system version
• Error numbers and messages received
• supportSave command output
• Detailed description of the problem, including the switch or fabric behavior immediately following the problem, and specific questions
• Description of any troubleshooting steps already performed and the results
• Serial console and Telnet session logs
• Syslog message logs
2. Switch Serial Number
The switch serial number and corresponding bar code are provided on the serial number label, as illustrated below:
The serial number label is located as follows:
• Brocade 300, 5100, 5300, 7800, 8000, VA-40FC, and Brocade Encryption Switch—On the switch ID pull-out tab located inside the chassis on the port side on the left
• Brocade DCX—On the bottom right on the port side of the chassis
• Brocade DCX-4S—On the bottom right on the port side of the chassis, directly above the cable management comb
3. World Wide Name (WWN)
Use the licenseIdShow command to display the WWN of the chassis.
*FT00X0054E9*
FT00X0054E9
xx Fabric Watch Administrator’s Guide53-1002153-01
What’s new in this document
If you cannot use the licenseIdShow command because the switch is inoperable, you can get the WWN from the same place as the serial number, except for the Brocade DCX. For the Brocade DCX, access the numbers on the WWN cards by removing the Brocade logo plate at the top of the nonport side of the chassis.
Document feedback
Quality is our first concern at Brocade and we have made every effort to ensure the accuracy and completeness of this document. However, if you find an error or an omission, or you think that a topic needs further development, we want to hear from you. Forward your feedback to:
Provide the title and version number of the document and as much detail as possible about your comment, including the topic heading and page number and your suggestions for improvement.
Fabric Watch Administrator’s Guide xxi53-1002153-01

What’s new in this document
xxii Fabric Watch Administrator’s Guide53-1002153-01
Fabric Watch Administrator’s Guide53-1002153-01
Chapter
1
Fabric WatchIn this chapter•Fabric health . . . . . . . . . . . . . . . . . . . . . . . . . . . . . . . . . . . . . . . . . . . . . . . . . . . 1
•Fabric Watch overview. . . . . . . . . . . . . . . . . . . . . . . . . . . . . . . . . . . . . . . . . . . . 2
•Role-based access control . . . . . . . . . . . . . . . . . . . . . . . . . . . . . . . . . . . . . . . . 2
•Fabric Watch licensing . . . . . . . . . . . . . . . . . . . . . . . . . . . . . . . . . . . . . . . . . . . 2
•Reasons to customize Fabric Watch settings . . . . . . . . . . . . . . . . . . . . . . . . . 3
•Class, area, and element hierarchy . . . . . . . . . . . . . . . . . . . . . . . . . . . . . . . . . 5
•Switch monitoring components . . . . . . . . . . . . . . . . . . . . . . . . . . . . . . . . . . . . 5
•Logical switch support . . . . . . . . . . . . . . . . . . . . . . . . . . . . . . . . . . . . . . . . . . . 8
•Logical switch support . . . . . . . . . . . . . . . . . . . . . . . . . . . . . . . . . . . . . . . . . . . 8
•Fabric Watch event settings . . . . . . . . . . . . . . . . . . . . . . . . . . . . . . . . . . . . . . . 9
•Fabric Watch notification types . . . . . . . . . . . . . . . . . . . . . . . . . . . . . . . . . . . 11
•Fabric Watch audit messages. . . . . . . . . . . . . . . . . . . . . . . . . . . . . . . . . . . . . 12
•Data values . . . . . . . . . . . . . . . . . . . . . . . . . . . . . . . . . . . . . . . . . . . . . . . . . . . 13
•Fabric Watch support in Access Gateway mode . . . . . . . . . . . . . . . . . . . . . . 13
Fabric healthFabric health refers to the capability of the fabric to route data. A healthy fabric enables effective data transmission between networked devices.
One of the more obvious criteria for fabric health is the condition of the network hardware. A switch or port failure can prevent data packets from reaching their destination. Network traffic can also influence fabric health.
If the number of packets routed through a port exceeds the port bandwidth, it causes network delays and packet loss. Receive (Rx) and Transmit (Tx) performance areas are used to monitor the bandwidth utilization to help keep traffic flowing to avoid congestion.
Because of the varied factors involved in determining fabric health, Fabric Watch can help you to detect, identify, and resolve fabric health issues by continuously monitoring possible issues and reporting any potential concerns. Fabric Watch automatically provides detailed reports on detected issues and helps you correct failures.
1
Fabric Watch overview1
Fabric Watch overview
Fabric Watch is an optional storage area network (SAN) health monitor that allows you to enable each switch to constantly monitor its SAN fabric for potential faults and automatically alerts you to problems long before they become costly failures.
Fabric Watch tracks a variety of SAN fabric elements and events. Monitoring fabric-wide events, ports, and environmental parameters enables early fault detection and isolation as well as performance measurement. You can configure fabric elements and alert thresholds on an individual-port basis and you can also easily integrate Fabric Watch with enterprise system management solutions.
Fabric Watch provides customizable monitoring thresholds. You can configure Fabric Watch to provide notification before problems arise, such as reporting when network traffic through a port is approaching the bandwidth limit. This information enables you to perform pre-emptive network maintenance, such as trunking or zoning, and avoid potential network failures.
Fabric Watch lets you define how often to measure each switch and fabric element and specify notification thresholds. Whenever fabric elements exceed these thresholds, Fabric Watch automatically provides notification using several methods, including e-mail messages, SNMP traps, and log entries.
Role-based access controlRole-Based Action Control (RBAC) defines the capabilities that a user account has based on the role the account has been assigned. For each role, there is a set of predefined permissions on the jobs and tasks that can be performed on a fabric and its associated fabric elements. Fabric OS v6.1.0 and later use RBAC to determine which commands a user can issue.
Each feature is associated with an RBAC role and you will need to know which role is allowed to run a command, make modifications to the switch, or view the output of the command. To determine which RBAC role you need to run a command, review the section “Role-Based Access Control (RBAC)” of the Fabric OS Administrator’s Guide.
Fabric Watch licensingFabric Watch is an optionally licensed feature of Fabric OS. Each switch within a fabric needs its own license, and that license is valid only for a particular version of the feature. If you want a newer version of the feature, you must purchase a new license.
Fabric OS includes basic switch and fabric support software, and support for optionally-licensed software that is enabled using license keys. Refer to the Fabric OS Administrator’s Guide for more information about licensing and how to obtain the Fabric Watch license key.
2 Fabric Watch Administrator’s Guide53-1002153-01
Reasons to customize Fabric Watch settings 1
Reasons to customize Fabric Watch settingsCustomization is recommended to achieve the following objectives:
• Selecting one or more event settings
• Selecting an appropriate message delivery method for critical and noncritical events
• Selecting appropriate thresholds and alarm levels relevant to each class element
• Defining the appropriate Time Base event triggering based on the class element traits
• Eliminating message delivery that has little or no practical value to the SAN administrator
• Consolidating multiple messages generated from a single event
Before you begin an implementation, make some decisions surrounding the major configuration tasks: monitoring and configuring thresholds, actions, events, time bases, and alerts. These tasks are discussed in the following sections.
MonitoringDo you want to monitor all class areas, or implement the monitoring in incremental stages? If you monitor class areas incrementally, you should configure Fabric Watch to monitor the classes in the following order:
1. Monitor Fabric class areas using the thConfig command.
Refer to Chapter 6, “Fabric, Security, SFP, and Performance Monitoring,” for details.
2. Monitor Port class areas using the portThConfig command.
Refer to Chapter 7, “Port Monitoring,” for details.
3. Monitor FRU class areas using the fwFruCfg command.
Refer to Chapter 8, “System Monitoring,” for details.
NOTEFor each class area, there are setting guidelines and recommendations for whether you should leave the setting at the default or change the settings. If a change is recommended, the reason for the change and the suggested settings are provided in each of the configuration chapters. The default settings are listed in these chapters as well.
Threshold and action configurationBefore you begin to configure thresholds, decide if you want to have different levels of alerts for E_ports, FOP_Ports, and FCU_Ports, and configure the ports individually. Always set up thresholds one fabric at a time and test the configuration before you apply the threshold configuration to more switches or fabrics.
NOTEYou cannot configure different thresholds for server and storage ports, because threshold configuration is an area-wide setting and cannot be configured on an element (port).
Fabric Watch Administrator’s Guide 353-1002153-01
Reasons to customize Fabric Watch settings1
Event behavior configurationYou must first use the fwSetToCustom command to switch from default to custom settings, and then use the advanced configuration options provided with the portThConfig, thConfig, and sysMonitor commands to configure event behavior, actions, and time bases at the port level.
Time base configurationThe time base specifies the time interval between two samples to be compared. The fwSetToCustom command allows you to switch from default to custom settings. Valid intervals are day, hour, or minute. See “Setting Fabric Watch custom and default values” on page 33 for more information.
Alert configurationWhen Fabric Watch is improperly configured, a large number of error messages can be sent over a short period of time, making it difficult to find those messages that are actually meaningful. If this happens, there are a few simple ways to improve the configuration.
When large numbers of unimportant messages are received, examining the source can identify those classes that need to be reconfigured. To reduce the number of unimportant messages, consider the following reconfiguration options:
• Recheck the threshold settings. If the current thresholds are not realistic for the class and area, messages may be sent frequently without need. For example, a high threshold for temperature monitoring set to less than room temperature is probably incorrectly configured.
• ese messages could cause other important messages to be missed.
• Examine the notification settings. If you are not interested in receiving messages under certain conditions, ensure that the notification setting for that event is set to zero.
Brocade recommends using either SNMP trap alerting to your system management console or event log entry in conjunction with syslog forwarding configured on your switches.
Post-processing of messagesAfter you have configured thresholds and alerts, determine to where the messages will be sent. Then, monitor the messages frequently and take the appropriate actions.
4 Fabric Watch Administrator’s Guide53-1002153-01
Class, area, and element hierarchy 1
Class, area, and element hierarchyFabric elements and events are organized in a hierarchy by class, area, and element. There is a class, area, and element associated with every monitored behavior. Classes are the highest level in the system, subdivided into one or more areas. Areas contain one or more elements.
An example of a very simple Class --> Area --> Element hierarchy follows.
Environment
--> Temperature
--> Fan
--> Power supply
--> Slot
For specific information about classes, areas, and elements, refer to Chapter 3, “Fabric Watch Threshold Components”.
Switch monitoring componentsFabric Watch software enables you to monitor the independent components that are listed in this section.
Fabric events monitoringThe Fabric class groups areas of potential problems arising between devices, such as zone changes, fabric segmentation, E_Port down, fabric reconfiguration, domain ID changes, and fabric logins. A Fabric-class alarm alerts you to problems or potential problems with interconnectivity. You can customize Fabric class and area parameters using the thConfig command.
For complete information about fabric monitoring, refer to “Fabric monitoring guidelines and default settings” on page 39.
Performance monitoringPerformance monitoring groups areas that track the source and destination of traffic. Use the Performance Monitor class thresholds and alarms to determine traffic load and flow and to reallocate resources appropriately.
You can customize Performance Monitor class and area parameters using the thConfig command. The fmConfig command Manages frame monitor configuration, replacing deprecated advanced performance monitoring commands. Use the fmConfig command to configure, install, and display frame monitors across port ranges on a switch. See the Fabric OS Command Reference Manual for details.
Fabric Watch Administrator’s Guide 553-1002153-01
Switch monitoring components1
The Performance Monitor class is divided into the following areas:
• EE (end-to-end) Performance Monitor - Monitors RX and TX performance between two devices.
• Filter Performance Monitor - Measures the number of frames transmitted through a port that match specific values in the first 64 bytes of the frame. Since the entire Fibre Channel frame header and many of upper protocol's header fall within the first 64 bytes of a frame, filter-based monitoring can measure different types of traffic transmitted through a port.
NOTEPerformance Monitoring is not supported on VE_Ports, EX_Ports, and VEX _Ports.
For complete information about performance monitoring, refer to “Performance monitoring guidelines and default settings” on page 47
Security monitoringThe Security class monitors different security violations on the switch and takes action based on the configured thresholds and their actions. You can customize Security class and area parameters using the thConfig command.
For complete information about security monitoring, refer to “Security monitoring guidelines and default settings” on page 42.
SFP monitoringThe SFP class groups areas that monitor the physical aspects of an SFP, such as voltage, current, RXP, TXP, and state changes in physical ports, E_Ports, FOP_Ports, and FCU_Ports. An SFP class alarm alerts you to an SFP fault. You can customize SFP class and area parameters using the thConfig command.
Use the thMonitor command to monitor the Brocade 10 Gbps and 16 Gbps SFP modules and 16 Gbps QSFPs. By default, the SFP and QSFP are disabled. See “16 Gbps and QSFP monitoring” on page 50 for more information.
NOTESFPs connected to any GbE ports are not monitored by Fabric Watch.
For complete information about SFP monitoring, refer to “SFP monitoring guidelines and default settings” on page 45.
Port monitoringPort monitoring monitors port statistics and takes action based on the configured thresholds and actions. You can configure thresholds per port type and apply the configuration to all ports of the specified type using the portThConfig command. Configurable ports include physical ports, E_Ports, optical F_Ports (FOP_Ports), copper F_Ports (FCU_Ports), and Virtual E_Ports (VE_Ports).
NOTEThe execution of the portThConfig command is subject to Virtual Fabric or Admin Domain restrictions that may be in place. Refer to the Fabric OS Command Reference Manual for more information and for details about the portThConfig command.
6 Fabric Watch Administrator’s Guide53-1002153-01
Switch monitoring components 1
If frame discard errors or any other configured areas exceed the currently effective threshold settings, the Fabric Watch daemon can take one or more of the following actions:
• Send an SNMP trap.
• Log a RASlog message.
• Send an E-mail alert.
• Fence the port, if port fencing is enabled (not applicable to E_Ports). Refer to “Port fencing” for more information.
For complete information about port monitoring, including configuration examples, port setting guidelines, and default settings, refer to “Port Monitoring” on page 57.
Port persistence
The data collected in port monitoring can vary a great deal over short time periods. Therefore, the port can become a source of frequent event messages (the data can exceed the threshold range and return to a value within the threshold range).
Fabric Watch uses port persistence for a port event that requires the transition of the port into a marginal status. Fabric Watch does not record any event until the event persists for a length of time equal to the port persistence time. If the port returns to normal boundaries before the port persistence time elapses, Fabric Watch does not record any event.
To set the port persistence time, refer to “Setting the port persistence time” on page 69.
Port fencing
A port that is consistently unstable can harm the responsiveness and stability of the entire fabric and diminish the ability of the management platform to control and monitor the switches within the fabric. Port fencing is a Fabric Watch enhancement that takes the ports offline if the user-defined thresholds are exceeded. Supported port types include physical ports, E_Ports, optical F_Ports (FOP_Ports), copper F_Ports (FCU_Ports), and Virtual E_Ports (VE_Ports).
NOTEPort fencing is not enabled by default. You must manually enable port fencing. Refer to “Port fencing configuration” on page 71 for instructions.
When a port that has exceeded its user-defined thresholds is fenced by software, the port is placed into the disabled state and held offline. After a port is disabled, user intervention is necessary for frame traffic to resume on the port.
Fabric Watch Administrator’s Guide 753-1002153-01
Logical switch support1
System resource monitoringSystem resource monitoring enables you to monitor your system’s RAM, flash, memory, and CPU. You can use the sysMonitor command to perform the following tasks:
• Configure thresholds for Fabric Watch event monitoring and reporting for the environment and resource classes. Environment thresholds enable temperature monitoring, and resource thresholds enable monitoring of flash memory.
• Configure memory or CPU usage parameters on the switch or display memory or CPU usage. Configuration options include setting usage thresholds which, if exceeded, trigger a set of specified Fabric Watch alerts. You can set up the system monitor to poll at certain intervals and specify the number of retries required before Fabric Watch takes action.
For complete information about system resource monitoring, including setting guidelines and default settings, refer to “System monitoring using the sysMonitor command” on page 80.
Switch policiesSwitch policies are a series of rules that define specific health states for the overall switch. Fabric OS interacts with Fabric Watch using these policies. Each rule defines the number of types of errors that transitions the overall switch state into a state that is not healthy. For example, you can specify a switch policy so that if a switch has two port failures, it is considered to be in a marginal state; if it has four failures, it is in a down state.
You can define these rules for a number of classes and field replaceable units, including ports, power supplies, and flash memory.
See “Switch status policy planning” on page 84 for information on configuring switch policies.
See Chapter 10, “Fabric Watch Reports,” for information on viewing the current switch policies using the Switch Status Policy report.
Logical switch supportFabric Watch can monitor the switch health on eight logical switches. You can configure thresholds and notifications for ports that belong to a particular logical switch. Each logical switch has its own Fabric Watch configuration and triggers notifications based on its local configuration.
Fabric Watch supports port movement from one logical switch to another. Whenever a port is moved, thresholds associated with the port are deleted from which the logical switch from which the port was moved, and created for the logical switch to where the port is moved.
A logical interswitch link (LISL) is the logical portion of the physical connection that joins base switches. You can enable or disable port thresholds and create thresholds for state changes on LISLs, but Fabric Watch does not support other threshold areas such as link loss or signal loss for LISLs as it does for normal E_Ports.
8 Fabric Watch Administrator’s Guide53-1002153-01
Threshold monitoring using SNMP tables 1
Threshold monitoring using SNMP tablesUnderstanding the components of SNMP makes it possible to use third-party tools to view, browse, and manipulate Brocade switch variables remotely. Every Brocade switch and director supports SNMP.
When an event occurs and its severity level is at or below the set value, the Event Trap traps (swFabricWatchTrap), are sent to configured trap recipients.
Once the switch status policy changes, Fabric Watch sends a connUnitStatusChange SNMP trap. Any Fabric Watch RASLOG is converted into an swEventTrap.
In Fabric OS v6.4.0 and later, SNMP traps are identified by their bit mask and can be read directly from the switch configuration.Refer to the Fabric OS Command Reference for information about the following:
• Understanding SNMP basics
• How to enable or disable the sending of traps from the various MIBs
• SNMP trap bit mask values
• Loading Brocade management information bases (MIBs)
• SW-MIB traps
MIB capability configuration parametersThe mibCapability option turns certain MIBs and associated SNMP traps on or off. If a specific MIB is disabled, the corresponding traps are also disabled. If any trap group is disabled, the corresponding individual traps are also disabled.
Refer to the SW-MIB Objects chapter of the Fabric OS MIB Reference Guide for detailed information about the following SNMP tables that can be used to manage thresholds:
• swFwClassAreaTable
• swFwThresholdTable
Fabric Watch event settingsFabric Watch uses two types of settings: factory default settings and user-defined custom settings.
• Factory default settings are automatically enabled. These settings vary depending on hardware platform, and cannot be modified.
• For some Fabric Watch parameters, you can create custom configurations to suit your unique environment.
The fwSetToCustom command allows you to switch from default to custom settings. The command assumes that a set of user-defined thresholds have been configured prior to executing the fwSetToCustom command. If no user-defined settings exist, this command reapplies the default values.
Fabric Watch Administrator’s Guide 953-1002153-01
Fabric Watch event settings1
Use the advanced configuration option provided with the portThConfig, thConfig, and sysMonitor commands to view and modify custom and default values for specified classes and areas in Fabric Watch. You can customize the information reported by Fabric Watch by configuring event behavior types, threshold values, time bases, and event settings. These area attributes are used to define and detect events in Fabric Watch.
NOTEEvent settings are non-persistent.
Triggered event behaviorYou can set your environment for automatic notification using triggered event behavior.
A triggered alarm generates the first warning when a threshold condition is reached and a second alarm when the threshold condition is cleared.
If you do not want notification during each sample period from the port hardware failure to the time of its repair, you can define the event behavior as triggered. Triggered is the default behavior type signal for all class areas.
For example, when a port fails, Fabric Watch sends you a notification of the failure. After you repair the port, Fabric Watch detects the repair. At this time, Fabric Watch determines that the fabric no longer meets the event criteria, and watches for the error again. The next time the port fails, it sends you another notification.
A triggered behavior type sends only one event notification when the fabric meets the criteria for the event.
For specific configuration procedures, refer to the following sections in this guide:
• “Setting Fabric Watch custom and default values” on page 33
• “thConfig command” on page 48
• “portThConfig command procedures” on page 61
• “System monitoring using the sysMonitor command” on page 80
For detailed information about all Fabric Watch commands, refer to the Fabric OS Command Reference Manual.
10 Fabric Watch Administrator’s Guide53-1002153-01
Fabric Watch notification types 1
Fabric Watch notification typesFabric Watch provides event notifications in several different formats to ensure that event details are accessible from all platforms and operating systems. In response to an event, Fabric Watch can record event data as any (or all) of the following alarm options.
E-mail alertAn e-mail alert sends information about a switch event to a specified e-mail address. An e-mail alert can send information about any error from any element, area, and class (only one e-mail recipient can be configured per class). The e-mail specifies the threshold and describes the event, much like an error message. You can configure multiple e-mail recipients per class using the fwMailCfg command. You must separate the e-mail addresss with a comma and include the complete e-mail address. For example, [email protected] is a valid email address; abc@12 is not.
For a recipient to receive the e-mail, you must configure one of the following settings:
• Use the dnsConfig command to configure DNS settings to connect the switch to a DNS server.
• In case a DNS server is not available, e-mails can be forwarded through a relay host. You can configure the relay host IP address using the fwMailCfg command.
Enabling e-mail alerts for the Changed threshold state in several areas can quickly result in a significant amount of e-mail. Fabric Watch discards e-mail alerts when more than 100 are generated within a minute, which minimizes memory use.
SNMP trapsIn environments where you have a high number of messages coming from a variety of switches, you might want to receive them in a single location and view them using a graphical user interface (GUI). In this type of scenario, the Simple Network Management Protocol (SNMP) notifications might be the most efficient notification method. You can avoid having to log in to each switch individually as you would have to do for error log notifications.
SNMP performs an operation called a trap that notifies a management station using SNMP when events occur. Log entries can also trigger SNMP traps if the SNMP agent is configured. When the SNMP agent is configured to a specific error message level, error messages at that level trigger SNMP traps.
An SNMP trap forwards the following information to an SNMP management station:
• Name of the element whose counter registered an event
• Class, area, and index number of the threshold that the counter crossed
• Event type
• Value of the counter that exceeded the threshold
• State of the element that triggered the alarm
• Source of the trap
NOTEThe SNMP trap stores event information but does not actively send alerts.
Fabric Watch Administrator’s Guide 1153-1002153-01
Fabric Watch audit messages1
You must configure the software to receive trap information from the network device. You must also configure the SNMP agent on the switch to send the trap to the management station. You can configure SNMP notifications using the snmpConfig command and you can configure notifications using Fabric Watch.
For information on configuring the SNMP agent using the snmpConfig command, see the Fabric OS Command Reference.
SNMP trap counters
• When a counter is in the “in-between” state, Fabric Watch sends an informational SNMP trap. See “In-between buffer values” on page 16 for an explanation of the concepts of “in-between” boundaries and above high, below high, above low, and below low thresholds.
• When a counter is above the high threshold or below the low threshold, Fabric Watch sends a warning SNMP trap except for the power supply area of the environment (ENV), CPU, and Memory classes:
- The severity of a Fabric Watch SNMP trap for the power supply area of the environment class will always be informational except when the counter value is below the low threshold. When the counter value of the power supply is below threshold, Fabric Watch sends a warning SNMP trap.
- The severity of a Fabric Watch SNMP trap for CPU and memory will always be informational.
See “Threshold values” on page 15 for a more thorough explanation of thresholds.
RASlog (switch event)Following an event, Fabric Watch adds an entry to the internal event log for an individual switch. RASlog stores event information but does not actively send alerts. Use the errShow command to view the RASlog.
Locked port logFollowing an event, the port log locks to retain detailed information about an event, preventing the information from being overwritten as the log becomes full. This notification audit stores event information but does not actively send alerts, which is done automatically when some thresholds are exceeded and an alert is triggered.
For more information about locking, unlocking, and clearing the port log, see the Fabric OS Command Reference.
Fabric Watch audit messagesFabric Watch events caused by configuration value changes are tagged as Audit messages. When managing SANs you may want to filter or audit certain classes of events to ensure that you can view and generate an audit log for what is happening on a switch, particularly for security-related event changes. These events include login failures, zone configuration changes, firmware downloads, and other configuration changes—in other words—critical changes that have a serious effect on the operation and security of the switch.
12 Fabric Watch Administrator’s Guide53-1002153-01
Data values 1
Important information related to event classes is also tracked and made available. For example, you can track changes from an external source by the user name, IP address, or type of management interface used to access the switch.
NOTEAudit messages are generated for port fencing configuration changes, whether port fencing is enabled or disabled.
You can set up an external host to receive Audit messages so you can easily monitor unexpected changes. For information on error messages generated by Fabric Watch, see the Fabric OS Message Reference. For information on configuring an Audit Log, see the Audit Log Configuration section of the Fabric OS Administrator’s Guide for more information.
Data valuesA data value represents a measured value or a state value:
• Measured value is the current, measurable value of a fabric or fabric element, such as environmental temperature.
• State value, which is the only qualitative data value, provides information on the overall state of a fabric component. Instead of numerical data, state values contain information on whether components are faulty, active, or in another state.
Fabric Watch compares counter values and measured values to a set of configurable limits to determine whether fabric monitoring has occurred and whether to notify you. You must set appropriate threshold boundaries to trigger an event.
State values are handled differently, as Fabric Watch monitors state values for certain states which you can select. When a state value transitions to one of the monitored states, an event is triggered.
Time bases specify the time interval between two samples to be compared. You can set the time base to day (samples are compared once a day), hour (samples are compared once an hour), minute (samples are compared every minute), or second (samples are compared every second). This configurable field affects the comparison of sensor-based data with user-defined threshold values.
See “Time bases” on page 17 for more information.
Fabric Watch support in Access Gateway modeBoth the Advanced Performance Monitoring (APM) license and the Fabric Watch license must be installed on the platform configured in Access Gateway (AG) mode to use the frame monitoring and end-to-end (EE) monitoring capabilities. The APM license provides the counters and the Fabric Watch license provides the monitoring and alert mechanisms for these counters. See “Setting the high threshold of the RX area of an EE monitor” on page 50 for configuration information.
The following classes are not supported in Access Gateway mode:
• Fabric
• Security
• E_Port (Port subclass)
• VE_Port (Port subclass)
Fabric Watch Administrator’s Guide 1353-1002153-01

Fabric Watch support in Access Gateway mode1
14 Fabric Watch Administrator’s Guide53-1002153-01
Fabric Watch Administrator’s Guide53-1002153-01
Chapter
2
Fabric Watch ThresholdsIn this chapter•Threshold values . . . . . . . . . . . . . . . . . . . . . . . . . . . . . . . . . . . . . . . . . . . . . . . 15
•Time bases. . . . . . . . . . . . . . . . . . . . . . . . . . . . . . . . . . . . . . . . . . . . . . . . . . . . 17
•Threshold triggers . . . . . . . . . . . . . . . . . . . . . . . . . . . . . . . . . . . . . . . . . . . . . . 18
•Fabric Watch alarm behavior . . . . . . . . . . . . . . . . . . . . . . . . . . . . . . . . . . . . . 19
Threshold valuesHigh and low threshold values are the values at which potential problems might occur. For example, in configuring a temperature threshold, you can select the temperatures at which a potential problem can occur because of overheating or freezing.
With Fabric Watch v6.4 and later, the concept of high and low thresholds have been expanded to include four threshold categories, listed below. There are two setting types (the threshold and the above and below trigger) for four configuration possibilities. A combination of these settings can cause the following actions to occur:
• Above high threshold—Fabric Watch takes this action when the current value is above the high threshold.
• Below high threshold—Fabric Watch takes this action when the current value is between the high and low threshold. This replaces the previous “in-between” action, which no longer exists.
• Above low threshold—This action is only applicable to port classes (physical port, FOP_Port, FCU_Port, and VE_Port). Fabric Watch takes this action when the current value crosses the low threshold towards the high threshold.
• Below low threshold—Fabric Watch takes this action when the current value is below the low threshold.
NOTEThe above low threshold action applies only to the portThConfig command. It does not apply to the thConfig and sysMonitor commands.
15
Threshold values2
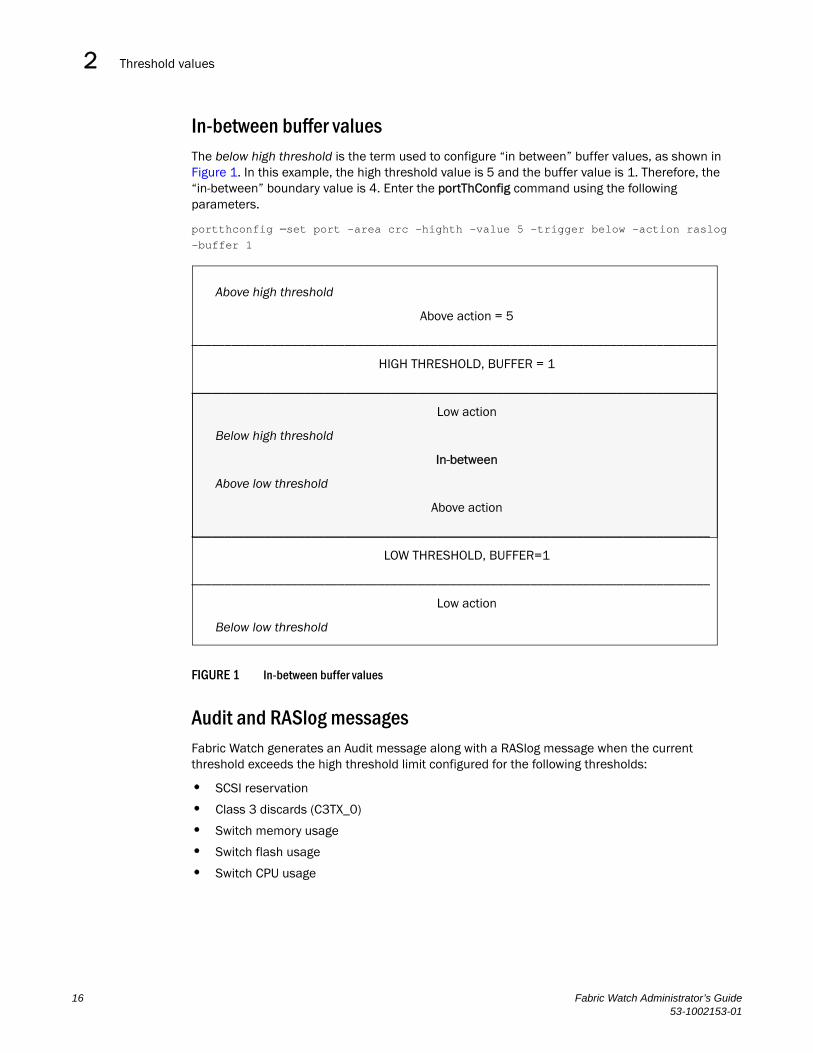
In-between buffer valuesThe below high threshold is the term used to configure “in between” buffer values, as shown in Figure 1. In this example, the high threshold value is 5 and the buffer value is 1. Therefore, the “in-between” boundary value is 4. Enter the portThConfig command using the following parameters.
portthconfig --set port -area crc -highth -value 5 -trigger below -action raslog -buffer 1
Above high threshold
Above action = 5
_______________________________________________________________________________
HIGH THRESHOLD, BUFFER = 1
_______________________________________________________________________________
Low action
Below high threshold
In-between
Above low threshold
Above action
______________________________________________________________________________
LOW THRESHOLD, BUFFER=1
______________________________________________________________________________
Low action
Below low threshold
FIGURE 1 In-between buffer values
Audit and RASlog messagesFabric Watch generates an Audit message along with a RASlog message when the current threshold exceeds the high threshold limit configured for the following thresholds:
• SCSI reservation
• Class 3 discards (C3TX_0)
• Switch memory usage
• Switch flash usage
• Switch CPU usage
16 Fabric Watch Administrator’s Guide53-1002153-01
Time bases 2
Time basesTime bases specify the time interval between two samples to be compared. You can set the time base to day (samples are compared once a day), hour (samples are compared once an hour), minute (samples are compared every minute), or second (samples are compared every second). This configurable field affects the comparison of sensor-based data with user-defined threshold values.
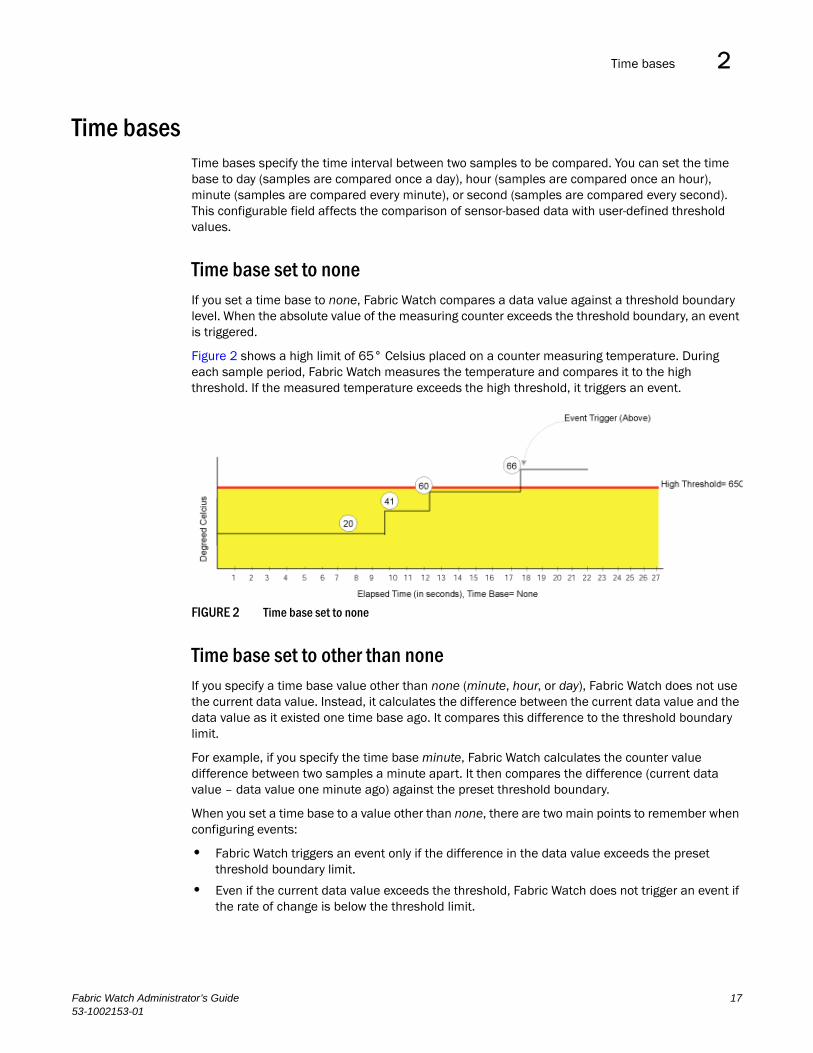
Time base set to noneIf you set a time base to none, Fabric Watch compares a data value against a threshold boundary level. When the absolute value of the measuring counter exceeds the threshold boundary, an event is triggered.
Figure 2 shows a high limit of 65° Celsius placed on a counter measuring temperature. During each sample period, Fabric Watch measures the temperature and compares it to the high threshold. If the measured temperature exceeds the high threshold, it triggers an event.
FIGURE 2 Time base set to none
Time base set to other than noneIf you specify a time base value other than none (minute, hour, or day), Fabric Watch does not use the current data value. Instead, it calculates the difference between the current data value and the data value as it existed one time base ago. It compares this difference to the threshold boundary limit.
For example, if you specify the time base minute, Fabric Watch calculates the counter value difference between two samples a minute apart. It then compares the difference (current data value – data value one minute ago) against the preset threshold boundary.
When you set a time base to a value other than none, there are two main points to remember when configuring events:
• Fabric Watch triggers an event only if the difference in the data value exceeds the preset threshold boundary limit.
• Even if the current data value exceeds the threshold, Fabric Watch does not trigger an event if the rate of change is below the threshold limit.
Fabric Watch Administrator’s Guide 1753-1002153-01
Threshold triggers2
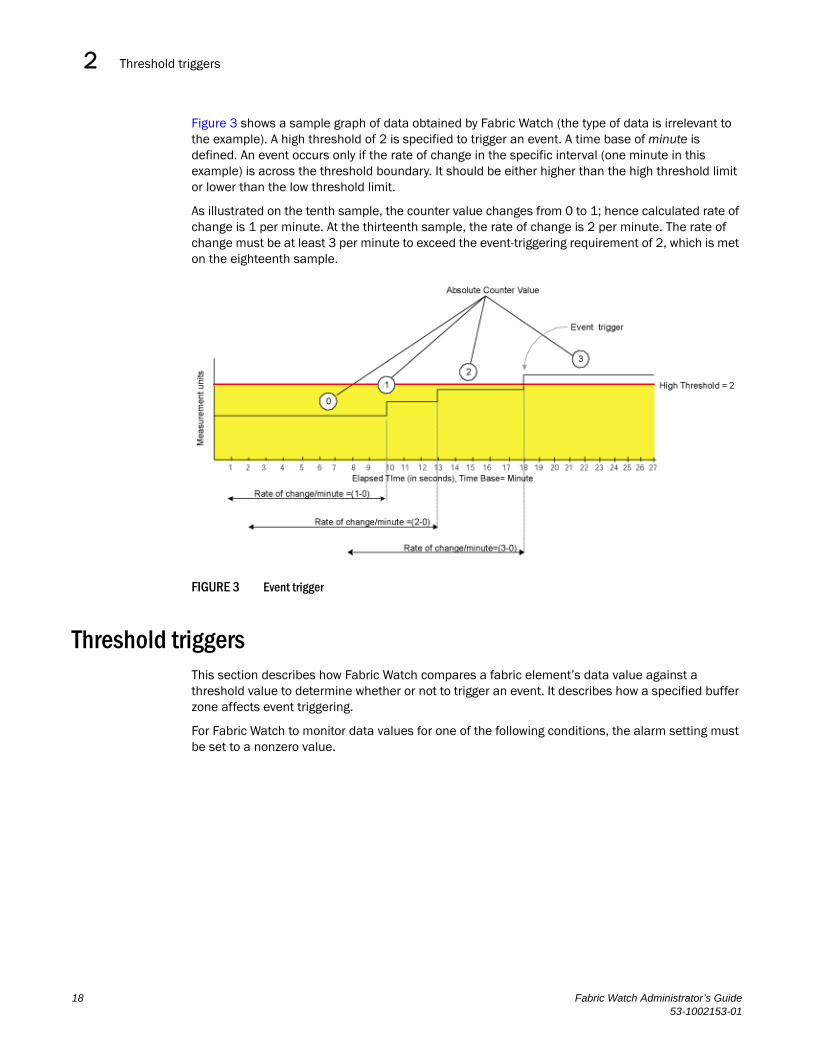
Figure 3 shows a sample graph of data obtained by Fabric Watch (the type of data is irrelevant to the example). A high threshold of 2 is specified to trigger an event. A time base of minute is defined. An event occurs only if the rate of change in the specific interval (one minute in this example) is across the threshold boundary. It should be either higher than the high threshold limit or lower than the low threshold limit.
As illustrated on the tenth sample, the counter value changes from 0 to 1; hence calculated rate of change is 1 per minute. At the thirteenth sample, the rate of change is 2 per minute. The rate of change must be at least 3 per minute to exceed the event-triggering requirement of 2, which is met on the eighteenth sample.
FIGURE 3 Event trigger
Threshold triggersThis section describes how Fabric Watch compares a fabric element’s data value against a threshold value to determine whether or not to trigger an event. It describes how a specified buffer zone affects event triggering.
For Fabric Watch to monitor data values for one of the following conditions, the alarm setting must be set to a nonzero value.
18 Fabric Watch Administrator’s Guide53-1002153-01
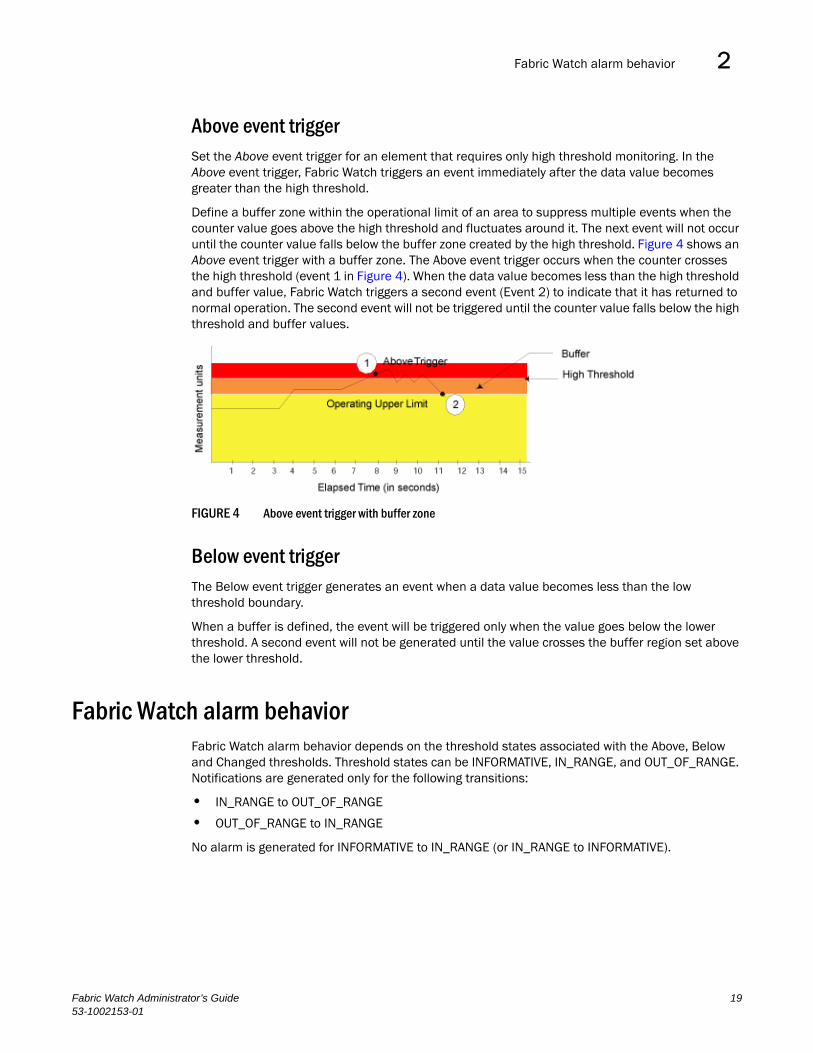
Fabric Watch alarm behavior 2
Above event triggerSet the Above event trigger for an element that requires only high threshold monitoring. In the Above event trigger, Fabric Watch triggers an event immediately after the data value becomes greater than the high threshold.
Define a buffer zone within the operational limit of an area to suppress multiple events when the counter value goes above the high threshold and fluctuates around it. The next event will not occur until the counter value falls below the buffer zone created by the high threshold. Figure 4 shows an Above event trigger with a buffer zone. The Above event trigger occurs when the counter crosses the high threshold (event 1 in Figure 4). When the data value becomes less than the high threshold and buffer value, Fabric Watch triggers a second event (Event 2) to indicate that it has returned to normal operation. The second event will not be triggered until the counter value falls below the high threshold and buffer values.
FIGURE 4 Above event trigger with buffer zone
Below event triggerThe Below event trigger generates an event when a data value becomes less than the low threshold boundary.
When a buffer is defined, the event will be triggered only when the value goes below the lower threshold. A second event will not be generated until the value crosses the buffer region set above the lower threshold.
Fabric Watch alarm behaviorFabric Watch alarm behavior depends on the threshold states associated with the Above, Below and Changed thresholds. Threshold states can be INFORMATIVE, IN_RANGE, and OUT_OF_RANGE. Notifications are generated only for the following transitions:
• IN_RANGE to OUT_OF_RANGE
• OUT_OF_RANGE to IN_RANGE
No alarm is generated for INFORMATIVE to IN_RANGE (or IN_RANGE to INFORMATIVE).
Fabric Watch Administrator’s Guide 1953-1002153-01

Fabric Watch alarm behavior2
20 Fabric Watch Administrator’s Guide53-1002153-01
Fabric Watch Administrator’s Guide53-1002153-01
Chapter
3
Fabric Watch Threshold ComponentsIn this chapter•Fabric Watch classes, areas, and elements . . . . . . . . . . . . . . . . . . . . . . . . . 21
Fabric Watch classes, areas, and elementsFabric Watch uses a hierarchical organization to track the network device information it monitors. There is a class, area, and element associated with every monitored behavior. Classes are the highest level in the system, subdivided into one or more areas. Areas contain one or more elements. The following sections explain this hierarchy and its application within Fabric Watch.
ClassesClasses are wide groupings of similar fabric devices or fabric data. Table 1 on page 22 describes the classes into which Fabric Watch groups all switch and fabric elements.
In some cases, classes are divided into subclasses. This additional level in the hierarchy increases the flexibility of setting monitoring thresholds. You can use subclasses to add additional event monitoring to fabric objects that meet the requirements of a subclass.
For example, ports connected to another switch can be monitored using both the Port class and E_Port subclass. You can configure general port monitoring using the Port class and monitoring specific to a type of port using the E_Port class. Ports connected to another switch can trigger events based on either of these configurations. Ports that are not connected to another switch are not affected by the additional monitoring configured into the E_Port class.
Class areasWhile classes represent large groupings of information, areas represent the information that Product Name monitors. For example, switch temperature, one of the values tracked by Fabric Watch, is an area within the class Environment.
For detailed information about how to configure areas, including recommended threshold and action settings for the classes listed in Table 1, refer to one of the following chapters:
• Chapter 6, “Fabric, Security, SFP, and Performance Monitoring”
Fabric class, Security class, SFP class, and Performance class areas and actions are configured using the thConfig command.
• Chapter 7, “Port Monitoring”
The physical port and its subclass areas and actions are configured using the portThConfig command.
21
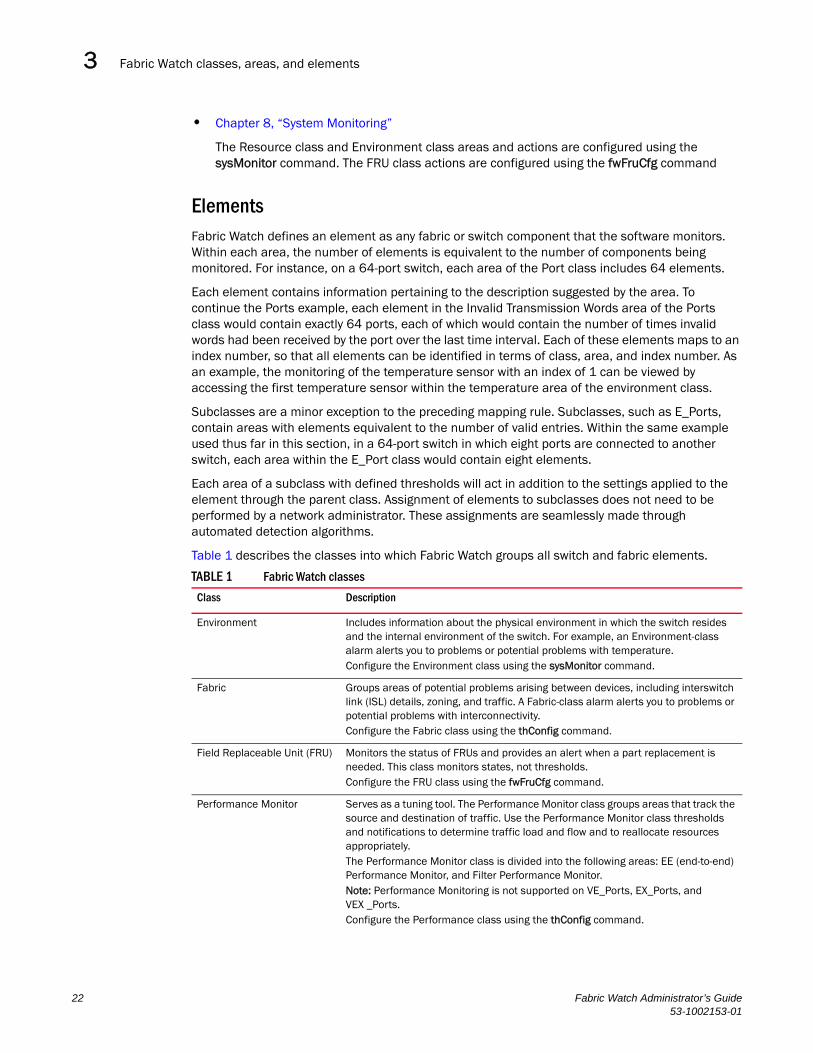
Fabric Watch classes, areas, and elements3
• Chapter 8, “System Monitoring”
The Resource class and Environment class areas and actions are configured using the sysMonitor command. The FRU class actions are configured using the fwFruCfg command
ElementsFabric Watch defines an element as any fabric or switch component that the software monitors. Within each area, the number of elements is equivalent to the number of components being monitored. For instance, on a 64-port switch, each area of the Port class includes 64 elements.
Each element contains information pertaining to the description suggested by the area. To continue the Ports example, each element in the Invalid Transmission Words area of the Ports class would contain exactly 64 ports, each of which would contain the number of times invalid words had been received by the port over the last time interval. Each of these elements maps to an index number, so that all elements can be identified in terms of class, area, and index number. As an example, the monitoring of the temperature sensor with an index of 1 can be viewed by accessing the first temperature sensor within the temperature area of the environment class.
Subclasses are a minor exception to the preceding mapping rule. Subclasses, such as E_Ports, contain areas with elements equivalent to the number of valid entries. Within the same example used thus far in this section, in a 64-port switch in which eight ports are connected to another switch, each area within the E_Port class would contain eight elements.
Each area of a subclass with defined thresholds will act in addition to the settings applied to the element through the parent class. Assignment of elements to subclasses does not need to be performed by a network administrator. These assignments are seamlessly made through automated detection algorithms.
Table 1 describes the classes into which Fabric Watch groups all switch and fabric elements.
TABLE 1 Fabric Watch classes
Class Description
Environment Includes information about the physical environment in which the switch resides and the internal environment of the switch. For example, an Environment-class alarm alerts you to problems or potential problems with temperature.Configure the Environment class using the sysMonitor command.
Fabric Groups areas of potential problems arising between devices, including interswitch link (ISL) details, zoning, and traffic. A Fabric-class alarm alerts you to problems or potential problems with interconnectivity.Configure the Fabric class using the thConfig command.
Field Replaceable Unit (FRU) Monitors the status of FRUs and provides an alert when a part replacement is needed. This class monitors states, not thresholds.Configure the FRU class using the fwFruCfg command.
Performance Monitor Serves as a tuning tool. The Performance Monitor class groups areas that track the source and destination of traffic. Use the Performance Monitor class thresholds and notifications to determine traffic load and flow and to reallocate resources appropriately.The Performance Monitor class is divided into the following areas: EE (end-to-end) Performance Monitor, and Filter Performance Monitor.Note: Performance Monitoring is not supported on VE_Ports, EX_Ports, and VEX _Ports.Configure the Performance class using the thConfig command.
22 Fabric Watch Administrator’s Guide53-1002153-01
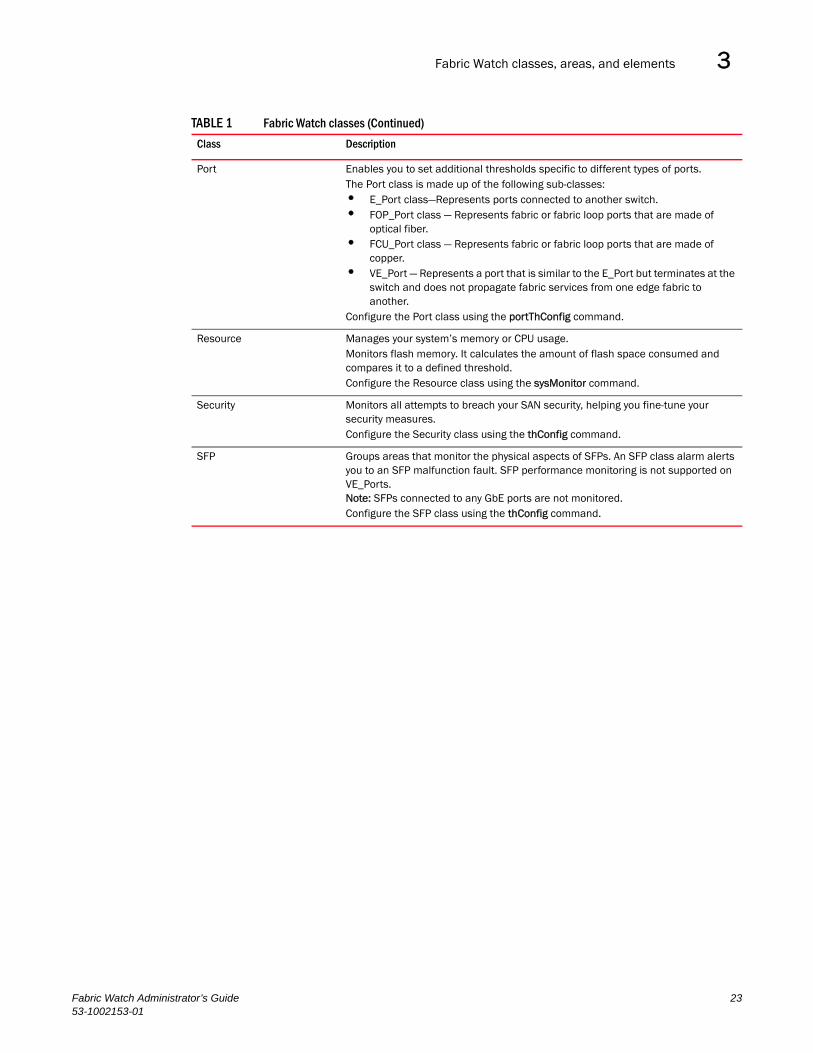
Fabric Watch classes, areas, and elements 3
Port Enables you to set additional thresholds specific to different types of ports.The Port class is made up of the following sub-classes: • E_Port class—Represents ports connected to another switch.• FOP_Port class — Represents fabric or fabric loop ports that are made of
optical fiber.• FCU_Port class — Represents fabric or fabric loop ports that are made of
copper.• VE_Port — Represents a port that is similar to the E_Port but terminates at the
switch and does not propagate fabric services from one edge fabric to another.
Configure the Port class using the portThConfig command.
Resource Manages your system’s memory or CPU usage. Monitors flash memory. It calculates the amount of flash space consumed and compares it to a defined threshold.Configure the Resource class using the sysMonitor command.
Security Monitors all attempts to breach your SAN security, helping you fine-tune your security measures.Configure the Security class using the thConfig command.
SFP Groups areas that monitor the physical aspects of SFPs. An SFP class alarm alerts you to an SFP malfunction fault. SFP performance monitoring is not supported on VE_Ports.Note: SFPs connected to any GbE ports are not monitored.Configure the SFP class using the thConfig command.
TABLE 1 Fabric Watch classes (Continued)
Class Description
Fabric Watch Administrator’s Guide 2353-1002153-01

Fabric Watch classes, areas, and elements3
24 Fabric Watch Administrator’s Guide53-1002153-01
Fabric Watch Administrator’s Guide53-1002153-01
Chapter
4
Fabric Watch ActivationIn this chapter•Interfaces for activating Fabric Watch . . . . . . . . . . . . . . . . . . . . . . . . . . . . . . 25
Interfaces for activating Fabric Watch This section provides a brief overview of the available user interfaces for activating Fabric Watch. Further details about Fabric Watch operations for each interface are provided later in this guide.
• Telnet session—Provides a command prompt where you can run Fabric OS commands to configure your switch monitoring settings. See “Activating Fabric Watch using a Telnet session” for instructions on how to activate Fabric Watch using a Telnet session.
• SNMP—Provides a receiver dedicated to monitoring the data center infrastructure; Brocade switches and directors enable monitoring of specific incidents and trigger an SNMP alert based on a user-defined threshold sending the alert to the dedicated SNMP trap receiver.
Configuring SNMP threshold alerts for Fabric OS switches requires using Web Tools to set up SNMP on the Fabric OS switch. See “Activating Fabric Watch using SNMP” on page 26 for instructions on how to set up SNMP.
• Web Tools—Provides a graphical user interface that can be launched from an Internet browser, which allows you to launch a Fabric Watch window to configure switch monitoring settings. Using Web Tools, you can configure thresholds, alarms, and e-mail notifications. See Chapter 9, “Fabric Watch Configuration Using Web Tools” for instructions on how to configure Fabric Watch using the Web Tools GUI.
Activating Fabric Watch using a Telnet session1. Connect to the switch and log in as admin.
2. Enter the following command, where switch represents the name or IP address of the switch:
telnet switch
After you enter this command, respond to the prompts for a username and password.
3. Enter the licenseShow command to determine if the Fabric Watch license is installed.
switch:admin> licenseshowedzbzQStu4ecS: Fabric Watch license Performance Monitor license
Trunking licenseFull Ports on Demand license - additional 16 port upgrade license
25
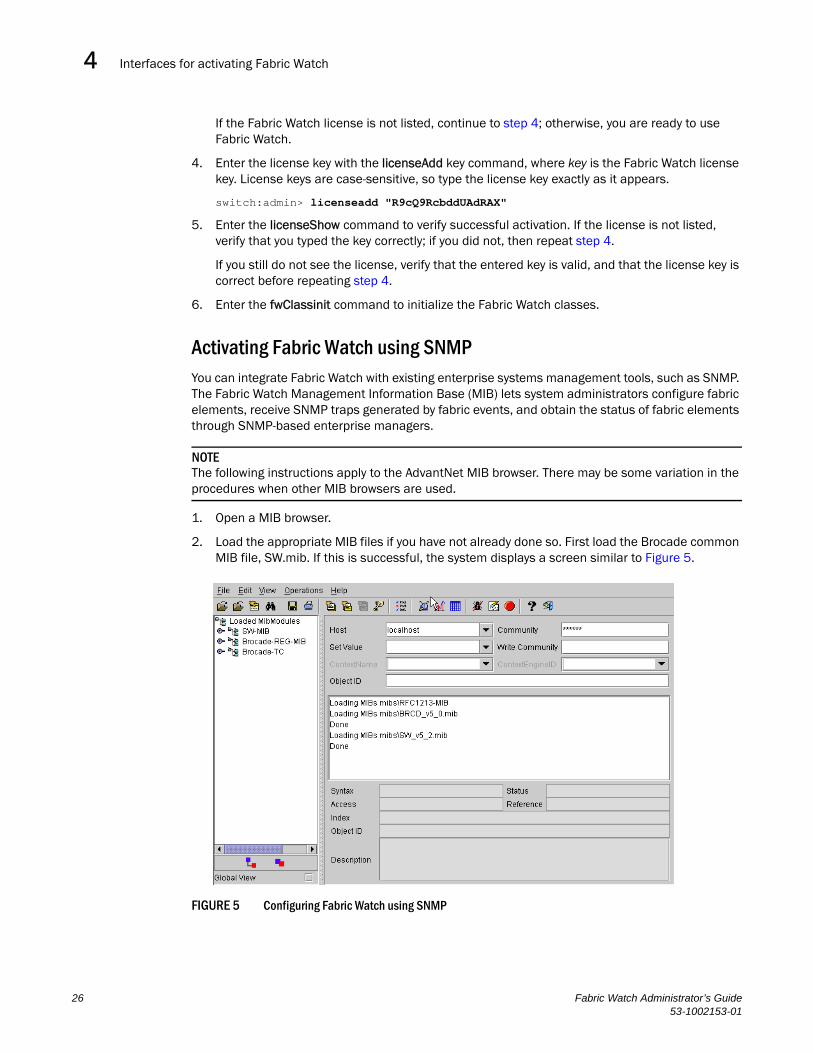
Interfaces for activating Fabric Watch4
If the Fabric Watch license is not listed, continue to step 4; otherwise, you are ready to use Fabric Watch.
4. Enter the license key with the licenseAdd key command, where key is the Fabric Watch license key. License keys are case-sensitive, so type the license key exactly as it appears.
switch:admin> licenseadd "R9cQ9RcbddUAdRAX"
5. Enter the licenseShow command to verify successful activation. If the license is not listed, verify that you typed the key correctly; if you did not, then repeat step 4.
If you still do not see the license, verify that the entered key is valid, and that the license key is correct before repeating step 4.
6. Enter the fwClassinit command to initialize the Fabric Watch classes.
Activating Fabric Watch using SNMPYou can integrate Fabric Watch with existing enterprise systems management tools, such as SNMP. The Fabric Watch Management Information Base (MIB) lets system administrators configure fabric elements, receive SNMP traps generated by fabric events, and obtain the status of fabric elements through SNMP-based enterprise managers.
NOTEThe following instructions apply to the AdvantNet MIB browser. There may be some variation in the procedures when other MIB browsers are used.
1. Open a MIB browser.
2. Load the appropriate MIB files if you have not already done so. First load the Brocade common MIB file, SW.mib. If this is successful, the system displays a screen similar to Figure 5.
FIGURE 5 Configuring Fabric Watch using SNMP
26 Fabric Watch Administrator’s Guide53-1002153-01
Interfaces for activating Fabric Watch 4
In Figure 5, the MIB browser populated the left side of the screen with a MIB tree that you can navigate.
3. Open Web Tools and select Tasks > Manage > Switch Admin.
4. Click Show Advanced Mode.
5. On the SNMP tab, enter the IP address of the trap receiver and the severity level, and click Apply.
NOTEThe severity level must be informational (4) in order to forward threshold alerts.
6. Start a Telnet session, and enter the snmpConfig --set mibcapability command at the prompt to set the SNMP MIB capability.
switch:admin> snmpConfig --set mibcapabilityThe SNMP Mib/Trap Capability has been set to supportFE-MIBSW-MIBFA-MIBSW-TRAPFA-TRAPFA-MIB (yes, y, no, n): [yes] FICON-MIB (yes, y, no, n): [no] HA-MIB (yes, y, no, n): [no] SW-TRAP (yes, y, no, n): [yes] yes swFCPortScn (yes, y, no, n): [no] swEventTrap (yes, y, no, n): [no] swFabricWatchTrap (yes, y, no, n): [no] yes swTrackChangesTrap (yes, y, no, n): [no] FA-TRAP (yes, y, no, n): [yes] connUnitStatusChange (yes, y, no, n): [no] connUnitEventTrap (yes, y, no, n): [no] connUnitSensorStatusChange (yes, y, no, n): [no] connUnitPortStatusChange (yes, y, no, n): [no] SW-EXTTRAP (yes, y, no, n): [no] switch:admin>
7. Enter the snmpConfig command to configure the SNMP management host IP address.
switch:admin> snmpConfig
Customizing MIB-II system variables ...
At each prompt, do one of the following: o <Return> to accept current value, o enter the appropriate new value, o <Control-D> to skip the rest of configuration, or o <Control-C> to cancel any change.
To correct any input mistake:<Backspace> erases the previous character,<Control-U> erases the whole line,sysDescr: [Fibre Channel Switch.] sysLocation: [End User Premise.] sysContact: [Field Support.] authTrapsEnabled (true, t, false, f): [false]
SNMP community and trap recipient configuration:Community (rw): [Secret C0de]
Fabric Watch Administrator’s Guide 2753-1002153-01
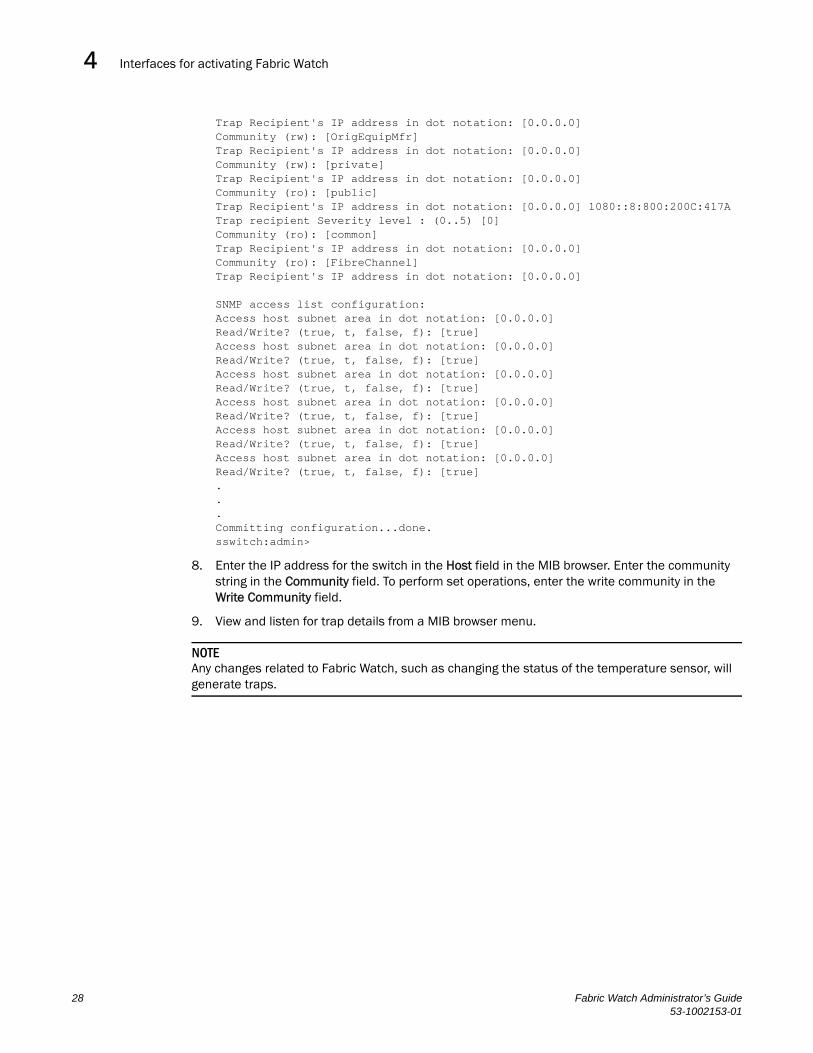
Interfaces for activating Fabric Watch4
Trap Recipient's IP address in dot notation: [0.0.0.0] Community (rw): [OrigEquipMfr] Trap Recipient's IP address in dot notation: [0.0.0.0] Community (rw): [private] Trap Recipient's IP address in dot notation: [0.0.0.0] Community (ro): [public] Trap Recipient's IP address in dot notation: [0.0.0.0] 1080::8:800:200C:417ATrap recipient Severity level : (0..5) [0] Community (ro): [common] Trap Recipient's IP address in dot notation: [0.0.0.0] Community (ro): [FibreChannel] Trap Recipient's IP address in dot notation: [0.0.0.0]
SNMP access list configuration:Access host subnet area in dot notation: [0.0.0.0] Read/Write? (true, t, false, f): [true] Access host subnet area in dot notation: [0.0.0.0] Read/Write? (true, t, false, f): [true] Access host subnet area in dot notation: [0.0.0.0] Read/Write? (true, t, false, f): [true] Access host subnet area in dot notation: [0.0.0.0] Read/Write? (true, t, false, f): [true] Access host subnet area in dot notation: [0.0.0.0] Read/Write? (true, t, false, f): [true] Access host subnet area in dot notation: [0.0.0.0] Read/Write? (true, t, false, f): [true] ...Committing configuration...done.sswitch:admin>
8. Enter the IP address for the switch in the Host field in the MIB browser. Enter the community string in the Community field. To perform set operations, enter the write community in the Write Community field.
9. View and listen for trap details from a MIB browser menu.
NOTEAny changes related to Fabric Watch, such as changing the status of the temperature sensor, will generate traps.
28 Fabric Watch Administrator’s Guide53-1002153-01
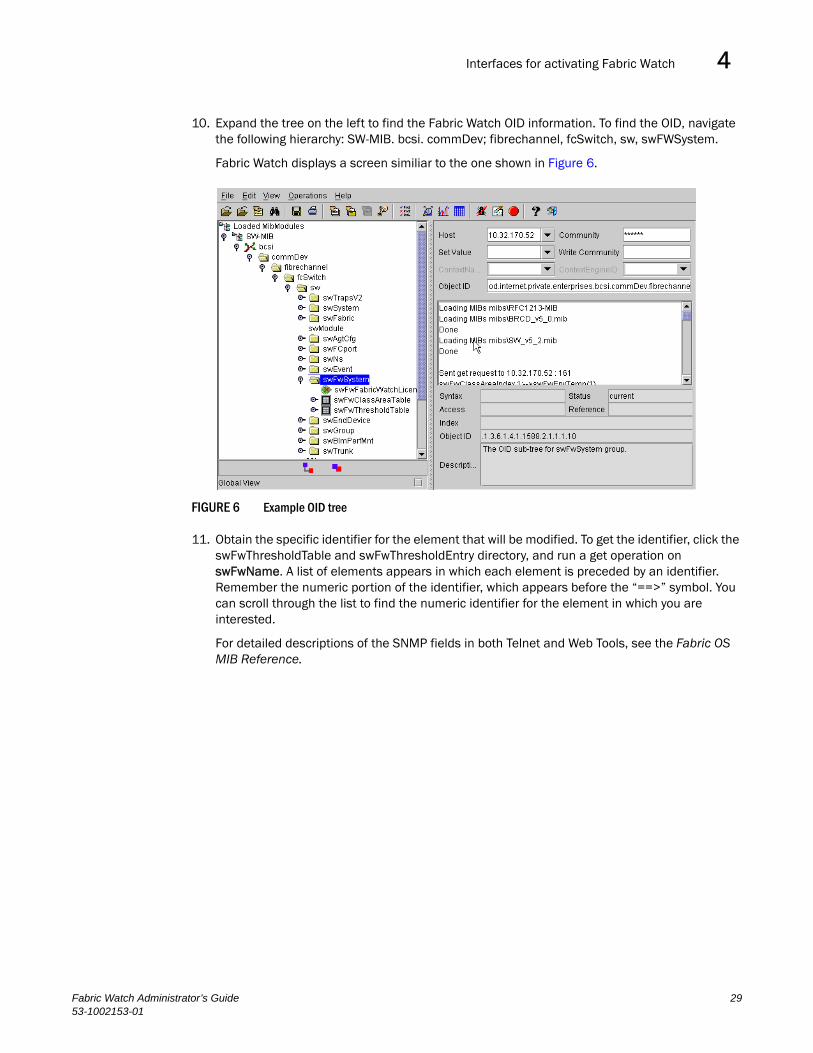
Interfaces for activating Fabric Watch 4
10. Expand the tree on the left to find the Fabric Watch OID information. To find the OID, navigate the following hierarchy: SW-MIB. bcsi. commDev; fibrechannel, fcSwitch, sw, swFWSystem.
Fabric Watch displays a screen similiar to the one shown in Figure 6.
FIGURE 6 Example OID tree
11. Obtain the specific identifier for the element that will be modified. To get the identifier, click the swFwThresholdTable and swFwThresholdEntry directory, and run a get operation on swFwName. A list of elements appears in which each element is preceded by an identifier. Remember the numeric portion of the identifier, which appears before the “==>” symbol. You can scroll through the list to find the numeric identifier for the element in which you are interested.
For detailed descriptions of the SNMP fields in both Telnet and Web Tools, see the Fabric OS MIB Reference.
Fabric Watch Administrator’s Guide 2953-1002153-01
Interfaces for activating Fabric Watch4
Activating Fabric Watch using Web ToolsYou can open Web Tools on any workstation with a compatible Web browser installed.
1. Open the Web browser and type the IP address of the device in the Address field:
http://10.77.77.77 or https://10.77.77.77
2. Press Enter.
A browser window opens to open Web Tools. A Login dialog box opens.
3. Enter your username and password.
4. Select a switch from the Fabric Tree and log in if necessary.
5. Select Tasks > Manage > Fabric Watch.
For information about how to configure Fabric Watch using Web Tools, refer to Chapter 9, “Fabric Watch Configuration Using Web Tools”.
30 Fabric Watch Administrator’s Guide53-1002153-01
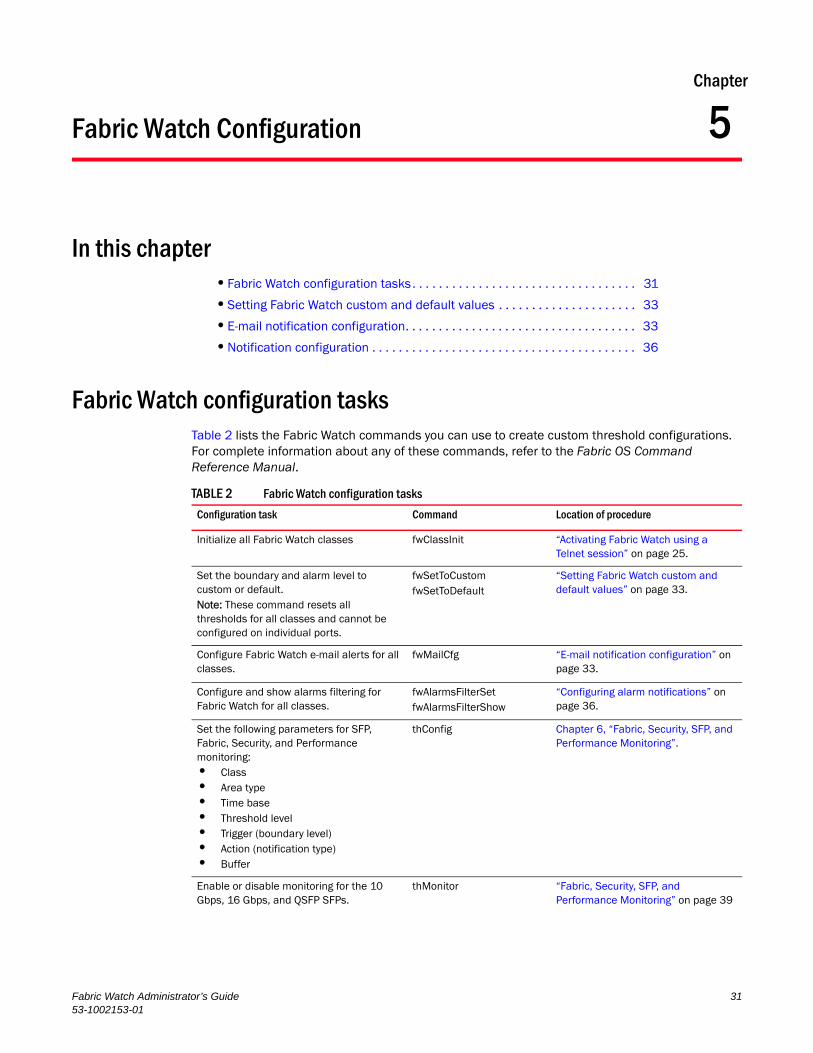
Fabric Watch Administrator’s Guide53-1002153-01
Chapter
5
Fabric Watch ConfigurationIn this chapter•Fabric Watch configuration tasks . . . . . . . . . . . . . . . . . . . . . . . . . . . . . . . . . . 31
•Setting Fabric Watch custom and default values . . . . . . . . . . . . . . . . . . . . . 33
•E-mail notification configuration. . . . . . . . . . . . . . . . . . . . . . . . . . . . . . . . . . . 33
•Notification configuration . . . . . . . . . . . . . . . . . . . . . . . . . . . . . . . . . . . . . . . . 36
Fabric Watch configuration tasksTable 2 lists the Fabric Watch commands you can use to create custom threshold configurations. For complete information about any of these commands, refer to the Fabric OS Command Reference Manual.
TABLE 2 Fabric Watch configuration tasks
Configuration task Command Location of procedure
Initialize all Fabric Watch classes fwClassInit “Activating Fabric Watch using a Telnet session” on page 25.
Set the boundary and alarm level to custom or default.Note: These command resets all thresholds for all classes and cannot be configured on individual ports.
fwSetToCustomfwSetToDefault
“Setting Fabric Watch custom and default values” on page 33.
Configure Fabric Watch e-mail alerts for all classes.
fwMailCfg “E-mail notification configuration” on page 33.
Configure and show alarms filtering for Fabric Watch for all classes.
fwAlarmsFilterSet fwAlarmsFilterShow
“Configuring alarm notifications” on page 36.
Set the following parameters for SFP, Fabric, Security, and Performance monitoring: • Class • Area type • Time base• Threshold level • Trigger (boundary level)• Action (notification type)• Buffer
thConfig Chapter 6, “Fabric, Security, SFP, and Performance Monitoring”.
Enable or disable monitoring for the 10 Gbps, 16 Gbps, and QSFP SFPs.
thMonitor “Fabric, Security, SFP, and Performance Monitoring” on page 39
31
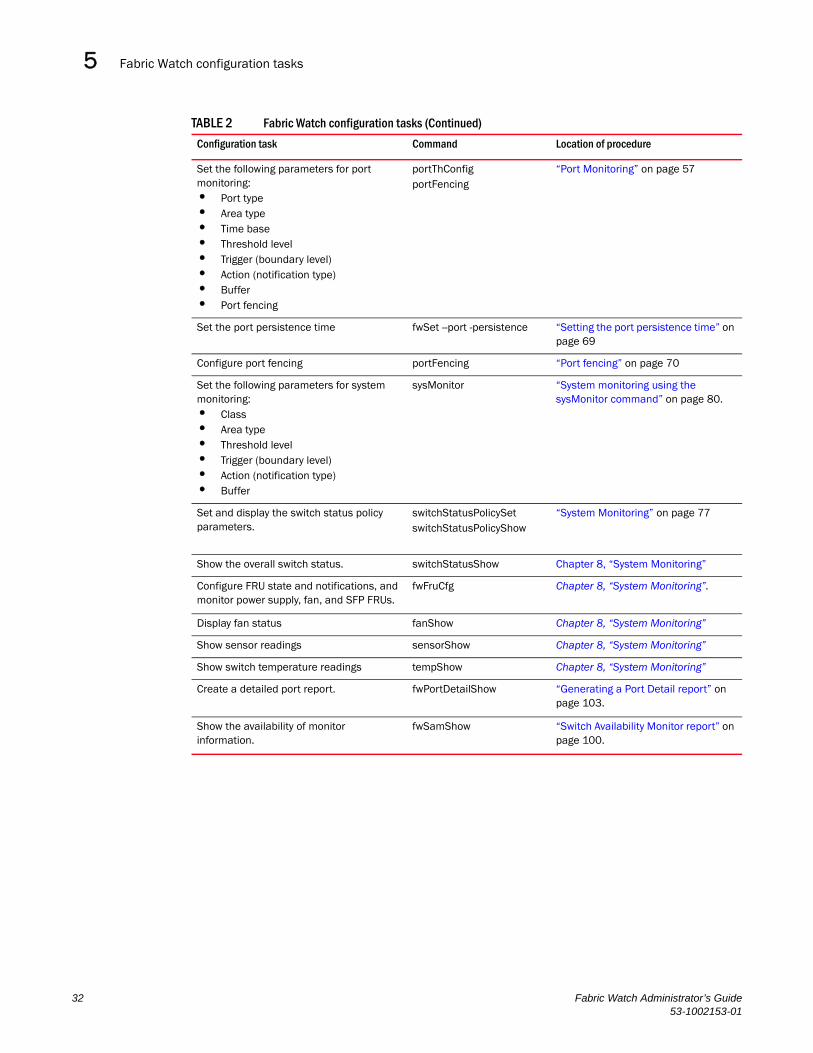
Fabric Watch configuration tasks5
Set the following parameters for port monitoring:• Port type • Area type• Time base• Threshold level• Trigger (boundary level)• Action (notification type)• Buffer• Port fencing
portThConfigportFencing
“Port Monitoring” on page 57
Set the port persistence time fwSet --port -persistence “Setting the port persistence time” on page 69
Configure port fencing portFencing “Port fencing” on page 70
Set the following parameters for system monitoring:• Class • Area type• Threshold level • Trigger (boundary level)• Action (notification type)• Buffer
sysMonitor “System monitoring using the sysMonitor command” on page 80.
Set and display the switch status policy parameters.
switchStatusPolicySetswitchStatusPolicyShow
“System Monitoring” on page 77
Show the overall switch status. switchStatusShow Chapter 8, “System Monitoring”
Configure FRU state and notifications, and monitor power supply, fan, and SFP FRUs.
fwFruCfg Chapter 8, “System Monitoring”.
Display fan status fanShow Chapter 8, “System Monitoring”
Show sensor readings sensorShow Chapter 8, “System Monitoring”
Show switch temperature readings tempShow Chapter 8, “System Monitoring”
Create a detailed port report. fwPortDetailShow “Generating a Port Detail report” on page 103.
Show the availability of monitor information.
fwSamShow “Switch Availability Monitor report” on page 100.
TABLE 2 Fabric Watch configuration tasks (Continued)
Configuration task Command Location of procedure
32 Fabric Watch Administrator’s Guide53-1002153-01
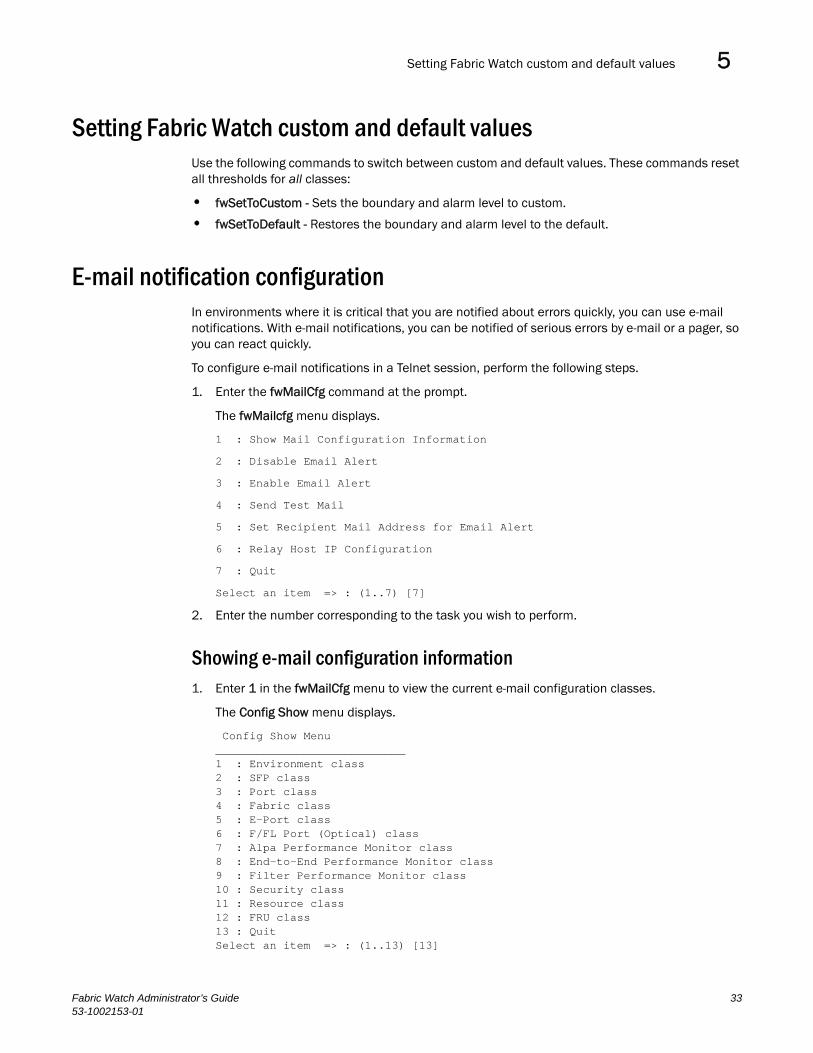
Setting Fabric Watch custom and default values 5
Setting Fabric Watch custom and default valuesUse the following commands to switch between custom and default values. These commands reset all thresholds for all classes:
• fwSetToCustom - Sets the boundary and alarm level to custom.
• fwSetToDefault - Restores the boundary and alarm level to the default.
E-mail notification configurationIn environments where it is critical that you are notified about errors quickly, you can use e-mail notifications. With e-mail notifications, you can be notified of serious errors by e-mail or a pager, so you can react quickly.
To configure e-mail notifications in a Telnet session, perform the following steps.
1. Enter the fwMailCfg command at the prompt.
The fwMailcfg menu displays.
1 : Show Mail Configuration Information
2 : Disable Email Alert
3 : Enable Email Alert
4 : Send Test Mail
5 : Set Recipient Mail Address for Email Alert
6 : Relay Host IP Configuration
7 : Quit
Select an item => : (1..7) [7]
2. Enter the number corresponding to the task you wish to perform.
Showing e-mail configuration information1. Enter 1 in the fwMailCfg menu to view the current e-mail configuration classes.
The Config Show menu displays.
Config Show Menu____________________________1 : Environment class2 : SFP class3 : Port class4 : Fabric class5 : E-Port class6 : F/FL Port (Optical) class7 : Alpa Performance Monitor class8 : End-to-End Performance Monitor class9 : Filter Performance Monitor class10 : Security class11 : Resource class12 : FRU class13 : QuitSelect an item => : (1..13) [13]
Fabric Watch Administrator’s Guide 3353-1002153-01
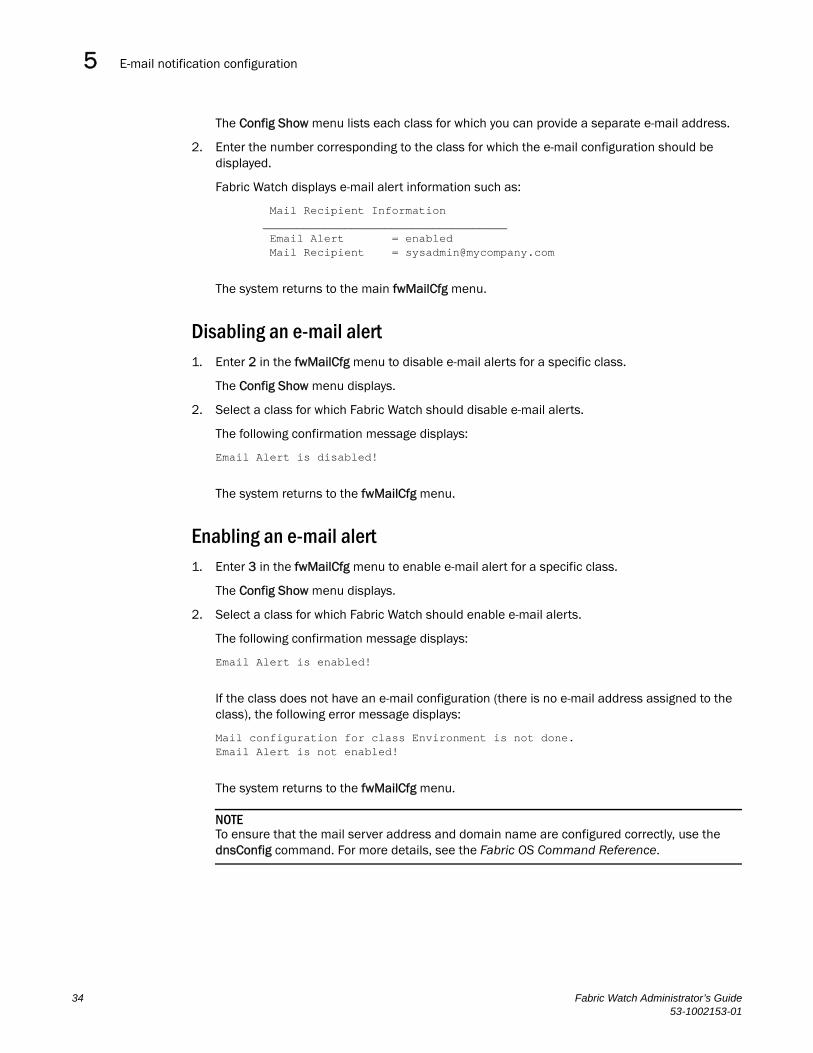
E-mail notification configuration5
The Config Show menu lists each class for which you can provide a separate e-mail address.
2. Enter the number corresponding to the class for which the e-mail configuration should be displayed.
Fabric Watch displays e-mail alert information such as:
Mail Recipient Information ____________________________________ Email Alert = enabled Mail Recipient = [email protected]
The system returns to the main fwMailCfg menu.
Disabling an e-mail alert1. Enter 2 in the fwMailCfg menu to disable e-mail alerts for a specific class.
The Config Show menu displays.
2. Select a class for which Fabric Watch should disable e-mail alerts.
The following confirmation message displays:
Email Alert is disabled!
The system returns to the fwMailCfg menu.
Enabling an e-mail alert1. Enter 3 in the fwMailCfg menu to enable e-mail alert for a specific class.
The Config Show menu displays.
2. Select a class for which Fabric Watch should enable e-mail alerts.
The following confirmation message displays:
Email Alert is enabled!
If the class does not have an e-mail configuration (there is no e-mail address assigned to the class), the following error message displays:
Mail configuration for class Environment is not done.Email Alert is not enabled!
The system returns to the fwMailCfg menu.
NOTETo ensure that the mail server address and domain name are configured correctly, use the dnsConfig command. For more details, see the Fabric OS Command Reference.
34 Fabric Watch Administrator’s Guide53-1002153-01
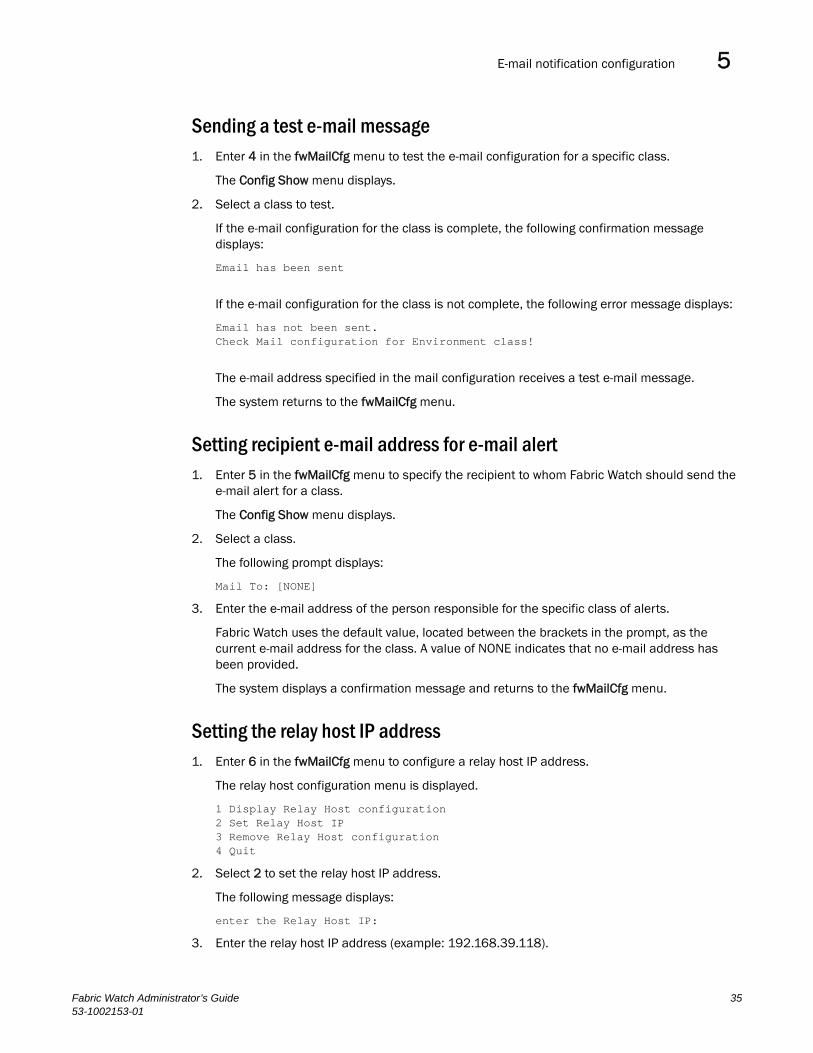
E-mail notification configuration 5
Sending a test e-mail message1. Enter 4 in the fwMailCfg menu to test the e-mail configuration for a specific class.
The Config Show menu displays.
2. Select a class to test.
If the e-mail configuration for the class is complete, the following confirmation message displays:
Email has been sent
If the e-mail configuration for the class is not complete, the following error message displays:
Email has not been sent.Check Mail configuration for Environment class!
The e-mail address specified in the mail configuration receives a test e-mail message.
The system returns to the fwMailCfg menu.
Setting recipient e-mail address for e-mail alert1. Enter 5 in the fwMailCfg menu to specify the recipient to whom Fabric Watch should send the
e-mail alert for a class.
The Config Show menu displays.
2. Select a class.
The following prompt displays:
Mail To: [NONE]
3. Enter the e-mail address of the person responsible for the specific class of alerts.
Fabric Watch uses the default value, located between the brackets in the prompt, as the current e-mail address for the class. A value of NONE indicates that no e-mail address has been provided.
The system displays a confirmation message and returns to the fwMailCfg menu.
Setting the relay host IP address1. Enter 6 in the fwMailCfg menu to configure a relay host IP address.
The relay host configuration menu is displayed.
1 Display Relay Host configuration2 Set Relay Host IP3 Remove Relay Host configuration4 Quit
2. Select 2 to set the relay host IP address.
The following message displays:
enter the Relay Host IP:
3. Enter the relay host IP address (example: 192.168.39.118).
Fabric Watch Administrator’s Guide 3553-1002153-01
Notification configuration5
The following message displays:
Setting 192.168.39.118 as Relay Host..
4. Enter the Domain Name (example: Brocade.com).
Displaying the relay host configuration1. Enter 6 in the fwMailCfg menu to display the relay host configuration menu.
1 Display Relay Host configuration2 Set Relay Host IP3 Remove Relay Host configuration4 Quit
2. Enter 1 to display the configuration.
Removing the relay host configuration1. Enter 6 in the fwMailCfg menu to display the relay host configuration menu.
1 Display Relay Host configuration2 Set Relay Host IP3 Remove Relay Host configuration4 Quit
2. Enter 3 to remove the configuration.
Notification configurationNotifications act as a signal or alert that notifies you when a threshold has been crossed.
When you use alarm notifications, error messages are sent to designated locations such as an error log, SNMP trap view, or e-mail. With an error log, you can log in to a particular switch to view the error messages that have been captured for that particular switch. You can parse the log file to make error message searches quicker and easier.
Configuring alarm notifications1. Ensure that notifications appear in the error log by using the following command.
switch:admin> fwAlarmsFilterSet 1
The 1 option turns on the alarm notification.
36 Fabric Watch Administrator’s Guide53-1002153-01
Notification configuration 5
2. Enter the following command if you decide not to have notifications sent.
switch:admin> fwAlarmsFilterSet 0
The 0 option turns the alarm notification off.
All notifications are suppressed when alarm notifications are turned off, except for the Environment class and Resource class.
3. Verify or view your current alarm notifications by using the fwAlarmsFilterShow command.
switch:admin> fwalarmsfiltershowFW: Alarms are enabled
Fabric Watch Administrator’s Guide 3753-1002153-01

Notification configuration5
38 Fabric Watch Administrator’s Guide53-1002153-01
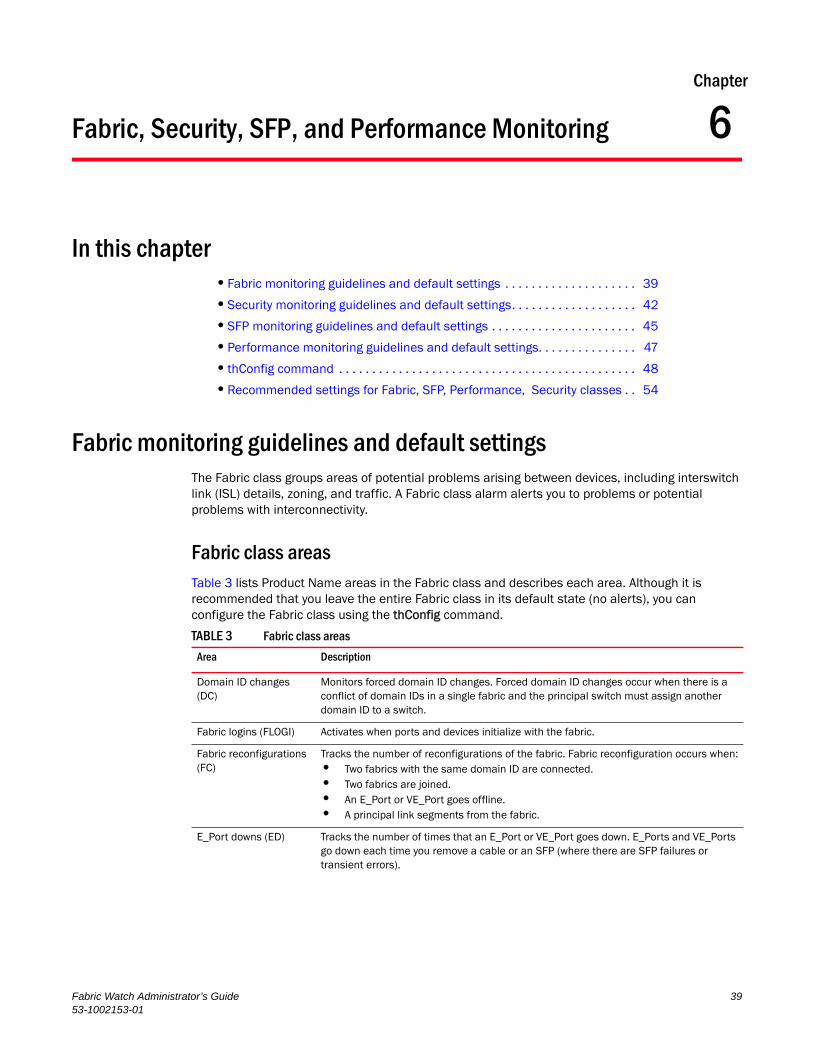
Fabric Watch Administrator’s Guide53-1002153-01
Chapter
6
Fabric, Security, SFP, and Performance MonitoringIn this chapter•Fabric monitoring guidelines and default settings . . . . . . . . . . . . . . . . . . . . 39
•Security monitoring guidelines and default settings. . . . . . . . . . . . . . . . . . . 42
•SFP monitoring guidelines and default settings . . . . . . . . . . . . . . . . . . . . . . 45
•Performance monitoring guidelines and default settings. . . . . . . . . . . . . . . 47
•thConfig command . . . . . . . . . . . . . . . . . . . . . . . . . . . . . . . . . . . . . . . . . . . . . 48
•Recommended settings for Fabric, SFP, Performance, Security classes . . 54
Fabric monitoring guidelines and default settingsThe Fabric class groups areas of potential problems arising between devices, including interswitch link (ISL) details, zoning, and traffic. A Fabric class alarm alerts you to problems or potential problems with interconnectivity.
Fabric class areasTable 3 lists Product Name areas in the Fabric class and describes each area. Although it is recommended that you leave the entire Fabric class in its default state (no alerts), you can configure the Fabric class using the thConfig command.
TABLE 3 Fabric class areas
Area Description
Domain ID changes (DC)
Monitors forced domain ID changes. Forced domain ID changes occur when there is a conflict of domain IDs in a single fabric and the principal switch must assign another domain ID to a switch.
Fabric logins (FLOGI) Activates when ports and devices initialize with the fabric.
Fabric reconfigurations (FC)
Tracks the number of reconfigurations of the fabric. Fabric reconfiguration occurs when:• Two fabrics with the same domain ID are connected.• Two fabrics are joined.• An E_Port or VE_Port goes offline.• A principal link segments from the fabric.
E_Port downs (ED) Tracks the number of times that an E_Port or VE_Port goes down. E_Ports and VE_Ports go down each time you remove a cable or an SFP (where there are SFP failures or transient errors).
39
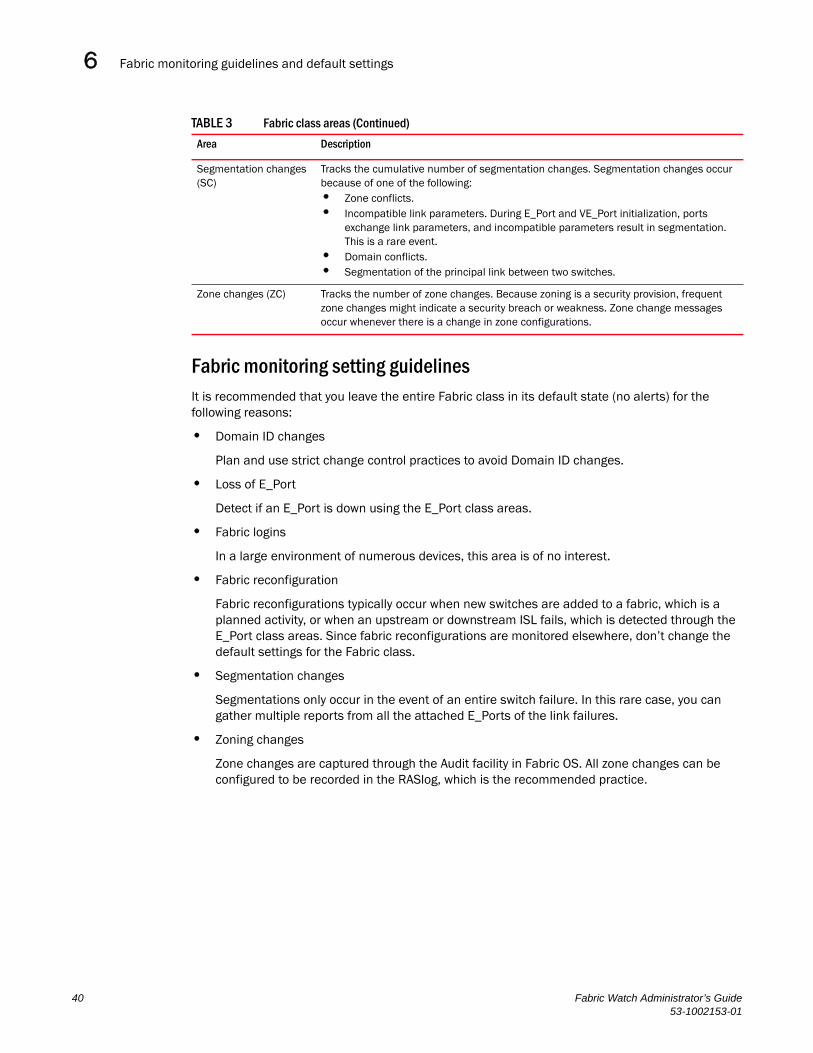
Fabric monitoring guidelines and default settings6
Fabric monitoring setting guidelinesIt is recommended that you leave the entire Fabric class in its default state (no alerts) for the following reasons:
• Domain ID changes
Plan and use strict change control practices to avoid Domain ID changes.
• Loss of E_Port
Detect if an E_Port is down using the E_Port class areas.
• Fabric logins
In a large environment of numerous devices, this area is of no interest.
• Fabric reconfiguration
Fabric reconfigurations typically occur when new switches are added to a fabric, which is a planned activity, or when an upstream or downstream ISL fails, which is detected through the E_Port class areas. Since fabric reconfigurations are monitored elsewhere, don’t change the default settings for the Fabric class.
• Segmentation changes
Segmentations only occur in the event of an entire switch failure. In this rare case, you can gather multiple reports from all the attached E_Ports of the link failures.
• Zoning changes
Zone changes are captured through the Audit facility in Fabric OS. All zone changes can be configured to be recorded in the RASlog, which is the recommended practice.
Segmentation changes (SC)
Tracks the cumulative number of segmentation changes. Segmentation changes occur because of one of the following:• Zone conflicts.• Incompatible link parameters. During E_Port and VE_Port initialization, ports
exchange link parameters, and incompatible parameters result in segmentation. This is a rare event.
• Domain conflicts.• Segmentation of the principal link between two switches.
Zone changes (ZC) Tracks the number of zone changes. Because zoning is a security provision, frequent zone changes might indicate a security breach or weakness. Zone change messages occur whenever there is a change in zone configurations.
TABLE 3 Fabric class areas (Continued)
Area Description
40 Fabric Watch Administrator’s Guide53-1002153-01
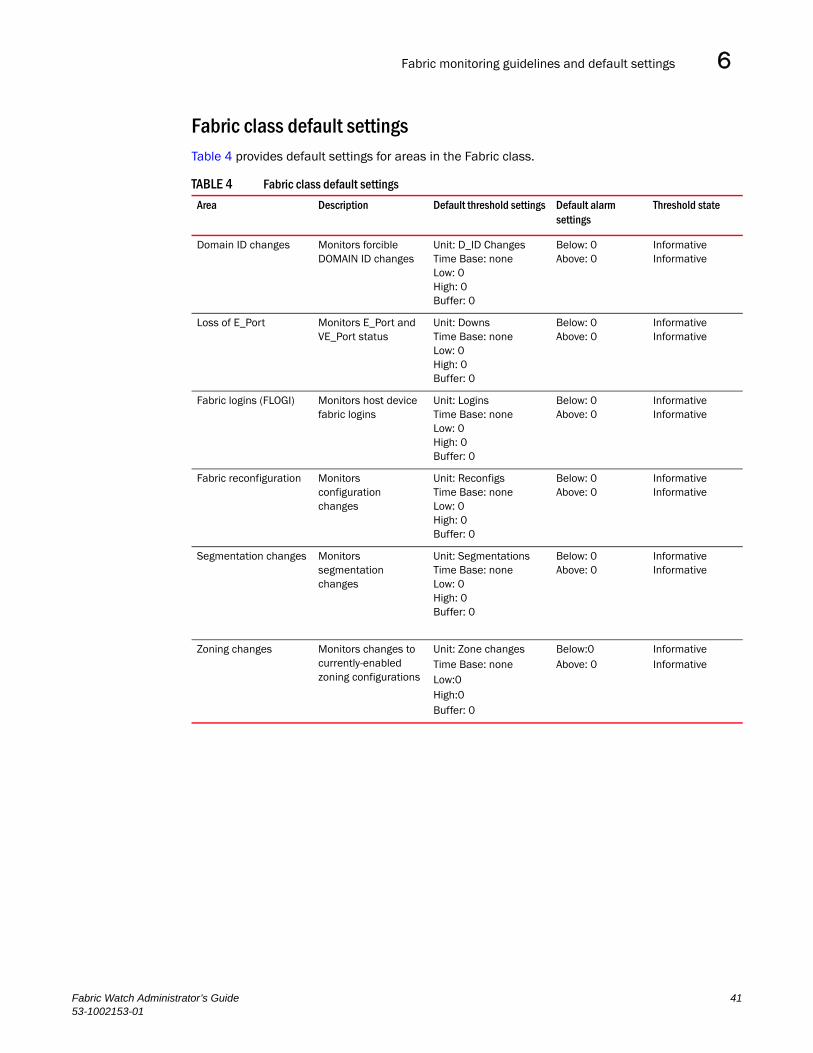
Fabric monitoring guidelines and default settings 6
Fabric class default settingsTable 4 provides default settings for areas in the Fabric class.
TABLE 4 Fabric class default settings
Area Description Default threshold settings Default alarm settings
Threshold state
Domain ID changes Monitors forcible DOMAIN ID changes
Unit: D_ID ChangesTime Base: noneLow: 0High: 0Buffer: 0
Below: 0Above: 0
InformativeInformative
Loss of E_Port Monitors E_Port and VE_Port status
Unit: DownsTime Base: noneLow: 0High: 0Buffer: 0
Below: 0Above: 0
InformativeInformative
Fabric logins (FLOGI) Monitors host device fabric logins
Unit: LoginsTime Base: noneLow: 0High: 0Buffer: 0
Below: 0Above: 0
InformativeInformative
Fabric reconfiguration Monitors configuration changes
Unit: ReconfigsTime Base: noneLow: 0High: 0Buffer: 0
Below: 0Above: 0
InformativeInformative
Segmentation changes Monitors segmentation changes
Unit: SegmentationsTime Base: noneLow: 0High: 0Buffer: 0
Below: 0Above: 0
InformativeInformative
Zoning changes Monitors changes to currently-enabled zoning configurations
Unit: Zone changesTime Base: noneLow:0High:0Buffer: 0
Below:0Above: 0
InformativeInformative
Fabric Watch Administrator’s Guide 4153-1002153-01
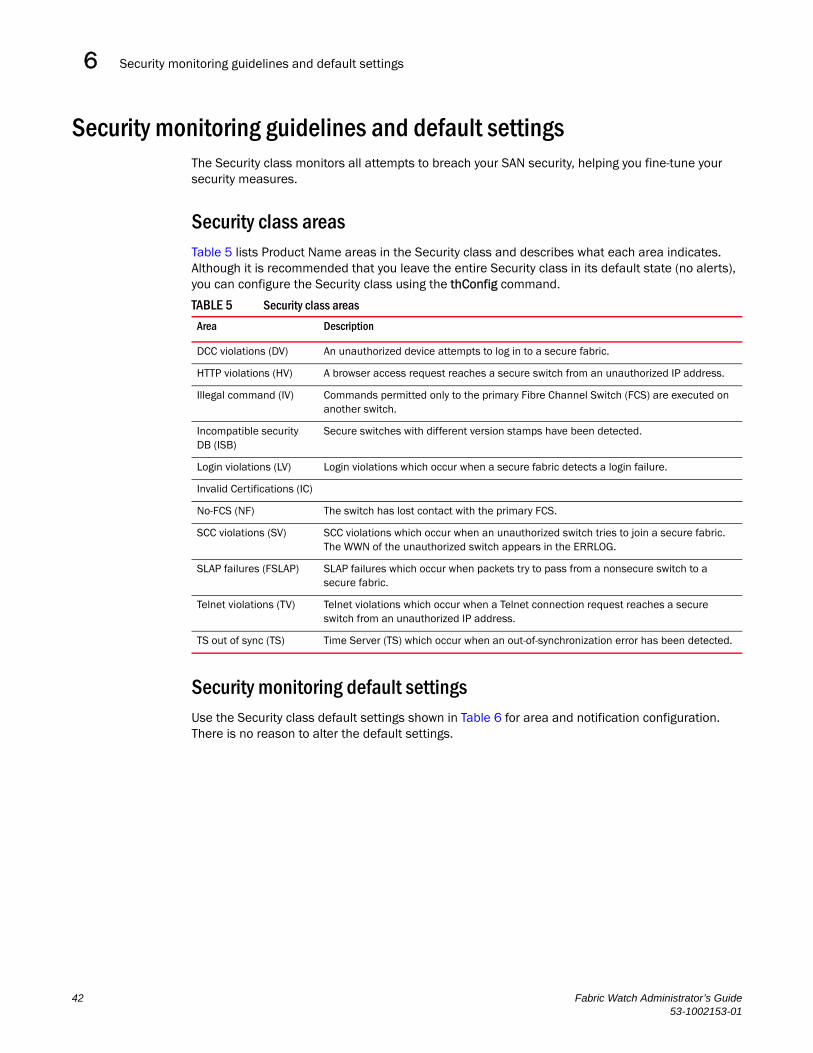
Security monitoring guidelines and default settings6
Security monitoring guidelines and default settingsThe Security class monitors all attempts to breach your SAN security, helping you fine-tune your security measures.
Security class areasTable 5 lists Product Name areas in the Security class and describes what each area indicates. Although it is recommended that you leave the entire Security class in its default state (no alerts), you can configure the Security class using the thConfig command.
Security monitoring default settingsUse the Security class default settings shown in Table 6 for area and notification configuration. There is no reason to alter the default settings.
TABLE 5 Security class areas
Area Description
DCC violations (DV) An unauthorized device attempts to log in to a secure fabric.
HTTP violations (HV) A browser access request reaches a secure switch from an unauthorized IP address.
Illegal command (IV) Commands permitted only to the primary Fibre Channel Switch (FCS) are executed on another switch.
Incompatible security DB (ISB)
Secure switches with different version stamps have been detected.
Login violations (LV) Login violations which occur when a secure fabric detects a login failure.
Invalid Certifications (IC)
No-FCS (NF) The switch has lost contact with the primary FCS.
SCC violations (SV) SCC violations which occur when an unauthorized switch tries to join a secure fabric. The WWN of the unauthorized switch appears in the ERRLOG.
SLAP failures (FSLAP) SLAP failures which occur when packets try to pass from a nonsecure switch to a secure fabric.
Telnet violations (TV) Telnet violations which occur when a Telnet connection request reaches a secure switch from an unauthorized IP address.
TS out of sync (TS) Time Server (TS) which occur when an out-of-synchronization error has been detected.
42 Fabric Watch Administrator’s Guide53-1002153-01
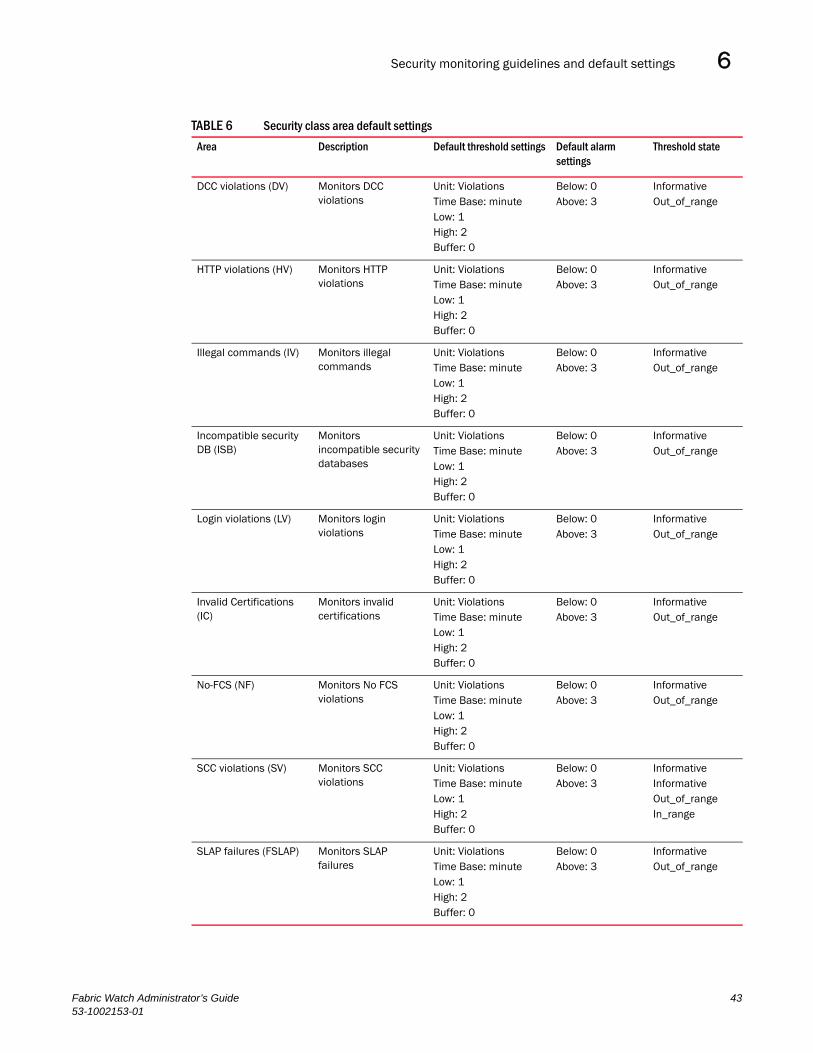
Security monitoring guidelines and default settings 6
TABLE 6 Security class area default settings
Area Description Default threshold settings Default alarm settings
Threshold state
DCC violations (DV) Monitors DCC violations
Unit: ViolationsTime Base: minuteLow: 1High: 2Buffer: 0
Below: 0Above: 3
InformativeOut_of_range
HTTP violations (HV) Monitors HTTP violations
Unit: ViolationsTime Base: minuteLow: 1High: 2Buffer: 0
Below: 0Above: 3
InformativeOut_of_range
Illegal commands (IV) Monitors illegal commands
Unit: ViolationsTime Base: minuteLow: 1High: 2Buffer: 0
Below: 0Above: 3
InformativeOut_of_range
Incompatible security DB (ISB)
Monitors incompatible security databases
Unit: ViolationsTime Base: minuteLow: 1High: 2Buffer: 0
Below: 0Above: 3
InformativeOut_of_range
Login violations (LV) Monitors login violations
Unit: ViolationsTime Base: minuteLow: 1High: 2Buffer: 0
Below: 0Above: 3
InformativeOut_of_range
Invalid Certifications (IC)
Monitors invalid certifications
Unit: ViolationsTime Base: minuteLow: 1High: 2Buffer: 0
Below: 0Above: 3
InformativeOut_of_range
No-FCS (NF) Monitors No FCS violations
Unit: ViolationsTime Base: minuteLow: 1High: 2Buffer: 0
Below: 0Above: 3
InformativeOut_of_range
SCC violations (SV) Monitors SCC violations
Unit: ViolationsTime Base: minuteLow: 1High: 2Buffer: 0
Below: 0Above: 3
InformativeInformativeOut_of_rangeIn_range
SLAP failures (FSLAP) Monitors SLAP failures
Unit: ViolationsTime Base: minuteLow: 1High: 2Buffer: 0
Below: 0Above: 3
InformativeOut_of_range
Fabric Watch Administrator’s Guide 4353-1002153-01
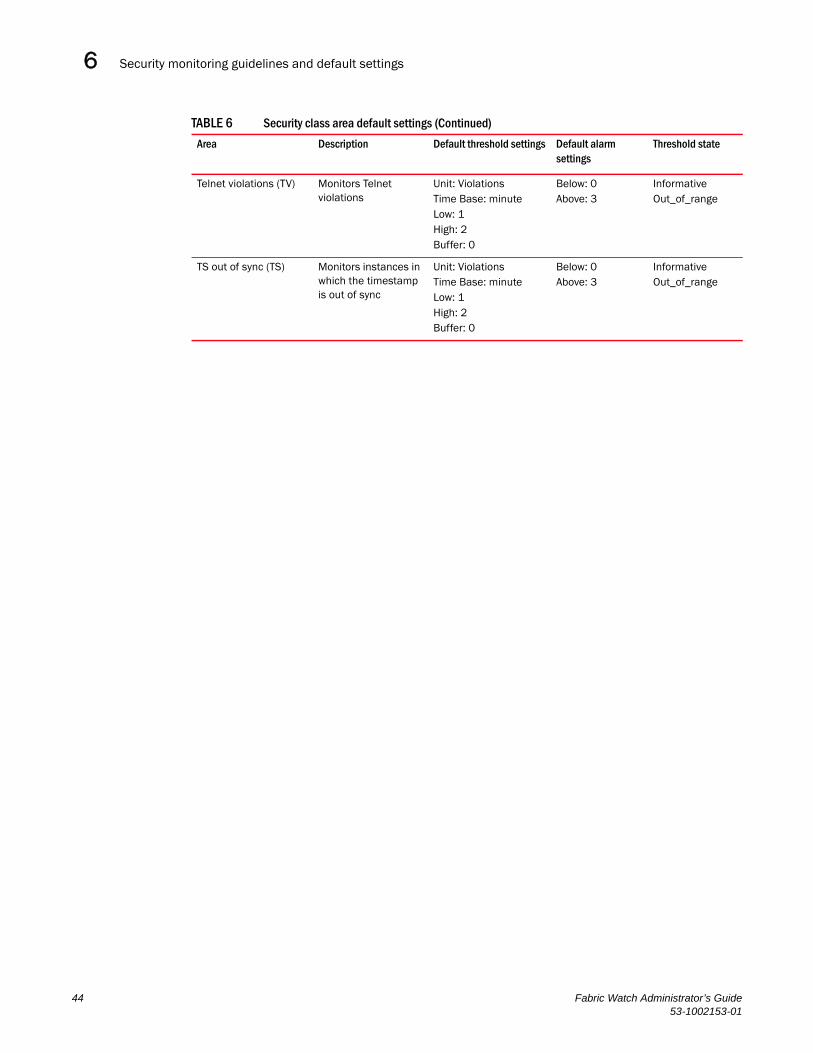
Security monitoring guidelines and default settings6
Telnet violations (TV) Monitors Telnet violations
Unit: ViolationsTime Base: minuteLow: 1High: 2Buffer: 0
Below: 0Above: 3
InformativeOut_of_range
TS out of sync (TS) Monitors instances in which the timestamp is out of sync
Unit: ViolationsTime Base: minuteLow: 1High: 2Buffer: 0
Below: 0Above: 3
InformativeOut_of_range
TABLE 6 Security class area default settings (Continued)
Area Description Default threshold settings Default alarm settings
Threshold state
44 Fabric Watch Administrator’s Guide53-1002153-01
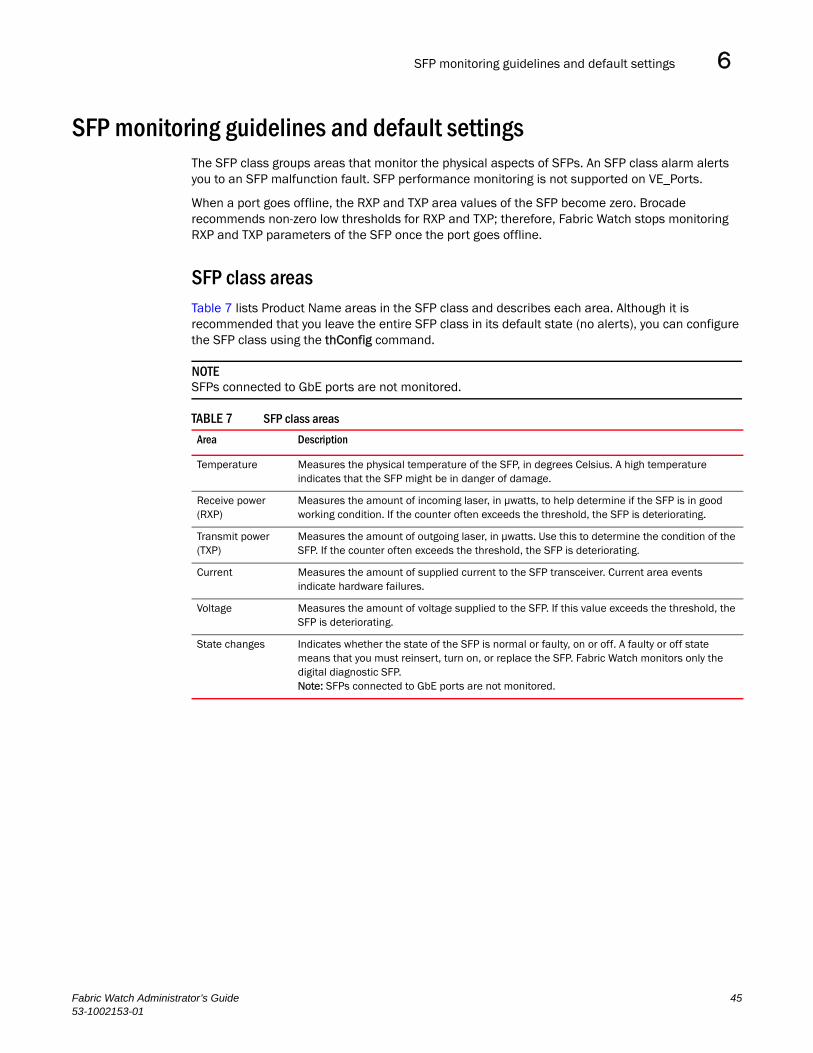
SFP monitoring guidelines and default settings 6
SFP monitoring guidelines and default settingsThe SFP class groups areas that monitor the physical aspects of SFPs. An SFP class alarm alerts you to an SFP malfunction fault. SFP performance monitoring is not supported on VE_Ports.
When a port goes offline, the RXP and TXP area values of the SFP become zero. Brocade recommends non-zero low thresholds for RXP and TXP; therefore, Fabric Watch stops monitoring RXP and TXP parameters of the SFP once the port goes offline.
SFP class areasTable 7 lists Product Name areas in the SFP class and describes each area. Although it is recommended that you leave the entire SFP class in its default state (no alerts), you can configure the SFP class using the thConfig command.
NOTESFPs connected to GbE ports are not monitored.
TABLE 7 SFP class areas
Area Description
Temperature Measures the physical temperature of the SFP, in degrees Celsius. A high temperature indicates that the SFP might be in danger of damage.
Receive power (RXP)
Measures the amount of incoming laser, in µwatts, to help determine if the SFP is in good working condition. If the counter often exceeds the threshold, the SFP is deteriorating.
Transmit power (TXP)
Measures the amount of outgoing laser, in µwatts. Use this to determine the condition of the SFP. If the counter often exceeds the threshold, the SFP is deteriorating.
Current Measures the amount of supplied current to the SFP transceiver. Current area events indicate hardware failures.
Voltage Measures the amount of voltage supplied to the SFP. If this value exceeds the threshold, the SFP is deteriorating.
State changes Indicates whether the state of the SFP is normal or faulty, on or off. A faulty or off state means that you must reinsert, turn on, or replace the SFP. Fabric Watch monitors only the digital diagnostic SFP.Note: SFPs connected to GbE ports are not monitored.
Fabric Watch Administrator’s Guide 4553-1002153-01
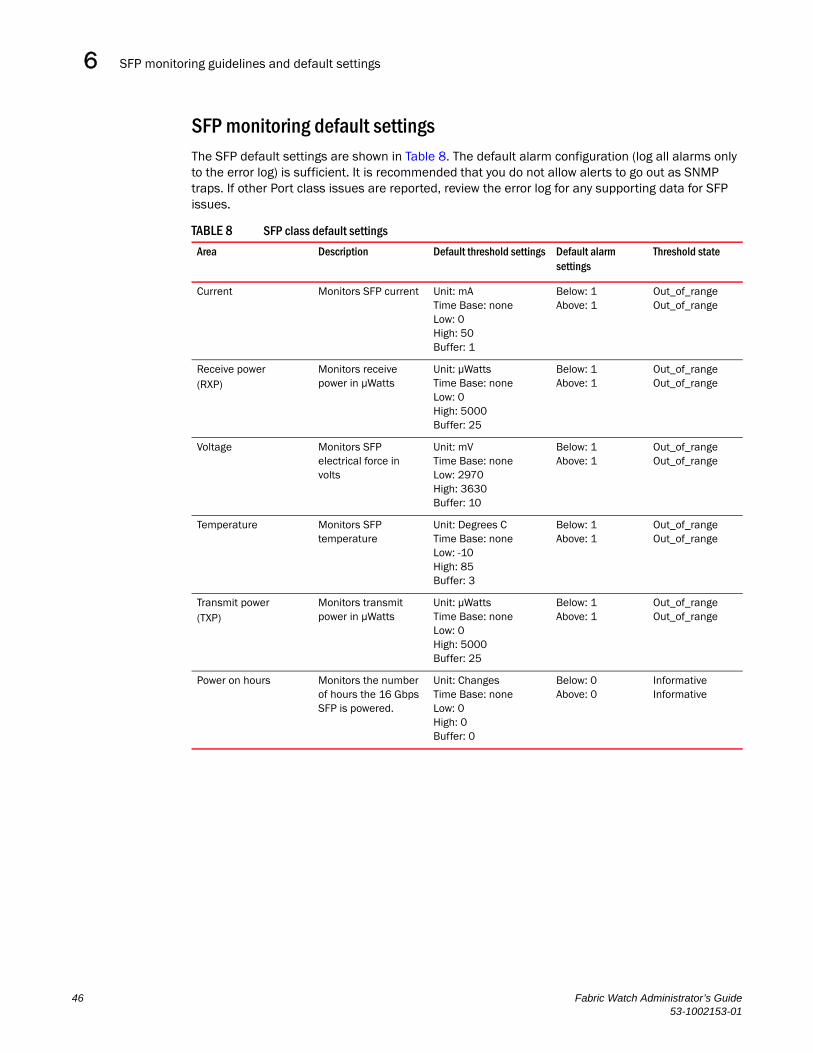
SFP monitoring guidelines and default settings6
SFP monitoring default settingsThe SFP default settings are shown in Table 8. The default alarm configuration (log all alarms only to the error log) is sufficient. It is recommended that you do not allow alerts to go out as SNMP traps. If other Port class issues are reported, review the error log for any supporting data for SFP issues.
TABLE 8 SFP class default settings
Area Description Default threshold settings Default alarm settings
Threshold state
Current Monitors SFP current Unit: mATime Base: noneLow: 0High: 50Buffer: 1
Below: 1Above: 1
Out_of_rangeOut_of_range
Receive power(RXP)
Monitors receive power in µWatts
Unit: µWattsTime Base: noneLow: 0High: 5000Buffer: 25
Below: 1Above: 1
Out_of_rangeOut_of_range
Voltage Monitors SFP electrical force in volts
Unit: mVTime Base: noneLow: 2970High: 3630Buffer: 10
Below: 1Above: 1
Out_of_rangeOut_of_range
Temperature Monitors SFP temperature
Unit: Degrees CTime Base: noneLow: -10 High: 85 Buffer: 3
Below: 1Above: 1
Out_of_rangeOut_of_range
Transmit power(TXP)
Monitors transmit power in µWatts
Unit: µWattsTime Base: noneLow: 0 High: 5000Buffer: 25
Below: 1Above: 1
Out_of_rangeOut_of_range
Power on hours Monitors the number of hours the 16 Gbps SFP is powered.
Unit: ChangesTime Base: noneLow: 0High: 0Buffer: 0
Below: 0Above: 0
InformativeInformative
46 Fabric Watch Administrator’s Guide53-1002153-01
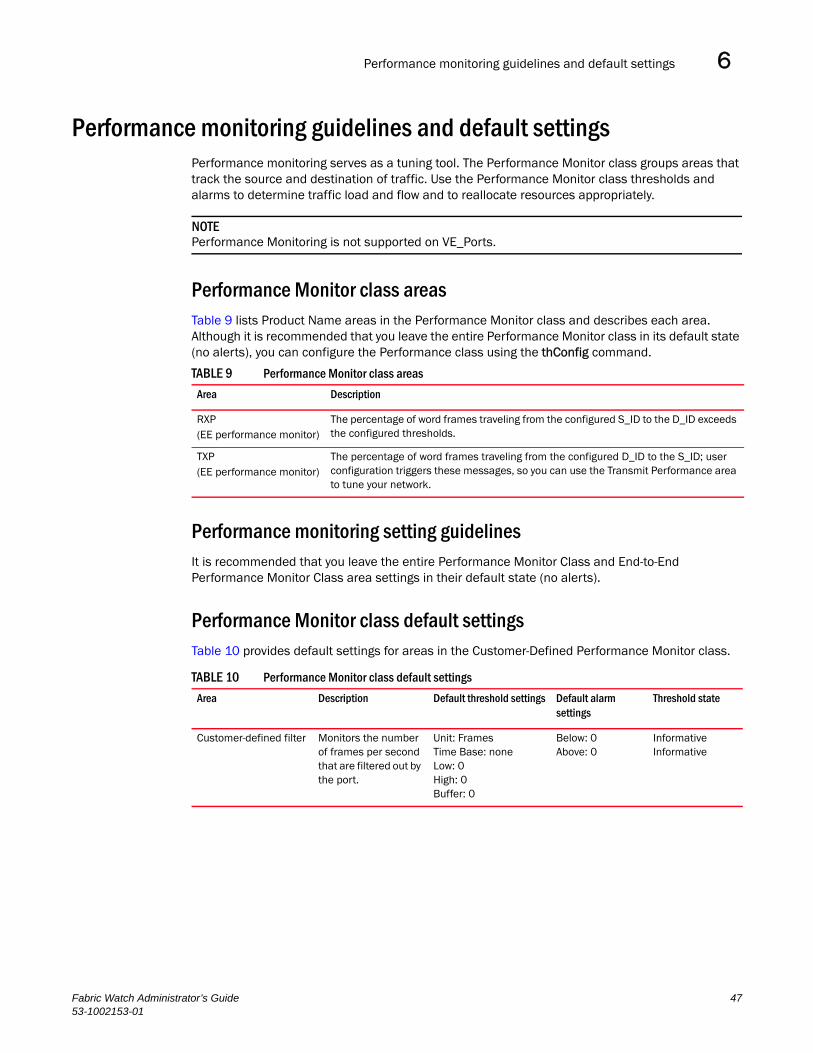
Performance monitoring guidelines and default settings 6
Performance monitoring guidelines and default settingsPerformance monitoring serves as a tuning tool. The Performance Monitor class groups areas that track the source and destination of traffic. Use the Performance Monitor class thresholds and alarms to determine traffic load and flow and to reallocate resources appropriately.
NOTEPerformance Monitoring is not supported on VE_Ports.
Performance Monitor class areasTable 9 lists Product Name areas in the Performance Monitor class and describes each area. Although it is recommended that you leave the entire Performance Monitor class in its default state (no alerts), you can configure the Performance class using the thConfig command.
Performance monitoring setting guidelinesIt is recommended that you leave the entire Performance Monitor Class and End-to-End Performance Monitor Class area settings in their default state (no alerts).
Performance Monitor class default settingsTable 10 provides default settings for areas in the Customer-Defined Performance Monitor class.
TABLE 9 Performance Monitor class areas
Area Description
RXP (EE performance monitor)
The percentage of word frames traveling from the configured S_ID to the D_ID exceeds the configured thresholds.
TXP(EE performance monitor)
The percentage of word frames traveling from the configured D_ID to the S_ID; user configuration triggers these messages, so you can use the Transmit Performance area to tune your network.
TABLE 10 Performance Monitor class default settings
Area Description Default threshold settings Default alarm settings
Threshold state
Customer-defined filter Monitors the number of frames per second that are filtered out by the port.
Unit: FramesTime Base: noneLow: 0High: 0Buffer: 0
Below: 0Above: 0
InformativeInformative
Fabric Watch Administrator’s Guide 4753-1002153-01
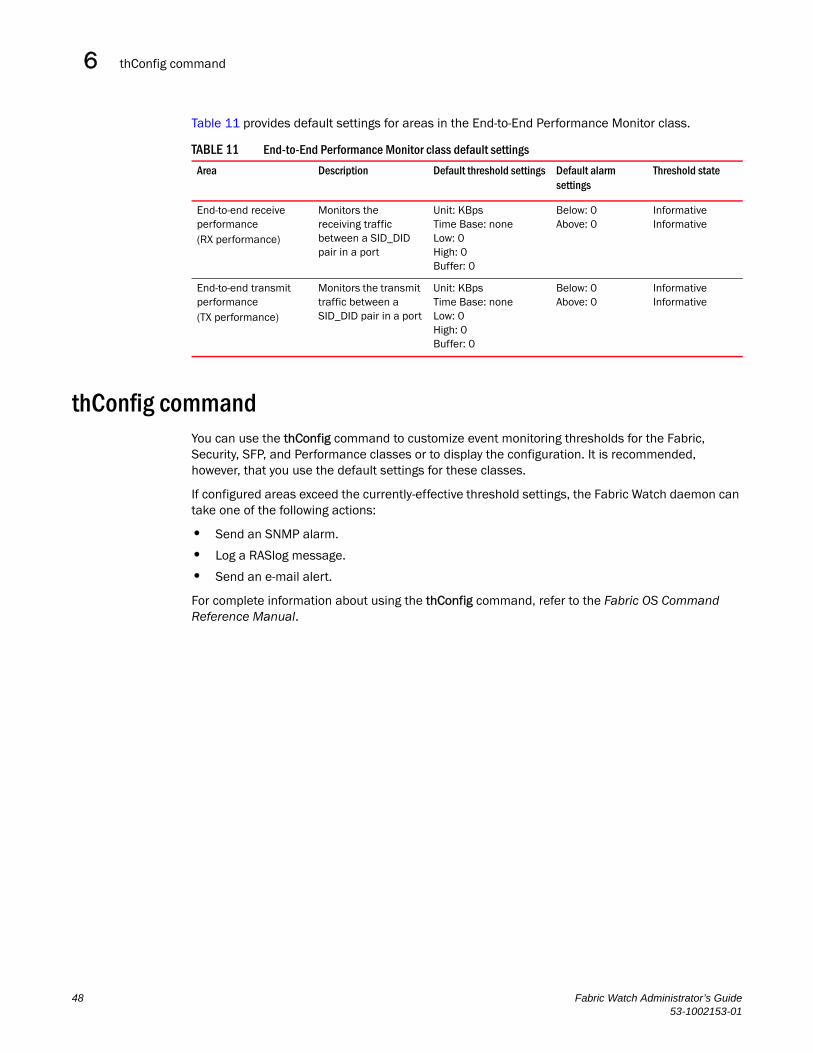
thConfig command6
Table 11 provides default settings for areas in the End-to-End Performance Monitor class.
thConfig commandYou can use the thConfig command to customize event monitoring thresholds for the Fabric, Security, SFP, and Performance classes or to display the configuration. It is recommended, however, that you use the default settings for these classes.
If configured areas exceed the currently-effective threshold settings, the Fabric Watch daemon can take one of the following actions:
• Send an SNMP alarm.
• Log a RASlog message.
• Send an e-mail alert.
For complete information about using the thConfig command, refer to the Fabric OS Command Reference Manual.
TABLE 11 End-to-End Performance Monitor class default settings
Area Description Default threshold settings Default alarm settings
Threshold state
End-to-end receive performance(RX performance)
Monitors the receiving traffic between a SID_DID pair in a port
Unit: KBpsTime Base: noneLow: 0High: 0Buffer: 0
Below: 0Above: 0
InformativeInformative
End-to-end transmit performance(TX performance)
Monitors the transmit traffic between a SID_DID pair in a port
Unit: KBpsTime Base: noneLow: 0High: 0Buffer: 0
Below: 0Above: 0
InformativeInformative
48 Fabric Watch Administrator’s Guide53-1002153-01
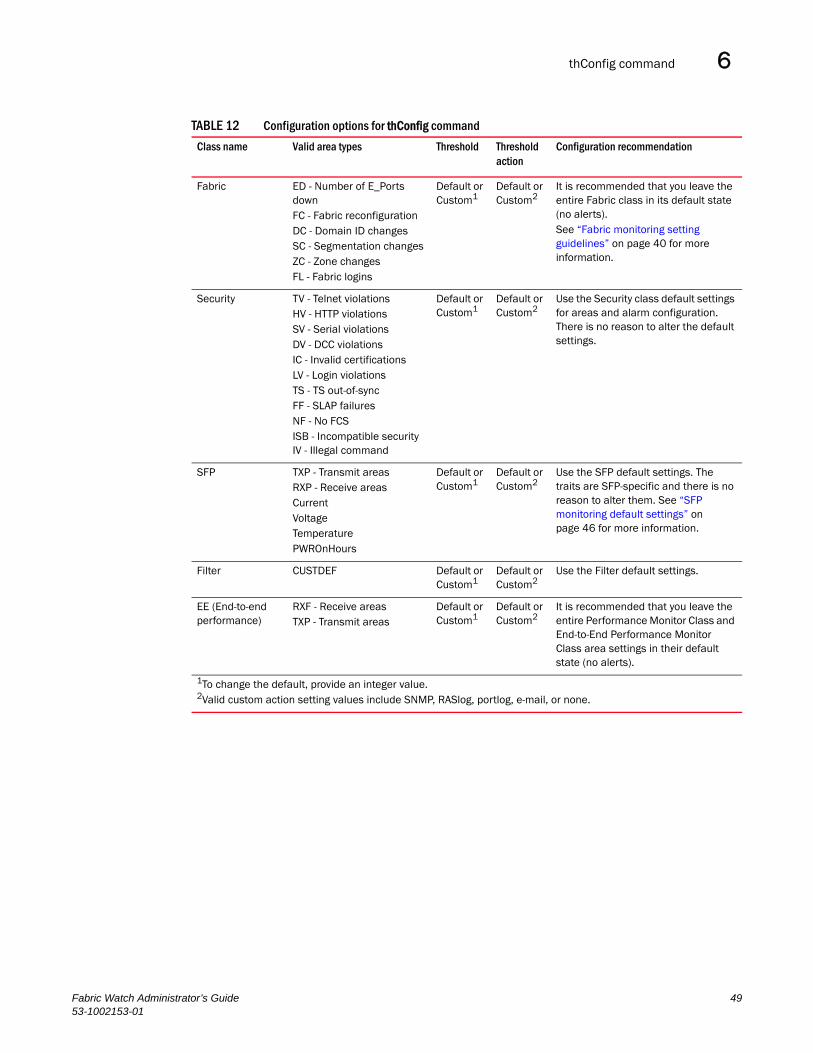
thConfig command 6
TABLE 12 Configuration options for thConfig command
Class name Valid area types Threshold Threshold action
Configuration recommendation
Fabric ED - Number of E_Ports downFC - Fabric reconfigurationDC - Domain ID changesSC - Segmentation changesZC - Zone changesFL - Fabric logins
Default or Custom1
Default or Custom2
It is recommended that you leave the entire Fabric class in its default state (no alerts).See “Fabric monitoring setting guidelines” on page 40 for more information.
Security TV - Telnet violationsHV - HTTP violationsSV - Serial violationsDV - DCC violationsIC - Invalid certificationsLV - Login violationsTS - TS out-of-syncFF - SLAP failuresNF - No FCSISB - Incompatible security IV - Illegal command
Default or Custom1
Default or Custom2
Use the Security class default settings for areas and alarm configuration. There is no reason to alter the default settings.
SFP TXP - Transmit areasRXP - Receive areasCurrentVoltageTemperaturePWROnHours
Default or Custom1
Default or Custom2
Use the SFP default settings. The traits are SFP-specific and there is no reason to alter them. See “SFP monitoring default settings” on page 46 for more information.
Filter CUSTDEF Default or Custom1
Default or Custom2
Use the Filter default settings.
EE (End-to-end performance)
RXF - Receive areasTXP - Transmit areas
Default or Custom1
Default or Custom2
It is recommended that you leave the entire Performance Monitor Class and End-to-End Performance Monitor Class area settings in their default state (no alerts).
1To change the default, provide an integer value.2Valid custom action setting values include SNMP, RASlog, portlog, e-mail, or none.
Fabric Watch Administrator’s Guide 4953-1002153-01
thConfig command6
thConfig command examplesWith the exception of setting thresholds for the RX area of an end-to-end (EE) performance monitor, which requires special licensing in Access Gateway mode, it is recommended that you use the default settings for these classes.
Setting the high threshold of the RX area of an EE monitor
The thConfig command provides the ability to monitor thresholds for frame monitoring and end-to-end (EE) performance on both Access Gateway (AG) switches and non-AG switches.
NOTEBoth the APM license and the Fabric Watch license must be installed on the platform configured in AG mode to use the frame monitoring and EE monitoring capabilities. The APM license provides the counters and the Fabric Watch license provides the monitoring and alert mechanisms for these counters.
To set the high threshold of the RX area, enter the thConfig command using the following parameters.
switch:admin> thconfig --set ee -area RX -timebase minute -high -val 12
Pausing and continuing monitoring
To pause the monitoring of a class, area, and port or index, enter the thConfig command using the following parameters. You can separate multiple, individual classes and areas with a comma; you cannot, however, specify all for all classes and areas.
switch:admin> thconfig --pause | --continue <class> -area <area_type> -port <[slot/]port>
switch:admin> thconfig --pause | --continue <class> -area <area_type> -index <index>
NOTEThe Security and Fabric classes do not have a port or index value. For those classes, a value of 0 is assumed.
16 Gbps and QSFP monitoringFabric Watch monitors the Brocade 16 Gbps SFP. If the SFP crosses a configured threshold, Fabric Watch generates an SNMP alarm, a RASlog message, and an e-mail alert for the following SFP areas:
• Current
• Voltage
• Temperature
• RXP
• TXP
• Power on Hours (Power on Hours is not supported on the 10 Gbps SFP or the QSFP)
50 Fabric Watch Administrator’s Guide53-1002153-01
thConfig command 6
Fabric Watch also monitors the Brocade Quad SFP (QSFP) and, as with the 16 Gbps SFP, if configured thresholds are crossed, Fabric Watch generates an SNMP alarm, a RASlog message, and an e-mail alert for the following SFP areas:
• Current
• Voltage
• Temperature
• RXP
NOTEOn core blades, only the 16 Gbps QSFPs can be installed.
Voltage and temperature monitoring using the QSFP
A QSFP connects four ports of one core blade of a chassis to another core blade of a different chassis. Typically, voltage and temperature values for all ports, on a single chassis, that are connected using one QSFP unit will have the same values, resulting in redundant information. To avoid this, Fabric Watch monitors the voltage and temperature areas on the first available port of the QSFP unit only, which reduces the display of redundant information. If the port crosses the voltage or temperature thresholds, Fabric Watch takes the SNMP, RASlog, or e-mail action on the first port and sends a warning to the user that the other ports are affected.
Logical switch considerations with QSFP
NOTEThe following information is applicable only to voltage and temperature monitoring of QSFPs.
Fabric Watch monitors QSFPs in each logical switch. Temperature and voltage are monitored on the first available port of the QSFP unit to minimize the display of redundant information. However, if individual ports of a QSFP belong to different logical switches, then there will be separate action notifications for each logical switch.
Monitoring the SFP and QSFP
You can use the thMonitor command to enable Brocade’s 10 Gbps and 16 Gbps SFP and 16 Gbps QSFP. By default, the SFP and QSFP are disabled.
To enable or start the monitoring of the SFP and QSFP, enter the thMonitor command using the following parameter:
switch:admin> thmonitor --enable brcdSfp
To disable or stop the monitoring of the SFP and QSFP, enter the thMonitor command using the following parameter:
switch:admin> thmonitor --disable brcdSfp
To show the monitoring status of the SFP and QSFP, enter the thMonitor command using the following parameter:
switch:admin> thmonitor --show
Fabric Watch Administrator’s Guide 5153-1002153-01
thConfig command6
Specifying the 16 Gbps SFP type
You can use the sfpType operand to manage the actions and thresholds for the Current, Voltage, RXP, TXP, and Temperature areas of the 16 Gbps SFPs. If you do not provide the SFP type parameters, the existing thresholds and actions of the SFP class are changed to the default. SFP types for the 16 Gbps and QSFP SFPs are listed in Table 13.
switch:admin> thconfig --set sfp -area TXP --sfptype sfptype
switch:admin> thconfig --apply sfp -area TXP --sfptype sfptype
52 Fabric Watch Administrator’s Guide53-1002153-01
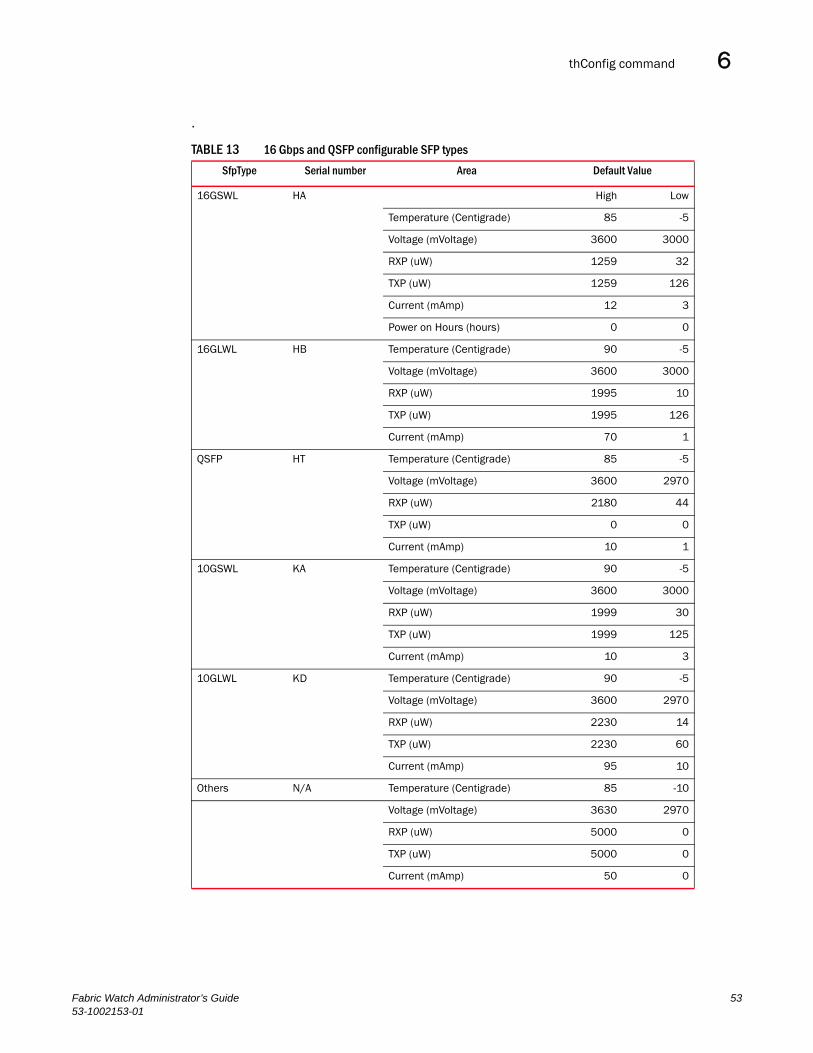
thConfig command 6
.
TABLE 13 16 Gbps and QSFP configurable SFP types
SfpType Serial number Area Default Value
16GSWL HA High Low
Temperature (Centigrade) 85 -5
Voltage (mVoltage) 3600 3000
RXP (uW) 1259 32
TXP (uW) 1259 126
Current (mAmp) 12 3
Power on Hours (hours) 0 0
16GLWL HB Temperature (Centigrade) 90 -5
Voltage (mVoltage) 3600 3000
RXP (uW) 1995 10
TXP (uW) 1995 126
Current (mAmp) 70 1
QSFP HT Temperature (Centigrade) 85 -5
Voltage (mVoltage) 3600 2970
RXP (uW) 2180 44
TXP (uW) 0 0
Current (mAmp) 10 1
10GSWL KA Temperature (Centigrade) 90 -5
Voltage (mVoltage) 3600 3000
RXP (uW) 1999 30
TXP (uW) 1999 125
Current (mAmp) 10 3
10GLWL KD Temperature (Centigrade) 90 -5
Voltage (mVoltage) 3600 2970
RXP (uW) 2230 14
TXP (uW) 2230 60
Current (mAmp) 95 10
Others N/A Temperature (Centigrade) 85 -10
Voltage (mVoltage) 3630 2970
RXP (uW) 5000 0
TXP (uW) 5000 0
Current (mAmp) 50 0
Fabric Watch Administrator’s Guide 5353-1002153-01
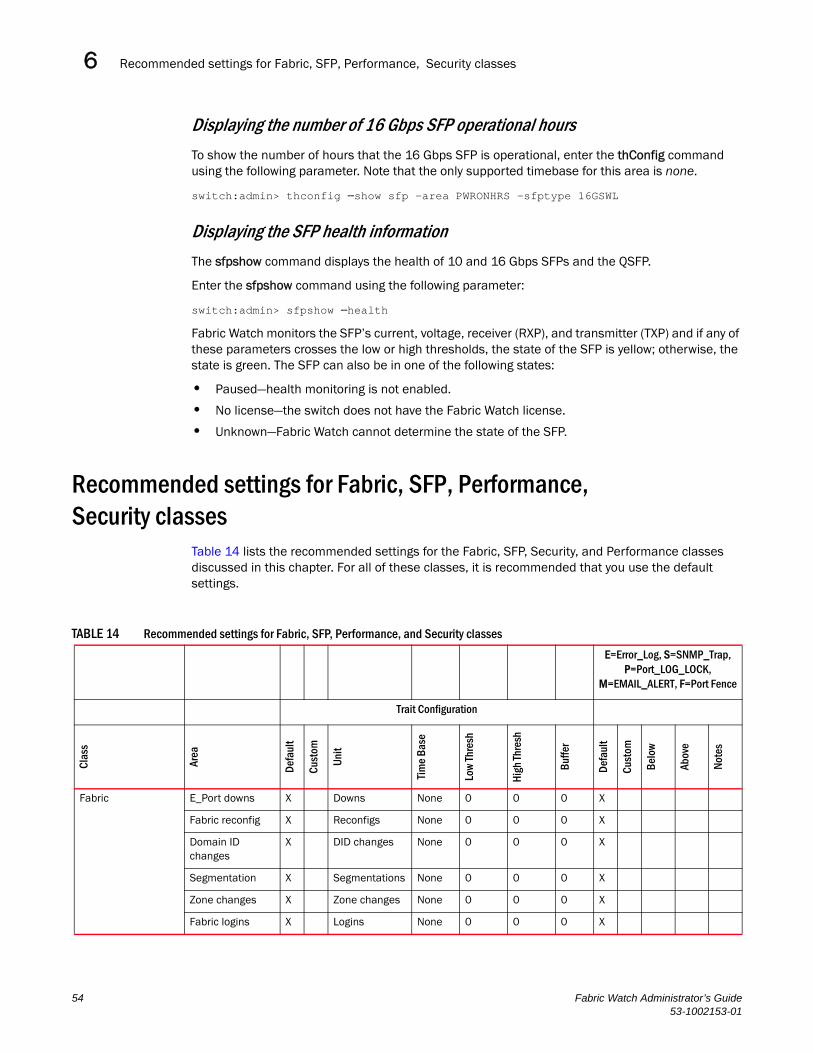
Recommended settings for Fabric, SFP, Performance, Security classes6
Displaying the number of 16 Gbps SFP operational hours
To show the number of hours that the 16 Gbps SFP is operational, enter the thConfig command using the following parameter. Note that the only supported timebase for this area is none.
switch:admin> thconfig --show sfp -area PWRONHRS -sfptype 16GSWL
Displaying the SFP health information
The sfpshow command displays the health of 10 and 16 Gbps SFPs and the QSFP.
Enter the sfpshow command using the following parameter:
switch:admin> sfpshow --health
Fabric Watch monitors the SFP’s current, voltage, receiver (RXP), and transmitter (TXP) and if any of these parameters crosses the low or high thresholds, the state of the SFP is yellow; otherwise, the state is green. The SFP can also be in one of the following states:
• Paused—health monitoring is not enabled.
• No license—the switch does not have the Fabric Watch license.
• Unknown—Fabric Watch cannot determine the state of the SFP.
Recommended settings for Fabric, SFP, Performance, Security classes
Table 14 lists the recommended settings for the Fabric, SFP, Security, and Performance classes discussed in this chapter. For all of these classes, it is recommended that you use the default settings.
TABLE 14 Recommended settings for Fabric, SFP, Performance, and Security classes
E=Error_Log, S=SNMP_Trap, P=Port_LOG_LOCK,
M=EMAIL_ALERT, F=Port Fence
Trait Configuration
Clas
s
Area
Defa
ult
Cust
om
Unit
Tim
e Ba
se
Low
Thre
sh
High
Thre
sh
Buffe
r
Defa
ult
Cust
om
Belo
w
Abov
e
Note
s
Fabric E_Port downs X Downs None 0 0 0 X
Fabric reconfig X Reconfigs None 0 0 0 X
Domain ID changes
X DID changes None 0 0 0 X
Segmentation X Segmentations None 0 0 0 X
Zone changes X Zone changes None 0 0 0 X
Fabric logins X Logins None 0 0 0 X
54 Fabric Watch Administrator’s Guide53-1002153-01
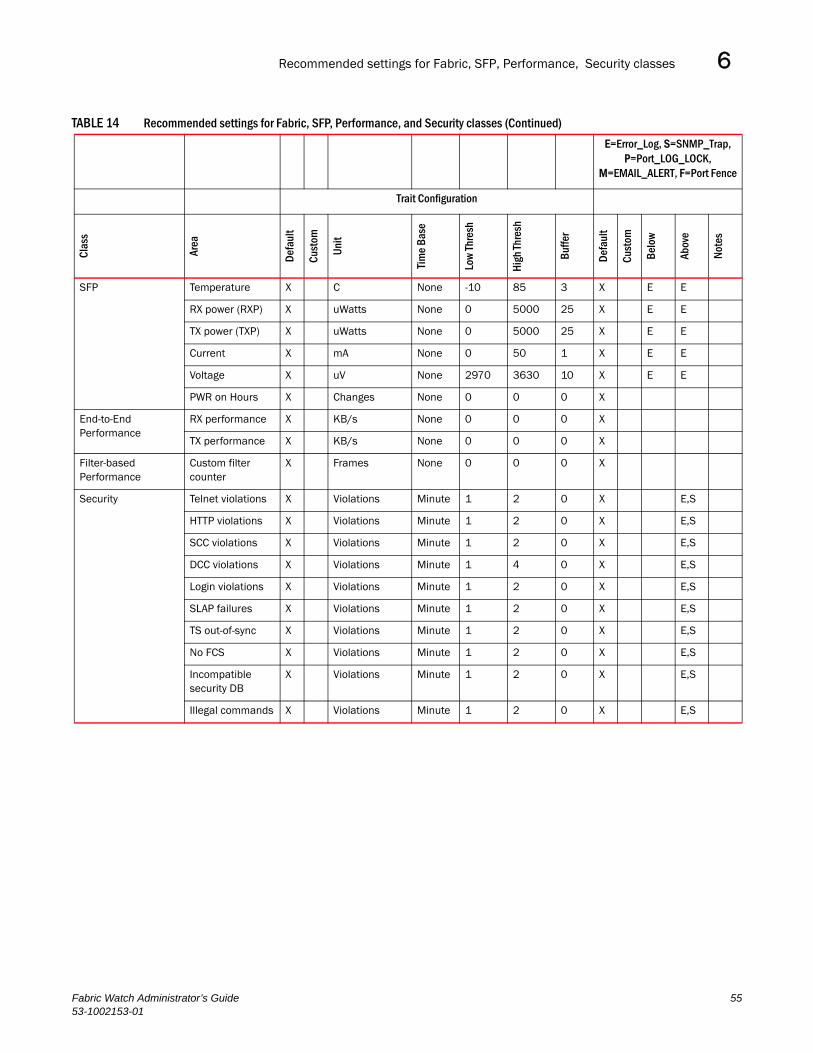
Recommended settings for Fabric, SFP, Performance, Security classes 6
SFP Temperature X C None -10 85 3 X E E
RX power (RXP) X uWatts None 0 5000 25 X E E
TX power (TXP) X uWatts None 0 5000 25 X E E
Current X mA None 0 50 1 X E E
Voltage X uV None 2970 3630 10 X E E
PWR on Hours X Changes None 0 0 0 X
End-to-End Performance
RX performance X KB/s None 0 0 0 X
TX performance X KB/s None 0 0 0 X
Filter-based Performance
Custom filter counter
X Frames None 0 0 0 X
Security Telnet violations X Violations Minute 1 2 0 X E,S
HTTP violations X Violations Minute 1 2 0 X E,S
SCC violations X Violations Minute 1 2 0 X E,S
DCC violations X Violations Minute 1 4 0 X E,S
Login violations X Violations Minute 1 2 0 X E,S
SLAP failures X Violations Minute 1 2 0 X E,S
TS out-of-sync X Violations Minute 1 2 0 X E,S
No FCS X Violations Minute 1 2 0 X E,S
Incompatible security DB
X Violations Minute 1 2 0 X E,S
Illegal commands X Violations Minute 1 2 0 X E,S
TABLE 14 Recommended settings for Fabric, SFP, Performance, and Security classes (Continued)
E=Error_Log, S=SNMP_Trap, P=Port_LOG_LOCK,
M=EMAIL_ALERT, F=Port Fence
Trait Configuration
Clas
s
Area
Defa
ult
Cust
om
Unit
Tim
e Ba
se
Low
Thre
sh
High
Thre
sh
Buffe
r
Defa
ult
Cust
om
Belo
w
Abov
e
Note
s
Fabric Watch Administrator’s Guide 5553-1002153-01

Recommended settings for Fabric, SFP, Performance, Security classes6
56 Fabric Watch Administrator’s Guide53-1002153-01
Fabric Watch Administrator’s Guide53-1002153-01
Chapter
7
Port MonitoringIn this chapter•Port class areas . . . . . . . . . . . . . . . . . . . . . . . . . . . . . . . . . . . . . . . . . . . . . . . . 57
•Port class guidelines and default settings. . . . . . . . . . . . . . . . . . . . . . . . . . . 58
•Port configuration . . . . . . . . . . . . . . . . . . . . . . . . . . . . . . . . . . . . . . . . . . . . . . 60
•portThConfig command procedures. . . . . . . . . . . . . . . . . . . . . . . . . . . . . . . . 61
•Port fencing . . . . . . . . . . . . . . . . . . . . . . . . . . . . . . . . . . . . . . . . . . . . . . . . . . . 70
•Recommended port configuration settings . . . . . . . . . . . . . . . . . . . . . . . . . . 74
Port class areasTable 15 lists and describes the Fabric Watch areas in the Port class. You can use the portThConfig command to configure the Port class. Port setting guidelines and specific examples of portThConfig configurations are presented later in this chapter.
NOTEFabric Watch monitors and reports the status of physical and virtual FC ports. Physical GbE ports and ISCSI ports are not monitored and are not included in the Port Class area.
TABLE 15 Port class areas
Area Description
Cyclic redundancy check (CRC)
The number of times an invalid cyclic redundancy check error occurs on a port or a frame that computes to an invalid CRC. Invalid CRCs can represent noise on the network. Such frames are recoverable by retransmission. Invalid CRCs can indicate a potential hardware problem.
Invalid transmission words (ITW)
The number of times an invalid transmission word error occurs on a port. A word did not transmit successfully, resulting in encoding errors. Invalid word messages usually indicate a hardware problem.
Class 3 discards (C3TX_TO) The number of Class 3 discards frames because of time outs.
Link loss (LOS) The number of times a link failure occurs on a port or sends or receives NOS. Both physical and hardware problems can cause link failures. Link failures also frequently occur due to a loss of synchronization or a loss of signal.
Signal loss The number of times that a signal loss occurs in a port. Signal loss indicates that no data is moving through the port. A loss of signal usually indicates a hardware problem.
Sync loss The number of times a synchronization error occurs on the port. Two devices failed to communicate at the same speed. Synchronization errors are always accompanied by a link failure. Loss of synchronization errors frequently occur due to a faulty SFP or cable.
Packet loss (VE_Port only) The number of packets routed through a port exceeds the port bandwidth.
57
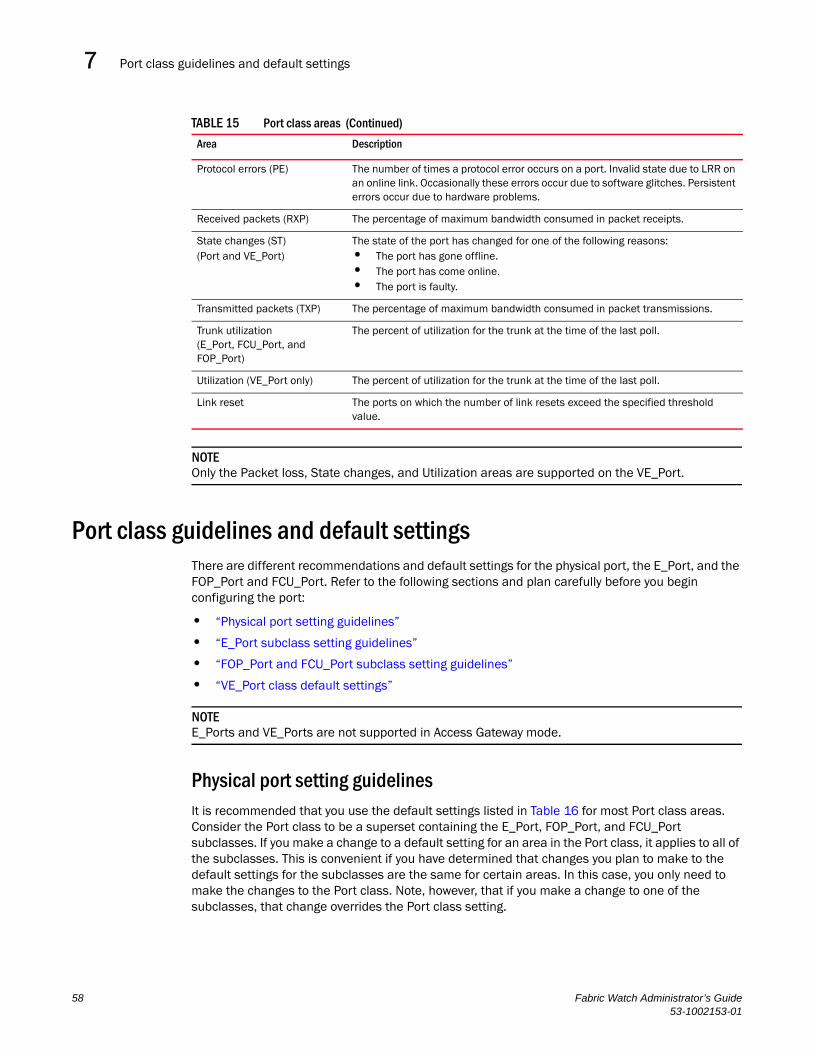
Port class guidelines and default settings7
NOTEOnly the Packet loss, State changes, and Utilization areas are supported on the VE_Port.
Port class guidelines and default settingsThere are different recommendations and default settings for the physical port, the E_Port, and the FOP_Port and FCU_Port. Refer to the following sections and plan carefully before you begin configuring the port:
• “Physical port setting guidelines”
• “E_Port subclass setting guidelines”
• “FOP_Port and FCU_Port subclass setting guidelines”
• “VE_Port class default settings”
NOTEE_Ports and VE_Ports are not supported in Access Gateway mode.
Physical port setting guidelinesIt is recommended that you use the default settings listed in Table 16 for most Port class areas. Consider the Port class to be a superset containing the E_Port, FOP_Port, and FCU_Port subclasses. If you make a change to a default setting for an area in the Port class, it applies to all of the subclasses. This is convenient if you have determined that changes you plan to make to the default settings for the subclasses are the same for certain areas. In this case, you only need to make the changes to the Port class. Note, however, that if you make a change to one of the subclasses, that change overrides the Port class setting.
Protocol errors (PE) The number of times a protocol error occurs on a port. Invalid state due to LRR on an online link. Occasionally these errors occur due to software glitches. Persistent errors occur due to hardware problems.
Received packets (RXP) The percentage of maximum bandwidth consumed in packet receipts.
State changes (ST)(Port and VE_Port)
The state of the port has changed for one of the following reasons:• The port has gone offline.• The port has come online.• The port is faulty.
Transmitted packets (TXP) The percentage of maximum bandwidth consumed in packet transmissions.
Trunk utilization(E_Port, FCU_Port, and FOP_Port)
The percent of utilization for the trunk at the time of the last poll.
Utilization (VE_Port only) The percent of utilization for the trunk at the time of the last poll.
Link reset The ports on which the number of link resets exceed the specified threshold value.
TABLE 15 Port class areas (Continued)
Area Description
58 Fabric Watch Administrator’s Guide53-1002153-01
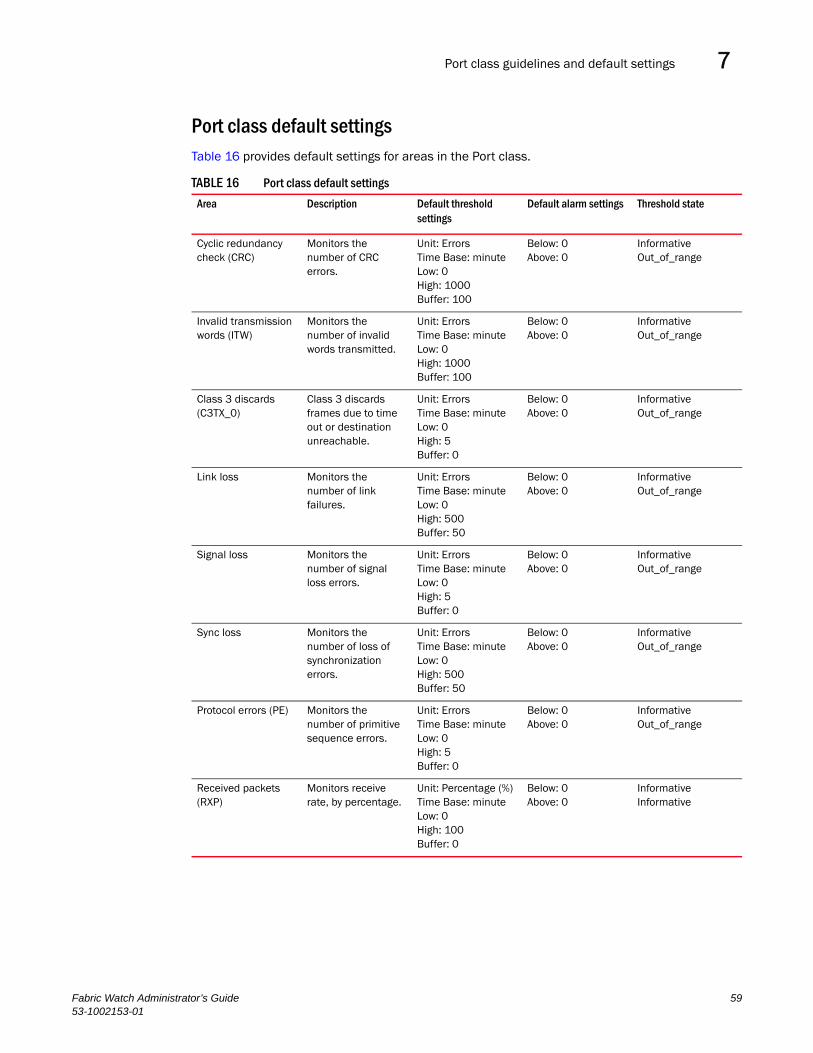
Port class guidelines and default settings 7
Port class default settingsTable 16 provides default settings for areas in the Port class.
TABLE 16 Port class default settings
Area Description Default threshold settings
Default alarm settings Threshold state
Cyclic redundancy check (CRC)
Monitors the number of CRC errors.
Unit: ErrorsTime Base: minuteLow: 0High: 1000Buffer: 100
Below: 0Above: 0
InformativeOut_of_range
Invalid transmission words (ITW)
Monitors the number of invalid words transmitted.
Unit: ErrorsTime Base: minuteLow: 0High: 1000Buffer: 100
Below: 0Above: 0
InformativeOut_of_range
Class 3 discards (C3TX_0)
Class 3 discards frames due to time out or destination unreachable.
Unit: ErrorsTime Base: minuteLow: 0High: 5Buffer: 0
Below: 0Above: 0
InformativeOut_of_range
Link loss Monitors the number of link failures.
Unit: ErrorsTime Base: minuteLow: 0High: 500Buffer: 50
Below: 0Above: 0
InformativeOut_of_range
Signal loss Monitors the number of signal loss errors.
Unit: ErrorsTime Base: minuteLow: 0High: 5Buffer: 0
Below: 0Above: 0
InformativeOut_of_range
Sync loss Monitors the number of loss of synchronization errors.
Unit: ErrorsTime Base: minuteLow: 0High: 500Buffer: 50
Below: 0Above: 0
InformativeOut_of_range
Protocol errors (PE) Monitors the number of primitive sequence errors.
Unit: ErrorsTime Base: minuteLow: 0High: 5Buffer: 0
Below: 0Above: 0
InformativeOut_of_range
Received packets (RXP)
Monitors receive rate, by percentage.
Unit: Percentage (%)Time Base: minuteLow: 0High: 100Buffer: 0
Below: 0Above: 0
InformativeInformative
Fabric Watch Administrator’s Guide 5953-1002153-01
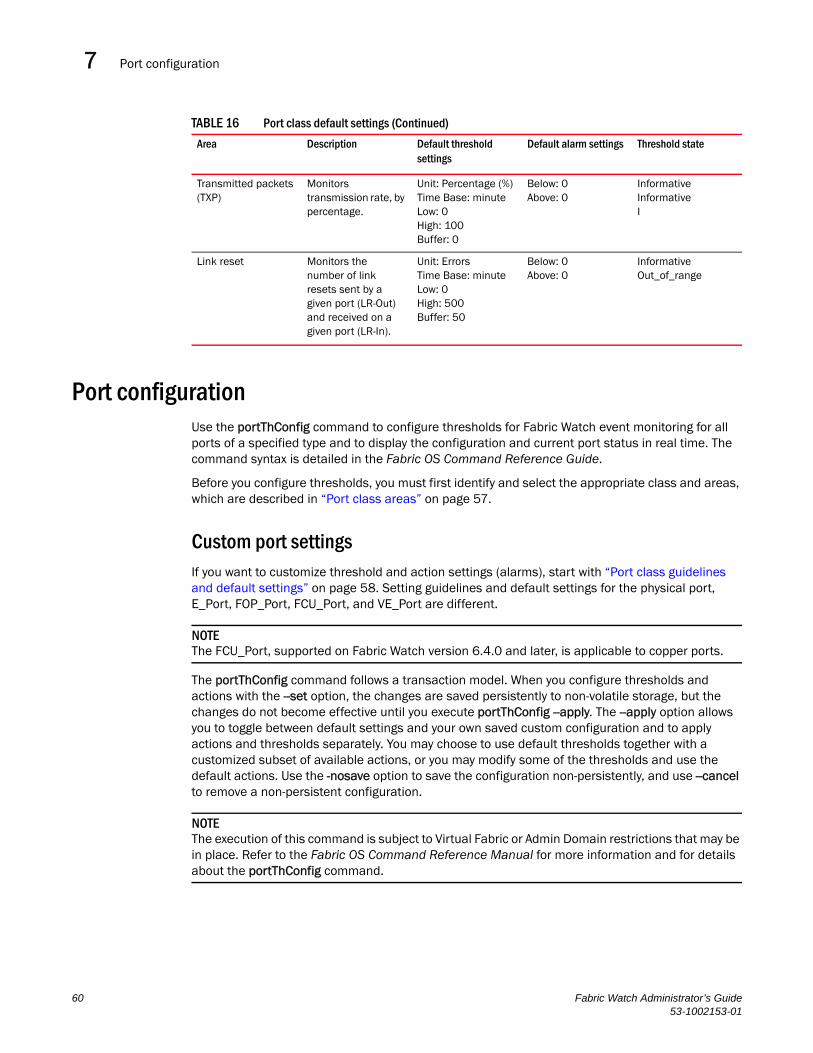
Port configuration7
Port configurationUse the portThConfig command to configure thresholds for Fabric Watch event monitoring for all ports of a specified type and to display the configuration and current port status in real time. The command syntax is detailed in the Fabric OS Command Reference Guide.
Before you configure thresholds, you must first identify and select the appropriate class and areas, which are described in “Port class areas” on page 57.
Custom port settingsIf you want to customize threshold and action settings (alarms), start with “Port class guidelines and default settings” on page 58. Setting guidelines and default settings for the physical port, E_Port, FOP_Port, FCU_Port, and VE_Port are different.
NOTEThe FCU_Port, supported on Fabric Watch version 6.4.0 and later, is applicable to copper ports.
The portThConfig command follows a transaction model. When you configure thresholds and actions with the --set option, the changes are saved persistently to non-volatile storage, but the changes do not become effective until you execute portThConfig --apply. The --apply option allows you to toggle between default settings and your own saved custom configuration and to apply actions and thresholds separately. You may choose to use default thresholds together with a customized subset of available actions, or you may modify some of the thresholds and use the default actions. Use the -nosave option to save the configuration non-persistently, and use --cancel to remove a non-persistent configuration.
NOTEThe execution of this command is subject to Virtual Fabric or Admin Domain restrictions that may be in place. Refer to the Fabric OS Command Reference Manual for more information and for details about the portThConfig command.
Transmitted packets (TXP)
Monitors transmission rate, by percentage.
Unit: Percentage (%)Time Base: minuteLow: 0High: 100Buffer: 0
Below: 0Above: 0
InformativeInformativeI
Link reset Monitors the number of link resets sent by a given port (LR-Out) and received on a given port (LR-In).
Unit: ErrorsTime Base: minuteLow: 0High: 500 Buffer: 50
Below: 0Above: 0
InformativeOut_of_range
TABLE 16 Port class default settings (Continued)
Area Description Default threshold settings
Default alarm settings Threshold state
60 Fabric Watch Administrator’s Guide53-1002153-01
portThConfig command procedures 7
Using the nosave commandThe nosave command prevents the configuration changes from being saved persistently. This option allows you to make and view changes without overwriting the saved configuration.
CAUTION
When you use --set with the --nosave option and the switch reboots, your changes are lost.
portThConfig command proceduresThe following sections provides specific examples for the Port class. See “Port class guidelines and default settings” on page 58 for recommendations on how to set areas for the physical port, the E_Port, the FOP_Port, and the FCU_Port.
Port type: physical portThe Port class is a superset containing the E_Port, FOP_Port, and FCU_Port subclasses. In general, use the default settings listed in Table 16, or use the generic Port class to configure an area whose settings are common to one or more of the port subclasses; for example, configuring all physical ports to monitor invalid CRC counts. In most cases, the default settings are adequate for the physical port.
Configuring all physical ports to monitor invalid CRC counts
Invalid Cyclic Redundancy Check (CRC) count errors on a port can represent noise on the network or a potential hardware problem.
1. Enter the portThConfig command using the following parameters:
switch:admin> portthconfig --set port -area crc -highthreshold -value 100 -trigger above -action raslog,email,snmp -buffer 0
switch:admin> portthconfig --set port -area crc -lowthreshold -value 1 -trigger above -action raslog -buffer 0
• In this example, the alarms are set at two points: a low threshold of 1 and a high threshold of 100 (the default is 1000). The goal is to be notified as the number of invalid CRCs per minute rises above the low boundary and again when it rises above the high boundary.
• Triggers specify actions for below the high threshold. Here, the trigger for both is above.
• Set the action to take when a trigger occurs. Here, for the high threshold, log the event in the raslog, send an e-mail, and issue an SNMP trap. For the low threshold, only log the event in the raslog.
• Set the buffer setting to 0 (the default is 100). Note that if you do not specify the buffer value, Fabric Watch automatically re-calculates the buffer.
• Apply the new custom settings so they become effective.
2. Apply the new custom settings so they become effective:
Fabric Watch Administrator’s Guide 6153-1002153-01
portThConfig command procedures7
switch:admin> portthconfig --apply port -area crc -action cust -thresh_level custom
3. To display the port threshold configuration for the Port class and all areas:
switch:admin>portthconfig --show port
Configuring all physical ports to monitor for invalid transmission words
Invalid transmission words (ITW) occur when a word does not transmit successfully, resulting in encoding errors. Invalid word messages usually indicate a hardware problem.
1. Enter the portThConfig command using the following parameters:
switch:admin> portthconfig --set port -area itw -highthreshold -value 40 -trigger above -action raslog,snmp, --buffer 0
switch:admin> portthconfig --set port -area itw -lowthreshold -value 25 -trigger above -action raslog --buffer 0
• In this example, the alarms are set at two points: a low threshold of 25 and a high threshold of 40. The goal is to be notified as the number of invalid transmission words per minute rises above the low boundary and again when it rises above the high boundary.
• Triggers specify actions for in-range port behavior. Here, the trigger for both is above.
• Set the action to take when a trigger occurs. Here, for the low threshold, only log the event in the raslog. For the high threshold, log the event in the raslog and issue an SNMP trap.
• Set the buffer to 0 (the default is 100).
2. Apply the new custom settings so they become effective.
switch:admin> portthconfig --apply port -area itw -action cust -thresh_level custom
3. To display the port threshold configuration for the Port class and all areas:
switch:admin>portthconfig --show port
Pausing and continuing monitoring
To pause the monitoring of a class, area, and port or index, enter the portThConfig command using the following parameters. You can separate multiple, individual classes and areas with a comma; you cannot, however, specify all for all classes and areas.
NOTEYou must first enable the Brocade 10 Gbps SFP and 16 Gbps QSFP with the thMonitor command before the portThConfig pause and continue commands can take effect. See “Monitoring the SFP and QSFP” on page 51 for instructions.
switch:admin> portthconfig --pause | --continue <class> -area <area_type> -port <[slot/]port>
62 Fabric Watch Administrator’s Guide53-1002153-01
portThConfig command procedures 7
E_Port subclass setting guidelinesE_Port guidelines for the areas listed below represent a more aggressive approach in most areas, because failing or failed E_Ports in a large fabric can cause serious fabric-wide issues if not detected early.
NOTEThe E_Port class represents ports connected to another switch.
• Area: Link Failure Count
You want to be immediately notified if an E_Port loses a link, so set the alarm configuration to Changed for this area.
• Area: Loss of Synchronization
Change the default high boundary from 500 to 45 (per minute) and make sure the Buffer setting is set to 0 (the default).
• Area: Invalid Transmission Words
Change the default high boundary from 1000 to 40 (per minute) and make sure the Buffer setting is set to 0 (the default). Excessive invalid transmission words on E_ports leads to fabric congestion and possible frame drops if left unchecked; therefore, set the alarm to fence the port. Refer to “Port type: E_Port, FOP_Port, or FCU_Port” on page 69 for instructions.
• Area: Invalid Cyclic Redundancy Check (CRC) Count
Change the default high boundary from 1000 to 20 (per minute) and make sure the Buffer setting is set to 0 (the default is 100). Excessive CRCs on E_ports lead to fabric congestion and possible frame drops if left unchecked; therefore, set the alarm to fence the port. See “Port type: E_Port, FOP_Port, or FCU_Port” on page 69 for instructions.
• Areas: Receive (Rx) and Transmit (Tx) Performance
Rx and Tx Performance areas are used to monitor the bandwidth utilization of the interswitch links (ISLs) in the fabric. Set the high boundary to 75 percent and the alarms to Above and In-Between conditions. These settings indicate if the 75 percent threshold is exceeded and for how long. With this information, you can determine if additional ISL bandwidth is required in the fabric.
• Area: Link Reset
Set the alarm to fence the port. This prevents a “flapping” E_Port, which could lead to congestion or frame loss. See “Port type: E_Port, FOP_Port, or FCU_Port” on page 69 for instructions.
• Area: Class 3 (C3) Discards
Unlike the other areas, take a conservative approach for the C3 Discards area. Use the default settings and configure the alarms for Above. The goal is to determine the high boundary at which the port would be fenced, so monitor the high boundary and change the settings accordingly.
Fabric Watch Administrator’s Guide 6353-1002153-01
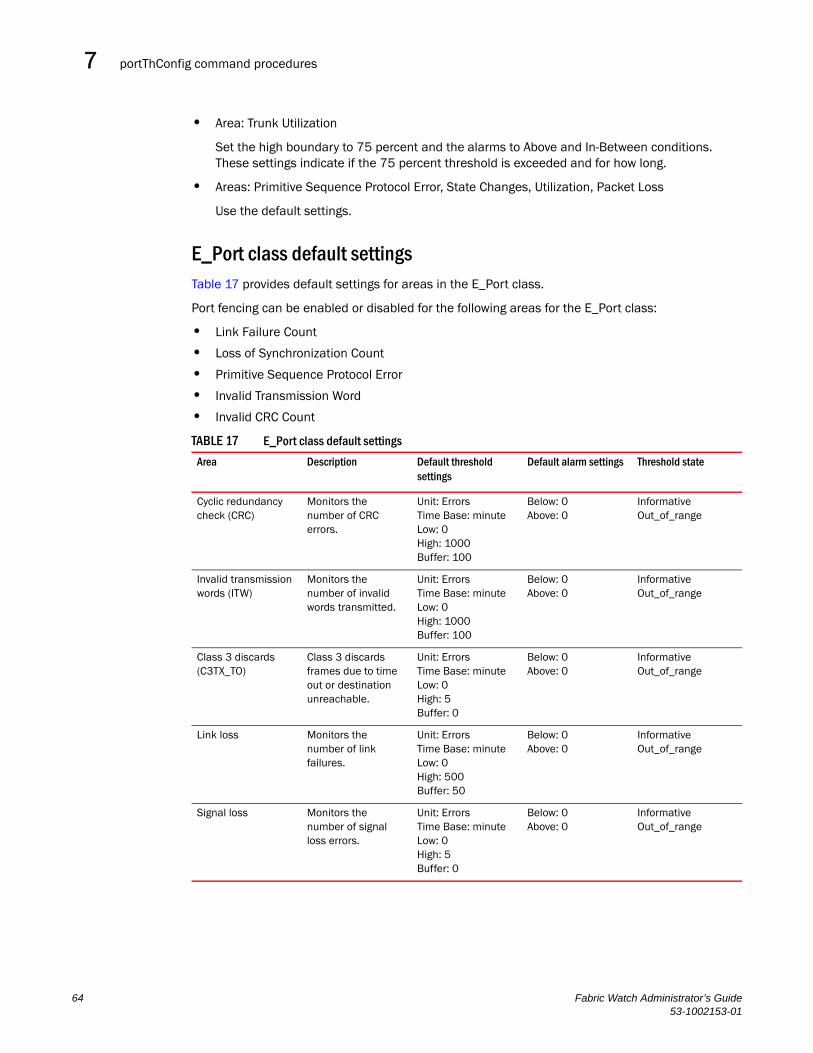
portThConfig command procedures7
• Area: Trunk Utilization
Set the high boundary to 75 percent and the alarms to Above and In-Between conditions. These settings indicate if the 75 percent threshold is exceeded and for how long.
• Areas: Primitive Sequence Protocol Error, State Changes, Utilization, Packet Loss
Use the default settings.
E_Port class default settingsTable 17 provides default settings for areas in the E_Port class.
Port fencing can be enabled or disabled for the following areas for the E_Port class:
• Link Failure Count
• Loss of Synchronization Count
• Primitive Sequence Protocol Error
• Invalid Transmission Word
• Invalid CRC Count
TABLE 17 E_Port class default settings
Area Description Default threshold settings
Default alarm settings Threshold state
Cyclic redundancy check (CRC)
Monitors the number of CRC errors.
Unit: ErrorsTime Base: minuteLow: 0High: 1000Buffer: 100
Below: 0Above: 0
InformativeOut_of_range
Invalid transmission words (ITW)
Monitors the number of invalid words transmitted.
Unit: ErrorsTime Base: minuteLow: 0High: 1000Buffer: 100
Below: 0Above: 0
InformativeOut_of_range
Class 3 discards (C3TX_TO)
Class 3 discards frames due to time out or destination unreachable.
Unit: ErrorsTime Base: minuteLow: 0High: 5Buffer: 0
Below: 0Above: 0
InformativeOut_of_range
Link loss Monitors the number of link failures.
Unit: ErrorsTime Base: minuteLow: 0High: 500Buffer: 50
Below: 0Above: 0
InformativeOut_of_range
Signal loss Monitors the number of signal loss errors.
Unit: ErrorsTime Base: minuteLow: 0High: 5Buffer: 0
Below: 0Above: 0
InformativeOut_of_range
64 Fabric Watch Administrator’s Guide53-1002153-01
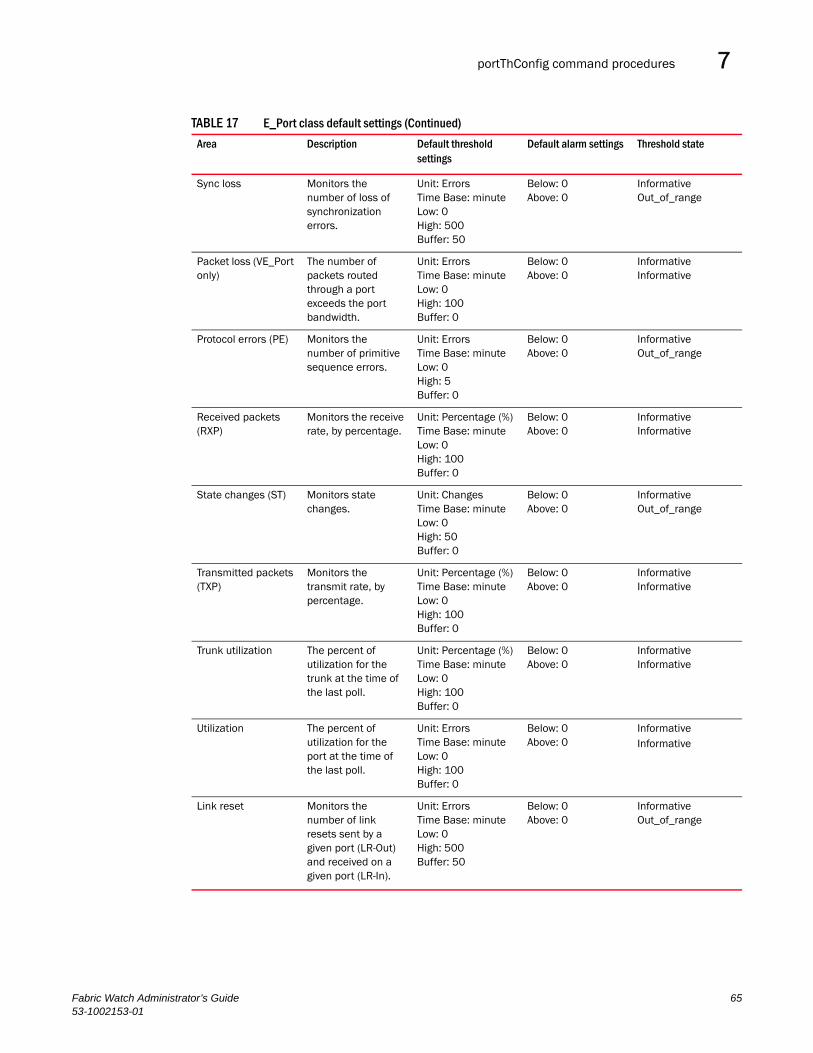
portThConfig command procedures 7
Sync loss Monitors the number of loss of synchronization errors.
Unit: ErrorsTime Base: minuteLow: 0High: 500Buffer: 50
Below: 0Above: 0
InformativeOut_of_range
Packet loss (VE_Port only)
The number of packets routed through a port exceeds the port bandwidth.
Unit: ErrorsTime Base: minuteLow: 0High: 100Buffer: 0
Below: 0Above: 0
InformativeInformative
Protocol errors (PE) Monitors the number of primitive sequence errors.
Unit: ErrorsTime Base: minuteLow: 0High: 5Buffer: 0
Below: 0Above: 0
InformativeOut_of_range
Received packets (RXP)
Monitors the receive rate, by percentage.
Unit: Percentage (%)Time Base: minuteLow: 0High: 100Buffer: 0
Below: 0Above: 0
InformativeInformative
State changes (ST) Monitors state changes.
Unit: ChangesTime Base: minuteLow: 0High: 50Buffer: 0
Below: 0Above: 0
InformativeOut_of_range
Transmitted packets (TXP)
Monitors the transmit rate, by percentage.
Unit: Percentage (%)Time Base: minuteLow: 0 High: 100Buffer: 0
Below: 0Above: 0
InformativeInformative
Trunk utilization The percent of utilization for the trunk at the time of the last poll.
Unit: Percentage (%)Time Base: minuteLow: 0High: 100Buffer: 0
Below: 0Above: 0
InformativeInformative
Utilization The percent of utilization for the port at the time of the last poll.
Unit: ErrorsTime Base: minuteLow: 0High: 100Buffer: 0
Below: 0Above: 0
InformativeInformative
Link reset Monitors the number of link resets sent by a given port (LR-Out) and received on a given port (LR-In).
Unit: ErrorsTime Base: minuteLow: 0High: 500 Buffer: 50
Below: 0Above: 0
InformativeOut_of_range
TABLE 17 E_Port class default settings (Continued)
Area Description Default threshold settings
Default alarm settings Threshold state
Fabric Watch Administrator’s Guide 6553-1002153-01
portThConfig command procedures7
FOP_Port and FCU_Port subclass setting guidelinesFOP_Port and FCU_Port guidelines for the areas listed below represent a more aggressive approach in most areas.
NOTEThe settings in these subclasses include settings for the host bus adapter (HBA) ports as well as the storage ports.
• Areas: Link Failure Count, Loss of Synchronization Count
Change the default high boundary from 500 to 15 (per minute) for Link Failure Count and from 500 to 45 (per minute) for Loss of Synchronization Count. Leave the Buffer setting to 0 (the default). Set the alarm configurations to send alerts to both the error log and SNMP. These settings are the same for an HBA port or a storage port.
• Area: Loss of Signal Count
Unlike the other areas, take a conservative approach for the Loss of Signal Count area. Change the default high boundary from 5 to 45 (per minute) and set the alarm configuration to send alerts to both the error log and SNMP.
• Areas: Invalid Transmission Words, Invalid CRC Count
For these two classes, the high boundary settings are split. For Host devices, keep the defaults of 1000 (per minute) and buffer of 100. For storage devices, tighten the boundaries substantially: change the default high boundary for Invalid Transmission Words to 80, and change the high boundary for Invalid CRC Count to 40 (per minute).
Hosts and HBAs reboot so do not set alerts for these devices. Storage devices, however, should not be rebooting, so you should set the alarm to alert more frequently.
Excessive invalid words or CRCs on F/FL_ports lead to fabric congestion and possible frame drops if left unchecked; therefore, set the alarm to fence the port. See “Port type: E_Port, FOP_Port, or FCU_Port” on page 69 for instructions. In addition, set the alarm configurations to send alerts to both the error log and SNMP.
• Areas: Receive (Rx) Performance, Transmit (Tx) Performance
Rx and Tx Performance areas are used to monitor the bandwidth utilization of the device ports in the fabric. Set the high boundary to 85 percent and the alarms to Above and In-Between conditions. The same levels should be set on both Host and storage device ports.
NOTEWith the increased use of virtual environments, alerts from device ports are increasing more than ever in the past. This provides a good gauge as to the overall bandwidth requirement changes and utilization and could indicate that additional ISL trunks are required.
• Area: Link Reset
The goal of the Link Reset area is to avoid excessive link resets which can cause back pressure in the fabric. The Link Reset area is new; therefore, recommended settings are not available. Keep the default settings, monitor the results, and adjust your settings accordingly.
66 Fabric Watch Administrator’s Guide53-1002153-01
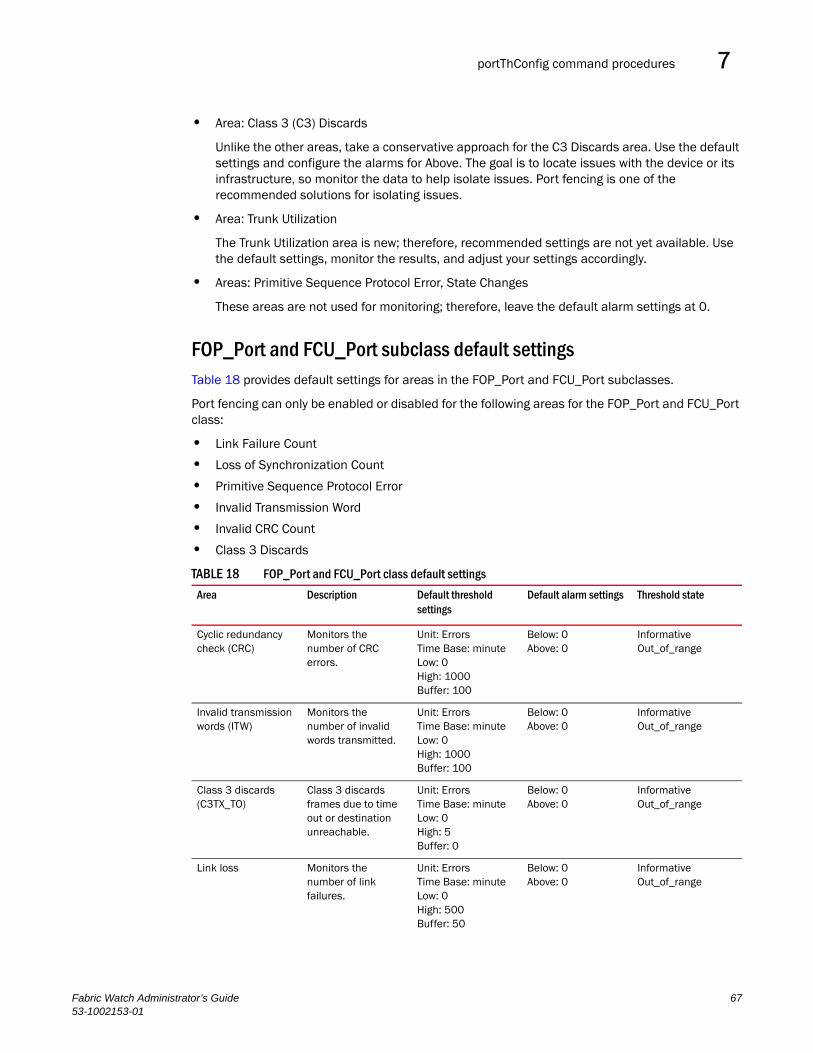
portThConfig command procedures 7
• Area: Class 3 (C3) Discards
Unlike the other areas, take a conservative approach for the C3 Discards area. Use the default settings and configure the alarms for Above. The goal is to locate issues with the device or its infrastructure, so monitor the data to help isolate issues. Port fencing is one of the recommended solutions for isolating issues.
• Area: Trunk Utilization
The Trunk Utilization area is new; therefore, recommended settings are not yet available. Use the default settings, monitor the results, and adjust your settings accordingly.
• Areas: Primitive Sequence Protocol Error, State Changes
These areas are not used for monitoring; therefore, leave the default alarm settings at 0.
FOP_Port and FCU_Port subclass default settingsTable 18 provides default settings for areas in the FOP_Port and FCU_Port subclasses.
Port fencing can only be enabled or disabled for the following areas for the FOP_Port and FCU_Port class:
• Link Failure Count
• Loss of Synchronization Count
• Primitive Sequence Protocol Error
• Invalid Transmission Word
• Invalid CRC Count
• Class 3 Discards
TABLE 18 FOP_Port and FCU_Port class default settings
Area Description Default threshold settings
Default alarm settings Threshold state
Cyclic redundancy check (CRC)
Monitors the number of CRC errors.
Unit: ErrorsTime Base: minuteLow: 0High: 1000Buffer: 100
Below: 0Above: 0
InformativeOut_of_range
Invalid transmission words (ITW)
Monitors the number of invalid words transmitted.
Unit: ErrorsTime Base: minuteLow: 0High: 1000Buffer: 100
Below: 0Above: 0
InformativeOut_of_range
Class 3 discards (C3TX_TO)
Class 3 discards frames due to time out or destination unreachable.
Unit: ErrorsTime Base: minuteLow: 0High: 5Buffer: 0
Below: 0Above: 0
InformativeOut_of_range
Link loss Monitors the number of link failures.
Unit: ErrorsTime Base: minuteLow: 0High: 500Buffer: 50
Below: 0Above: 0
InformativeOut_of_range
Fabric Watch Administrator’s Guide 6753-1002153-01
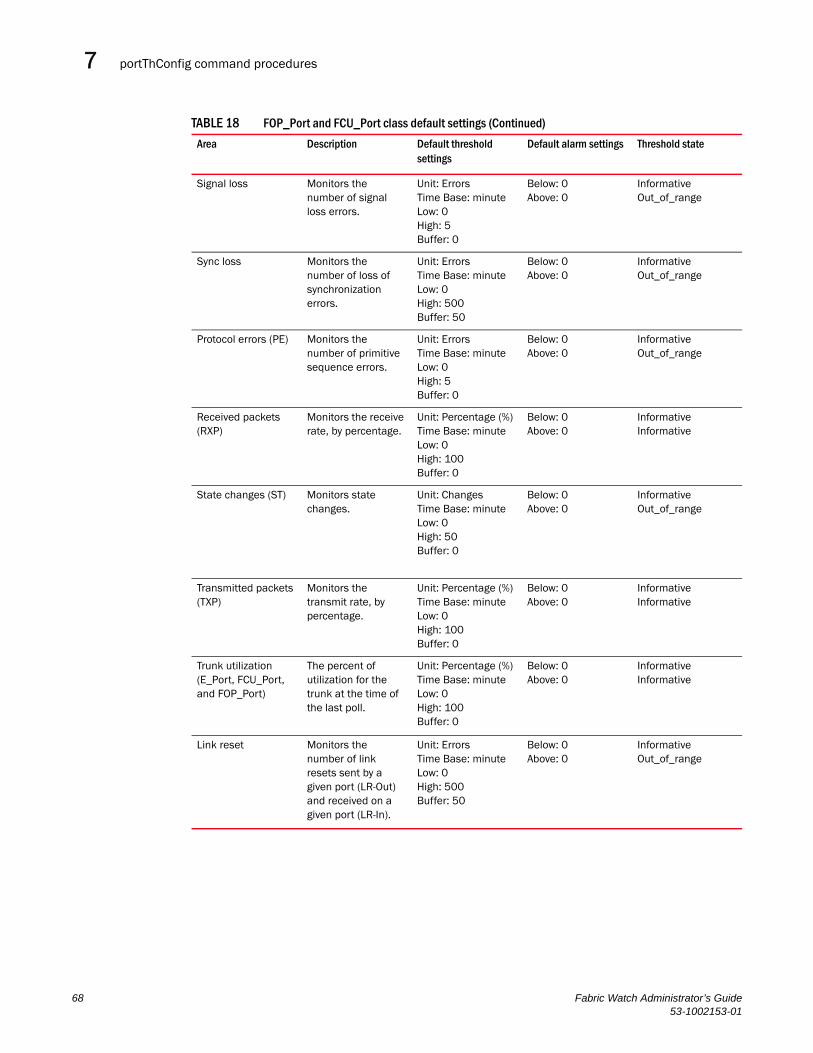
portThConfig command procedures7
Signal loss Monitors the number of signal loss errors.
Unit: ErrorsTime Base: minuteLow: 0High: 5Buffer: 0
Below: 0Above: 0
InformativeOut_of_range
Sync loss Monitors the number of loss of synchronization errors.
Unit: ErrorsTime Base: minuteLow: 0High: 500Buffer: 50
Below: 0Above: 0
InformativeOut_of_range
Protocol errors (PE) Monitors the number of primitive sequence errors.
Unit: ErrorsTime Base: minuteLow: 0High: 5Buffer: 0
Below: 0Above: 0
InformativeOut_of_range
Received packets (RXP)
Monitors the receive rate, by percentage.
Unit: Percentage (%)Time Base: minuteLow: 0High: 100Buffer: 0
Below: 0Above: 0
InformativeInformative
State changes (ST) Monitors state changes.
Unit: ChangesTime Base: minuteLow: 0High: 50Buffer: 0
Below: 0Above: 0
InformativeOut_of_range
Transmitted packets (TXP)
Monitors the transmit rate, by percentage.
Unit: Percentage (%)Time Base: minuteLow: 0High: 100Buffer: 0
Below: 0Above: 0
InformativeInformative
Trunk utilization (E_Port, FCU_Port, and FOP_Port)
The percent of utilization for the trunk at the time of the last poll.
Unit: Percentage (%)Time Base: minuteLow: 0High: 100Buffer: 0
Below: 0Above: 0
InformativeInformative
Link reset Monitors the number of link resets sent by a given port (LR-Out) and received on a given port (LR-In).
Unit: ErrorsTime Base: minuteLow: 0High: 500 Buffer: 50
Below: 0Above: 0
InformativeOut_of_range
TABLE 18 FOP_Port and FCU_Port class default settings (Continued)
Area Description Default threshold settings
Default alarm settings Threshold state
68 Fabric Watch Administrator’s Guide53-1002153-01
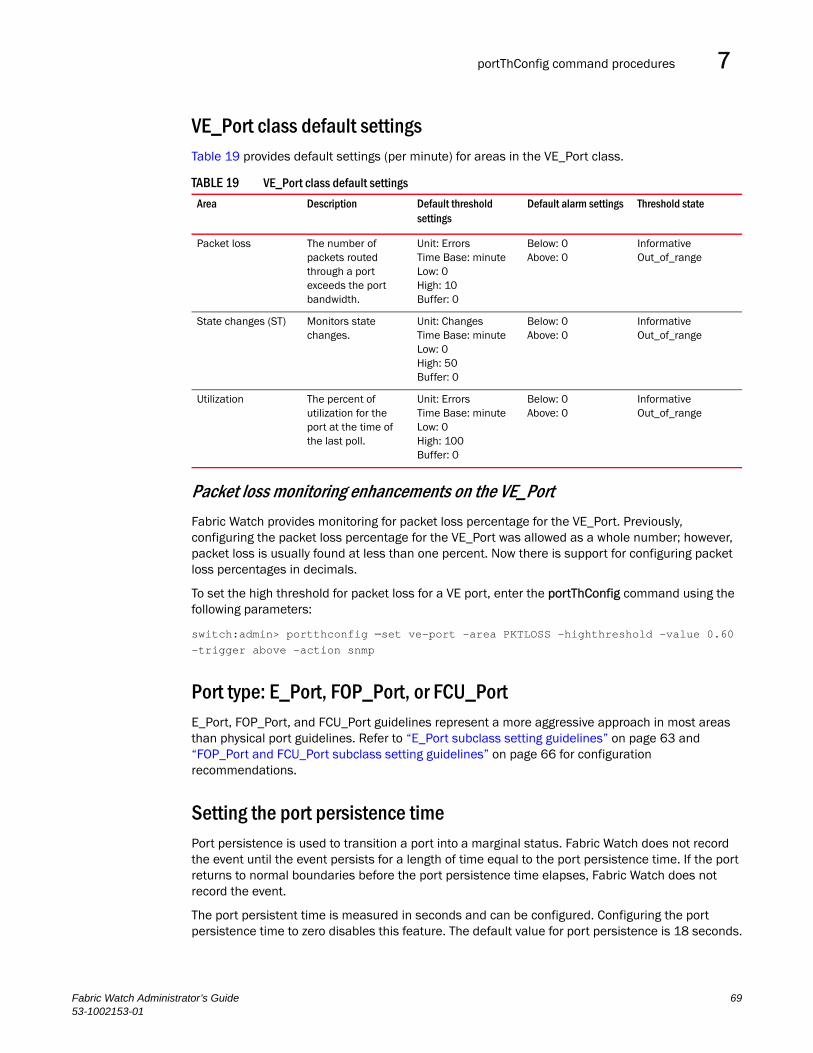
portThConfig command procedures 7
VE_Port class default settingsTable 19 provides default settings (per minute) for areas in the VE_Port class.
Packet loss monitoring enhancements on the VE_Port
Fabric Watch provides monitoring for packet loss percentage for the VE_Port. Previously, configuring the packet loss percentage for the VE_Port was allowed as a whole number; however, packet loss is usually found at less than one percent. Now there is support for configuring packet loss percentages in decimals.
To set the high threshold for packet loss for a VE port, enter the portThConfig command using the following parameters:
switch:admin> portthconfig --set ve-port -area PKTLOSS -highthreshold -value 0.60 -trigger above -action snmp
Port type: E_Port, FOP_Port, or FCU_PortE_Port, FOP_Port, and FCU_Port guidelines represent a more aggressive approach in most areas than physical port guidelines. Refer to “E_Port subclass setting guidelines” on page 63 and “FOP_Port and FCU_Port subclass setting guidelines” on page 66 for configuration recommendations.
Setting the port persistence timePort persistence is used to transition a port into a marginal status. Fabric Watch does not record the event until the event persists for a length of time equal to the port persistence time. If the port returns to normal boundaries before the port persistence time elapses, Fabric Watch does not record the event.
The port persistent time is measured in seconds and can be configured. Configuring the port persistence time to zero disables this feature. The default value for port persistence is 18 seconds.
TABLE 19 VE_Port class default settings
Area Description Default threshold settings
Default alarm settings Threshold state
Packet loss The number of packets routed through a port exceeds the port bandwidth.
Unit: ErrorsTime Base: minuteLow: 0High: 10Buffer: 0
Below: 0Above: 0
InformativeOut_of_range
State changes (ST) Monitors state changes.
Unit: ChangesTime Base: minuteLow: 0High: 50Buffer: 0
Below: 0Above: 0
InformativeOut_of_range
Utilization The percent of utilization for the port at the time of the last poll.
Unit: ErrorsTime Base: minuteLow: 0High: 100Buffer: 0
Below: 0Above: 0
InformativeOut_of_range
Fabric Watch Administrator’s Guide 6953-1002153-01
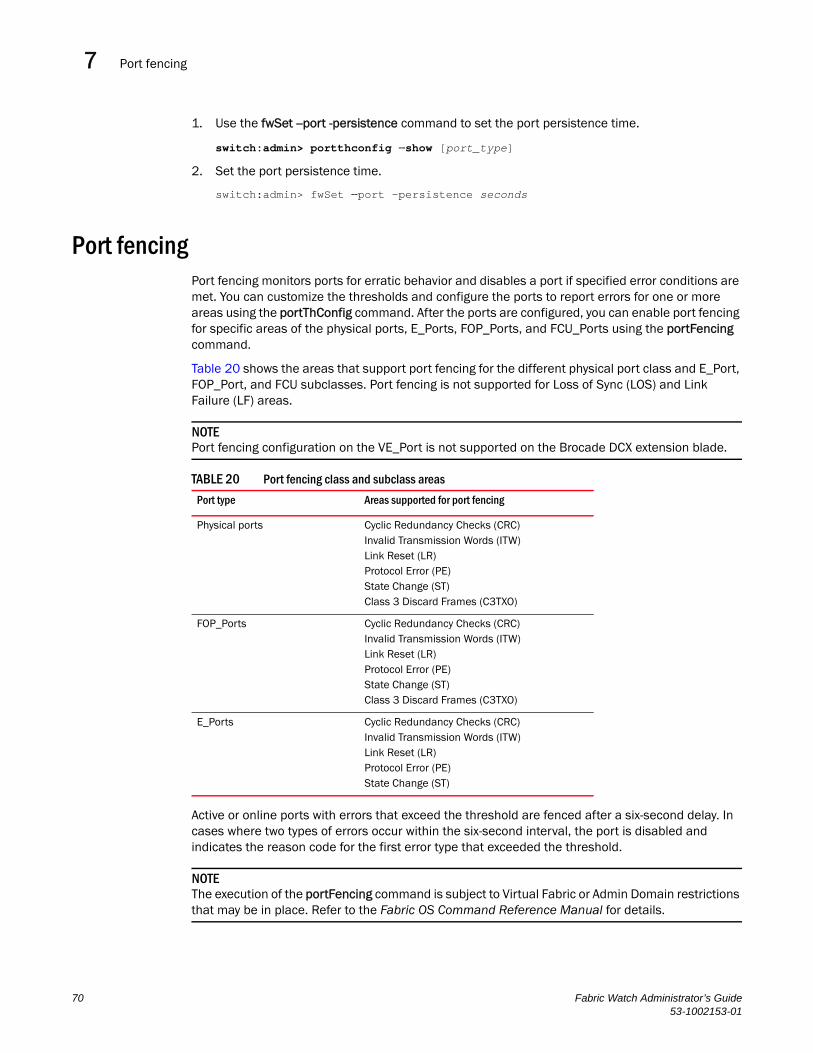
Port fencing7
1. Use the fwSet --port -persistence command to set the port persistence time.
switch:admin> portthconfig --show [port_type]
2. Set the port persistence time.
switch:admin> fwSet --port -persistence seconds
Port fencing Port fencing monitors ports for erratic behavior and disables a port if specified error conditions are met. You can customize the thresholds and configure the ports to report errors for one or more areas using the portThConfig command. After the ports are configured, you can enable port fencing for specific areas of the physical ports, E_Ports, FOP_Ports, and FCU_Ports using the portFencing command.
Table 20 shows the areas that support port fencing for the different physical port class and E_Port, FOP_Port, and FCU subclasses. Port fencing is not supported for Loss of Sync (LOS) and Link Failure (LF) areas.
NOTEPort fencing configuration on the VE_Port is not supported on the Brocade DCX extension blade.
Active or online ports with errors that exceed the threshold are fenced after a six-second delay. In cases where two types of errors occur within the six-second interval, the port is disabled and indicates the reason code for the first error type that exceeded the threshold.
NOTEThe execution of the portFencing command is subject to Virtual Fabric or Admin Domain restrictions that may be in place. Refer to the Fabric OS Command Reference Manual for details.
TABLE 20 Port fencing class and subclass areas
Port type Areas supported for port fencing
Physical ports Cyclic Redundancy Checks (CRC)Invalid Transmission Words (ITW)Link Reset (LR)Protocol Error (PE)State Change (ST)Class 3 Discard Frames (C3TXO)
FOP_Ports Cyclic Redundancy Checks (CRC)Invalid Transmission Words (ITW)Link Reset (LR)Protocol Error (PE)State Change (ST)Class 3 Discard Frames (C3TXO)
E_Ports Cyclic Redundancy Checks (CRC)Invalid Transmission Words (ITW)Link Reset (LR)Protocol Error (PE)State Change (ST)
70 Fabric Watch Administrator’s Guide53-1002153-01
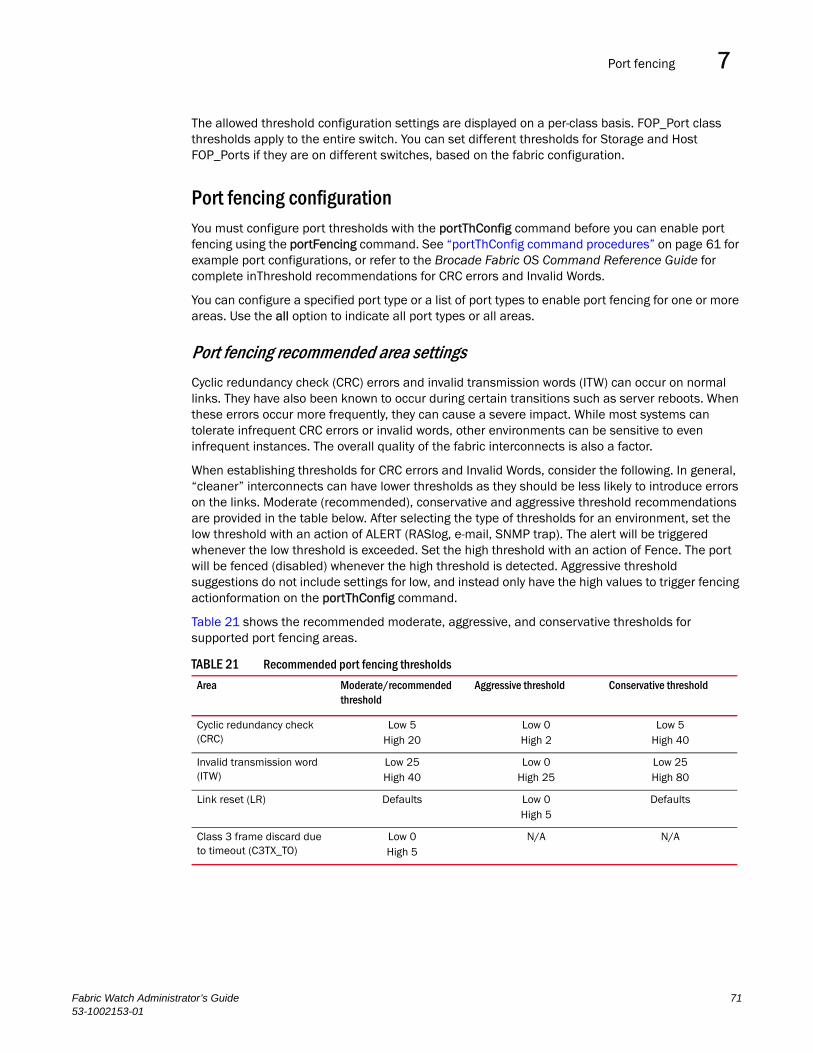
Port fencing 7
The allowed threshold configuration settings are displayed on a per-class basis. FOP_Port class thresholds apply to the entire switch. You can set different thresholds for Storage and Host FOP_Ports if they are on different switches, based on the fabric configuration.
Port fencing configuration You must configure port thresholds with the portThConfig command before you can enable port fencing using the portFencing command. See “portThConfig command procedures” on page 61 for example port configurations, or refer to the Brocade Fabric OS Command Reference Guide for complete inThreshold recommendations for CRC errors and Invalid Words.
You can configure a specified port type or a list of port types to enable port fencing for one or more areas. Use the all option to indicate all port types or all areas.
Port fencing recommended area settings
Cyclic redundancy check (CRC) errors and invalid transmission words (ITW) can occur on normal links. They have also been known to occur during certain transitions such as server reboots. When these errors occur more frequently, they can cause a severe impact. While most systems can tolerate infrequent CRC errors or invalid words, other environments can be sensitive to even infrequent instances. The overall quality of the fabric interconnects is also a factor.
When establishing thresholds for CRC errors and Invalid Words, consider the following. In general, “cleaner” interconnects can have lower thresholds as they should be less likely to introduce errors on the links. Moderate (recommended), conservative and aggressive threshold recommendations are provided in the table below. After selecting the type of thresholds for an environment, set the low threshold with an action of ALERT (RASlog, e-mail, SNMP trap). The alert will be triggered whenever the low threshold is exceeded. Set the high threshold with an action of Fence. The port will be fenced (disabled) whenever the high threshold is detected. Aggressive threshold suggestions do not include settings for low, and instead only have the high values to trigger fencing actionformation on the portThConfig command.
Table 21 shows the recommended moderate, aggressive, and conservative thresholds for supported port fencing areas.
TABLE 21 Recommended port fencing thresholds
Area Moderate/recommended threshold
Aggressive threshold Conservative threshold
Cyclic redundancy check (CRC)
Low 5High 20
Low 0High 2
Low 5High 40
Invalid transmission word (ITW)
Low 25High 40
Low 0High 25
Low 25High 80
Link reset (LR) Defaults Low 0High 5
Defaults
Class 3 frame discard due to timeout (C3TX_TO)
Low 0High 5
N/A N/A
Fabric Watch Administrator’s Guide 7153-1002153-01
Port fencing7
Enabling port fencing
1. Connect to the switch and log in as admin.
2. Configure port thresholds. Information about how to configure port thresholds is detailed in Chapter 7, “Port Monitoring”.
3. Enter the portFencing --enable command. For example, to configure port fencing on an FOP_Port for the Class 3 discard frame area:
portFencing --enable fop-port -area C3TX_TO
Disabling port fencing
Use the --disable option to disable port fencing for the specified areas on all ports of the specified port types. Use the --show option to display the configuration. The display includes the configured port types, error types, and port fencing status (disabled or enabled). Port fencing is disabled by default.
1. Connect to the switch and log in as admin.
2. Enter the portFencing --disable command. For example, to disable port fencing on an FOP_Port for the Link Reset area:
portFencing --disable fop_port -area LR
Port fencing configuration using DCFMThe Data Center Fabric Manager (DCFM) management application supports port fencing. Port fencing objects include the SAN, Fabrics, Directors, Switches (physical), Virtual Switches, Ports, as well as Port Types (E_port, F_port, and FX_port). Use port fencing to directly assign a threshold to these objects. When a switch does not support port fencing, a “No Fencing Changes” message displays in the Threshold field in the Ports table.
If the port detects more events during the specified time period, the device firmware blocks the port, disabling transmit and receive traffic until you investigate, solve the problem, and manually unblock the port. Physical fabrics, directors, switches, port types, and ports display when you have the privileges to manage that object and are indicated by the standard product icons.
Port fencing requirements
To configure port fencing using the DCFM management application, all Fabric OS devices must have Fabric Watch and must be running firmware Fabric OS 6.2 or later.
Port fencing threshold areas supported on DCFM
You can add, edit, view, or remove thresholds on the following area types using DCFM. You can then assign the thresholds to available objects in the DCFM tree.
Port fencing threshold areas include the following:
• C3 Discard Frames (Fabric OS only)
• Invalid CRCs (Fabric OS only)
• Invalid Transmission Words (Fabric OS only)
• Link (M-EOS only)
72 Fabric Watch Administrator’s Guide53-1002153-01

Port fencing 7
• Link Reset (Fabric OS only)
• Protocol Errors (M-EOS and Fabric OS)
• Security (M-EOS)
• State Changes (Fabric OS only)
Refer to Chapter 5, “Device Configuration,” of the Data Center Fabric Manager User Manual for detailed instructions on how to add, edit, view, and remove thresholds.
Fabric Watch Administrator’s Guide 7353-1002153-01
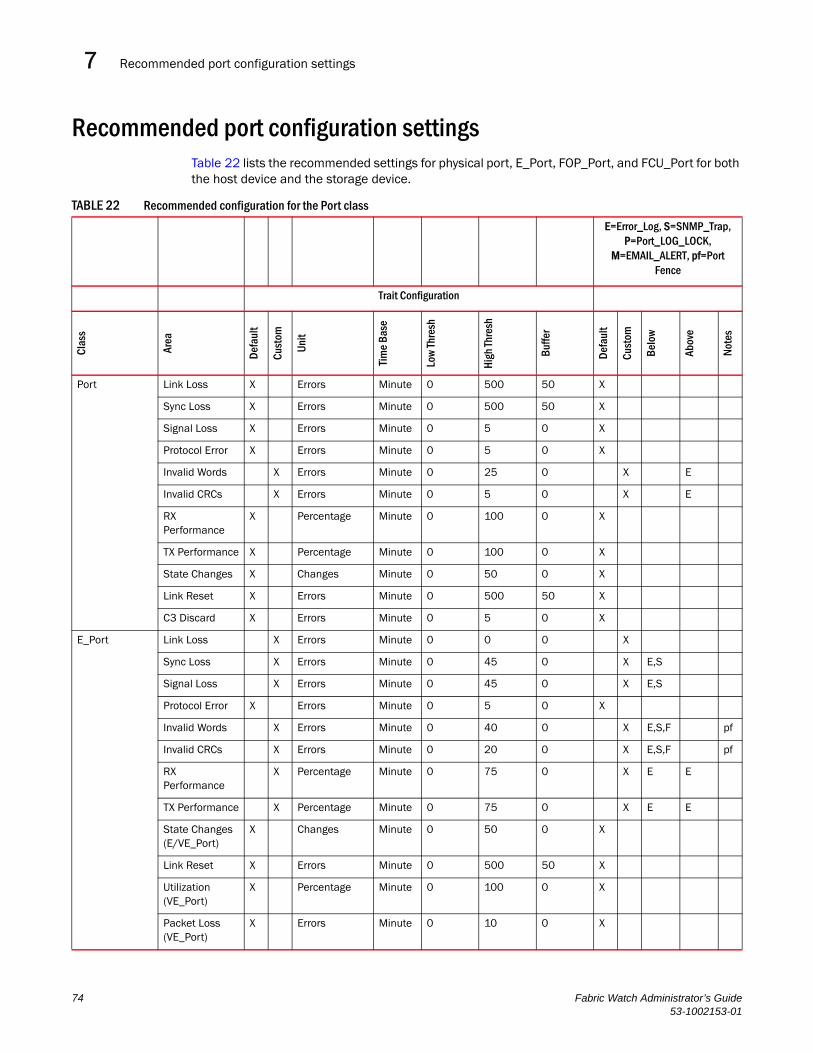
Recommended port configuration settings7
Recommended port configuration settingsTable 22 lists the recommended settings for physical port, E_Port, FOP_Port, and FCU_Port for both the host device and the storage device.
TABLE 22 Recommended configuration for the Port class
E=Error_Log, S=SNMP_Trap, P=Port_LOG_LOCK,
M=EMAIL_ALERT, pf=Port Fence
Trait Configuration
Clas
s
Area
Defa
ult
Cust
om
Unit
Tim
e Ba
se
Low
Thre
sh
High
Thre
sh
Buffe
r
Defa
ult
Cust
om
Belo
w
Abov
e
Note
s
Port Link Loss X Errors Minute 0 500 50 X
Sync Loss X Errors Minute 0 500 50 X
Signal Loss X Errors Minute 0 5 0 X
Protocol Error X Errors Minute 0 5 0 X
Invalid Words X Errors Minute 0 25 0 X E
Invalid CRCs X Errors Minute 0 5 0 X E
RX Performance
X Percentage Minute 0 100 0 X
TX Performance X Percentage Minute 0 100 0 X
State Changes X Changes Minute 0 50 0 X
Link Reset X Errors Minute 0 500 50 X
C3 Discard X Errors Minute 0 5 0 X
E_Port Link Loss X Errors Minute 0 0 0 X
Sync Loss X Errors Minute 0 45 0 X E,S
Signal Loss X Errors Minute 0 45 0 X E,S
Protocol Error X Errors Minute 0 5 0 X
Invalid Words X Errors Minute 0 40 0 X E,S,F pf
Invalid CRCs X Errors Minute 0 20 0 X E,S,F pf
RX Performance
X Percentage Minute 0 75 0 X E E
TX Performance X Percentage Minute 0 75 0 X E E
State Changes (E/VE_Port)
X Changes Minute 0 50 0 X
Link Reset X Errors Minute 0 500 50 X
Utilization (VE_Port)
X Percentage Minute 0 100 0 X
Packet Loss (VE_Port)
X Errors Minute 0 10 0 X
74 Fabric Watch Administrator’s Guide53-1002153-01
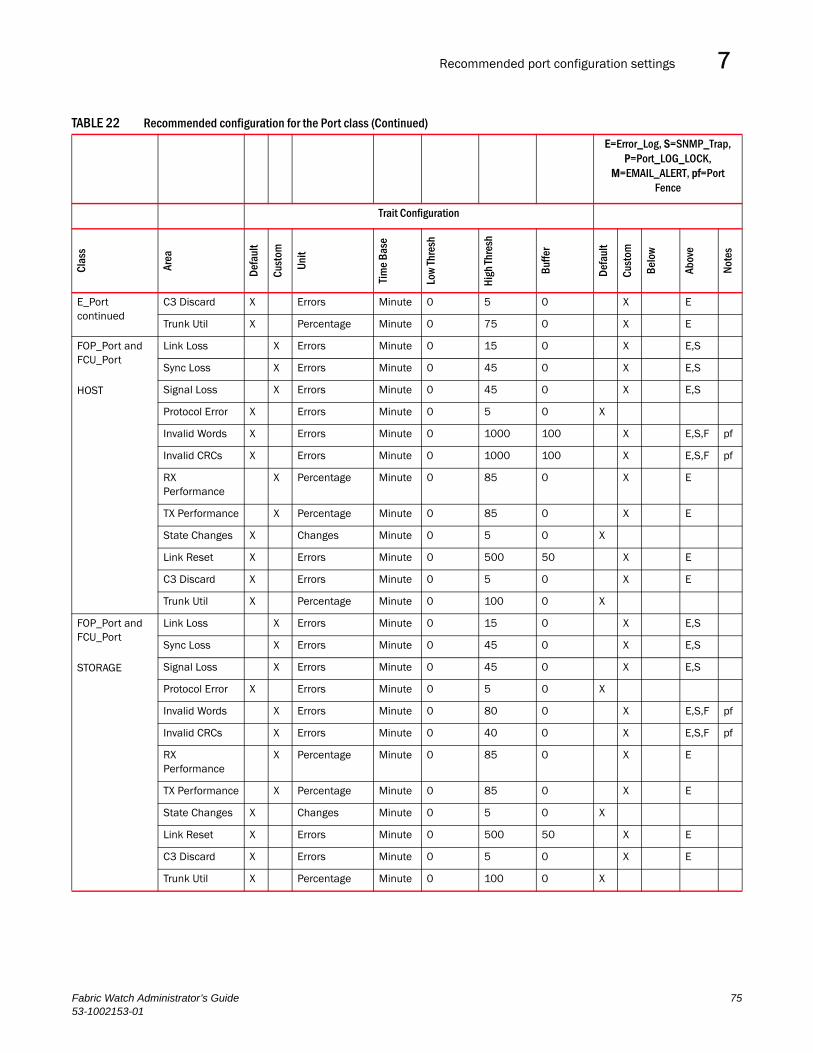
Recommended port configuration settings 7
E_Port continued
C3 Discard X Errors Minute 0 5 0 X E
Trunk Util X Percentage Minute 0 75 0 X E
FOP_Port and FCU_Port
HOST
Link Loss X Errors Minute 0 15 0 X E,S
Sync Loss X Errors Minute 0 45 0 X E,S
Signal Loss X Errors Minute 0 45 0 X E,S
Protocol Error X Errors Minute 0 5 0 X
Invalid Words X Errors Minute 0 1000 100 X E,S,F pf
Invalid CRCs X Errors Minute 0 1000 100 X E,S,F pf
RX Performance
X Percentage Minute 0 85 0 X E
TX Performance X Percentage Minute 0 85 0 X E
State Changes X Changes Minute 0 5 0 X
Link Reset X Errors Minute 0 500 50 X E
C3 Discard X Errors Minute 0 5 0 X E
Trunk Util X Percentage Minute 0 100 0 X
FOP_Port and FCU_Port
STORAGE
Link Loss X Errors Minute 0 15 0 X E,S
Sync Loss X Errors Minute 0 45 0 X E,S
Signal Loss X Errors Minute 0 45 0 X E,S
Protocol Error X Errors Minute 0 5 0 X
Invalid Words X Errors Minute 0 80 0 X E,S,F pf
Invalid CRCs X Errors Minute 0 40 0 X E,S,F pf
RX Performance
X Percentage Minute 0 85 0 X E
TX Performance X Percentage Minute 0 85 0 X E
State Changes X Changes Minute 0 5 0 X
Link Reset X Errors Minute 0 500 50 X E
C3 Discard X Errors Minute 0 5 0 X E
Trunk Util X Percentage Minute 0 100 0 X
TABLE 22 Recommended configuration for the Port class (Continued)
E=Error_Log, S=SNMP_Trap, P=Port_LOG_LOCK,
M=EMAIL_ALERT, pf=Port Fence
Trait Configuration
Clas
s
Area
Defa
ult
Cust
om
Unit
Tim
e Ba
se
Low
Thre
sh
High
Thre
sh
Buffe
r
Defa
ult
Cust
om
Belo
w
Abov
e
Note
s
Fabric Watch Administrator’s Guide 7553-1002153-01

Recommended port configuration settings7
76 Fabric Watch Administrator’s Guide53-1002153-01
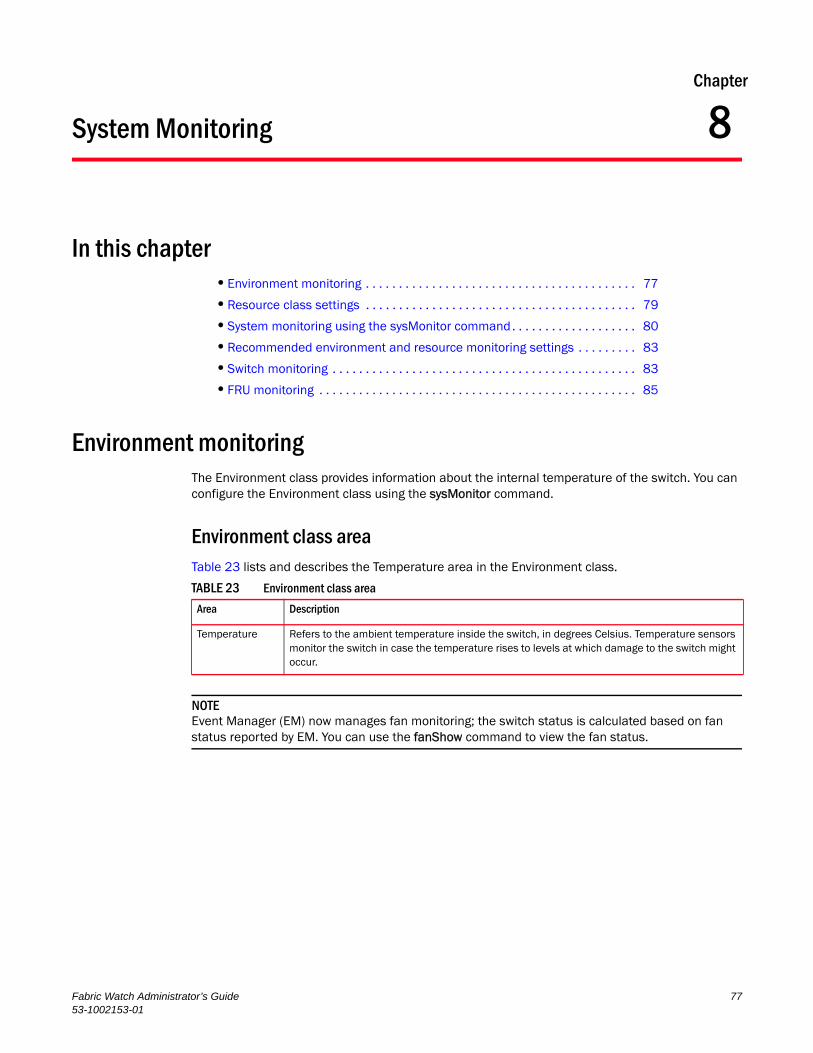
Fabric Watch Administrator’s Guide53-1002153-01
Chapter
8
System MonitoringIn this chapter•Environment monitoring . . . . . . . . . . . . . . . . . . . . . . . . . . . . . . . . . . . . . . . . . 77
•Resource class settings . . . . . . . . . . . . . . . . . . . . . . . . . . . . . . . . . . . . . . . . . 79
•System monitoring using the sysMonitor command. . . . . . . . . . . . . . . . . . . 80
•Recommended environment and resource monitoring settings . . . . . . . . . 83
•Switch monitoring . . . . . . . . . . . . . . . . . . . . . . . . . . . . . . . . . . . . . . . . . . . . . . 83
•FRU monitoring . . . . . . . . . . . . . . . . . . . . . . . . . . . . . . . . . . . . . . . . . . . . . . . . 85
Environment monitoringThe Environment class provides information about the internal temperature of the switch. You can configure the Environment class using the sysMonitor command.
Environment class areaTable 23 lists and describes the Temperature area in the Environment class.
NOTEEvent Manager (EM) now manages fan monitoring; the switch status is calculated based on fan status reported by EM. You can use the fanShow command to view the fan status.
TABLE 23 Environment class area
Area Description
Temperature Refers to the ambient temperature inside the switch, in degrees Celsius. Temperature sensors monitor the switch in case the temperature rises to levels at which damage to the switch might occur.
77
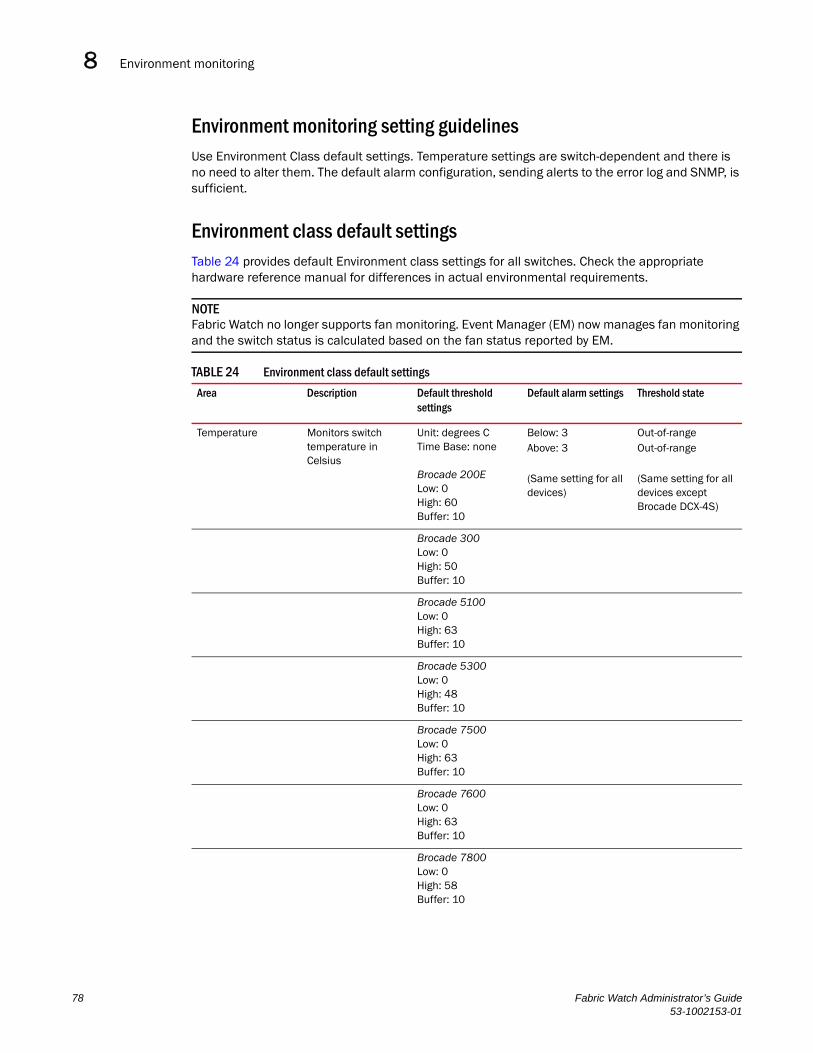
Environment monitoring8
Environment monitoring setting guidelinesUse Environment Class default settings. Temperature settings are switch-dependent and there is no need to alter them. The default alarm configuration, sending alerts to the error log and SNMP, is sufficient.
Environment class default settingsTable 24 provides default Environment class settings for all switches. Check the appropriate hardware reference manual for differences in actual environmental requirements.
NOTEFabric Watch no longer supports fan monitoring. Event Manager (EM) now manages fan monitoring and the switch status is calculated based on the fan status reported by EM.
TABLE 24 Environment class default settings
Area Description Default threshold settings
Default alarm settings Threshold state
Temperature Monitors switch temperature in Celsius
Unit: degrees CTime Base: none
Brocade 200ELow: 0High: 60 Buffer: 10
Below: 3Above: 3
(Same setting for all devices)
Out-of-rangeOut-of-range
(Same setting for all devices except Brocade DCX-4S)
Brocade 300Low: 0High: 50Buffer: 10
Brocade 5100Low: 0High: 63Buffer: 10
Brocade 5300Low: 0High: 48Buffer: 10
Brocade 7500Low: 0High: 63Buffer: 10
Brocade 7600Low: 0High: 63Buffer: 10
Brocade 7800Low: 0High: 58Buffer: 10
78 Fabric Watch Administrator’s Guide53-1002153-01
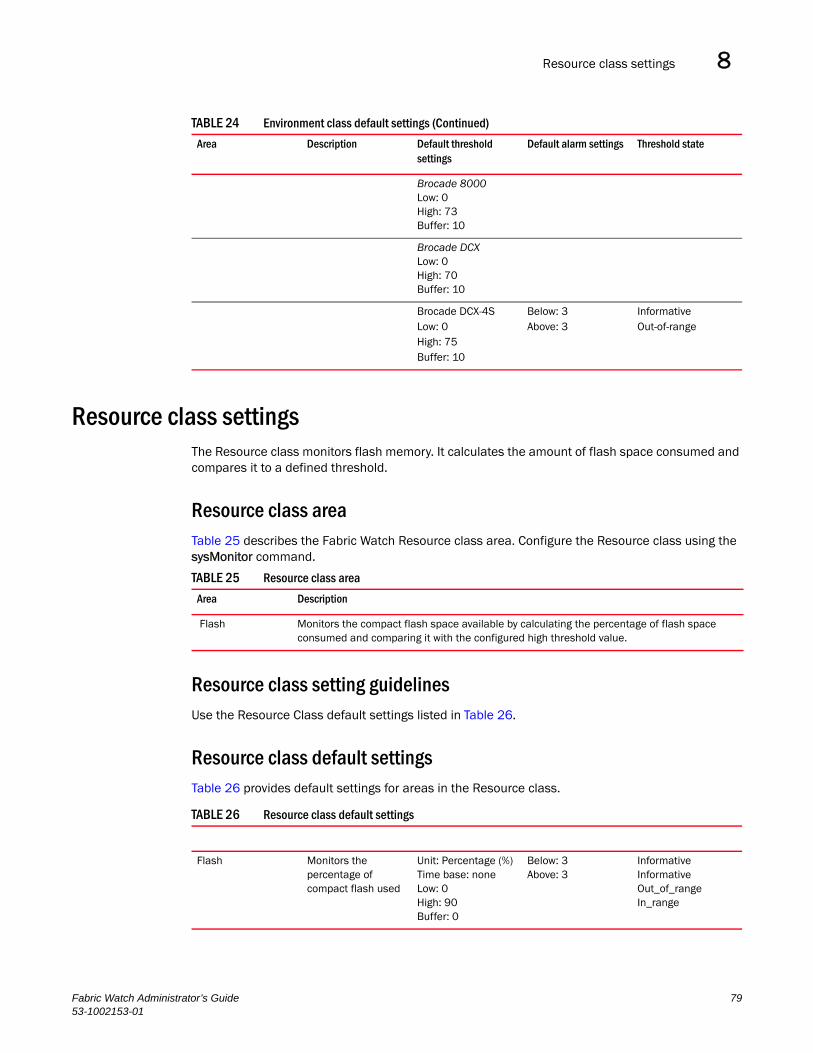
Resource class settings 8
Resource class settingsThe Resource class monitors flash memory. It calculates the amount of flash space consumed and compares it to a defined threshold.
Resource class areaTable 25 describes the Fabric Watch Resource class area. Configure the Resource class using the sysMonitor command.
Resource class setting guidelinesUse the Resource Class default settings listed in Table 26.
Resource class default settingsTable 26 provides default settings for areas in the Resource class.
Brocade 8000Low: 0High: 73Buffer: 10
Brocade DCXLow: 0High: 70Buffer: 10
Brocade DCX-4SLow: 0High: 75Buffer: 10
Below: 3Above: 3
InformativeOut-of-range
TABLE 24 Environment class default settings (Continued)
Area Description Default threshold settings
Default alarm settings Threshold state
TABLE 25 Resource class area
Area Description
Flash Monitors the compact flash space available by calculating the percentage of flash space consumed and comparing it with the configured high threshold value.
TABLE 26 Resource class default settings
Flash Monitors the percentage of compact flash used
Unit: Percentage (%)Time base: noneLow: 0High: 90Buffer: 0
Below: 3Above: 3
InformativeInformativeOut_of_rangeIn_range
Fabric Watch Administrator’s Guide 7953-1002153-01
System monitoring using the sysMonitor command8
System monitoring using the sysMonitor commandUse the sysMonitor command to configure temperature and system resource settings at the chassis level. For detailed information about the sysMonitor command, refer to the Fabric OS Command Reference Manual.
The following operations are supported by the sysMonitor command:
• Configure thresholds for Fabric Watch event monitoring and reporting for the environment and resource classes. Environment thresholds enable temperature monitoring, and resource thresholds enable monitoring of flash memory.
Configuration changes are saved persistently to non-volatile storage, but the changes do not take effect until you execute --apply. The --apply option allows you to toggle between default settings and your own saved custom configuration and to apply actions and thresholds separately.
• Configure memory or CPU usage parameters on the switch or display memory or CPU usage. Configuration options include setting usage thresholds which, if exceeded, trigger a set of specified Fabric Watch alerts. You can set up the system monitor to poll at certain intervals and specify the number of retries required before Fabric Watch takes action. Configuring thresholds for CPU and memory does not follow the transaction model of the typical Fabric Watch command. The --apply and --cancel options are not valid in this context.
When the system crosses any of the limits, SNMP, RASlog, e-mail (or all) messages are generated. Flash and temperature configuration are at the chassis level. To execute this command, you must have chassis-level permission in a virtual fabric (VF) environment.
NOTESpikes in memory and CPU utilization are normal during the firmware download process and you may see threshold warning messages while the process is running. After the firmware download process has completed, memory and CPU utilization should return to normal.
System monitoring is disabled by default. You must run both the --config -mem and the --config -cpu commands to enable both memory and CPU system monitoring.
Using the nosave commandThe nosave command prevents the configuration changes from being saved persistently. This option allows you to make and view changes without overwriting the saved configuration.
CAUTION
When you use --config with the --nosave option and the switch reboots, your changes are lost.
80 Fabric Watch Administrator’s Guide53-1002153-01
Examples of the sysMonitor command 8
Examples of the sysMonitor commandThe following sections provide specific examples for the Environment class, CPU, and memory.
Environment class settingsTemperature settings are switch-dependent and there is no need to alter them. The default alarm configuration, sending alerts to the error log and SNMP, is sufficient. See “Environment monitoring setting guidelines” on page 78 for more information.
Pausing and continuing monitoring
To pause the monitoring of a class, area, and port or index, enter the portThConfig command using the following parameters. You can separate multiple, individual classes and areas with a comma; you cannot, however, specify all for all classes and areas.
switch:admin> sysmonitor --pause | --continue env -area temp
Displaying the threshold of the system areas
The temperature area refers to the ambient temperature inside the switch, in degrees Celsius. Temperature sensors monitor the switch in case the temperature rises to levels at which damage to the switch might occur.
Enter the sysMonitor command using the following parameters:
switch:admin> sysmonitor --show env -area temp
Example of configuring the temperature threshold
1. Enter the sysMonitor command using the following parameters:
switch:admin> sysmonitor --config env -area temp -highth -value 99 -trigger above -action raslog
2. Apply the changes:
switch:admin> sysmonitor --apply env -area temp -action_level cust -thresh_level cust
Resource class settingsThe flash area of the Resource class monitors the percentage of compact flash memory used on the system.
Displaying the system flash parameters
Enter the sysMonitor command using the following parameters:
switch:admin> sysmonitor --show resource -area flash
Fabric Watch Administrator’s Guide 8153-1002153-01
Examples of the sysMonitor command8
CPU and memoryWhen configuring CPU monitoring, specify a value in the 1-100 range. When the CPU usage exceeds the limit, a Fabric Watch alert is triggered. The default CPU limit is 75 percent.
When configuring memory, the limit specifies a usage limit as a percentage of available resources.
When used to configure memory monitoring the limit value must be greater than the low limit and smaller than the high limit.
The following operands are valid only with the --config mem command. Three thresholds are supported for memory monitoring:
• high_limit— Specifies an upper usage limit for memory as percentage of available memory. This value must be greater than the value set by the -limit parameter. The maximum is 90 percent. When memory usage exceeds this limit, Fabric Watch generates a CRITICAL RASlog message. The default is 80 percent.
• limit—Specifies the default CPU limit. When the limit is exceeded, Fabric Watch sends out a RASlog WARNING message. When usage returns below the limit, Fabric Watch sends a RASlog INFO message. Valid values are range between 0 to 80 percent and the default value is different for different systems.
• low_limit—Specifies a lower usage limit for memory as percentage of available memory. This value must be smaller than the value set by the -limit parameter. When memory usage exceeds or falls below this limit, Fabric Watch generates an INFO RASlog message. The default for all platforms is 50 percent.
Examples of the CPU and memory commandsThe following sections provides specific examples for CPU and memory.
Displaying the current CPU usage threshold
Enter the sysMonitor command using the following parameters:
switch:admin> sysmonitor --show cpuCPU Usage : 2%CPU Usage Limit : 75%Number of Retries :3Polling Interval : 120 secondsActions: snmp
Displaying the current memory usage threshold
Enter the sysMonitor command using the following parameters:
switch:admin> sysmonitor --show mem
Used Memory: 171476k 34%Total Memory: 504344kFree Memory: 332868kUsed Memory Limit: 60%Low Used Memory Limit: 40%High Used Memory Limit: 70%Polling Interval: 10 secondsNo Of Retries: 1Actions: snmp,raslog
82 Fabric Watch Administrator’s Guide53-1002153-01
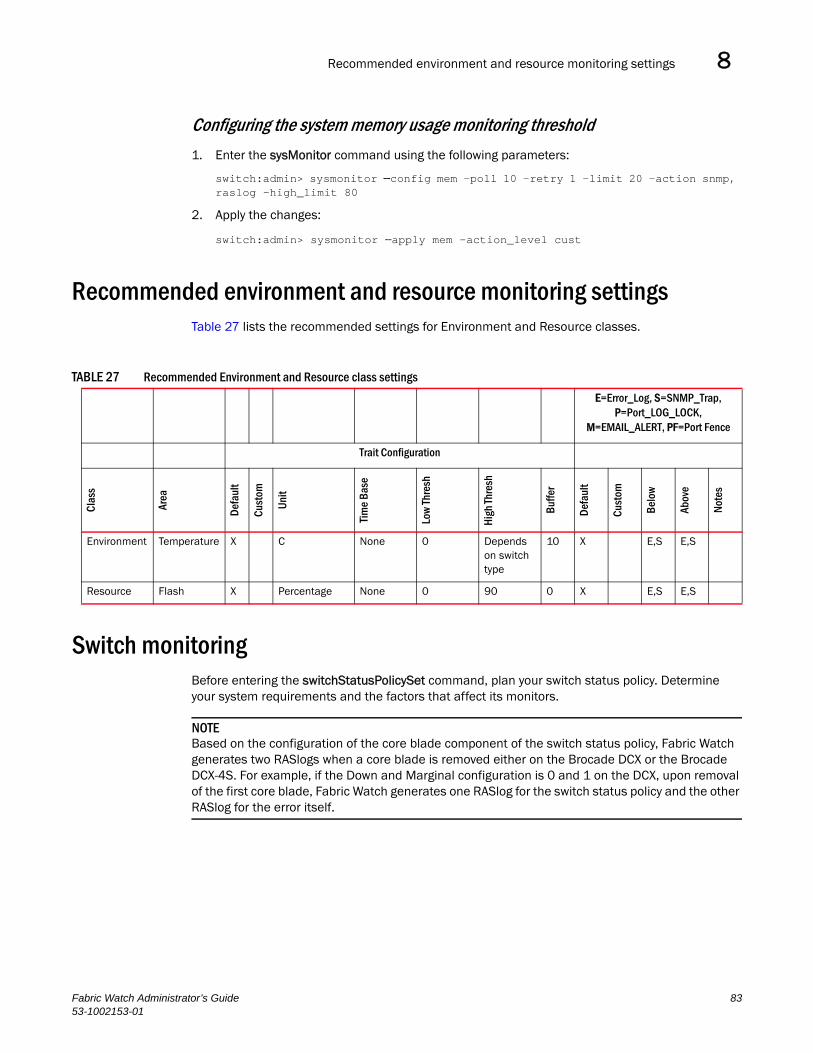
Recommended environment and resource monitoring settings 8
Configuring the system memory usage monitoring threshold
1. Enter the sysMonitor command using the following parameters:
switch:admin> sysmonitor --config mem -poll 10 -retry 1 -limit 20 -action snmp, raslog -high_limit 80
2. Apply the changes:
switch:admin> sysmonitor --apply mem -action_level cust
Recommended environment and resource monitoring settingsTable 27 lists the recommended settings for Environment and Resource classes.
Switch monitoringBefore entering the switchStatusPolicySet command, plan your switch status policy. Determine your system requirements and the factors that affect its monitors.
NOTEBased on the configuration of the core blade component of the switch status policy, Fabric Watch generates two RASlogs when a core blade is removed either on the Brocade DCX or the Brocade DCX-4S. For example, if the Down and Marginal configuration is 0 and 1 on the DCX, upon removal of the first core blade, Fabric Watch generates one RASlog for the switch status policy and the other RASlog for the error itself.
TABLE 27 Recommended Environment and Resource class settings
E=Error_Log, S=SNMP_Trap, P=Port_LOG_LOCK,
M=EMAIL_ALERT, PF=Port Fence
Trait Configuration
Clas
s
Area
Defa
ult
Cust
om
Unit
Tim
e Ba
se
Low
Thre
sh
High
Thre
sh
Buffe
r
Defa
ult
Cust
om
Belo
w
Abov
e
Note
s
Environment Temperature X C None 0 Depends on switch type
10 X E,S E,S
Resource Flash X Percentage None 0 90 0 X E,S E,S
Fabric Watch Administrator’s Guide 8353-1002153-01
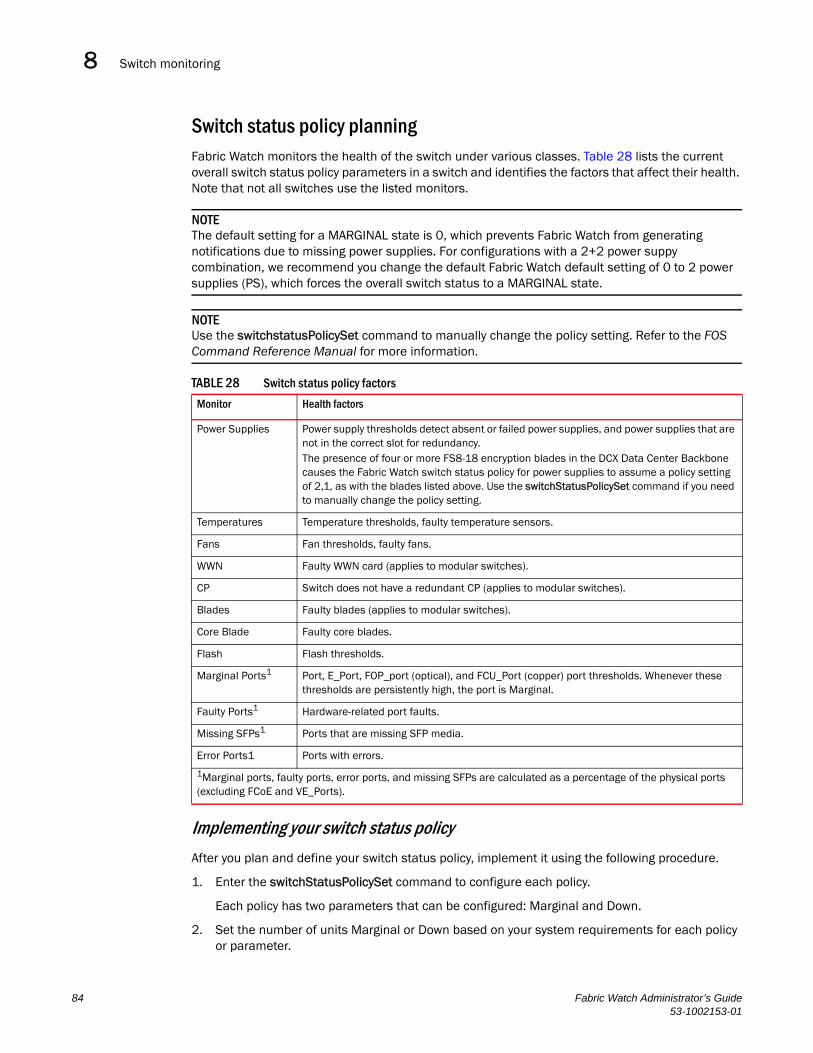
Switch monitoring8
Switch status policy planningFabric Watch monitors the health of the switch under various classes. Table 28 lists the current overall switch status policy parameters in a switch and identifies the factors that affect their health. Note that not all switches use the listed monitors.
NOTEThe default setting for a MARGINAL state is 0, which prevents Fabric Watch from generating notifications due to missing power supplies. For configurations with a 2+2 power suppy combination, we recommend you change the default Fabric Watch default setting of 0 to 2 power supplies (PS), which forces the overall switch status to a MARGINAL state.
NOTEUse the switchstatusPolicySet command to manually change the policy setting. Refer to the FOS Command Reference Manual for more information.
Implementing your switch status policy
After you plan and define your switch status policy, implement it using the following procedure.
1. Enter the switchStatusPolicySet command to configure each policy.
Each policy has two parameters that can be configured: Marginal and Down.
2. Set the number of units Marginal or Down based on your system requirements for each policy or parameter.
TABLE 28 Switch status policy factors
Monitor Health factors
Power Supplies Power supply thresholds detect absent or failed power supplies, and power supplies that are not in the correct slot for redundancy. The presence of four or more FS8-18 encryption blades in the DCX Data Center Backbone causes the Fabric Watch switch status policy for power supplies to assume a policy setting of 2,1, as with the blades listed above. Use the switchStatusPolicySet command if you need to manually change the policy setting.
Temperatures Temperature thresholds, faulty temperature sensors.
Fans Fan thresholds, faulty fans.
WWN Faulty WWN card (applies to modular switches).
CP Switch does not have a redundant CP (applies to modular switches).
Blades Faulty blades (applies to modular switches).
Core Blade Faulty core blades.
Flash Flash thresholds.
Marginal Ports1 Port, E_Port, FOP_port (optical), and FCU_Port (copper) port thresholds. Whenever these thresholds are persistently high, the port is Marginal.
Faulty Ports1 Hardware-related port faults.
Missing SFPs1 Ports that are missing SFP media.
Error Ports1 Ports with errors.
1Marginal ports, faulty ports, error ports, and missing SFPs are calculated as a percentage of the physical ports (excluding FCoE and VE_Ports).
84 Fabric Watch Administrator’s Guide53-1002153-01
FRU monitoring 8
The following example shows a switch status policy for temperature:
Bad Temperatures contributing to DOWN status: (0..10) [0] 3Bad Temperatures contributing to MARGINAL status: (0..10) [0] 1
The following example shows a switch status policy for fans:
Bad Fans contributing to DOWN status: (0..3) [0] 2Bad Fans contributing to MARGINAL status: (0..3) [0] 1
Switch status policies are saved in a nonvolatile memory, and therefore are persistent until changed.
Viewing your switch status policy
After you have defined and configured your switch status policy, view it with the switchStatusPolicyShow command. The switchStatusPolicyShow command displays the following policy parameters that determine the overall switch status.
NOTEFCoE and VE ports are not considered in marginal port or faulty port calculations.
• Power Supplies—The power supply thresholds detect absent or failed power supplies.
• Temperature—Temperature thresholds detect faulty temperature sensors.
• Fan—Fan thresholds detect faulty fans.
• Flash—Flash thresholds monitor flash memory.
• Marginal Ports—Ports that move into the marginal state for reasons such as insufficient buffer credits.
• Port Persistence Time—Fabric Watch waits for the port persistence time duration before it declares the port to be in MARGINAL state when it crosses the high threshold.
• Faulty Ports—Ports that are faulty because of hardware faults, such as invalid SFPs.
• Missing SFPs—Monitors the number of ports without SFPs.
• Error Ports—Ports that are disabled because of segmentation, an authentication failure, port fencing, or bottleneck detection.
The policy you defined determines the output in the Switch Status Policy Report.
See Chapter 10, “Fabric Watch Reports,” for more details about the Switch Status Policy Report.
FRU monitoringSupported FRU areas depend on the type of Brocade switch. For the following switches, the slot and WWN areas are not supported:
• Brocade 300, 5100, and 5300 switches
• Brocade DCX and DCX-4S Data Center Backbone
• Brocade Encryption Switch
Fabric Watch Administrator’s Guide 8553-1002153-01
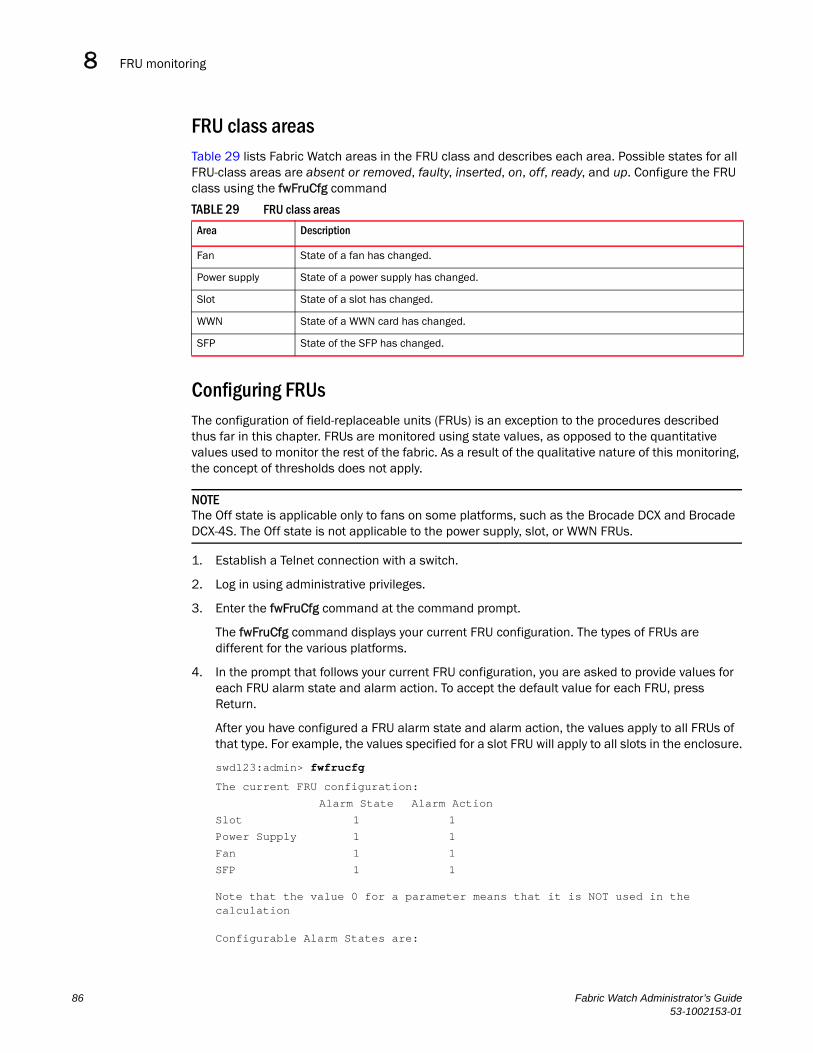
FRU monitoring8
FRU class areasTable 29 lists Fabric Watch areas in the FRU class and describes each area. Possible states for all FRU-class areas are absent or removed, faulty, inserted, on, off, ready, and up. Configure the FRU class using the fwFruCfg command
Configuring FRUsThe configuration of field-replaceable units (FRUs) is an exception to the procedures described thus far in this chapter. FRUs are monitored using state values, as opposed to the quantitative values used to monitor the rest of the fabric. As a result of the qualitative nature of this monitoring, the concept of thresholds does not apply.
NOTEThe Off state is applicable only to fans on some platforms, such as the Brocade DCX and Brocade DCX-4S. The Off state is not applicable to the power supply, slot, or WWN FRUs.
1. Establish a Telnet connection with a switch.
2. Log in using administrative privileges.
3. Enter the fwFruCfg command at the command prompt.
The fwFruCfg command displays your current FRU configuration. The types of FRUs are different for the various platforms.
4. In the prompt that follows your current FRU configuration, you are asked to provide values for each FRU alarm state and alarm action. To accept the default value for each FRU, press Return.
After you have configured a FRU alarm state and alarm action, the values apply to all FRUs of that type. For example, the values specified for a slot FRU will apply to all slots in the enclosure.
swd123:admin> fwfrucfg
Note that the value 0 for a parameter means that it is NOT used in the calculation
Configurable Alarm States are:
TABLE 29 FRU class areas
Area Description
Fan State of a fan has changed.
Power supply State of a power supply has changed.
Slot State of a slot has changed.
WWN State of a WWN card has changed.
SFP State of the SFP has changed.
The current FRU configuration:
Alarm State Alarm Action
Slot 1 1
Power Supply 1 1
Fan 1 1
SFP 1 1
86 Fabric Watch Administrator’s Guide53-1002153-01
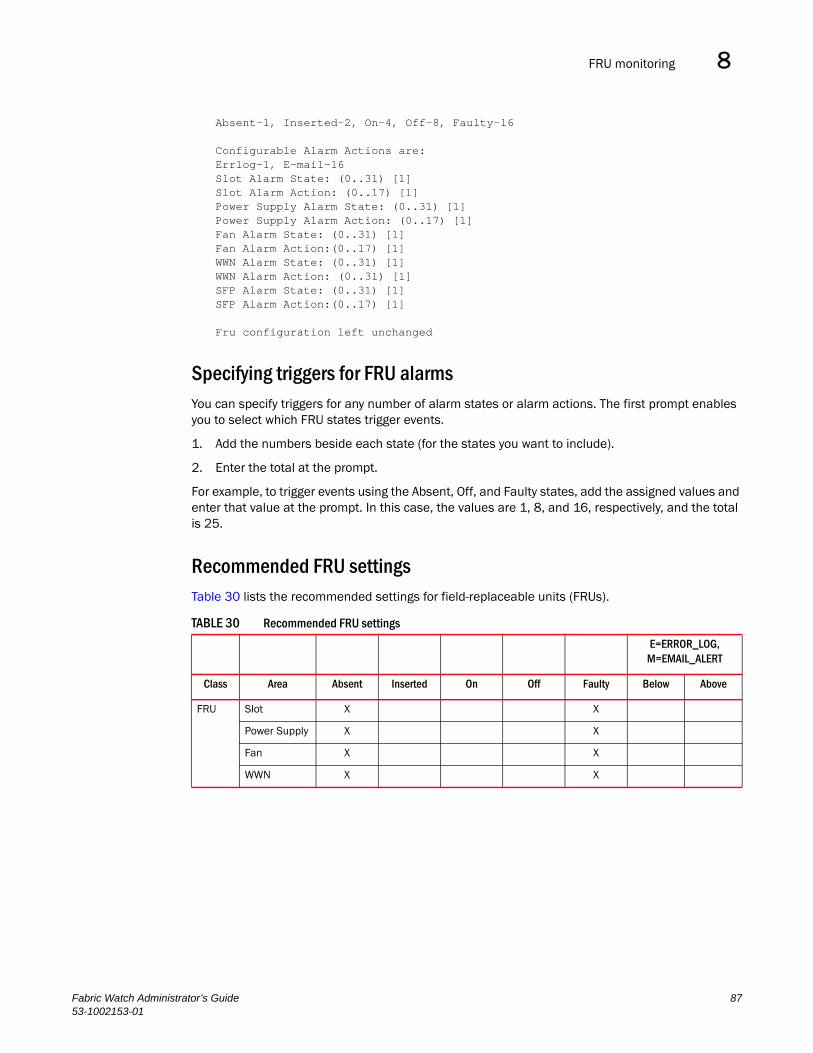
FRU monitoring 8
Absent-1, Inserted-2, On-4, Off-8, Faulty-16
Configurable Alarm Actions are:Errlog-1, E-mail-16Slot Alarm State: (0..31) [1]Slot Alarm Action: (0..17) [1]Power Supply Alarm State: (0..31) [1]Power Supply Alarm Action: (0..17) [1]Fan Alarm State: (0..31) [1]Fan Alarm Action:(0..17) [1]WWN Alarm State: (0..31) [1]WWN Alarm Action: (0..31) [1]SFP Alarm State: (0..31) [1]SFP Alarm Action:(0..17) [1]
Fru configuration left unchanged
Specifying triggers for FRU alarmsYou can specify triggers for any number of alarm states or alarm actions. The first prompt enables you to select which FRU states trigger events.
1. Add the numbers beside each state (for the states you want to include).
2. Enter the total at the prompt.
For example, to trigger events using the Absent, Off, and Faulty states, add the assigned values and enter that value at the prompt. In this case, the values are 1, 8, and 16, respectively, and the total is 25.
Recommended FRU settingsTable 30 lists the recommended settings for field-replaceable units (FRUs).
TABLE 30 Recommended FRU settings
E=ERROR_LOG, M=EMAIL_ALERT
Class Area Absent Inserted On Off Faulty Below Above
FRU Slot X X
Power Supply X X
Fan X X
WWN X X
Fabric Watch Administrator’s Guide 8753-1002153-01

FRU monitoring8
88 Fabric Watch Administrator’s Guide53-1002153-01
Fabric Watch Administrator’s Guide53-1002153-01
Chapter
9
Fabric Watch Configuration Using Web ToolsIn this chapter•Fabric Watch Configuration Using Web Tools . . . . . . . . . . . . . . . . . . . . . . . . 89
Fabric Watch Configuration Using Web ToolsYou can use Web Tools to define the following Fabric Watch configurations:
• Configure custom threshold values on particular elements.
• Place limits on the acceptable values of those elements and enable the custom limits (configure threshold boundaries).
• Configure Fabric Watch to alert you to errant values.
• Configure Fabric Watch to identify unacceptable values (threshold traits).
Opening the Fabric Watch windowTo open the Fabric Watch window, perform the following steps.
1. Select a switch from the Fabric Tree and log in if necessary.
2. Select Tasks > Manage > Fabric Watch.
The Fabric Watch window displays, as shown in Figure 7.
Figure 7 shows the Fabric Watch window. You do not need the Enhanced Group Management (EGM) license to perform Fabric Watch operations using Web Tools.
89
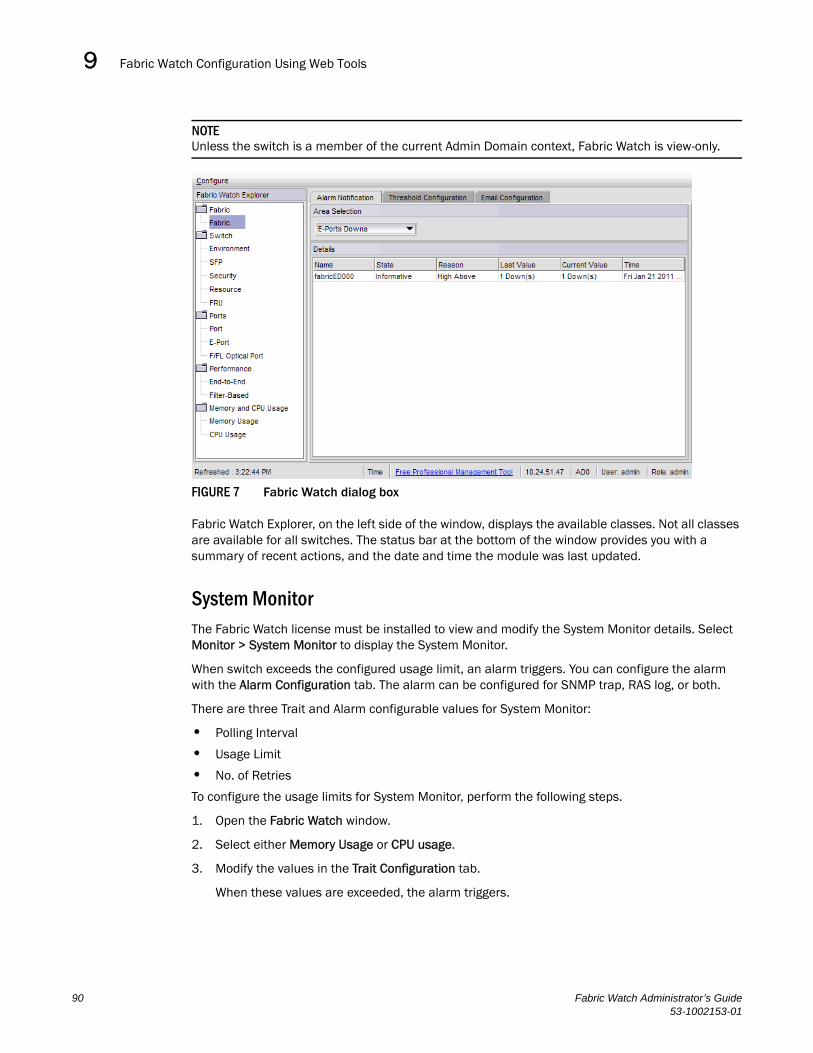
Fabric Watch Configuration Using Web Tools9
NOTEUnless the switch is a member of the current Admin Domain context, Fabric Watch is view-only.
FIGURE 7 Fabric Watch dialog box
Fabric Watch Explorer, on the left side of the window, displays the available classes. Not all classes are available for all switches. The status bar at the bottom of the window provides you with a summary of recent actions, and the date and time the module was last updated.
System MonitorThe Fabric Watch license must be installed to view and modify the System Monitor details. Select Monitor > System Monitor to display the System Monitor.
When switch exceeds the configured usage limit, an alarm triggers. You can configure the alarm with the Alarm Configuration tab. The alarm can be configured for SNMP trap, RAS log, or both.
There are three Trait and Alarm configurable values for System Monitor:
• Polling Interval
• Usage Limit
• No. of Retries
To configure the usage limits for System Monitor, perform the following steps.
1. Open the Fabric Watch window.
2. Select either Memory Usage or CPU usage.
3. Modify the values in the Trait Configuration tab.
When these values are exceeded, the alarm triggers.
90 Fabric Watch Administrator’s Guide53-1002153-01
Fabric Watch Configuration Using Web Tools 9
4. Click the Alarm Configuration tab.
5. Select SNMP Trap, RAS log, or both options.
6. Click Apply.
Fabric Watch threshold configurationThe Threshold Configuration tab enables you to configure event conditions. From this tab, you configure threshold traits, alarms, and e-mail configurations.
NOTEUse the procedures in this section to configure threshold traits for all classes except for the FRU class. Use the procedure described in “Configuring alarms for FRUs” on page 94 for the FRU class.
Configuring threshold traits
Configure threshold traits to define a threshold for a particular class and area. You can configure the following traits for a threshold:
• Time Base—The time base (minute, hour, day) for the area
• Low Boundary—The low threshold for the event-setting comparisons
• High Boundary—The high threshold for the event-setting comparisons
• Buffer Size—The size of the buffer zone used in event-setting comparisons
NOTEWhen you are configuring the VE-Port > Packet Loss area thresholds (high and low boundary), the packet loss threshold values are a percentage. The system default Low Boundary value is 0.0 and High Boundary value is 10.0. This corresponds to 0 percent through 100 percent.
To set a Custom Defined percentage, use a corresponding value between 0.0 and 10.0. For example, to set a range of values of 53 percent through 77 percent, your Low Boundary value is 5.3 and the High Boundary value is 7.7.
To configure threshold traits, perform the following steps.
1. Click Fabric Watch in the Manage section of the Tasks menu.
2. Select the Threshold Configuration tab.
3. Select the Trait Configuration subtab.
4. In Fabric Watch Explorer, select a class.
5. Under Area Selection, select an area from the list.
This sets the units in the Units field.
The module displays two columns of trait information, labeled System Default and Custom Defined. You cannot modify the information in the System Default column.
6. In the Activate Level area:
• Use the system default settings and proceed to step 11.
or
• Click Custom Defined to specify new settings and proceed to the next step.
Fabric Watch Administrator’s Guide 9153-1002153-01
Fabric Watch Configuration Using Web Tools9
7. If necessary, select a time to record the event in the Time Base field.
8. Enter the lowest boundary of the normal zone in the Low Boundary field.
9. Enter the highest boundary of the normal zone in the High Boundary field.
10. Enter the size of the buffer zone in the Buffer Size field.
11. Click Apply.
Configuring threshold alarms
After you update the threshold information, use the Alarm Configuration subtab to customize the notification settings for each event setting.
The alarm-naming convention is modified for Port, E_Port, F_Port, FL_Port, and VE_Ports class types:
• “Above” is called “High Above”
• “Below” is called “Low Below”
• “In Between” is called “High Below”
The Low Above action alarm supports all port class types for these options:
• CRC errors
• Invalid words
• Protocol errors
• State change
• Trunk utilization
• C3 discards
• RX performance
• TX performance
• Loss of signal
• Link failures
• Link resets
• Packet loss (not for E-Port)
• Utilization (not for E-Port)
To configure threshold alarms, perform the following steps.
1. From the Fabric Watch dialog box, select the Threshold Configuration tab.
2. Select the Alarm Configuration subtab.
3. In Fabric Watch Explorer, select a class.
4. Under Area Selection, select an area from the list.
NOTEThe module displays two tables of alarm configuration information, labeled System Default and Custom Defined. You cannot modify the information in the System Default table.
92 Fabric Watch Administrator’s Guide53-1002153-01
Fabric Watch Configuration Using Web Tools 9
5. In the Activate Level area:
• Click System Default to use the system default settings and proceed to step 7.
or
• Click Custom Defined to specify new settings and proceed to the next step.
6. Select the check box for the type of notification method you want to use for each event type.
The available alarm actions are:
• ERROR_LOG
• SNMP_TRAP
• PORT_LOG_LOCK
• EMAIL_ALERT
7. Click Apply.
Enabling or disabling threshold alarms for individual elements
To configure element-specific alarm settings, perform the following steps.
1. Open the Fabric Watch window.
2. In Fabric Watch Explorer, select a class.
You can set alarms for information on a switch only if that information is monitored by Fabric Watch for that switch; not all alarm options are available for all switches.
3. Select the Threshold Configuration tab.
4. Under Area Selection, select the area with the alarms that you want to enable or disable.
5. Select the Element Configuration subtab.
6. Select an element from the Element Selection menu.
7. In the Status area:
• To disable threshold alarms, click Disabled and click Apply. The threshold alarms are disabled and you do not need to continue with this procedure.
• To enable threshold alarms, click Enabled and continue with the next step.
8. Select the Triggered behavior type to receive threshold alarms only when they are triggered by events that you defined.
9. Select a time interval in which to receive the threshold alarms from the Time Interval menu.
10. Click Apply.
11. Optional: Apply the selections on this panel to multiple elements simultaneously.
a. Click Apply More. The Multiple Selection dialog box displays.
b. Click the boxes next to the indices of all applicable elements.
c. Click OK.
Fabric Watch Administrator’s Guide 9353-1002153-01
Fabric Watch Configuration Using Web Tools9
Configuring alarms for FRUsConfiguration for the FRU class is different from configuration for the other classes. Because FRUs are not monitored through a threshold-based system, they have a simpler interface for configuration.
For FRUs, you configure the states for which an event occurs, as described in the following procedure.
1. Open the Fabric Watch window.
2. Select the Threshold Configuration tab.
3. In Fabric Watch Explorer, select a FRU class.
4. Under Area Selection, select a FRU type from the list.
5. Select the alarm states for which you want an event to register.
If a FRU of the selected type is determined that it is one of the selected states, an event will occur.
6. Select the methods by which you want to be notified about the FRU alarms.
For FRUs, the only options are error log and e-mail alert.
7. Click Apply to apply the changes to the switch.
A confirmation dialog box displays, asking if you want to apply the changes to the switch.
8. Click OK to save the changes to the switch.
Configuring alarm filtersThe Fabric Watch dialog box provides GUI support for the CLI command fwalarmsfilterset. This option is used to configure the alarm filtering for Fabric Watch. By disabling the alarms, all non-environment and non-resource class alarms are suppressed. By enabling the alarms, all class alarms are generated.
To configure the alarm filter, perform the following steps.
1. Open the Fabric Watch dialog box.
2. Select Configure > Alarm Filter > Enable.
A confirmation message displays, stating “Do you want to enable the Fabric Watch Alarm Filter?”
3. Click Yes.
94 Fabric Watch Administrator’s Guide53-1002153-01
Fabric Watch Configuration Using Web Tools 9
Fabric Watch alarm informationFrom Fabric Watch, you can view two types of reports:
• Alarm notifications—Displays the alarms that occurred for a selected class or area.
• Alarm configuration—Displays threshold and alarm configurations for a selected class or area.
Viewing an alarm configuration report
Use the Threshold Configuration tab, Configuration Report subtab to display a report of the configuration for a selected class or area with the following information:
• Threshold settings (labeled Threshold Configuration)
• Notification settings (labeled Action Configuration)
• Element settings (not labeled) — You can scroll through this information, but cannot make changes.
To view an alarm configuration report, perform the following steps.
1. Open the Fabric Watch window.
2. Select the Threshold Configuration tab.
3. Select a previously configured element from Fabric Watch Explorer (for instructions, refer to “Enabling or disabling threshold alarms for individual elements” on page 93).
4. Under Area Selection, select the alarm area report to be viewed.
5. Select the Configuration Report subtab.
This tab displays a report of the configuration for the selected area.
Displaying alarms
Using the Alarm Notification tab, you can view a list of all alarms that occurred for a selected class or area (Figure 7 on page 90). Table 31 describes the columns in this report. You can click the header of each column to change the way the information is sorted in your view. You can also right-click the column header and select sort options from a menu.
NOTENote that for the FRU class, only the Name, State, and Time columns are displayed. In addition, if the FRU area is Fan, the Name column refers to either a fan or a fan FRU, depending on the switch model.
TABLE 31 Alarm notification table fields
Field Description
Name The string assigned to the element that had an event
State The current state of the element
Reason The event type that was triggered
Last Value The data value of the element when the event was triggered
Current Value The current data value of the element
Time Time when the event occurred
Fabric Watch Administrator’s Guide 9553-1002153-01
Fabric Watch Configuration Using Web Tools9
To display the alarms page, perform the following steps.
1. Open the Fabric Watch window.
2. In Fabric Watch Explorer, select the class that you want to check for alarms.
3. Select the Alarm Notification tab.
4. In Area Selection, select the area that you want to check for alarms from the list. All alarms for that area display.
E-mail notificationYou can be notified of an alarm condition through an e-mail alert. If you have configured alarms to send an e-mail notification, you must also configure the e-mail server and the e-mail recipient, as described in the following sections.
Configuring the e-mail server on a switch
You must set up the e-mail notification recipient’s DNS server and domain name on each switch for which e-mail notification is enabled.
To configure the alert e-mail address on the switch, perform the following steps.
1. Open the Switch Administration window.
2. Select the Switch tab.
3. In the DNS Configuration area, in the DNS Server 1 field, enter the primary Domain Name Server IP address. You can enter the IP address in IPv4 or IPv6 format.
4. In the DNS Server 2 field, enter the secondary Domain Name Server IP address. You can enter the IP address in IPv4 or IPv6 format.
5. In the Domain Name field, enter the domain name (between 4 and 32 characters).
6. Click Apply.
Enabling the e-mail alert
You can set a different e-mail alert configuration for each FRU class. For example, you can set one e-mail notification for SFPs and another for E_Ports. Before configuring e-mail alert recipients, you must set up the e-mail notification recipient’s DNS server and domain name. Refer to “Configuring the e-mail server on a switch” on page 96.
Fabric OS v7.0.0 supports up to five e-mail addresses. E-mail addresses must not exceed 128 characters.
NOTEYou must execute the fwalfilterset 1 command to enable e-mail notification. Refer to the Fabric OS Command Reference.
96 Fabric Watch Administrator’s Guide53-1002153-01
Fabric Watch Configuration Using Web Tools 9
To enable an e-mail alerts recipient, perform the following steps.
1. Open the Fabric Watch window.
2. Select the Email Configuration tab.
3. Select a FRU class in the Fabric Watch Explorer tree.
4. Click Enable.
5. Enter the e-mail address of the recipients in the Recipient Email Address field.
Separate the e-mail addresses with commas.
6. Click Apply.
7. Repeat steps 3 through 6 for any additional FRU classes.
8. Optional: Click Send Test Email to receive a test e-mail so you can verify the e-mail notification is working correctly. You can send a test e-mail only after you have applied your settings.
Disabling the e-mail alert
When you disable e-mail alerts, Fabric Watch does not send e-mail notification, even if the e-mail notification method is assigned to monitored areas.
To disable an e-mail alerts recipient, perform the following steps.
1. Open the Fabric Watch window.
2. Select the Email Configuration tab.
3. Select a FRU class in the Fabric Watch Explorer tree.
4. Click Disable.
5. Optional: Enter the word “NONE” in the Recipient Email Address field.
You can disable the e-mail notification without removing the e-mail addresses.
6. Click Apply.
7. Repeat steps 3 through 6 for any additional FRU classes.
Fabric Watch Administrator’s Guide 9753-1002153-01

Fabric Watch Configuration Using Web Tools9
98 Fabric Watch Administrator’s Guide53-1002153-01
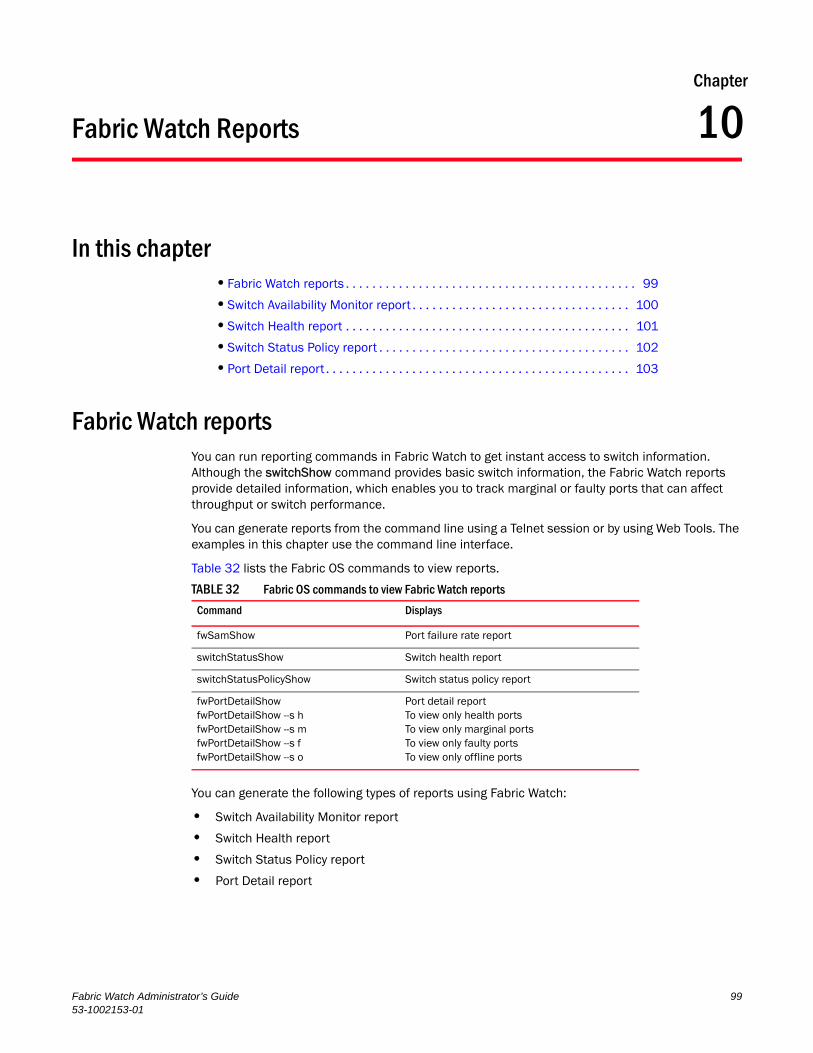
Fabric Watch Administrator’s Guide53-1002153-01
Chapter
10
Fabric Watch ReportsIn this chapter•Fabric Watch reports . . . . . . . . . . . . . . . . . . . . . . . . . . . . . . . . . . . . . . . . . . . . 99
•Switch Availability Monitor report . . . . . . . . . . . . . . . . . . . . . . . . . . . . . . . . . 100
•Switch Health report . . . . . . . . . . . . . . . . . . . . . . . . . . . . . . . . . . . . . . . . . . . 101
•Switch Status Policy report . . . . . . . . . . . . . . . . . . . . . . . . . . . . . . . . . . . . . . 102
•Port Detail report . . . . . . . . . . . . . . . . . . . . . . . . . . . . . . . . . . . . . . . . . . . . . . 103
Fabric Watch reports You can run reporting commands in Fabric Watch to get instant access to switch information. Although the switchShow command provides basic switch information, the Fabric Watch reports provide detailed information, which enables you to track marginal or faulty ports that can affect throughput or switch performance.
You can generate reports from the command line using a Telnet session or by using Web Tools. The examples in this chapter use the command line interface.
Table 32 lists the Fabric OS commands to view reports.
You can generate the following types of reports using Fabric Watch:
• Switch Availability Monitor report
• Switch Health report
• Switch Status Policy report
• Port Detail report
TABLE 32 Fabric OS commands to view Fabric Watch reports
Command Displays
fwSamShow Port failure rate report
switchStatusShow Switch health report
switchStatusPolicyShow Switch status policy report
fwPortDetailShowfwPortDetailShow --s hfwPortDetailShow --s mfwPortDetailShow --s ffwPortDetailShow --s o
Port detail reportTo view only health portsTo view only marginal portsTo view only faulty portsTo view only offline ports
99
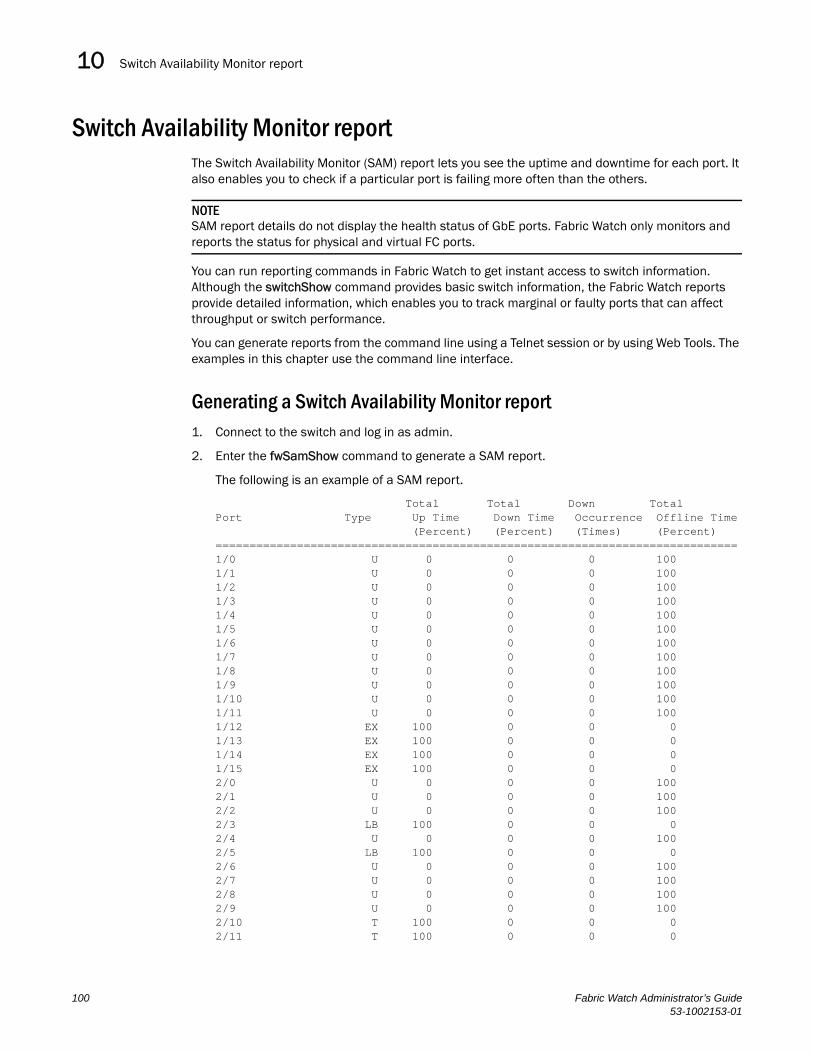
Switch Availability Monitor report10
Switch Availability Monitor reportThe Switch Availability Monitor (SAM) report lets you see the uptime and downtime for each port. It also enables you to check if a particular port is failing more often than the others.
NOTESAM report details do not display the health status of GbE ports. Fabric Watch only monitors and reports the status for physical and virtual FC ports.
You can run reporting commands in Fabric Watch to get instant access to switch information. Although the switchShow command provides basic switch information, the Fabric Watch reports provide detailed information, which enables you to track marginal or faulty ports that can affect throughput or switch performance.
You can generate reports from the command line using a Telnet session or by using Web Tools. The examples in this chapter use the command line interface.
Generating a Switch Availability Monitor report1. Connect to the switch and log in as admin.
2. Enter the fwSamShow command to generate a SAM report.
The following is an example of a SAM report.
Total Total Down TotalPort Type Up Time Down Time Occurrence Offline Time (Percent) (Percent) (Times) (Percent)=============================================================================1/0 U 0 0 0 100 1/1 U 0 0 0 100 1/2 U 0 0 0 100 1/3 U 0 0 0 100 1/4 U 0 0 0 100 1/5 U 0 0 0 100 1/6 U 0 0 0 100 1/7 U 0 0 0 100 1/8 U 0 0 0 100 1/9 U 0 0 0 100 1/10 U 0 0 0 100 1/11 U 0 0 0 100 1/12 EX 100 0 0 0 1/13 EX 100 0 0 0 1/14 EX 100 0 0 0 1/15 EX 100 0 0 0 2/0 U 0 0 0 100 2/1 U 0 0 0 100 2/2 U 0 0 0 100 2/3 LB 100 0 0 0 2/4 U 0 0 0 100 2/5 LB 100 0 0 0 2/6 U 0 0 0 100 2/7 U 0 0 0 100 2/8 U 0 0 0 100 2/9 U 0 0 0 100 2/10 T 100 0 0 0 2/11 T 100 0 0 0
100 Fabric Watch Administrator’s Guide53-1002153-01
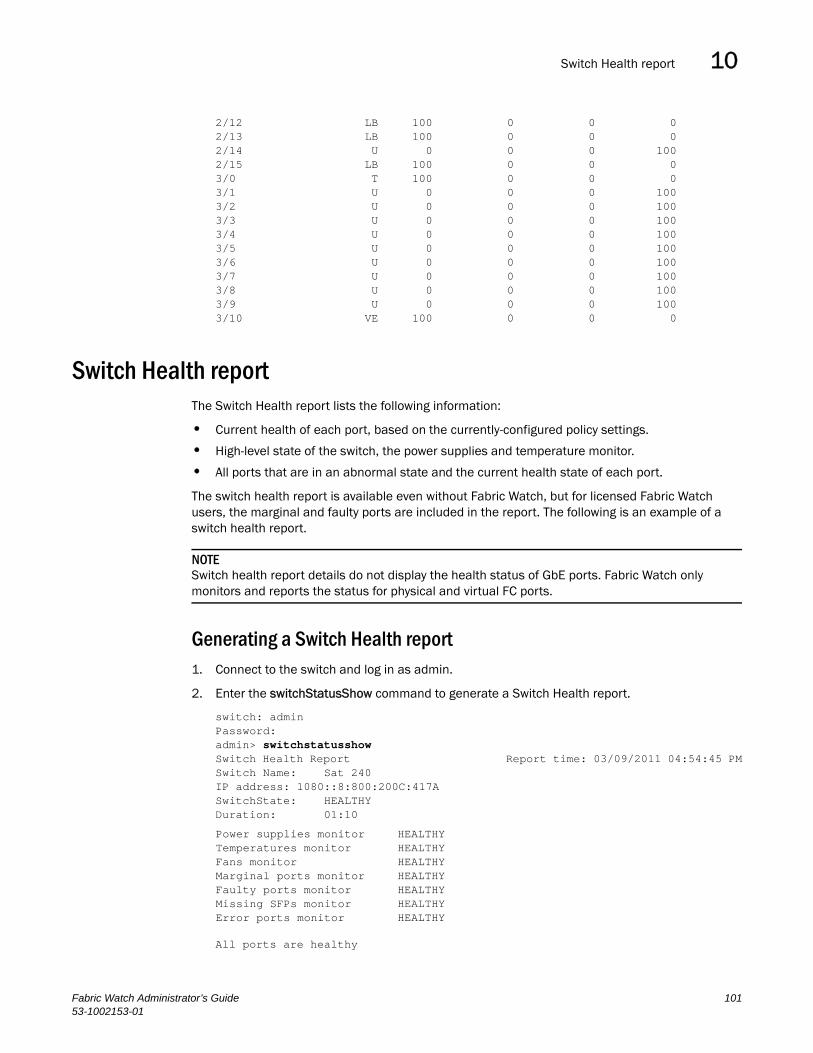
Switch Health report 10
2/12 LB 100 0 0 0 2/13 LB 100 0 0 0 2/14 U 0 0 0 100 2/15 LB 100 0 0 0 3/0 T 100 0 0 0 3/1 U 0 0 0 100 3/2 U 0 0 0 100 3/3 U 0 0 0 100 3/4 U 0 0 0 100 3/5 U 0 0 0 100 3/6 U 0 0 0 100 3/7 U 0 0 0 100 3/8 U 0 0 0 100 3/9 U 0 0 0 100 3/10 VE 100 0 0 0
Switch Health reportThe Switch Health report lists the following information:
• Current health of each port, based on the currently-configured policy settings.
• High-level state of the switch, the power supplies and temperature monitor.
• All ports that are in an abnormal state and the current health state of each port.
The switch health report is available even without Fabric Watch, but for licensed Fabric Watch users, the marginal and faulty ports are included in the report. The following is an example of a switch health report.
NOTESwitch health report details do not display the health status of GbE ports. Fabric Watch only monitors and reports the status for physical and virtual FC ports.
Generating a Switch Health report1. Connect to the switch and log in as admin.
2. Enter the switchStatusShow command to generate a Switch Health report.
switch: adminPassword:admin> switchstatusshowSwitch Health Report Report time: 03/09/2011 04:54:45 PMSwitch Name: Sat 240IP address: 1080::8:800:200C:417ASwitchState: HEALTHYDuration: 01:10
All ports are healthy
Power supplies monitor HEALTHYTemperatures monitor HEALTHYFans monitor HEALTHYMarginal ports monitor HEALTHYFaulty ports monitor HEALTHYMissing SFPs monitor HEALTHYError ports monitor HEALTHY
Fabric Watch Administrator’s Guide 10153-1002153-01
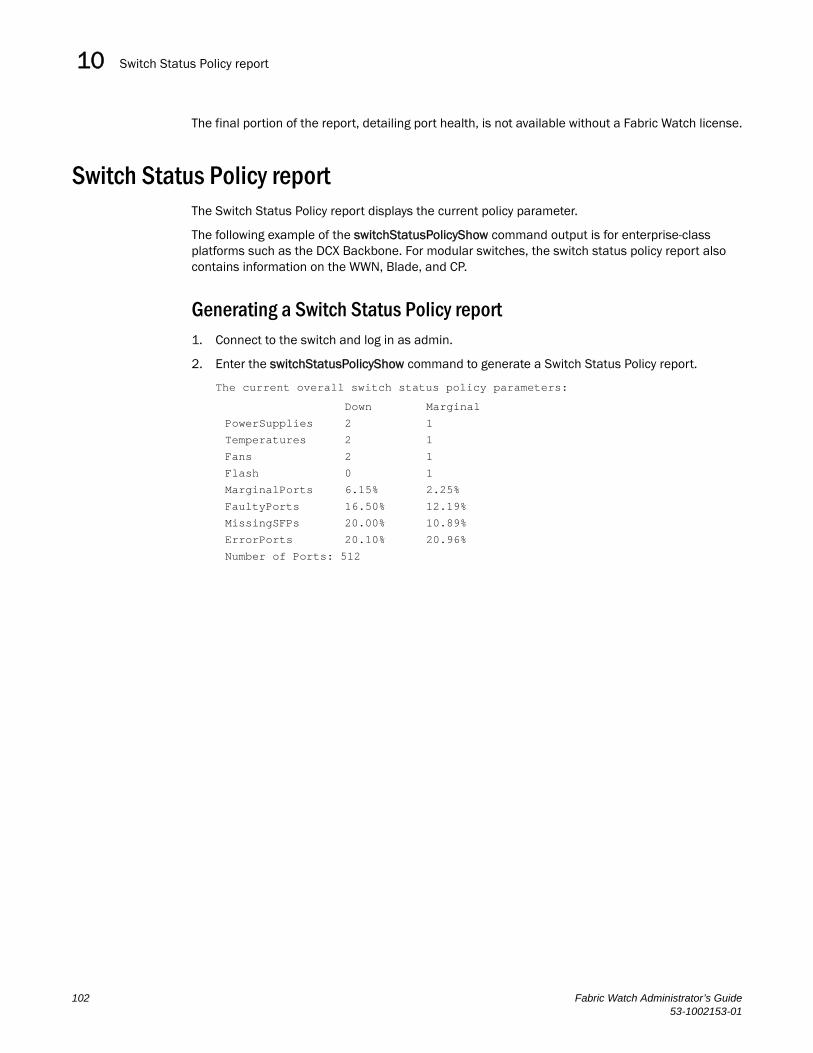
Switch Status Policy report10
The final portion of the report, detailing port health, is not available without a Fabric Watch license.
Switch Status Policy reportThe Switch Status Policy report displays the current policy parameter.
The following example of the switchStatusPolicyShow command output is for enterprise-class platforms such as the DCX Backbone. For modular switches, the switch status policy report also contains information on the WWN, Blade, and CP.
Generating a Switch Status Policy report1. Connect to the switch and log in as admin.
2. Enter the switchStatusPolicyShow command to generate a Switch Status Policy report.
The current overall switch status policy parameters:
Down Marginal
PowerSupplies 2 1
Temperatures 2 1
Fans 2 1
Flash 0 1
MarginalPorts 6.15% 2.25%
FaultyPorts 16.50% 12.19%
MissingSFPs 20.00% 10.89%
ErrorPorts 20.10% 20.96%
Number of Ports: 512
102 Fabric Watch Administrator’s Guide53-1002153-01
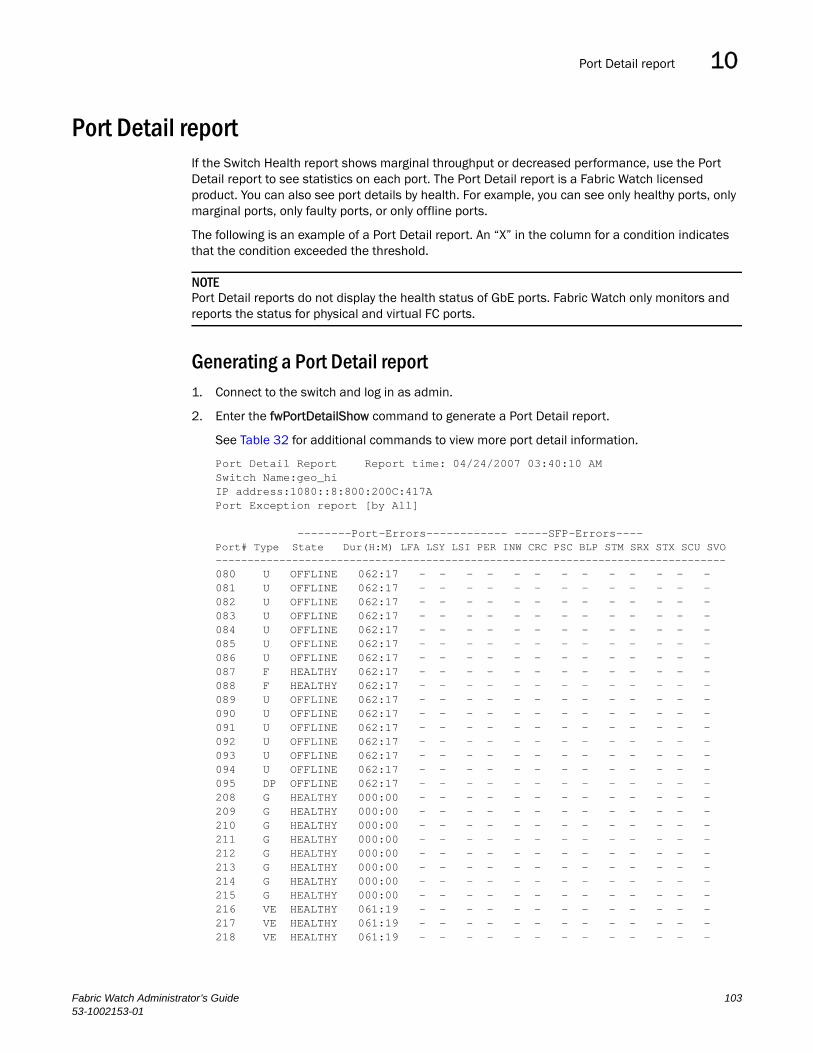
Port Detail report 10
Port Detail reportIf the Switch Health report shows marginal throughput or decreased performance, use the Port Detail report to see statistics on each port. The Port Detail report is a Fabric Watch licensed product. You can also see port details by health. For example, you can see only healthy ports, only marginal ports, only faulty ports, or only offline ports.
The following is an example of a Port Detail report. An “X” in the column for a condition indicates that the condition exceeded the threshold.
NOTEPort Detail reports do not display the health status of GbE ports. Fabric Watch only monitors and reports the status for physical and virtual FC ports.
Generating a Port Detail report1. Connect to the switch and log in as admin.
2. Enter the fwPortDetailShow command to generate a Port Detail report.
See Table 32 for additional commands to view more port detail information.
Port Detail Report Report time: 04/24/2007 03:40:10 AMSwitch Name:geo_hiIP address:1080::8:800:200C:417APort Exception report [by All]
--------Port-Errors------------ -----SFP-Errors----Port# Type State Dur(H:M) LFA LSY LSI PER INW CRC PSC BLP STM SRX STX SCU SVO--------------------------------------------------------------------------------080 U OFFLINE 062:17 - - - - - - - - - - - - -081 U OFFLINE 062:17 - - - - - - - - - - - - -082 U OFFLINE 062:17 - - - - - - - - - - - - -083 U OFFLINE 062:17 - - - - - - - - - - - - -084 U OFFLINE 062:17 - - - - - - - - - - - - -085 U OFFLINE 062:17 - - - - - - - - - - - - -086 U OFFLINE 062:17 - - - - - - - - - - - - -087 F HEALTHY 062:17 - - - - - - - - - - - - -088 F HEALTHY 062:17 - - - - - - - - - - - - -089 U OFFLINE 062:17 - - - - - - - - - - - - -090 U OFFLINE 062:17 - - - - - - - - - - - - -091 U OFFLINE 062:17 - - - - - - - - - - - - -092 U OFFLINE 062:17 - - - - - - - - - - - - -093 U OFFLINE 062:17 - - - - - - - - - - - - -094 U OFFLINE 062:17 - - - - - - - - - - - - -095 DP OFFLINE 062:17 - - - - - - - - - - - - -208 G HEALTHY 000:00 - - - - - - - - - - - - -209 G HEALTHY 000:00 - - - - - - - - - - - - -210 G HEALTHY 000:00 - - - - - - - - - - - - -211 G HEALTHY 000:00 - - - - - - - - - - - - -212 G HEALTHY 000:00 - - - - - - - - - - - - -213 G HEALTHY 000:00 - - - - - - - - - - - - -214 G HEALTHY 000:00 - - - - - - - - - - - - -215 G HEALTHY 000:00 - - - - - - - - - - - - -216 VE HEALTHY 061:19 - - - - - - - - - - - - -217 VE HEALTHY 061:19 - - - - - - - - - - - - -218 VE HEALTHY 061:19 - - - - - - - - - - - - -
Fabric Watch Administrator’s Guide 10353-1002153-01
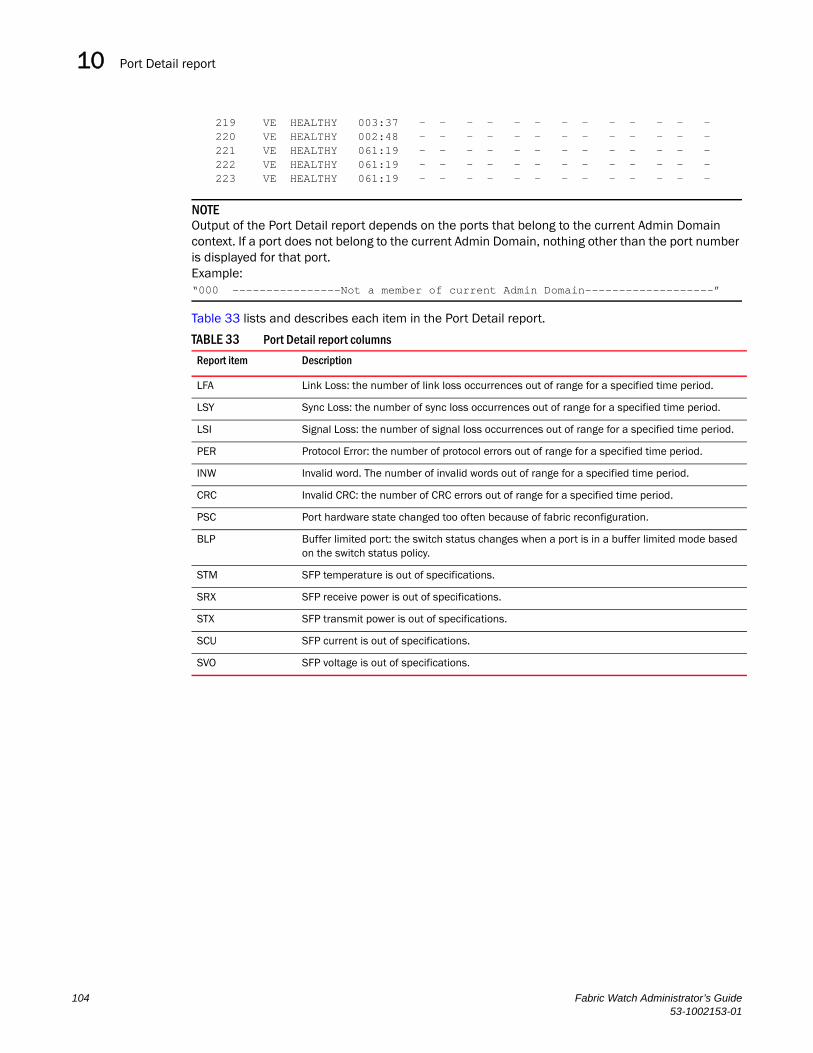
Port Detail report10
219 VE HEALTHY 003:37 - - - - - - - - - - - - -220 VE HEALTHY 002:48 - - - - - - - - - - - - -221 VE HEALTHY 061:19 - - - - - - - - - - - - -222 VE HEALTHY 061:19 - - - - - - - - - - - - -223 VE HEALTHY 061:19 - - - - - - - - - - - - -
NOTEOutput of the Port Detail report depends on the ports that belong to the current Admin Domain context. If a port does not belong to the current Admin Domain, nothing other than the port number is displayed for that port. Example:“000 ----------------Not a member of current Admin Domain-------------------”
Table 33 lists and describes each item in the Port Detail report.
TABLE 33 Port Detail report columns
Report item Description
LFA Link Loss: the number of link loss occurrences out of range for a specified time period.
LSY Sync Loss: the number of sync loss occurrences out of range for a specified time period.
LSI Signal Loss: the number of signal loss occurrences out of range for a specified time period.
PER Protocol Error: the number of protocol errors out of range for a specified time period.
INW Invalid word. The number of invalid words out of range for a specified time period.
CRC Invalid CRC: the number of CRC errors out of range for a specified time period.
PSC Port hardware state changed too often because of fabric reconfiguration.
BLP Buffer limited port: the switch status changes when a port is in a buffer limited mode based on the switch status policy.
STM SFP temperature is out of specifications.
SRX SFP receive power is out of specifications.
STX SFP transmit power is out of specifications.
SCU SFP current is out of specifications.
SVO SFP voltage is out of specifications.
104 Fabric Watch Administrator’s Guide53-1002153-01
Index
Aabove event triggers, 19access gateway mode, restrictions in Fabric Watch, 13action configuration guidelines, 3activating Fabric Watch, 25, 89
using a Telnet session, 25using SNMP, 26using Web Tools, 30
alarm behavior, 19alarm configuration report for Fabric Watch, 95alarm notification configuration, 36alarms
triggered, 10alarms, Fabric Watch
configuring, 92, 94displaying, 95enabling and disabling, 93
alerts configuration recommendations, 4area
environment class, 77fabric class, 39FRU class, 86performance monitor class, 47port class, 57resource class, 79security class, 42SFP class, 45
areas, 21audit messages, 12
Bbelow event trigger, 19
Cclass
environment, 22fabric, 22FRU, 22Performace Monitor, 22port, 23resource, 23security, 23SFP, 23
classes, description of, 22command
dnsConfig, 11errShow, 12fmConfig, 5fwclassinit, 26fwFruCfg, 3, 86fwMailCfg, 11licenseAdd, 26portThConfig, 3, 6, 57, 60snmpConfig, 12switchStatusPolicySet, 83sysMonitor, 8, 80, 81thConfig, 3, 5, 6, 48thMonitor, 6, 51
configuration guidelinesactions, 3threshold, 3
configuration tasks, list of, 31configuring
email notifications, 96Fabric Watch thresholds, 91FRU alarms, 94threshold alarms, Fabric Watch, 92
configuring alarm notifications, 36configuring ports, 60core blades, notification when removed, 83CPU and memory configuration, 82
Fabric Watch Administrator’s Guide 10553-1002153-01
Ddata values, 13DCFM, port fencing configuration, 72default settings
E_Port, 64environment class, 78Fabric class, 41FOP_Port and FCU_Port, 67performance monitor class
default settings, 47port class, 59VE_Port, 69
disablingFabric Watch threshold alarms, 93
displayingalarms, Fabric Watch, 95
EE_Port default settings, 64E_Port setting guidelines, 63e-mail alert, 11
how to disable, 34how to enable, 34setting recipient e-mail address, 35
e-mail notification configuration, 33email notifications, 96e-mail, testing a message, 35enabling
Fabric Watch threshold alarms, 93environment class
area, 77default settings, 78monitoring, 77recommended settings, 83
environment class areas, 77environment monitoring guidelines, 78event behavior types
triggered events, 10event settings, 18event triggers
above, 19below, 19
Ffabric class
areas, 39default settings, 41
fabric event monitoring, 5Fabric health concepts, 1fabric monitoring
guidelines, 39recommended settings, 54setting guidelines, 40
Fabric Watchactions, 7activation, 25, 89alarm behavior, 19alarms, 92audit messages, 12class areas, 21classes, 21, 22components, 21configuration tasks, 31customizing settings, 3description of, 1elements, 22fabric health, 1feature overview, 2interface types, 25interfaces for activating, 25licensing, 2notification types, 11role-based access control, 2support for virtual fabric, 8switch monitoring components, 5threshold component hierarchy, 5thresholds, 91
Fabric Watch configurationconfiguring e-mail alerts, 31configuring the FRU state, 32e-mail notification, 33initializing Fabric Watch classes, 31setting alarms filtering, 31setting port parameters, 32setting SFP, Fabric, Security, and Performance parameters, 31
setting system monitoring parameters, 32setting the alarm level, 31setting the port persistence time, 32setting the switch status policy, 32
Fabric Watch data values, 13Fabric Watch threshold components, 21fan status, displaying, 32
106 Fabric Watch Administrator’s Guide53-1002153-01
FCU_Port default settings, 67FCU_Port setting guidelines, 66FOP_Port default settings, 67FOP_Port setting guidelines, 66FRU alarms, configuring, 94FRU class
areas, 85configuration, 85recommended settings, 87specifying triggers for alarms, 87
FRU configuration, 32FRU monitoring, 85
Iinterface types, 25invalid CRC area, configuring, 61IP address, setting for notification, 35
LlicenseAdd key command, 26locked port log notification type, 12
Mmanagement information base (MIB), 9memory
configuration limits, 82configuring the usage threshold, 83
MIBs, using remotely, 9monitoring
customizing settings, 3fabric events, 5fabric setting guidelines, 40performance, 5security, 6security guidelines, 42SFP, 6SFP setting guidelines, 46system, 8
Nnotification configuration, 36
alarms, 36notification methods, 2
e-mail, 33e-mail alert, 11port log lock, 12
notification typee-mail alert, 11locked port log, 12RASlog, 12SNMP trap, 11
Pperformance monitor class areas, 47performance monitoring, 5
guidelines and settings, 47recommended settings, 54
physical port setting guides, 58port class
areas, 57default settings, 59guidelines and default settings, 58
port configuration, 60invalid CRC area, 61recommended settings table, 74
port fencingconfiguring using DCFM, 72description of, 7disabling, 72enabling, 72supported ports, 70
port log lock, 12port monitoring configuration, 32port persistence, 9
description of, 7setting, 32time setting, 69
port reports, how to create, 32port settings, custom, 60
Fabric Watch Administrator’s Guide 10753-1002153-01
QQSFP
description of, 50monitoring, 50support for, 6
RRASlog notification type, 12RASlog, generation when core blade is removed, 83RBAC, permissions required for Fabric Watch, 2relay host configuration
displaying, 36removing, 36setting, 35
resource classarea, 79default settings, 79recommended settings, 83setting guidelines, 79
resource class area, 79
Ssecurity class
areas, 42security monitoring, 6
recommended settings, 54setting time base, 17settings, customizing, 3SFP
support for 10 Gbps and 16 Gbps, 6SFP class
monitoring guidelines, 45SFP monitoring, 6
recommended settings, 54SNMP
components of, 9using to activate Fabric Watch, 26
switch monitoring components, 5switch policies, 8switch status policy
implementing, 84viewing, 85
switch status policy configuration, 32switch status policy planning, 83switch temperature, displaying, 32
sysMonitorcommand, 80command examples, 81
system monitoring, 8system monitoring configuration, 32
TTelnet, using to activate Fabric Watch, 25temperature, configuring using sysMonitor command, 81thConfig command
configuration options, 48thMonitor command
configuration options, 6, 51threshold alarms, Fabric Watch
configuring threshold alarms, 92enabling and disabling, 93
threshold configurationguidelines, 3
threshold values, 15thresholds
above event trigger, 19below event trigger, 19event settings, 18time bases, 17
time basedefinition of, 13, 17set to none, 17set to other than none, 17
triggered event behavior, 10
VVE_Port class default settings, 69
WWeb Tools, using to activate Fabric Watch, 30
108 Fabric Watch Administrator’s Guide53-1002153-01

PRIMERGYPRIMERGY FCスイッチブレード (8Gbps 18/8)
PRIMERGY FCスイッチブレード (8Gbps 18/8)&FCポートアップグレード
PRIMERGY FCスイッチブレード (8Gbps 18/8)&拡張ライセンスオプション
PRIMERGY BX Fibre Channel Switch 8Gbit/s 18/8(Brocade 5450)
Fabric Watch 管理者ガイド (v7.0.0)
CA92344-0161-01
発行日 2012年4月
発行責任 富士通株式会社
●本書の内容は、改善のため事前連絡なしに変更することがあります。
●本書に記載されたデータの使用に起因する、第三者の特許権およびその他
の権利の侵害については、当社はその責を負いません。
●無断転載を禁じます。
Recommended