Factors Affecting Profitability at Casinos in the Competitive Northeast
Prepared By:
GGH - Morowitz Gaming Advisors, LLC & Global Gaming & Hospitality, LLC
February 2017
Factors Affecting Profitability in the Competitive Northeast February 2017
2 | P a g e
INTRODUCTION
Casino gaming is a maturing industry. The proliferation of gaming throughout the United States means that almost every American has, or will have, convenient access to a casino within close proximity. This maturation has had profound impacts on the legacy gaming operations. Operators can no longer rely on room expansion or other capital expenditure projects to induce growth or create reasonable returns on invested capital. Revenues in almost every U.S. market (except those with new gaming supply) have experienced anemic or even negative revenue growth. The casino industry is now firmly entrenched in a new era of share stealing and hyper‐competitiveness. Operators must now rationalize their offerings and reposition themselves to compete more effectively in this environment.
Global Gaming & Hospitality and Morowitz Gaming Advisors (“GGH”) acknowledge the reality of this dilemma and are committed to providing gaming operators and investors with analytics that can help them optimize the financial performance of their gaming operations and investments. In that regard, we have undertaken a project to codify our observations analyzing gaming operations throughout the U.S., while providing our perspective regarding ongoing trends and best practices in the management of casino operations. This is the first of a series of White Papers that are devoted to informing gaming operators of the results of our analyses as well as providing actionable recommendations to enhance operating performance.
The Northeast casino marketplace is one of the most competitive gaming markets in the U.S. and, therefore, has experienced some of the most significant impacts of competition. The analysis that follows focuses on this dynamically competitive market.
Factors Affecting Profitability in the Competitive Northeast February 2017
3 | P a g e
EXECUTIVE SUMMARY
GGH recently analyzed data in the competitive Northeast gaming market. We undertook this
analysis in order to identify the drivers of profitability among a sample of casinos who report this
data, including the importance of promotional allowances and free play. The results of our
analysis are interesting in that they show that driving profitability (defined as EBITDA) is not just
a function of tax rates or marketing spend. There is much more to the story. As the gaming
industry matures and markets become more competitive, managing the interplay between taxes,
marketing spend and operational complexity will become of critical import to all operators. Our
analysis indicates the following:
Driving revenue per unit capacity vs. peers is the most important predictor of profitability
and net operating margin (EBITDA/Net Revenues). This ability is related mostly to location
(proximity to population concentrations) and then to overall strategic positioning and
execution; however, achieving high revenues relative to capacity requires the right
balance of amenities and facilities for the particular market and competitive situation.
Achieving that balance requires diligence among operators to not over‐spend on facilities
or amenities that are often low or negative profit margin producers.
There is no correlation between high taxes and margins because profitable operators
adjust marketing strategies and operational complexity (i.e. mix of amenities and capital
spending) in order to maximize EBITDA margins.
Optimizing promotional allowances and free play is critical to achieving high margins –
Casinos that over use free play and promotional allowances to maximize revenue may be
doing more harm than good to their bottom line. More is not always better as often times
casinos spend too much on low profit or unprofitable customers. Achieving the right mix
of spend requires an understanding of the casino’s positioning in the market and a
disciplined approach to deployment of promotional allowances expenditures.
In a hyper competitive market, for properties that have to do more with less, understanding
your position in the market, focusing on the core customer and developing a value proposition
for which customers are willing to pay, while reducing overall marketing spend, is the best
strategy to producing higher margins and EBITDA.
Factors Affecting Profitability in the Competitive Northeast February 2017
4 | P a g e
THE ANALYSIS
In the competitive Northeast gaming sector, gaming taxes, marketing costs and payroll are the
three largest expenses on the casino’s profit and loss statement. As the gaming industry
continues to mature and revenue growth is no longer assured, managing these expense
categories is the key to maintaining or growing operating margins. Labor costs are typically
managed through sophisticated processes such as balancing staffing to demand, optimizing the
part time and full time employee mix, and replacing labor with technology and capital
investment to enhance productivity.
In some jurisdictions, like Nevada and Atlantic City, gaming taxes are fixed and applied to both
slot and table revenues at the same rates. However, in many other jurisdictions, table revenues
are taxed at rates significantly lower than slot revenues and balancing the interaction of these
revenue streams is extremely important to optimizing operating profits.
Marketing costs, including promotional allowances, are a controllable expense area in which
casino operators can manage the often significant impact on their property’s bottom line.
Optimizing marketing costs requires the operator to hit the sweet spot where the marginal return
on marketing dollars remains positive ‐ that is, the last dollar of marketing expense results in
more than a dollar of additional revenue. Unfortunately, many operators do not use a systematic
approach to identifying/deploying these costs on a per player or per tier basis, which oftentimes
results in over‐spending on low (or negative) margin customer retention.
In the hypercompetitive Northeast gaming sector, managing the interplay between marketing,
gaming tax rates and promotional costs can be the difference between success and failure,
including operating at a premium to the Market’s average profitability margins or, conversely, at
a deficit. Competition in the Northeast heated up at the end of 2006, with the opening of casinos
in the Pocono Mountains and at Yonkers Raceway, which altered the previous supply/demand
dynamic. Consequently, since the end of 2006, the Northeast and Mid‐Atlantic states have
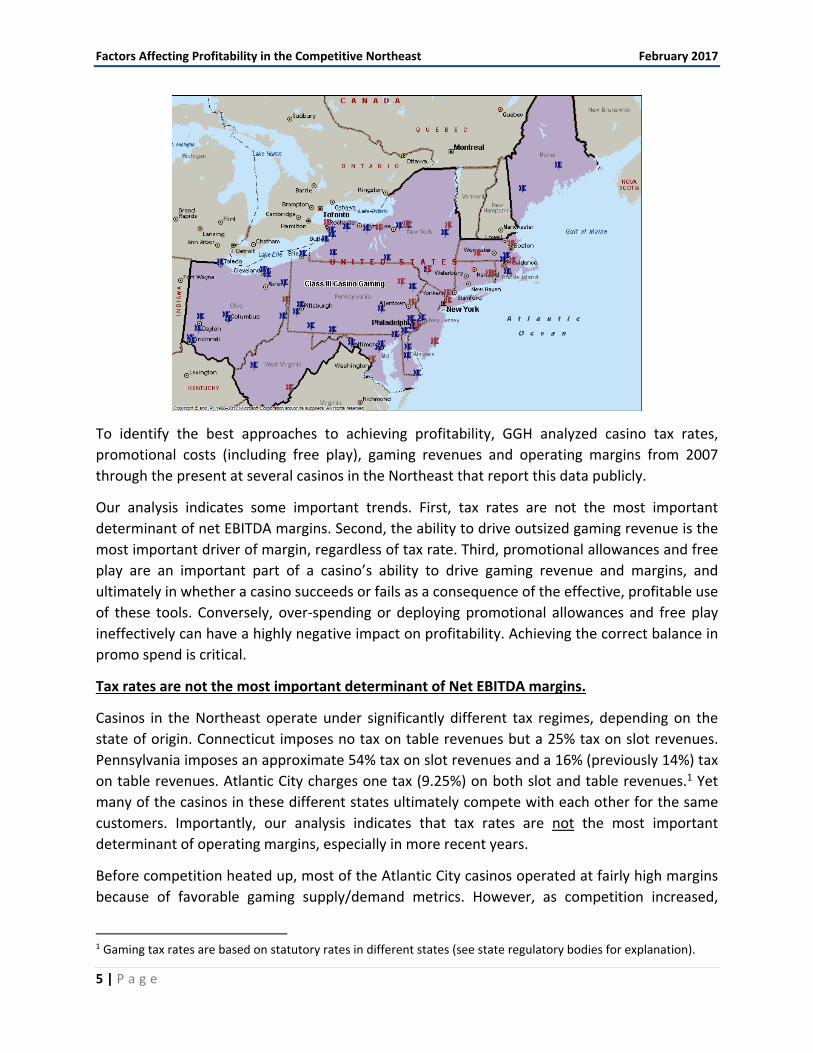
become a hypercompetitive market place, with 53 casinos serving patrons in almost every
geographic area from Maryland through Maine.
Factors Affecting Profitability in the Competitive Northeast February 2017
5 | P a g e
To identify the best approaches to achieving profitability, GGH analyzed casino tax rates,
promotional costs (including free play), gaming revenues and operating margins from 2007
through the present at several casinos in the Northeast that report this data publicly.
Our analysis indicates some important trends. First, tax rates are not the most important
determinant of net EBITDA margins. Second, the ability to drive outsized gaming revenue is the
most important driver of margin, regardless of tax rate. Third, promotional allowances and free
play are an important part of a casino’s ability to drive gaming revenue and margins, and
ultimately in whether a casino succeeds or fails as a consequence of the effective, profitable use
of these tools. Conversely, over‐spending or deploying promotional allowances and free play
ineffectively can have a highly negative impact on profitability. Achieving the correct balance in
promo spend is critical.
Tax rates are not the most important determinant of Net EBITDA margins.
Casinos in the Northeast operate under significantly different tax regimes, depending on the
state of origin. Connecticut imposes no tax on table revenues but a 25% tax on slot revenues.
Pennsylvania imposes an approximate 54% tax on slot revenues and a 16% (previously 14%) tax
on table revenues. Atlantic City charges one tax (9.25%) on both slot and table revenues.1 Yet
many of the casinos in these different states ultimately compete with each other for the same
customers. Importantly, our analysis indicates that tax rates are not the most important
determinant of operating margins, especially in more recent years.
Before competition heated up, most of the Atlantic City casinos operated at fairly high margins
because of favorable gaming supply/demand metrics. However, as competition increased,
1 Gaming tax rates are based on statutory rates in different states (see state regulatory bodies for explanation).
Factors Affecting Profitability in the Competitive Northeast February 2017
6 | P a g e
revenues declined at many casinos and marketing costs increased, leading to lower profit margins
and failures at several casinos.
In 2016, the market stabilized and the casinos with the highest margins were Mohegan Sun in
Connecticut, the Borgata in Atlantic City and Sands Bethlehem in Pennsylvania ‐ casinos with
widely disparate tax rates. As the following charts indicate, these casinos owe their higher
margins to a combination of higher revenues and more efficient use of promotional allowances
and free play.
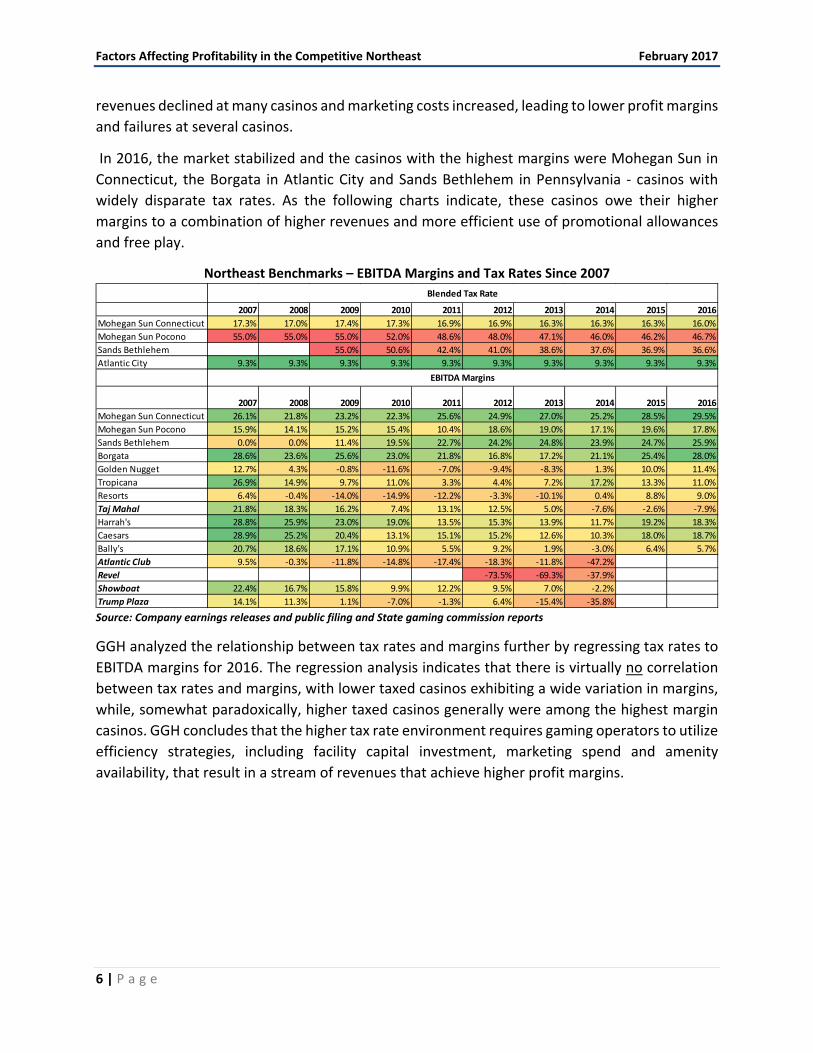
Northeast Benchmarks – EBITDA Margins and Tax Rates Since 2007
Source: Company earnings releases and public filing and State gaming commission reports
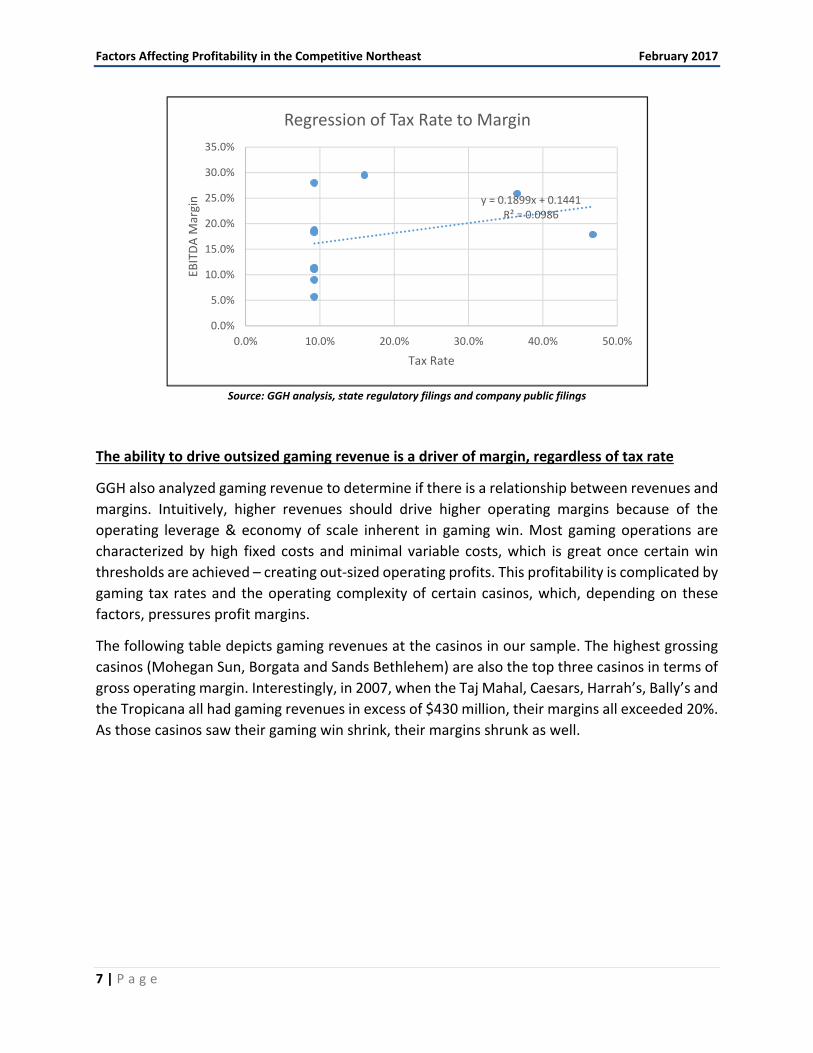
GGH analyzed the relationship between tax rates and margins further by regressing tax rates to
EBITDA margins for 2016. The regression analysis indicates that there is virtually no correlation
between tax rates and margins, with lower taxed casinos exhibiting a wide variation in margins,
while, somewhat paradoxically, higher taxed casinos generally were among the highest margin
casinos. GGH concludes that the higher tax rate environment requires gaming operators to utilize
efficiency strategies, including facility capital investment, marketing spend and amenity
availability, that result in a stream of revenues that achieve higher profit margins.
2007 2008 2009 2010 2011 2012 2013 2014 2015 2016
Mohegan Sun Connecticut 17.3% 17.0% 17.4% 17.3% 16.9% 16.9% 16.3% 16.3% 16.3% 16.0%
Mohegan Sun Pocono 55.0% 55.0% 55.0% 52.0% 48.6% 48.0% 47.1% 46.0% 46.2% 46.7%
Sands Bethlehem 55.0% 50.6% 42.4% 41.0% 38.6% 37.6% 36.9% 36.6%
Atlantic City 9.3% 9.3% 9.3% 9.3% 9.3% 9.3% 9.3% 9.3% 9.3% 9.3%
2007 2008 2009 2010 2011 2012 2013 2014 2015 2016
Mohegan Sun Connecticut 26.1% 21.8% 23.2% 22.3% 25.6% 24.9% 27.0% 25.2% 28.5% 29.5%
Mohegan Sun Pocono 15.9% 14.1% 15.2% 15.4% 10.4% 18.6% 19.0% 17.1% 19.6% 17.8%
Sands Bethlehem 0.0% 0.0% 11.4% 19.5% 22.7% 24.2% 24.8% 23.9% 24.7% 25.9%
Borgata 28.6% 23.6% 25.6% 23.0% 21.8% 16.8% 17.2% 21.1% 25.4% 28.0%
Golden Nugget 12.7% 4.3% ‐0.8% ‐11.6% ‐7.0% ‐9.4% ‐8.3% 1.3% 10.0% 11.4%
Tropicana 26.9% 14.9% 9.7% 11.0% 3.3% 4.4% 7.2% 17.2% 13.3% 11.0%
Resorts 6.4% ‐0.4% ‐14.0% ‐14.9% ‐12.2% ‐3.3% ‐10.1% 0.4% 8.8% 9.0%
Taj Mahal 21.8% 18.3% 16.2% 7.4% 13.1% 12.5% 5.0% ‐7.6% ‐2.6% ‐7.9%
Harrah's 28.8% 25.9% 23.0% 19.0% 13.5% 15.3% 13.9% 11.7% 19.2% 18.3%
Caesars 28.9% 25.2% 20.4% 13.1% 15.1% 15.2% 12.6% 10.3% 18.0% 18.7%
Bally's 20.7% 18.6% 17.1% 10.9% 5.5% 9.2% 1.9% ‐3.0% 6.4% 5.7%
Atlantic Club 9.5% ‐0.3% ‐11.8% ‐14.8% ‐17.4% ‐18.3% ‐11.8% ‐47.2%
Revel ‐73.5% ‐69.3% ‐37.9%
Showboat 22.4% 16.7% 15.8% 9.9% 12.2% 9.5% 7.0% ‐2.2%
Trump Plaza 14.1% 11.3% 1.1% ‐7.0% ‐1.3% 6.4% ‐15.4% ‐35.8%
Blended Tax Rate
EBITDA Margins
Factors Affecting Profitability in the Competitive Northeast February 2017
7 | P a g e
Source: GGH analysis, state regulatory filings and company public filings
The ability to drive outsized gaming revenue is a driver of margin, regardless of tax rate
GGH also analyzed gaming revenue to determine if there is a relationship between revenues and
margins. Intuitively, higher revenues should drive higher operating margins because of the
operating leverage & economy of scale inherent in gaming win. Most gaming operations are
characterized by high fixed costs and minimal variable costs, which is great once certain win
thresholds are achieved – creating out‐sized operating profits. This profitability is complicated by
gaming tax rates and the operating complexity of certain casinos, which, depending on these
factors, pressures profit margins.
The following table depicts gaming revenues at the casinos in our sample. The highest grossing
casinos (Mohegan Sun, Borgata and Sands Bethlehem) are also the top three casinos in terms of
gross operating margin. Interestingly, in 2007, when the Taj Mahal, Caesars, Harrah’s, Bally’s and
the Tropicana all had gaming revenues in excess of $430 million, their margins all exceeded 20%.
As those casinos saw their gaming win shrink, their margins shrunk as well.
y = 0.1899x + 0.1441R² = 0.0986
0.0%
5.0%
10.0%
15.0%
20.0%
25.0%
30.0%
35.0%
0.0% 10.0% 20.0% 30.0% 40.0% 50.0%
EBITDA M
argin
Tax Rate
Regression of Tax Rate to Margin
Factors Affecting Profitability in the Competitive Northeast February 2017
8 | P a g e
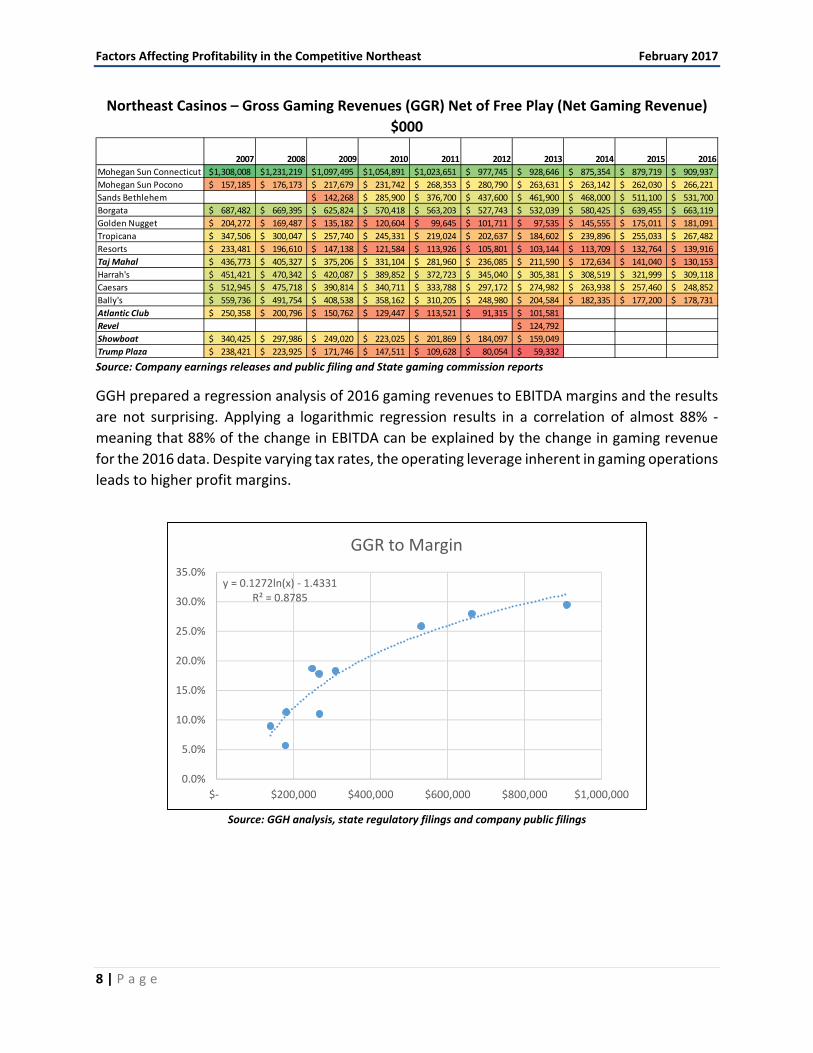
Northeast Casinos – Gross Gaming Revenues (GGR) Net of Free Play (Net Gaming Revenue)
$000
Source: Company earnings releases and public filing and State gaming commission reports
GGH prepared a regression analysis of 2016 gaming revenues to EBITDA margins and the results
are not surprising. Applying a logarithmic regression results in a correlation of almost 88% ‐
meaning that 88% of the change in EBITDA can be explained by the change in gaming revenue
for the 2016 data. Despite varying tax rates, the operating leverage inherent in gaming operations
leads to higher profit margins.
Source: GGH analysis, state regulatory filings and company public filings
2007 2008 2009 2010 2011 2012 2013 2014 2015 2016
Mohegan Sun Connecticut 1,308,008$ 1,231,219$ 1,097,495$ 1,054,891$ 1,023,651$ 977,745$ 928,646$ 875,354$ 879,719$ 909,937$
Mohegan Sun Pocono 157,185$ 176,173$ 217,679$ 231,742$ 268,353$ 280,790$ 263,631$ 263,142$ 262,030$ 266,221$
Sands Bethlehem 142,268$ 285,900$ 376,700$ 437,600$ 461,900$ 468,000$ 511,100$ 531,700$
Borgata 687,482$ 669,395$ 625,824$ 570,418$ 563,203$ 527,743$ 532,039$ 580,425$ 639,455$ 663,119$
Golden Nugget 204,272$ 169,487$ 135,182$ 120,604$ 99,645$ 101,711$ 97,535$ 145,555$ 175,011$ 181,091$
Tropicana 347,506$ 300,047$ 257,740$ 245,331$ 219,024$ 202,637$ 184,602$ 239,896$ 255,033$ 267,482$
Resorts 233,481$ 196,610$ 147,138$ 121,584$ 113,926$ 105,801$ 103,144$ 113,709$ 132,764$ 139,916$
Taj Mahal 436,773$ 405,327$ 375,206$ 331,104$ 281,960$ 236,085$ 211,590$ 172,634$ 141,040$ 130,153$
Harrah's 451,421$ 470,342$ 420,087$ 389,852$ 372,723$ 345,040$ 305,381$ 308,519$ 321,999$ 309,118$
Caesars 512,945$ 475,718$ 390,814$ 340,711$ 333,788$ 297,172$ 274,982$ 263,938$ 257,460$ 248,852$
Bally's 559,736$ 491,754$ 408,538$ 358,162$ 310,205$ 248,980$ 204,584$ 182,335$ 177,200$ 178,731$
Atlantic Club 250,358$ 200,796$ 150,762$ 129,447$ 113,521$ 91,315$ 101,581$
Revel 124,792$
Showboat 340,425$ 297,986$ 249,020$ 223,025$ 201,869$ 184,097$ 159,049$
Trump Plaza 238,421$ 223,925$ 171,746$ 147,511$ 109,628$ 80,054$ 59,332$
y = 0.1272ln(x) ‐ 1.4331R² = 0.8785
0.0%
5.0%
10.0%
15.0%
20.0%
25.0%
30.0%
35.0%
$‐ $200,000 $400,000 $600,000 $800,000 $1,000,000
GGR to Margin
Factors Affecting Profitability in the Competitive Northeast February 2017
9 | P a g e
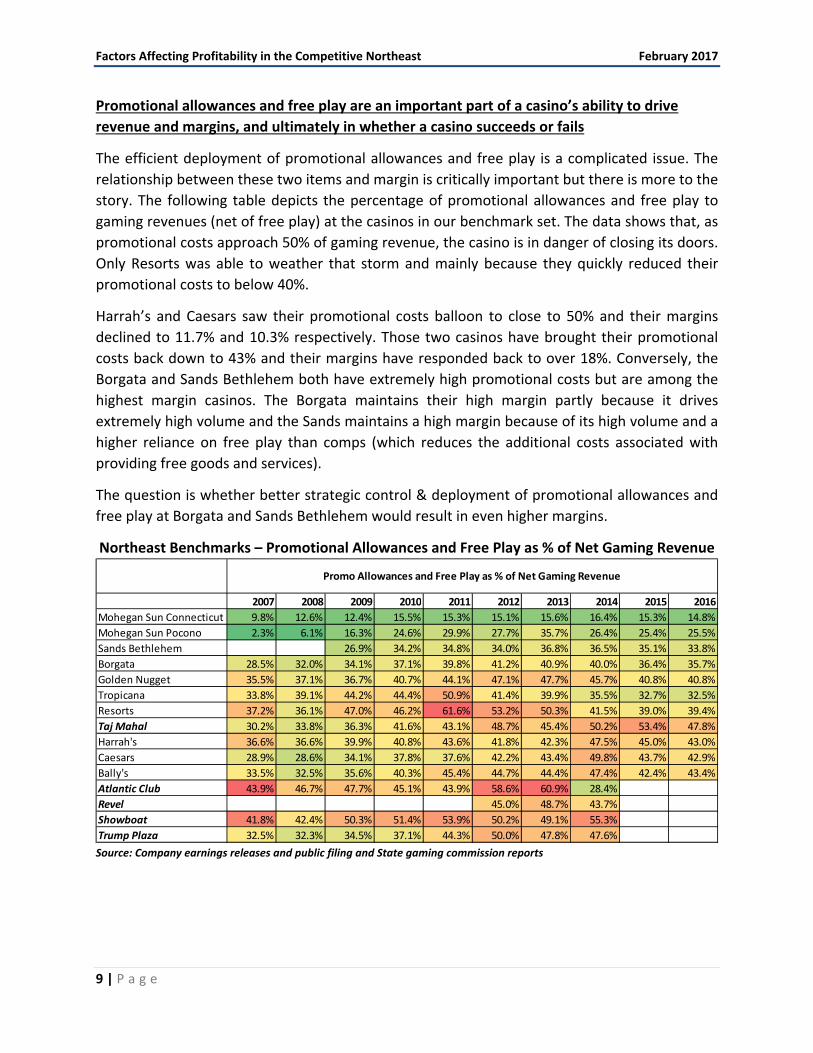
Promotional allowances and free play are an important part of a casino’s ability to drive
revenue and margins, and ultimately in whether a casino succeeds or fails
The efficient deployment of promotional allowances and free play is a complicated issue. The
relationship between these two items and margin is critically important but there is more to the
story. The following table depicts the percentage of promotional allowances and free play to
gaming revenues (net of free play) at the casinos in our benchmark set. The data shows that, as
promotional costs approach 50% of gaming revenue, the casino is in danger of closing its doors.
Only Resorts was able to weather that storm and mainly because they quickly reduced their
promotional costs to below 40%.
Harrah’s and Caesars saw their promotional costs balloon to close to 50% and their margins
declined to 11.7% and 10.3% respectively. Those two casinos have brought their promotional
costs back down to 43% and their margins have responded back to over 18%. Conversely, the
Borgata and Sands Bethlehem both have extremely high promotional costs but are among the
highest margin casinos. The Borgata maintains their high margin partly because it drives
extremely high volume and the Sands maintains a high margin because of its high volume and a
higher reliance on free play than comps (which reduces the additional costs associated with
providing free goods and services).
The question is whether better strategic control & deployment of promotional allowances and
free play at Borgata and Sands Bethlehem would result in even higher margins.
Northeast Benchmarks – Promotional Allowances and Free Play as % of Net Gaming Revenue
Source: Company earnings releases and public filing and State gaming commission reports
2007 2008 2009 2010 2011 2012 2013 2014 2015 2016
Mohegan Sun Connecticut 9.8% 12.6% 12.4% 15.5% 15.3% 15.1% 15.6% 16.4% 15.3% 14.8%
Mohegan Sun Pocono 2.3% 6.1% 16.3% 24.6% 29.9% 27.7% 35.7% 26.4% 25.4% 25.5%
Sands Bethlehem 26.9% 34.2% 34.8% 34.0% 36.8% 36.5% 35.1% 33.8%
Borgata 28.5% 32.0% 34.1% 37.1% 39.8% 41.2% 40.9% 40.0% 36.4% 35.7%
Golden Nugget 35.5% 37.1% 36.7% 40.7% 44.1% 47.1% 47.7% 45.7% 40.8% 40.8%
Tropicana 33.8% 39.1% 44.2% 44.4% 50.9% 41.4% 39.9% 35.5% 32.7% 32.5%
Resorts 37.2% 36.1% 47.0% 46.2% 61.6% 53.2% 50.3% 41.5% 39.0% 39.4%
Taj Mahal 30.2% 33.8% 36.3% 41.6% 43.1% 48.7% 45.4% 50.2% 53.4% 47.8%
Harrah's 36.6% 36.6% 39.9% 40.8% 43.6% 41.8% 42.3% 47.5% 45.0% 43.0%
Caesars 28.9% 28.6% 34.1% 37.8% 37.6% 42.2% 43.4% 49.8% 43.7% 42.9%
Bally's 33.5% 32.5% 35.6% 40.3% 45.4% 44.7% 44.4% 47.4% 42.4% 43.4%
Atlantic Club 43.9% 46.7% 47.7% 45.1% 43.9% 58.6% 60.9% 28.4%
Revel 45.0% 48.7% 43.7%
Showboat 41.8% 42.4% 50.3% 51.4% 53.9% 50.2% 49.1% 55.3%
Trump Plaza 32.5% 32.3% 34.5% 37.1% 44.3% 50.0% 47.8% 47.6%
Promo Allowances and Free Play as % of Net Gaming Revenue
Factors Affecting Profitability in the Competitive Northeast February 2017
10 | P a g e
Promotional allowances include the retail value of food, beverage, rooms and other items that
are booked to revenue and then removed through a contra entry to promotional allowances.2
This results in casinos reporting revenues net of promotional allowances. Most benchmarks such
as operating profits or EBITDA margin are reported as a function of this net revenue.
In GGH’s opinion reporting in this manner impacts the comparability of the operating margins of
casinos because some casino operations are more complex than others. In some jurisdictions,
especially in many Tribal gaming environments, casinos might only be sprung structures, with
little in the way of amenities such as hotels or restaurants. In these environments, promotional
allowances are very low, because there is simply very little to give away. In other environments,
casinos can be quite complex.3
In Las Vegas, rooms, restaurants, entertainment and retail facilities are as important as gaming
facilities and are used both as profit centers and as enticements to draw gamers.4 In most
competitive markets, casinos typically offer many of these same amenities, but not at the same
scale of a Las Vegas casino. These amenities are used to drive gamers to facilities; consequently,
promotional allowances in these environments are much higher as a percentage of non‐gaming
revenues and the mix of cash to comp revenue is much lower than in a typical Las Vegas Strip
casino. This ultimately reduces overall profitability because the costs of these free goods and
services is not offset by cash paying customers.
The key issue however is the level of complexity that is introduced when a casino loads up on
amenities, which are typically low margin (outside Las Vegas), and uses them to entice gamers.
Those amenities add complexity to operations, requiring more employees, management, back of
the house and other inefficiencies. Most of the casinos in our benchmark set have a fair amount
of complexity. Each of them has a hotel, several restaurants, entertainment facilities, etc., and all
of these casinos rely on gaming revenue for the lion’s share of their profits, as opposed to cash
revenue from hotels, restaurants and other non‐gaming revenue streams.
Free play is another important part of the promotional spend. This form of marketing has become
the preferred method of marketing among many casinos in the Northeast and accounts for about
half of all promotional spending among the benchmark casinos, while casinos in Atlantic City
continue to lean heavily on comps.
2 The AICPA is studying this accounting treatment and is considering changes to its revenue recognition guidelines. However, current accounting convention reports revenues in the manner described. 3 GGH or affiliates have consulted with, managed and studied casinos in almost every jurisdiction in the U.S. and Canada. 4 Affiliates of GGH and its principals have operated casinos in Nevada and have studied the annual Nevada Gaming Abstracts to gain an understanding of the operating characteristics of Las Vegas casinos.
Factors Affecting Profitability in the Competitive Northeast February 2017
11 | P a g e
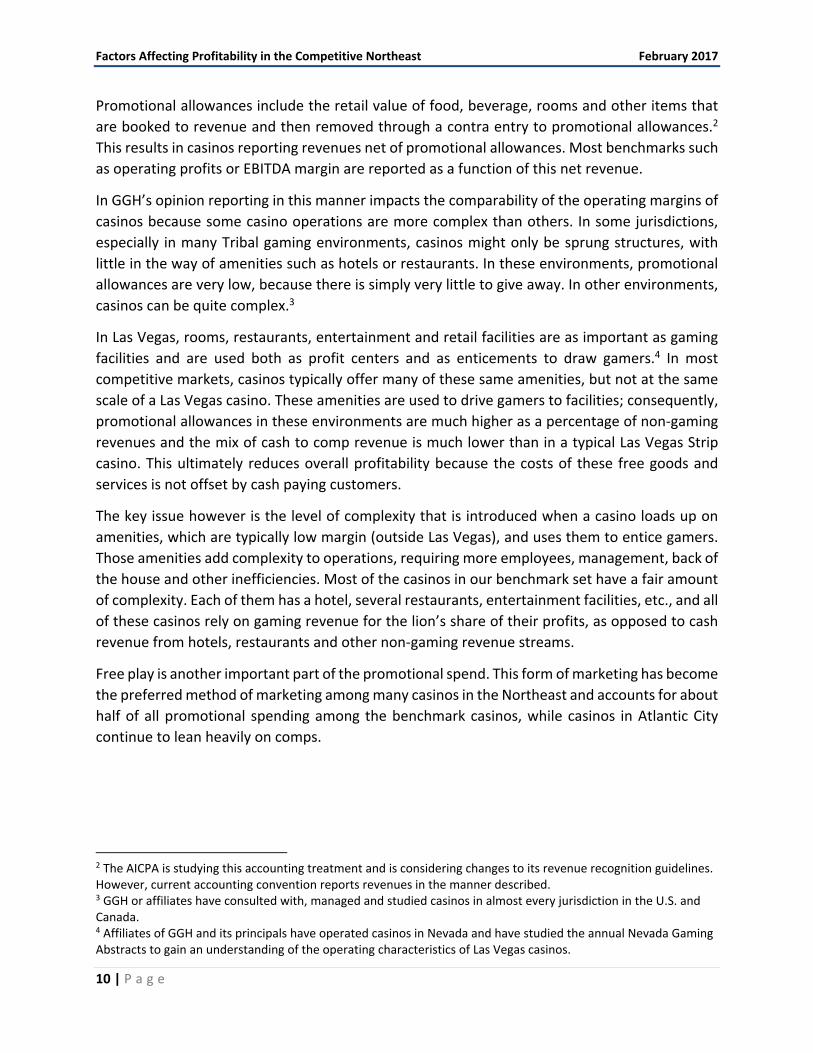
Source: Company earnings releases and public filing and State gaming commission reports
The following table shows the relationship between promotional allowances, taxes and margins
for 2016. Mohegan Sun Connecticut is among the most complex gaming facilities but has a
relatively low tax rate, spends very little on promotional allowances and free play, and has the
highest gaming revenue (GGR) in the benchmark set. Its margin is the highest in the group.
Borgata, another highly complex offering, uses promotional allowances and free play at a very
high rate but offsets this with high volume and a low tax rate to drive a margin almost as high as
Mohegan Sun. Sands Bethlehem has less complexity than both Mohegan Sun and the Borgata
(smaller hotel, fewer restaurants). This, along with high volume and a reliance on free play as
opposed to comps, allows it to overcome its high tax rate to drive a high margin.
Sands Bethlehem’s high table game volume also lowers its tax rate relative to other Pennsylvania
casinos. For instance, Mohegan Sun Pocono has a weighted tax rate over 10% higher than Sands
Bethlehem because its business is skewed more toward slots. This higher tax rate drives down its
overall profit margin. Casinos in Atlantic City are hampered by highly complex offerings, low
volume and higher promotional costs, which explains their generally lower profit margins.
0.0%
5.0%
10.0%
15.0%
20.0%
25.0%
2007 2008 2009 2010 2011 2012 2013 2014 2015 2016
Northeast Benchmarks Promo and Free Play as % of Net Gaming Revenue
Promo Allowance Free Play
Factors Affecting Profitability in the Competitive Northeast February 2017
12 | P a g e
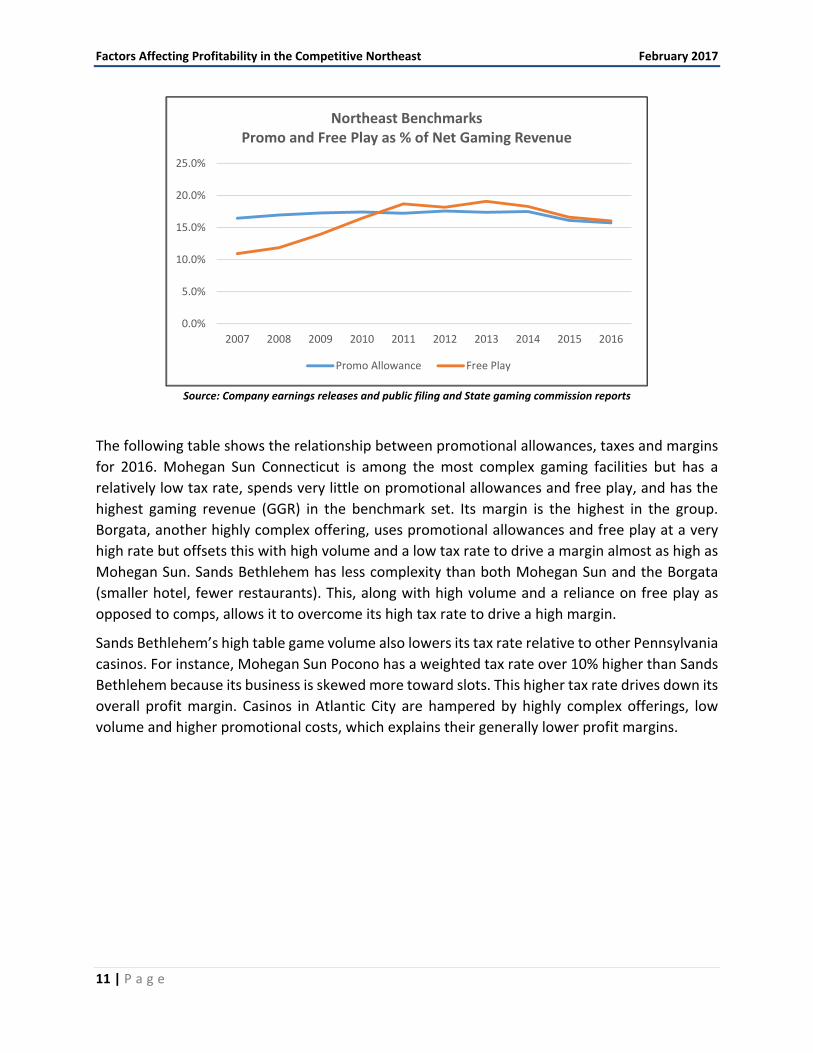
Northeast Benchmarks – Tax Rate, GGR, Promo & Margin Comparison
Source: Company earnings releases and public filing and State gaming commission reports
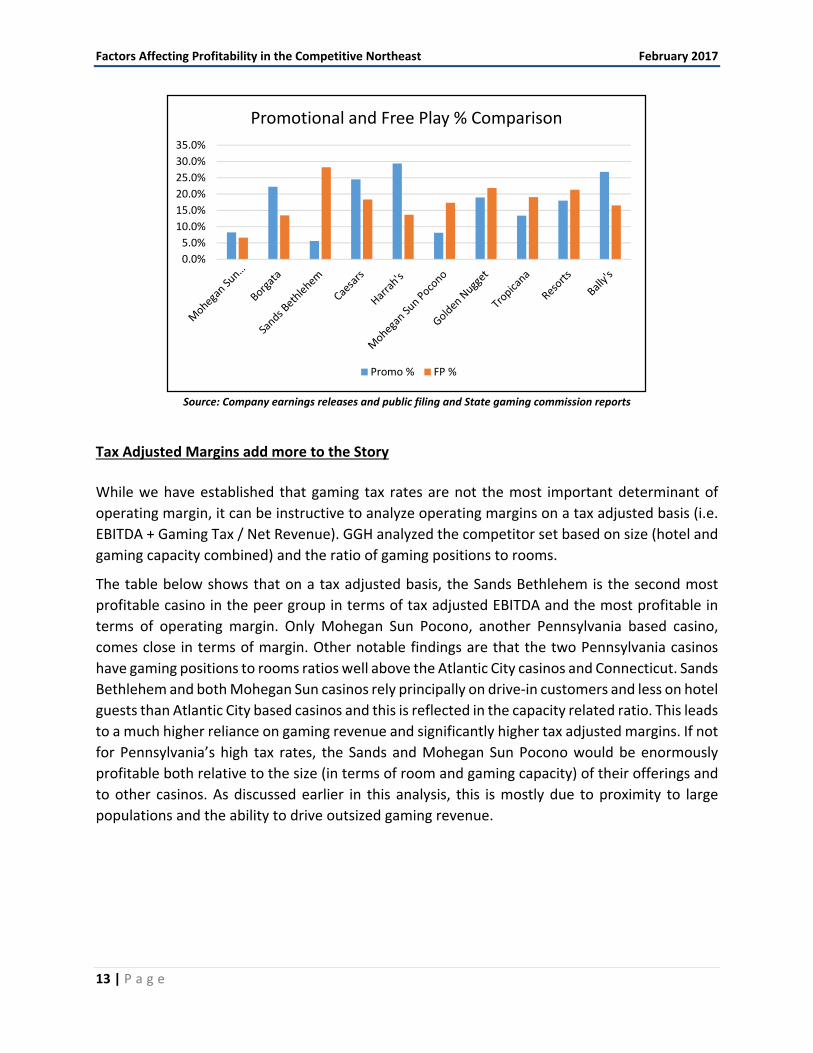
The differences in promotional strategies is highlighted by the following chart. Several Atlantic
City casinos rely more heavily on comps than on free play and, those that do, generally have
higher margins. The Borgata, Caesars and Harrah’s all spend considerably more as a percentage
of gaming revenue on promotional allowances as opposed to free play than any of the other
casinos in the benchmark set.
The data in this chart clearly identifies each firm’s promotional strategy. Mohegan Sun
Connecticut, due to limited competition, regulation and its history, spends very little on both
promotional allowances and free play (because they don’t have to) but we suspect this will
change once casinos open in Massachusetts. The Sands Bethlehem and Mohegan Sun Pocono
both rely more on Free Play (due to tax rate). The Sands is known to use free slot play to drive
table game play among a certain cohort of players and this drives up their free play percentage.
The Borgata, Harrah’s, Caesars and Bally’s all rely more on comps (and all but Bally’s have higher
margins) while the Golden Nugget, Tropicana and Resorts all are more selective in their
promotional strategies but lean more towards free play.
Tax Rate GGR
Promo and
FP Margin
Mohegan Sun Connecticut 16.0% 909,937$ 14.8% 29.5%
Borgata 9.3% 663,119$ 35.7% 28.0%
Sands Bethlehem 36.6% 531,700$ 33.8% 25.9%
Caesars 9.3% 248,852$ 42.9% 18.7%
Harrah's 9.3% 309,118$ 43.0% 18.3%
Mohegan Sun Pocono 46.7% 266,221$ 25.5% 17.8%
Golden Nugget 9.3% 181,091$ 40.8% 11.4%
Tropicana 9.3% 267,482$ 32.5% 11.0%
Resorts 9.3% 139,916$ 39.4% 9.0%
Bally's 9.3% 178,731$ 43.4% 5.7%
Factors Affecting Profitability in the Competitive Northeast February 2017
13 | P a g e
Source: Company earnings releases and public filing and State gaming commission reports
Tax Adjusted Margins add more to the Story
While we have established that gaming tax rates are not the most important determinant of
operating margin, it can be instructive to analyze operating margins on a tax adjusted basis (i.e.
EBITDA + Gaming Tax / Net Revenue). GGH analyzed the competitor set based on size (hotel and
gaming capacity combined) and the ratio of gaming positions to rooms.
The table below shows that on a tax adjusted basis, the Sands Bethlehem is the second most
profitable casino in the peer group in terms of tax adjusted EBITDA and the most profitable in
terms of operating margin. Only Mohegan Sun Pocono, another Pennsylvania based casino,
comes close in terms of margin. Other notable findings are that the two Pennsylvania casinos
have gaming positions to rooms ratios well above the Atlantic City casinos and Connecticut. Sands
Bethlehem and both Mohegan Sun casinos rely principally on drive‐in customers and less on hotel
guests than Atlantic City based casinos and this is reflected in the capacity related ratio. This leads
to a much higher reliance on gaming revenue and significantly higher tax adjusted margins. If not
for Pennsylvania’s high tax rates, the Sands and Mohegan Sun Pocono would be enormously
profitable both relative to the size (in terms of room and gaming capacity) of their offerings and
to other casinos. As discussed earlier in this analysis, this is mostly due to proximity to large
populations and the ability to drive outsized gaming revenue.
0.0%
5.0%
10.0%
15.0%
20.0%
25.0%
30.0%
35.0%
Promotional and Free Play % Comparison
Promo % FP %
Factors Affecting Profitability in the Competitive Northeast February 2017
14 | P a g e
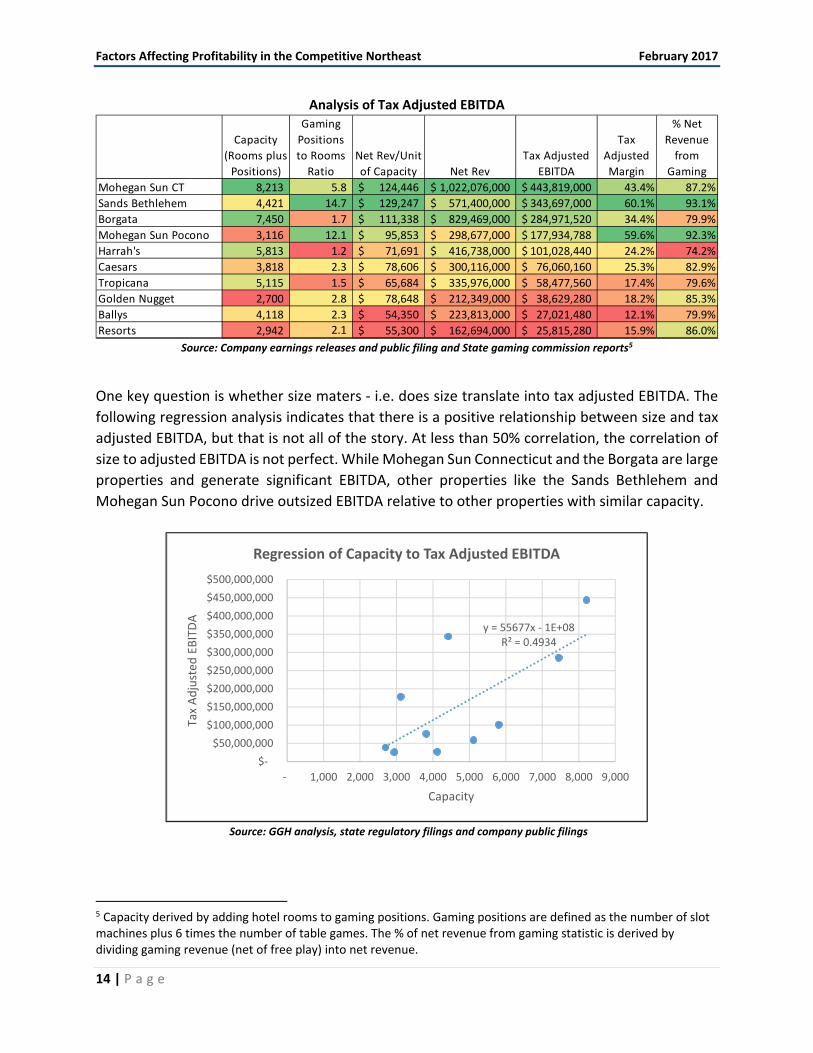
Analysis of Tax Adjusted EBITDA
Source: Company earnings releases and public filing and State gaming commission reports5
One key question is whether size maters ‐ i.e. does size translate into tax adjusted EBITDA. The
following regression analysis indicates that there is a positive relationship between size and tax
adjusted EBITDA, but that is not all of the story. At less than 50% correlation, the correlation of
size to adjusted EBITDA is not perfect. While Mohegan Sun Connecticut and the Borgata are large
properties and generate significant EBITDA, other properties like the Sands Bethlehem and
Mohegan Sun Pocono drive outsized EBITDA relative to other properties with similar capacity.
Source: GGH analysis, state regulatory filings and company public filings
5 Capacity derived by adding hotel rooms to gaming positions. Gaming positions are defined as the number of slot machines plus 6 times the number of table games. The % of net revenue from gaming statistic is derived by dividing gaming revenue (net of free play) into net revenue.
Capacity
(Rooms plus
Positions)
Gaming
Positions
to Rooms
Ratio
Net Rev/Unit
of Capacity Net Rev
Tax Adjusted
EBITDA
Tax
Adjusted
Margin
% Net
Revenue
from
Gaming
Mohegan Sun CT 8,213 5.8 124,446$ 1,022,076,000$ 443,819,000$ 43.4% 87.2%
Sands Bethlehem 4,421 14.7 129,247$ 571,400,000$ 343,697,000$ 60.1% 93.1%
Borgata 7,450 1.7 111,338$ 829,469,000$ 284,971,520$ 34.4% 79.9%
Mohegan Sun Pocono 3,116 12.1 95,853$ 298,677,000$ 177,934,788$ 59.6% 92.3%
Harrah's 5,813 1.2 71,691$ 416,738,000$ 101,028,440$ 24.2% 74.2%
Caesars 3,818 2.3 78,606$ 300,116,000$ 76,060,160$ 25.3% 82.9%
Tropicana 5,115 1.5 65,684$ 335,976,000$ 58,477,560$ 17.4% 79.6%
Golden Nugget 2,700 2.8 78,648$ 212,349,000$ 38,629,280$ 18.2% 85.3%
Ballys 4,118 2.3 54,350$ 223,813,000$ 27,021,480$ 12.1% 79.9%
Resorts 2,942 2.1 55,300$ 162,694,000$ 25,815,280$ 15.9% 86.0%
y = 55677x ‐ 1E+08R² = 0.4934
$‐
$50,000,000
$100,000,000
$150,000,000
$200,000,000
$250,000,000
$300,000,000
$350,000,000
$400,000,000
$450,000,000
$500,000,000
‐ 1,000 2,000 3,000 4,000 5,000 6,000 7,000 8,000 9,000
Tax Adjusted
EBITDA
Capacity
Regression of Capacity to Tax Adjusted EBITDA
Factors Affecting Profitability in the Competitive Northeast February 2017
15 | P a g e
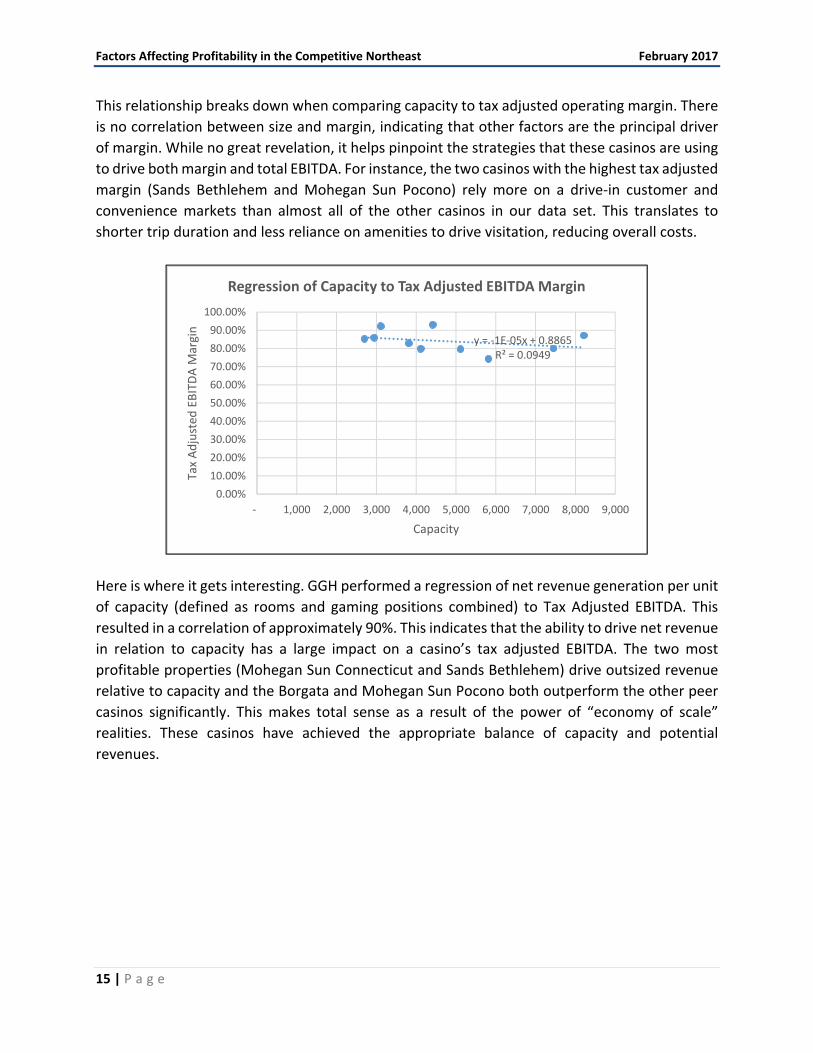
This relationship breaks down when comparing capacity to tax adjusted operating margin. There
is no correlation between size and margin, indicating that other factors are the principal driver
of margin. While no great revelation, it helps pinpoint the strategies that these casinos are using
to drive both margin and total EBITDA. For instance, the two casinos with the highest tax adjusted
margin (Sands Bethlehem and Mohegan Sun Pocono) rely more on a drive‐in customer and
convenience markets than almost all of the other casinos in our data set. This translates to
shorter trip duration and less reliance on amenities to drive visitation, reducing overall costs.
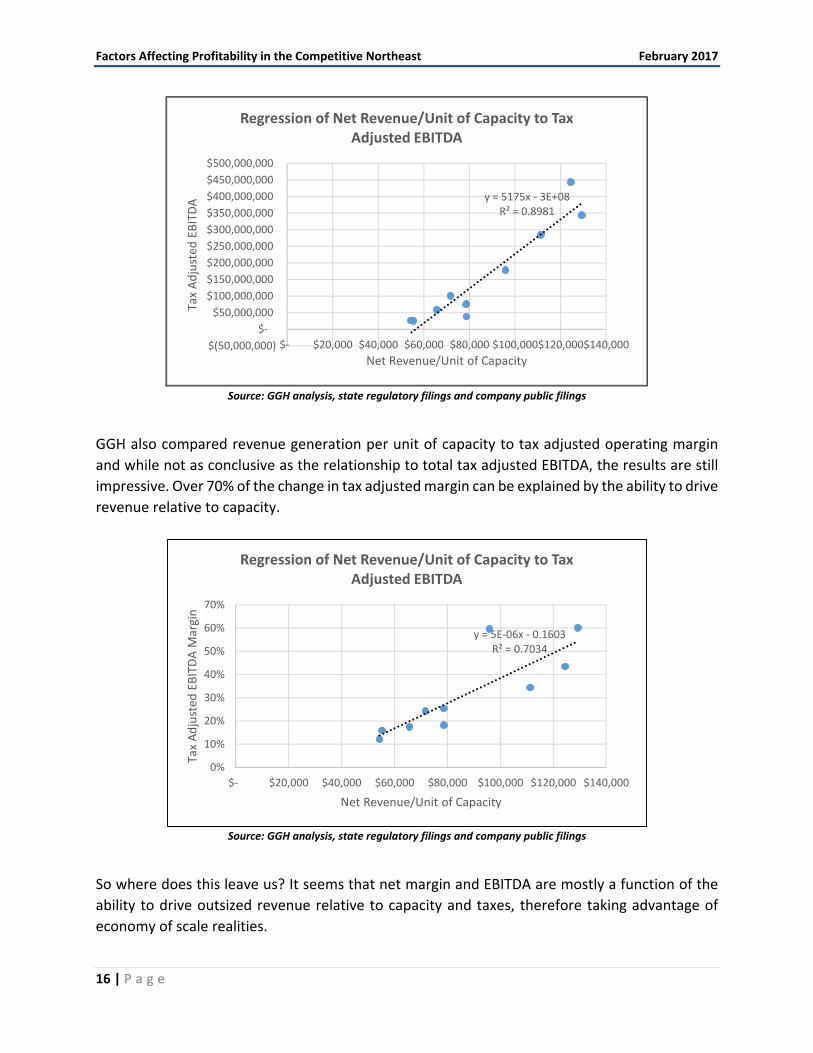
Here is where it gets interesting. GGH performed a regression of net revenue generation per unit
of capacity (defined as rooms and gaming positions combined) to Tax Adjusted EBITDA. This
resulted in a correlation of approximately 90%. This indicates that the ability to drive net revenue
in relation to capacity has a large impact on a casino’s tax adjusted EBITDA. The two most
profitable properties (Mohegan Sun Connecticut and Sands Bethlehem) drive outsized revenue
relative to capacity and the Borgata and Mohegan Sun Pocono both outperform the other peer
casinos significantly. This makes total sense as a result of the power of “economy of scale”
realities. These casinos have achieved the appropriate balance of capacity and potential
revenues.
y = ‐1E‐05x + 0.8865R² = 0.0949
0.00%
10.00%
20.00%
30.00%
40.00%
50.00%
60.00%
70.00%
80.00%
90.00%
100.00%
‐ 1,000 2,000 3,000 4,000 5,000 6,000 7,000 8,000 9,000
Tax Adjusted
EBITDA M
argin
Capacity
Regression of Capacity to Tax Adjusted EBITDA Margin
Factors Affecting Profitability in the Competitive Northeast February 2017
16 | P a g e
Source: GGH analysis, state regulatory filings and company public filings
GGH also compared revenue generation per unit of capacity to tax adjusted operating margin
and while not as conclusive as the relationship to total tax adjusted EBITDA, the results are still
impressive. Over 70% of the change in tax adjusted margin can be explained by the ability to drive
revenue relative to capacity.
Source: GGH analysis, state regulatory filings and company public filings
So where does this leave us? It seems that net margin and EBITDA are mostly a function of the
ability to drive outsized revenue relative to capacity and taxes, therefore taking advantage of
economy of scale realities.
y = 5175x ‐ 3E+08R² = 0.8981
$(50,000,000)
$‐
$50,000,000
$100,000,000
$150,000,000
$200,000,000
$250,000,000
$300,000,000
$350,000,000
$400,000,000
$450,000,000
$500,000,000
$‐ $20,000 $40,000 $60,000 $80,000 $100,000 $120,000 $140,000
Tax Adjusted
EBITDA
Net Revenue/Unit of Capacity
Regression of Net Revenue/Unit of Capacity to Tax Adjusted EBITDA
y = 5E‐06x ‐ 0.1603R² = 0.7034
0%
10%
20%
30%
40%
50%
60%
70%
$‐ $20,000 $40,000 $60,000 $80,000 $100,000 $120,000 $140,000
Tax Adjusted
EBITDA M
argin
Net Revenue/Unit of Capacity
Regression of Net Revenue/Unit of Capacity to Tax Adjusted EBITDA
Factors Affecting Profitability in the Competitive Northeast February 2017
17 | P a g e
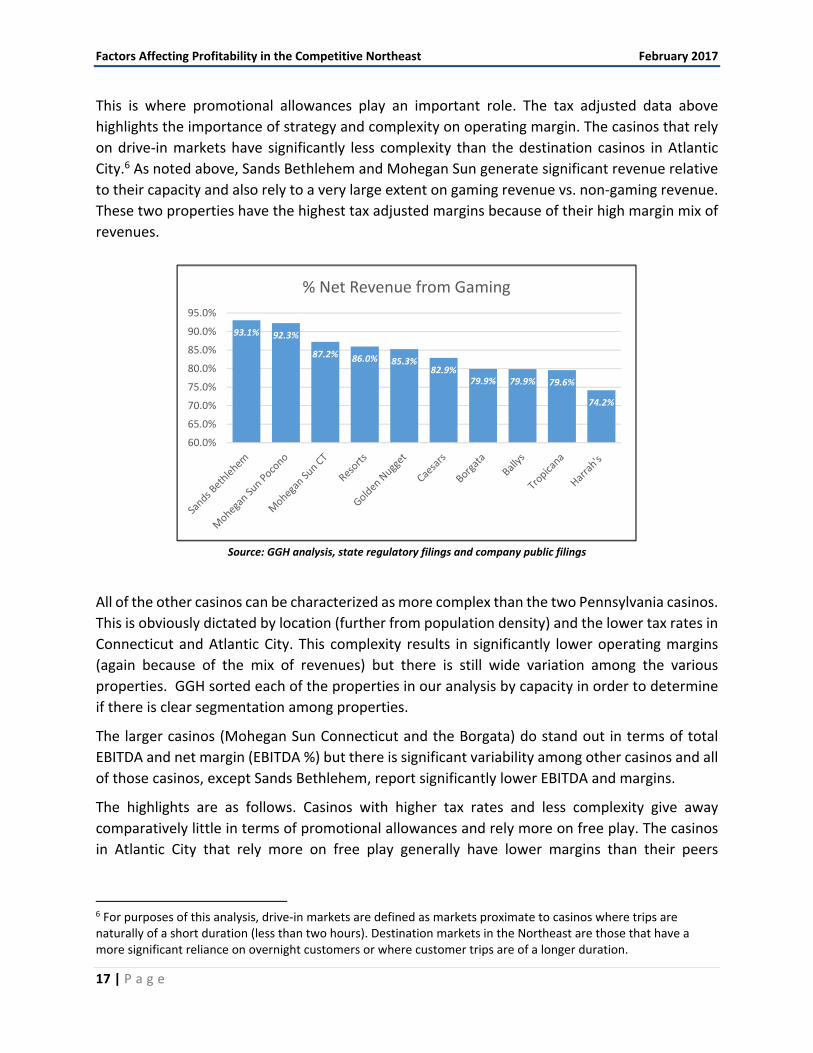
This is where promotional allowances play an important role. The tax adjusted data above
highlights the importance of strategy and complexity on operating margin. The casinos that rely
on drive‐in markets have significantly less complexity than the destination casinos in Atlantic
City.6 As noted above, Sands Bethlehem and Mohegan Sun generate significant revenue relative
to their capacity and also rely to a very large extent on gaming revenue vs. non‐gaming revenue.
These two properties have the highest tax adjusted margins because of their high margin mix of
revenues.
Source: GGH analysis, state regulatory filings and company public filings
All of the other casinos can be characterized as more complex than the two Pennsylvania casinos.
This is obviously dictated by location (further from population density) and the lower tax rates in
Connecticut and Atlantic City. This complexity results in significantly lower operating margins
(again because of the mix of revenues) but there is still wide variation among the various
properties. GGH sorted each of the properties in our analysis by capacity in order to determine
if there is clear segmentation among properties.
The larger casinos (Mohegan Sun Connecticut and the Borgata) do stand out in terms of total
EBITDA and net margin (EBITDA %) but there is significant variability among other casinos and all
of those casinos, except Sands Bethlehem, report significantly lower EBITDA and margins.
The highlights are as follows. Casinos with higher tax rates and less complexity give away
comparatively little in terms of promotional allowances and rely more on free play. The casinos
in Atlantic City that rely more on free play generally have lower margins than their peers
6 For purposes of this analysis, drive‐in markets are defined as markets proximate to casinos where trips are naturally of a short duration (less than two hours). Destination markets in the Northeast are those that have a more significant reliance on overnight customers or where customer trips are of a longer duration.
93.1% 92.3%
87.2% 86.0% 85.3%82.9%
79.9% 79.9% 79.6%
74.2%
60.0%
65.0%
70.0%
75.0%
80.0%
85.0%
90.0%
95.0%
% Net Revenue from Gaming
Factors Affecting Profitability in the Competitive Northeast February 2017
18 | P a g e
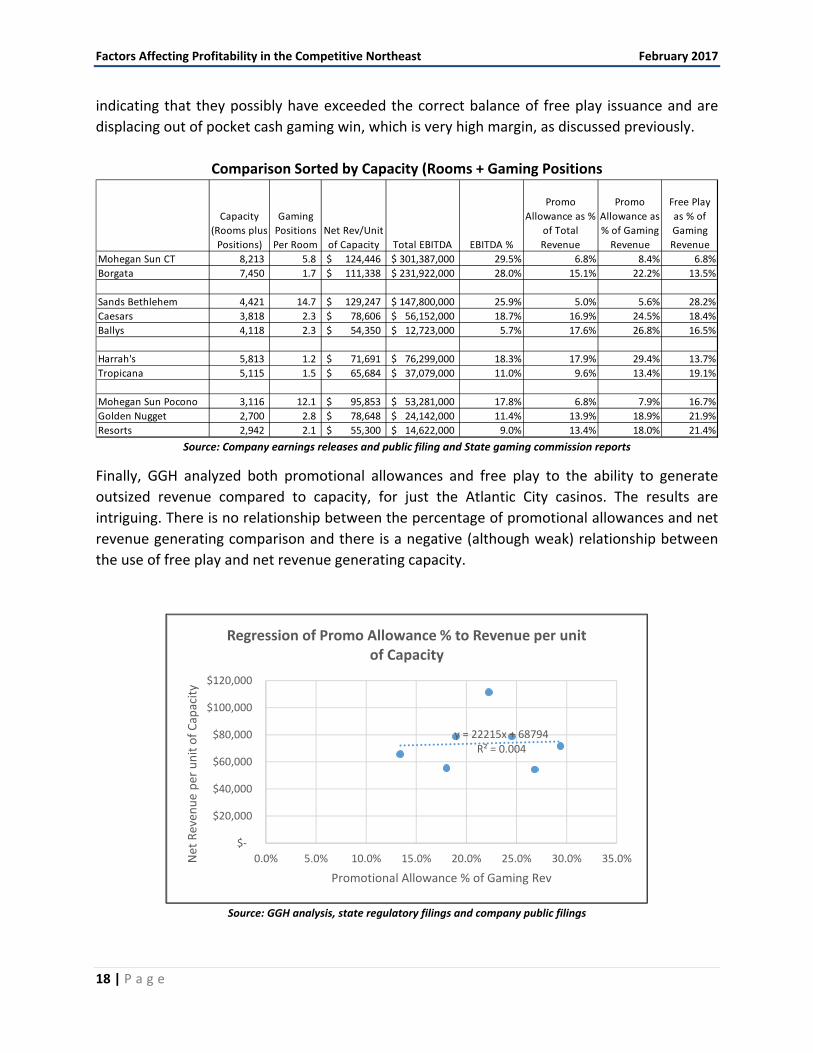
indicating that they possibly have exceeded the correct balance of free play issuance and are
displacing out of pocket cash gaming win, which is very high margin, as discussed previously.
Comparison Sorted by Capacity (Rooms + Gaming Positions
Source: Company earnings releases and public filing and State gaming commission reports
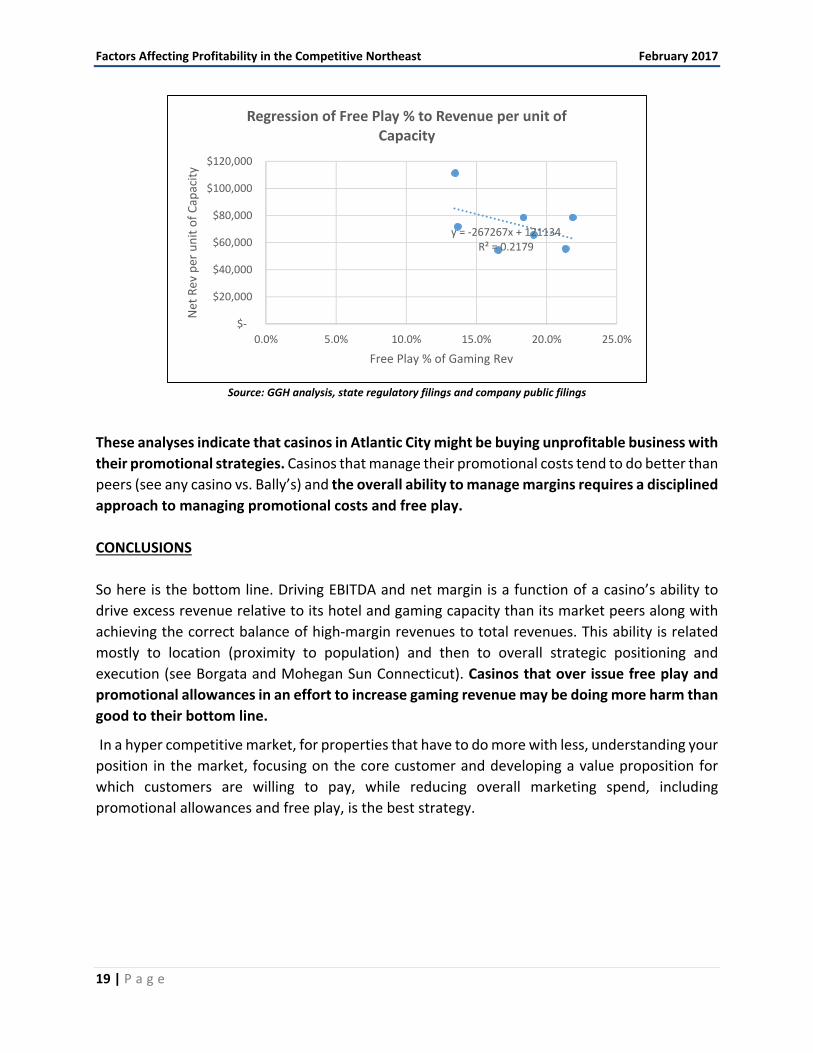
Finally, GGH analyzed both promotional allowances and free play to the ability to generate
outsized revenue compared to capacity, for just the Atlantic City casinos. The results are
intriguing. There is no relationship between the percentage of promotional allowances and net
revenue generating comparison and there is a negative (although weak) relationship between
the use of free play and net revenue generating capacity.
Source: GGH analysis, state regulatory filings and company public filings
Capacity
(Rooms plus
Positions)
Gaming
Positions
Per Room
Net Rev/Unit
of Capacity Total EBITDA EBITDA %
Promo
Allowance as %
of Total
Revenue
Promo
Allowance as
% of Gaming
Revenue
Free Play
as % of
Gaming
Revenue
Mohegan Sun CT 8,213 5.8 124,446$ 301,387,000$ 29.5% 6.8% 8.4% 6.8%
Borgata 7,450 1.7 111,338$ 231,922,000$ 28.0% 15.1% 22.2% 13.5%
Sands Bethlehem 4,421 14.7 129,247$ 147,800,000$ 25.9% 5.0% 5.6% 28.2%
Caesars 3,818 2.3 78,606$ 56,152,000$ 18.7% 16.9% 24.5% 18.4%
Ballys 4,118 2.3 54,350$ 12,723,000$ 5.7% 17.6% 26.8% 16.5%
Harrah's 5,813 1.2 71,691$ 76,299,000$ 18.3% 17.9% 29.4% 13.7%
Tropicana 5,115 1.5 65,684$ 37,079,000$ 11.0% 9.6% 13.4% 19.1%
Mohegan Sun Pocono 3,116 12.1 95,853$ 53,281,000$ 17.8% 6.8% 7.9% 16.7%
Golden Nugget 2,700 2.8 78,648$ 24,142,000$ 11.4% 13.9% 18.9% 21.9%
Resorts 2,942 2.1 55,300$ 14,622,000$ 9.0% 13.4% 18.0% 21.4%
y = 22215x + 68794R² = 0.004
$‐
$20,000
$40,000
$60,000
$80,000
$100,000
$120,000
0.0% 5.0% 10.0% 15.0% 20.0% 25.0% 30.0% 35.0%Net Reven
ue per unit of Capacity
Promotional Allowance % of Gaming Rev
Regression of Promo Allowance % to Revenue per unit of Capacity
Factors Affecting Profitability in the Competitive Northeast February 2017
19 | P a g e
Source: GGH analysis, state regulatory filings and company public filings
These analyses indicate that casinos in Atlantic City might be buying unprofitable business with
their promotional strategies. Casinos that manage their promotional costs tend to do better than
peers (see any casino vs. Bally’s) and the overall ability to manage margins requires a disciplined
approach to managing promotional costs and free play.
CONCLUSIONS
So here is the bottom line. Driving EBITDA and net margin is a function of a casino’s ability to
drive excess revenue relative to its hotel and gaming capacity than its market peers along with
achieving the correct balance of high‐margin revenues to total revenues. This ability is related
mostly to location (proximity to population) and then to overall strategic positioning and
execution (see Borgata and Mohegan Sun Connecticut). Casinos that over issue free play and
promotional allowances in an effort to increase gaming revenue may be doing more harm than
good to their bottom line.
In a hyper competitive market, for properties that have to do more with less, understanding your
position in the market, focusing on the core customer and developing a value proposition for
which customers are willing to pay, while reducing overall marketing spend, including
promotional allowances and free play, is the best strategy.
y = ‐267267x + 121134R² = 0.2179
$‐
$20,000
$40,000
$60,000
$80,000
$100,000
$120,000
0.0% 5.0% 10.0% 15.0% 20.0% 25.0%
Net Rev per unit of Capacity
Free Play % of Gaming Rev
Regression of Free Play % to Revenue per unit of Capacity
Factors Affecting Profitability in the Competitive Northeast February 2017
20 | P a g e
ABOUT GGH AND THE AUTHOR
GGH is a consortium of consulting firms serving the world wide gaming industry. GGH member firms are Global Gaming & Hospitality, LLC and Morowitz Gaming Advisors, LLC. GGH provides myriad services devoted to the gaming industry from pure consulting to M&A advisory. Service lines include Industry Knowledge, Capital Markets and Asset Management – exclusively dedicated to casino operators and investors. Most recently, GGH was the gaming licensee acting as owner/operator in the successful turnaround of the former John Asquaga’s Nugget in Sparks, Nevada, a 1,400 hotel room casino resort.
GGH used all of its available experience, tools and resources to acquire, operate, turn‐around and sell this large casino resort, which was acquired in partnership with one of its clients. Other recent initiatives include the launch of M2G, a data analytics platform that allows casinos to visualize and manage casino data to make optimal decisions involving marketing and promotional spend, labor deployment, capital expenditures and other important facets of casino operations. GGH also recently launched initiatives in the emerging AML reporting and compliance arena. These varied experiences have allowed GGH to develop a unique perspective & knowledge regarding casino operations throughout the U.S.
Cory Morowitz is the author of this study and one of GGH’s three managing partners (along with Carlton L. Geer and Michael S. Kim). He is responsible for the firm’s industry knowledge and analytics practice and has consulted to gaming firms throughout the world for over 25 years. Mr. Morowitz received his MBA from the Wharton School of the University of Pennsylvania, has been an adjunct professor in Drexel University’s hospitality program and is the author of numerous studies, articles and white papers. This is a first of a series of White Papers that GGH will be releasing for the benefit of the gaming industry. Cory can be reached at [email protected].
Recommended