Filtration Efficiency of Tricalcium Aluminate Filter Aid Synthesized
with Batch and Continuous Stirred Reactors
Reza Salimi1, Sue Ying Tan
2 and James Vaughan
3
1. Researcher
2. Researcher
3. Senior Lecturer
The University of Queensland, Brisbane, Australia
Corresponding author: [email protected]
Abstract
The filtration rate specific cake resistance (α) of tricalcium aluminate (TCA) aided filtration of
dilute bauxite residue slurry were measured and calculated. TCA was firstly crystallized from
synthetic and industrial Bayer liquor in both batch and continuous reactors. From the particle
size distribution, when synthesized in continuous operation, the majority of the particles were
smaller than 5 μm while a decrease in the amount of fine particles and a relatively narrow
particle size distribution was observed in batch synthesis. Shorter filtration times and lower
solids content in the filtrate were observed with the TCA prepared in batch mode. Filter aid
quality is an important factor in determining the performance the Bayer liquor filtration unit
operation.
Keywords: Filter aid, Tricalcium aluminate, Cake resistance.
1. Introduction
In alumina refineries, fine particles in the post-digestion thickener overflow are removed from
the pregnant leach liquor by filtration. These fine particles have a tendency to flow through or
block the filter cloth pores compromising alumina product quality and resulting in undesirable
process downtime and costs associated with cleaning and replacing the filters [1]. To aid the
filtration process, the filter cloth is coated with tricalcium aluminate filter aid which provides a
porous network permitting solution flow while trapping the fine particles and delaying the onset
of cloth blinding [2, 3].
It has been shown that filter aid particle size distribution has a profound effect on filtration
performance. In a study by Kinnarinen et al. [4], the effect of particle size of wet ground
calcium carbonate slurries was investigated. It was found that, the finer particles slow down
filtration due to blinding the filter cloth. In another system, the influence of crystal morphology
and particle size distribution on porosity, cake resistance for l-glutamic acid and an aromatic
amine derivative was studied. It was found that spherulites resulted in higher cake resistance
values than needle shaped particles. Comparably high cake resistance for the spherulites
particles are accounted for by lower mean particle size as compared to needle-like particles [5].
It has been stated that “If the particle properties could be specified for filtration, the target
properties would be for the particles to have a higher mean size, be as near to spherical as
possible, and have a monosize distribution” [3].
Many studies have been carried out to investigate the effect of reaction conditions used for the
preparation of TCA on the composition, particle size and particle morphology [6, 7, 8, 9]. Other
work linking TCA properties to filtration performance consider filtration pressure, TCA
concentration, flocculants, slaking conditions, and TCA synthesis reaction conditions [6, 1, 10].
The effect of batch and continuous TCA particle formation was recently studied [11]. TCA
particle characteristics were found to be relatively sensitive to operating parameters such as
Travaux 47, Proceedings of the 36th International ICSOBA Conference, Belem, Brazil, 29 October - 1 November, 2018
309

agitation intensity and residence time. The fine particle concentration was considerably higher
for the continuous reactor compared with the batch test which was ran for a time equivalent to
the mean residence time. Also, the continuous reactor yielded dense agglomerates with minimal
void space which are not desirable features for filter aid. In this study, a quantitative method
was used to determine the effect of TCA produced by batch and continuous on filtration
performance.
2. Methods and Materials
2.1. Bayer Liquor
Synthetic Bayer liquor was prepared from Gibbsite (C-31 grade, 99.4 % Al(OH)3 by weight),
sodium hydroxide (2.2 % Na2CO3 by weight), anhydrous sodium carbonate (99.9 wt %) and
deionized water. The mixture was heated to 95 ºC to form an optically clear solution. An
industrial Bayer liquor solution was also used to synthesize the “Plant” TCA. The composition
of the Bayer liquors used to synthesize the TCA samples are shown in Table 1.
Table 1. Bayer liquor compositions.
Bayer
Liquor
A g/L
as Al2O3
C g/L as
Na2CO3
A/C Carbonate g/L
as Na2CO3
S Total Soda g/L
as Na2CO3
C/S
Plant 137 243 0.56 20.5 263.5 0.92
Synthetic 172 214 0.80 42 256 0.83
2.2. Lime Slaking
Hydrated lime slurry was prepared by mixing 10 g of pure CaO (> 96 % pure) with 100 mL
deionized water. The density of slurry was 1.06 g/mL at 90 ºC. It was confirmed by XRD that
Ca(OH)2 was the only crystalline phase present in the slaked lime. Approximately 95% of the
slaked lime particles were below 2 µm in diameter according to Accusizer particle counting.
The size was confirmed by SEM analysis and the shape of the slaked lime particles appeared to
be irregular.
2.3. TCA Synthesis
“Batch” TCA was synthesized in a batch stirred baffled reactor and “Continuous” TCA was
synthesized in a continuous stirred tank reactor as described in a previous paper [12]. The batch
synthesis time and continuous reactor mean residence times were both 120 minutes. For the
continuous reactor, feed solutions were supplied from two separate heated stirred tanks to the
reactor using Masterflex peristaltic pump. The flowrate of the 10 % (w/w) Ca(OH)2 slurry was 2
mL/min and the flowrate of the Bayer liquors was at 4 mL/min. The TCA was freshly
synthesized ahead of each filtration test. The resultant TCA slurry densities were similar at 1220
and 1244 g/L for batch and continuous TCA respectively. Filtration tests were also conducted
on a TCA sample from an alumina refinery termed “Industrial” TCA.
2.4. Tricalcium Aluminate Characterization
The particle size distribution of tricalcium aluminate was determined by an Accusizer; (The
Accusizer instrument consists of five parts: autodiluter, optical sensor, pulse-height analyzer,
computer processor and software controller). To ensure that the particles were not dissolving
upon dilution, the dilution solution consisted of a saturated solution of tricalcium aluminate. A
separate beaker of this saturated solution (100 mL), with baffles and a stirrer to ensure
homogenous slurry distribution. Then, a small amount of slurry from the experiment (1 mL)
Travaux 47, Proceedings of the 36th International ICSOBA Conference, Belem, Brazil, 29 October - 1 November, 2018
310

was diluted 100x by mixing it into the beaker. Then 1 mL of the diluted slurry was introduced
into the Accusizer where it was further diluted 80x. Note that all the reported particle size data
has been corrected back to the counts that would have been in the stainless-steel beaker, i.e.
8000x more concentrated. The density of the TCA suspension was determined weighing a
measured volume in a graduated cylinder.
2.5. Bauxite Residue Preparation
In order to compare relative filtration performance, a bauxite residue slurry was prepared by
mixing industrial bauxite residue with deionized water. The density of the bauxite residue
slurry was 1080 kg/m3. The mean particle size of the bauxite residue was 3 µm.
2.6. Filtration Apparatus
The filtration device employed in this study (shown in Figure 1) is made of stainless steel with a
maximum design pressure of 490 kPa. The height of the filter cylinder is 218.5 mm and filter
diameter is 36 mm. The device was secured with a retort stand and two clamps. It was
pressurized using regulated compressed air.
Figure 1. Pressure filtration experimental set-up.
The filter medium used for filtering bauxite residue, TCA suspension mixture and bauxite
residue slurry is a filter cloth supplied by Clear Edge Filtration which is shown in Figure 2. The
cloth was cut to a diameter of 47 mm in order to fit into the bottom piece of the filtration device.
The filter cloth was positioned above the porous plate and beneath the rubber O-ring as shown
in Figure 2. The technical specifications for the cloth are shown in Table 2.
Travaux 47, Proceedings of the 36th International ICSOBA Conference, Belem, Brazil, 29 October - 1 November, 2018
311

Figure 2. A: Close up of the bottom piece showing the reservoir and the diameter of the
filter area. B: A cut filter cloth and its position in the bottom piece.
Table 2. Technical data for the filter cloth (Clear Edge Filtration Australia).
Quality ALUTEX® HP34
Polymer Polypropylene Staple
Weight (g/m2) 400
Air Permeability (m3/m
2/min @ 125 Pa) 4
Air Permeability (Lt/dm2/min @ 200 Pa) 64
Water Permeability (l/m2/min @ 400 mm Static head) 1500
Breaking Load (N/5 cm) 2000
Finish Heat Set
Particle retention:
> 45 μm 45 – 25 μm 25 – 15 μm 14 – 10 μm
100 % 70 % 55 % 51 %
For determining the solids content in the filtrate, the filtrate from the pressure filter experiments
was then pressure filtered using a 0.2 µm Nylon filter membrane. The dimension of the filter
membrane was the same as the filter cloth but was pre-cut.
2.8. Experimental
Pressure filtration was performed at a temperature of 22±2 ºC. For the filtration experiments, 9
mL of the bauxite residue slurry mixed with 150 mL of deionized water and 10 mL of TCA
slurry. This mixture was stirred at 300 rpm to ensure a well-mixed suspension was introduced
into the pressure filter. For some experiments, only the bauxite residue or only the TCA were
included.
Each experiment used a new filter cloth which was pre-wetted. The suspension was mixed and
then transferred into the filtration device. The pressure filter was quickly closed, and the gauge
pressure was regulated to 100 kPa. Once pressurized, the discharge valve was opened to start
the filtration process. The time and mass of the filtrate was recorded every 10 s until filtration
was completed. Once the filtration was complete, filter and filter cake were recovered, dried to
constant mass at 60 ºC and weighed. An image of the dried filter cake from an experiment with
both bauxite residue and TCA is shown in Figure 3.
Travaux 47, Proceedings of the 36th International ICSOBA Conference, Belem, Brazil, 29 October - 1 November, 2018
312
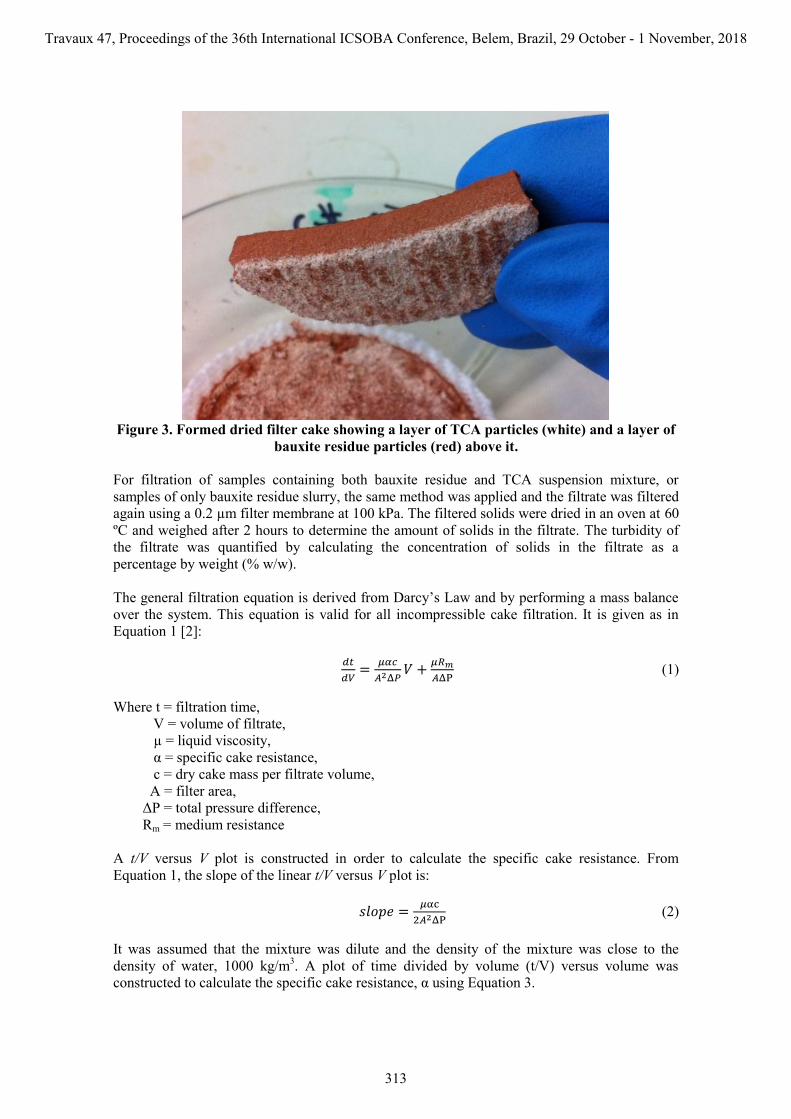
Figure 3. Formed dried filter cake showing a layer of TCA particles (white) and a layer of
bauxite residue particles (red) above it.
For filtration of samples containing both bauxite residue and TCA suspension mixture, or
samples of only bauxite residue slurry, the same method was applied and the filtrate was filtered
again using a 0.2 µm filter membrane at 100 kPa. The filtered solids were dried in an oven at 60
ºC and weighed after 2 hours to determine the amount of solids in the filtrate. The turbidity of
the filtrate was quantified by calculating the concentration of solids in the filtrate as a
percentage by weight (% w/w).
The general filtration equation is derived from Darcy’s Law and by performing a mass balance
over the system. This equation is valid for all incompressible cake filtration. It is given as in
Equation 1 [2]:
(1)
Where t = filtration time,
V = volume of filtrate,
µ = liquid viscosity,
α = specific cake resistance,
c = dry cake mass per filtrate volume,
A = filter area,
ΔP = total pressure difference,
Rm = medium resistance
A t/V versus V plot is constructed in order to calculate the specific cake resistance. From
Equation 1, the slope of the linear t/V versus V plot is:
(2)
It was assumed that the mixture was dilute and the density of the mixture was close to the
density of water, 1000 kg/m3. A plot of time divided by volume (t/V) versus volume was
constructed to calculate the specific cake resistance, α using Equation 3.
Travaux 47, Proceedings of the 36th International ICSOBA Conference, Belem, Brazil, 29 October - 1 November, 2018
313

By rearranging Equation 2, the specific cake resistance can be calculated with known liquid
viscosity, dry cake mass per filtrate volume, filter area and total pressure difference, Equation 3.
(3)
The dry cake mass per filtrate volume is determined using the following equation, assuming that
all the solids are retained in the filter cake:
(4)
The slope of only the linear section was estimated by ignoring the data points in the first minute
and the last two data point of the plot due to non-linearity. In the initial stages of filtration non-
linearity is caused by sedimentation [12]. The non-linearity at the end of the filtration test is due
to desaturation of the filter cake where air displaces the liquid present in the voids of the formed
filter cake.
3. Results and Discussion
The results from the pressure filtration experiments are summarized in Table 1 including the
filtration time, solids in filtrate and the calculated specific cake resistance. For bauxite residue
filtrations, inclusion of TCA significantly improved filtration for all three parameters i.e.
decreased filtration time, decreased solids in the filtrate and decreased cake resistance.
Comparing the TCA produced by synthetic liquor and plant liquor reveals faster average
filtration time (about 60 %), higher specific cake resistance (about half) and lower solids
concentration in the filtrate (160 ppm instead of 260 ppm) for filtration using TCA produced
from synthetic liquor. This suggests that the presence of impurities in the plant liquor may be
detrimental to TCA filter aid performance although it is not possible to draw any strong
conclusions as the main components of the liquor also differed.
The filtration results for the bauxite residue slurry and TCA suspension mixture from batch
synthesized TCA using synthetic liquor and continuous synthesized TCA using synthetic liquor
were compared. The comparison indicates that the average filtration time for the mixture is
shorter in the batch synthesis method than the continuous method or the industrial TCA.
While the specific cake resistance was estimated, it is difficult to draw strong conclusions from
these numbers as the cake actually consists of two distinct materials (bauxite residue and TCA).
Furthermore, the cake was actually being formed during the filtration experiment, therefore the
value specified for the cake mass does not represent the cake mass at the beginning of the test.
For these reasons, the specific cake resistances should not be considered meaningful and further
work is required to determine accurate cake resistances for the TCA.
Travaux 47, Proceedings of the 36th International ICSOBA Conference, Belem, Brazil, 29 October - 1 November, 2018
314

Table 1. Experimental conditions and pressure filtration results (error based on triplicate
experiments).
Bayer Liquor -
Synthetic Plant Synthetic Plant Industrial
Sample TCA Synthesis Batch Batch Cont. Cont.
Filtration time
(s) 308 ± 8 113 ± 6 195 187 ± 13 257 ± 8 256 ± 8
Solids in
filtrate (%w/w)
0.042 ±
0.002
0.016 ±
0.004 0.026
0.021 ±
0.002
0.017 ±
0.003
0.031 ±
0.003
Sp. cake
resistance
(x1010
m/kg)
27 16 7.0 3.7 8.3 25
The improved performance of the batch TCA can be explained by the particle size distribution
(Figure 5). The particle size distribution of batch TCA crystallized using synthetic liquor
exhibited a significant peak between 3 – 20 μm whereas the continuous TCA particle peak was
around 2 μm. The elevated concentration of fine particles in the continuous TCA is corroborated
by the SEM images of a 30 minute sample of the TCA during synthesis in Figure 6. It shows
particles with irregular shape and rough surface of agglomerates in continuous reaction. This is
associated with the attachment of some small particles to the surface of coarse particles. At the
same time in batch operation, the particles have regular rounded shape without fines. In a
continuous reactor a certain amount of the feed particles will spend much less than the mean
residence time and therefore may not have had time to dissolve or grow into a well-formed TCA
particle. In a particle size distribution, the smallest particles have the greatest effect on filtration,
affecting the specific cake resistance, filtration rates, bleeding, and permeability of the filter
cake [3]. The filter cloth data shown in Table 1 indicates that more than 50 % of the particles
larger than 10 μm can be retained. Therefore, some degree of pore blocking is expected for both
synthetic methods as they contain fines that are smaller than 10 μm.
Figure 5. The particle size distribution of TCA produced using synthetic liquor.
Travaux 47, Proceedings of the 36th International ICSOBA Conference, Belem, Brazil, 29 October - 1 November, 2018
315
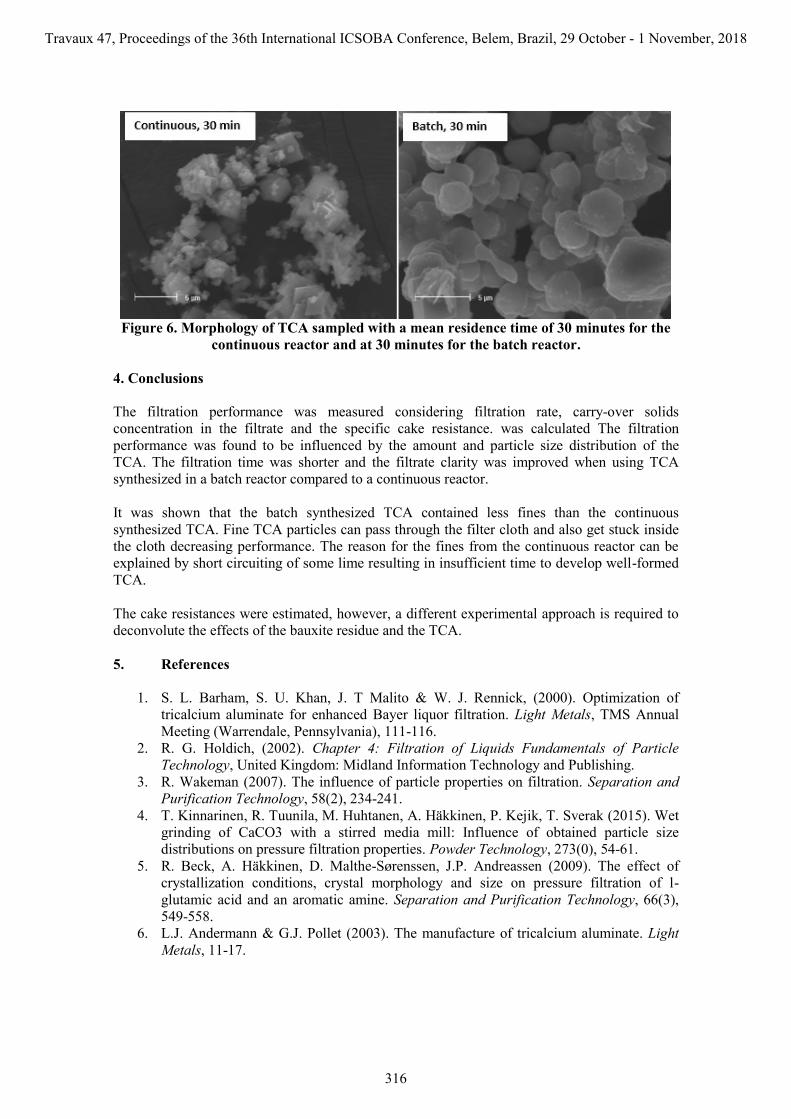
Figure 6. Morphology of TCA sampled with a mean residence time of 30 minutes for the
continuous reactor and at 30 minutes for the batch reactor.
4. Conclusions
The filtration performance was measured considering filtration rate, carry-over solids
concentration in the filtrate and the specific cake resistance. was calculated The filtration
performance was found to be influenced by the amount and particle size distribution of the
TCA. The filtration time was shorter and the filtrate clarity was improved when using TCA
synthesized in a batch reactor compared to a continuous reactor.
It was shown that the batch synthesized TCA contained less fines than the continuous
synthesized TCA. Fine TCA particles can pass through the filter cloth and also get stuck inside
the cloth decreasing performance. The reason for the fines from the continuous reactor can be
explained by short circuiting of some lime resulting in insufficient time to develop well-formed
TCA.
The cake resistances were estimated, however, a different experimental approach is required to
deconvolute the effects of the bauxite residue and the TCA.
5. References
1. S. L. Barham, S. U. Khan, J. T Malito & W. J. Rennick, (2000). Optimization of
tricalcium aluminate for enhanced Bayer liquor filtration. Light Metals, TMS Annual
Meeting (Warrendale, Pennsylvania), 111-116.
2. R. G. Holdich, (2002). Chapter 4: Filtration of Liquids Fundamentals of Particle
Technology, United Kingdom: Midland Information Technology and Publishing.
3. R. Wakeman (2007). The influence of particle properties on filtration. Separation and
Purification Technology, 58(2), 234-241.
4. T. Kinnarinen, R. Tuunila, M. Huhtanen, A. Häkkinen, P. Kejik, T. Sverak (2015). Wet
grinding of CaCO3 with a stirred media mill: Influence of obtained particle size
distributions on pressure filtration properties. Powder Technology, 273(0), 54-61.
5. R. Beck, A. Häkkinen, D. Malthe-Sørenssen, J.P. Andreassen (2009). The effect of
crystallization conditions, crystal morphology and size on pressure filtration of l-
glutamic acid and an aromatic amine. Separation and Purification Technology, 66(3),
549-558.
6. L.J. Andermann & G.J. Pollet (2003). The manufacture of tricalcium aluminate. Light
Metals, 11-17.
Travaux 47, Proceedings of the 36th International ICSOBA Conference, Belem, Brazil, 29 October - 1 November, 2018
316

7. S. Franca, P. Braga, J. A. Lima, J. Moraes, A. Borges, (2010). Some Aspects of
Tricalcium Aluminate Hexahydrate Formation on the Bayer Process. Minerals, Metals
and Materials Society/AIME.
8. N. Mugnier, P. Clérin, J. Sinquin (2001). Industrial experience of polishing filtration
performance. improvement and interpretation. Light Metals, 33-39.
9. B.I. Whittington, T.M. Fallows, M.J. Willing (1997). Tricalcium aluminate hexahydrate
(TCA) filter aid in the Bayer industry: factors affecting TCA preparation and
morphology. International Journal of Mineral Processing, 49(1–2), 1-29.
10. T.J. Malito (1996). Improving the operation of red mud pressure filters. Light Metals,
81-86.
11. R. Salimi and J. Vaughan (2016). Crystallisation of tricalcium aluminate from sodium
aluminate solution using slaked lime. Powder Technology. 294, 472-483.
12. C. Tien (2006). Introduction to cake filtration: analyses, experiments, and applications.
Boston: Elsevier.
Travaux 47, Proceedings of the 36th International ICSOBA Conference, Belem, Brazil, 29 October - 1 November, 2018
317

Travaux 47, Proceedings of the 36th International ICSOBA Conference, Belem, Brazil, 29 October - 1 November, 2018
318
Recommended