Journal of Policy Modeling 29 (2007) 783–796
Global imbalances and financial stability�
Miranda Xafa ∗Executive Board, International Monetary Fund, Washington, D.C. 20431, USA
Available online 3 June 2007
Abstract
There are two opposing views on global imbalances: The “traditional” view, which regards the imbalancesas a threat to global economic and financial stability, and the “new paradigm” view, which considers that theyare the natural consequence of economic and financial globalization. In terms of their policy implications, thetraditional view focuses on monetary and fiscal policy decisions in the United States that need to be urgentlyreversed to avoid an abrupt unwinding of the imbalances involving a sell-off of dollar assets, a sharp increasein U.S. interest rates, and a hard landing for the global economy. By contrast, the new paradigm viewconsiders that the imbalances will be resolved smoothly through the normal functioning of markets. Thispaper argues that an abrupt unwinding of imbalances is highly unlikely and advances a number of argumentsin support of the new paradigm view.© 2007 Published by Elsevier Inc. on behalf of Society for Policy Modeling.
JEL classification: F02; F21; F36; F4
Keywords: Global imbalances; Financial stability; Traditional view; Real-side models; Portfolio balance models; Newparadigm
1. Introduction
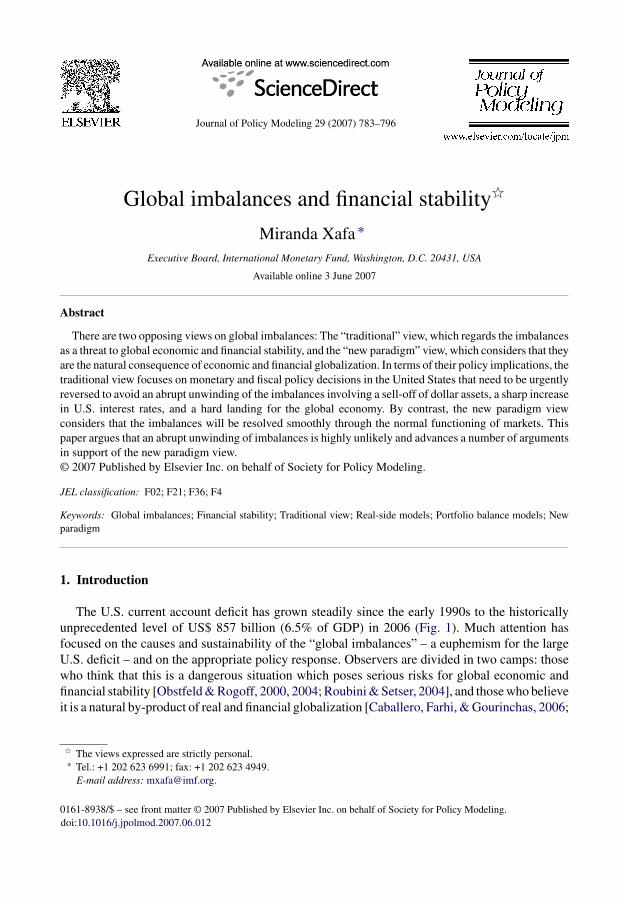
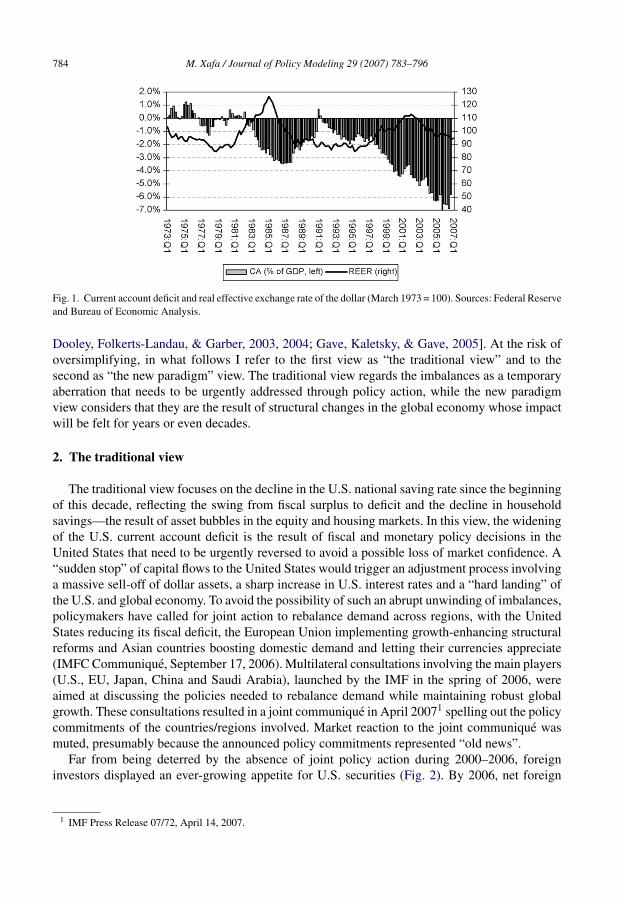
The U.S. current account deficit has grown steadily since the early 1990s to the historicallyunprecedented level of US$ 857 billion (6.5% of GDP) in 2006 (Fig. 1). Much attention hasfocused on the causes and sustainability of the “global imbalances” – a euphemism for the largeU.S. deficit – and on the appropriate policy response. Observers are divided in two camps: thosewho think that this is a dangerous situation which poses serious risks for global economic andfinancial stability [Obstfeld & Rogoff, 2000, 2004; Roubini & Setser, 2004], and those who believeit is a natural by-product of real and financial globalization [Caballero, Farhi, & Gourinchas, 2006;
� The views expressed are strictly personal.∗ Tel.: +1 202 623 6991; fax: +1 202 623 4949.
E-mail address: [email protected].
0161-8938/$ – see front matter © 2007 Published by Elsevier Inc. on behalf of Society for Policy Modeling.doi:10.1016/j.jpolmod.2007.06.012
784 M. Xafa / Journal of Policy Modeling 29 (2007) 783–796
Fig. 1. Current account deficit and real effective exchange rate of the dollar (March 1973 = 100). Sources: Federal Reserveand Bureau of Economic Analysis.
Dooley, Folkerts-Landau, & Garber, 2003, 2004; Gave, Kaletsky, & Gave, 2005]. At the risk ofoversimplifying, in what follows I refer to the first view as “the traditional view” and to thesecond as “the new paradigm” view. The traditional view regards the imbalances as a temporaryaberration that needs to be urgently addressed through policy action, while the new paradigmview considers that they are the result of structural changes in the global economy whose impactwill be felt for years or even decades.
2. The traditional view
The traditional view focuses on the decline in the U.S. national saving rate since the beginningof this decade, reflecting the swing from fiscal surplus to deficit and the decline in householdsavings—the result of asset bubbles in the equity and housing markets. In this view, the wideningof the U.S. current account deficit is the result of fiscal and monetary policy decisions in theUnited States that need to be urgently reversed to avoid a possible loss of market confidence. A“sudden stop” of capital flows to the United States would trigger an adjustment process involvinga massive sell-off of dollar assets, a sharp increase in U.S. interest rates and a “hard landing” ofthe U.S. and global economy. To avoid the possibility of such an abrupt unwinding of imbalances,policymakers have called for joint action to rebalance demand across regions, with the UnitedStates reducing its fiscal deficit, the European Union implementing growth-enhancing structuralreforms and Asian countries boosting domestic demand and letting their currencies appreciate(IMFC Communique, September 17, 2006). Multilateral consultations involving the main players(U.S., EU, Japan, China and Saudi Arabia), launched by the IMF in the spring of 2006, wereaimed at discussing the policies needed to rebalance demand while maintaining robust globalgrowth. These consultations resulted in a joint communique in April 20071 spelling out the policycommitments of the countries/regions involved. Market reaction to the joint communique wasmuted, presumably because the announced policy commitments represented “old news”.
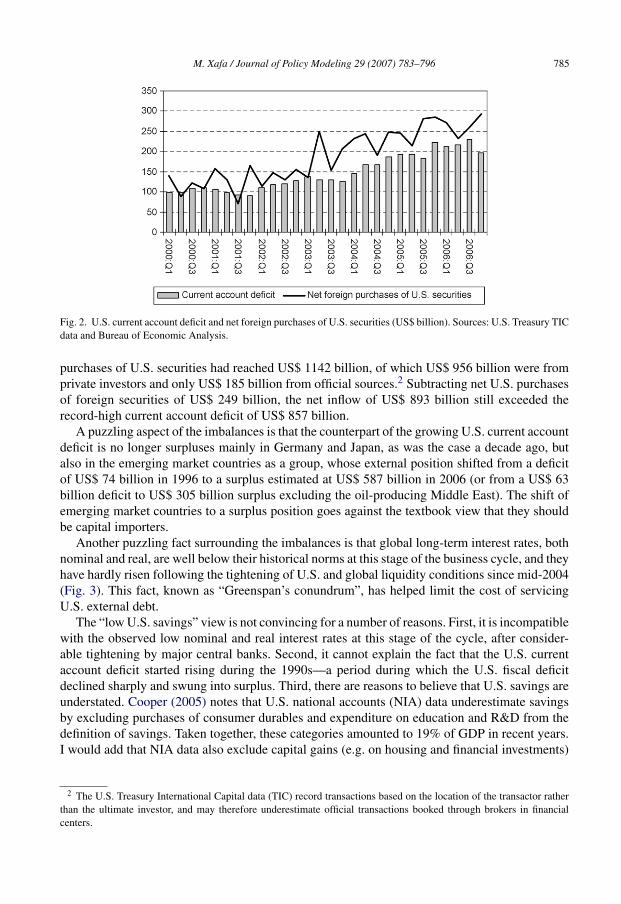
Far from being deterred by the absence of joint policy action during 2000–2006, foreigninvestors displayed an ever-growing appetite for U.S. securities (Fig. 2). By 2006, net foreign
1 IMF Press Release 07/72, April 14, 2007.
M. Xafa / Journal of Policy Modeling 29 (2007) 783–796 785
Fig. 2. U.S. current account deficit and net foreign purchases of U.S. securities (US$ billion). Sources: U.S. Treasury TICdata and Bureau of Economic Analysis.
purchases of U.S. securities had reached US$ 1142 billion, of which US$ 956 billion were fromprivate investors and only US$ 185 billion from official sources.2 Subtracting net U.S. purchasesof foreign securities of US$ 249 billion, the net inflow of US$ 893 billion still exceeded therecord-high current account deficit of US$ 857 billion.
A puzzling aspect of the imbalances is that the counterpart of the growing U.S. current accountdeficit is no longer surpluses mainly in Germany and Japan, as was the case a decade ago, butalso in the emerging market countries as a group, whose external position shifted from a deficitof US$ 74 billion in 1996 to a surplus estimated at US$ 587 billion in 2006 (or from a US$ 63billion deficit to US$ 305 billion surplus excluding the oil-producing Middle East). The shift ofemerging market countries to a surplus position goes against the textbook view that they shouldbe capital importers.
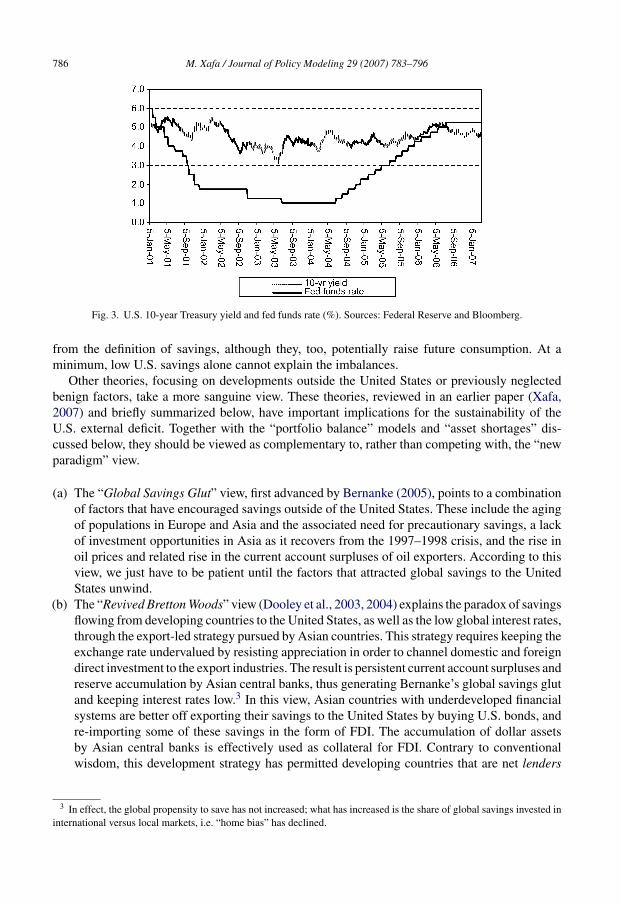
Another puzzling fact surrounding the imbalances is that global long-term interest rates, bothnominal and real, are well below their historical norms at this stage of the business cycle, and theyhave hardly risen following the tightening of U.S. and global liquidity conditions since mid-2004(Fig. 3). This fact, known as “Greenspan’s conundrum”, has helped limit the cost of servicingU.S. external debt.
The “low U.S. savings” view is not convincing for a number of reasons. First, it is incompatiblewith the observed low nominal and real interest rates at this stage of the cycle, after consider-able tightening by major central banks. Second, it cannot explain the fact that the U.S. currentaccount deficit started rising during the 1990s—a period during which the U.S. fiscal deficitdeclined sharply and swung into surplus. Third, there are reasons to believe that U.S. savings areunderstated. Cooper (2005) notes that U.S. national accounts (NIA) data underestimate savingsby excluding purchases of consumer durables and expenditure on education and R&D from thedefinition of savings. Taken together, these categories amounted to 19% of GDP in recent years.I would add that NIA data also exclude capital gains (e.g. on housing and financial investments)
2 The U.S. Treasury International Capital data (TIC) record transactions based on the location of the transactor ratherthan the ultimate investor, and may therefore underestimate official transactions booked through brokers in financialcenters.
786 M. Xafa / Journal of Policy Modeling 29 (2007) 783–796
Fig. 3. U.S. 10-year Treasury yield and fed funds rate (%). Sources: Federal Reserve and Bloomberg.
from the definition of savings, although they, too, potentially raise future consumption. At aminimum, low U.S. savings alone cannot explain the imbalances.
Other theories, focusing on developments outside the United States or previously neglectedbenign factors, take a more sanguine view. These theories, reviewed in an earlier paper (Xafa,2007) and briefly summarized below, have important implications for the sustainability of theU.S. external deficit. Together with the “portfolio balance” models and “asset shortages” dis-cussed below, they should be viewed as complementary to, rather than competing with, the “newparadigm” view.
(a) The “Global Savings Glut” view, first advanced by Bernanke (2005), points to a combinationof factors that have encouraged savings outside of the United States. These include the agingof populations in Europe and Asia and the associated need for precautionary savings, a lackof investment opportunities in Asia as it recovers from the 1997–1998 crisis, and the rise inoil prices and related rise in the current account surpluses of oil exporters. According to thisview, we just have to be patient until the factors that attracted global savings to the UnitedStates unwind.
(b) The “Revived Bretton Woods” view (Dooley et al., 2003, 2004) explains the paradox of savingsflowing from developing countries to the United States, as well as the low global interest rates,through the export-led strategy pursued by Asian countries. This strategy requires keeping theexchange rate undervalued by resisting appreciation in order to channel domestic and foreigndirect investment to the export industries. The result is persistent current account surpluses andreserve accumulation by Asian central banks, thus generating Bernanke’s global savings glutand keeping interest rates low.3 In this view, Asian countries with underdeveloped financialsystems are better off exporting their savings to the United States by buying U.S. bonds, andre-importing some of these savings in the form of FDI. The accumulation of dollar assetsby Asian central banks is effectively used as collateral for FDI. Contrary to conventionalwisdom, this development strategy has permitted developing countries that are net lenders
3 In effect, the global propensity to save has not increased; what has increased is the share of global savings invested ininternational versus local markets, i.e. “home bias” has declined.
M. Xafa / Journal of Policy Modeling 29 (2007) 783–796 787
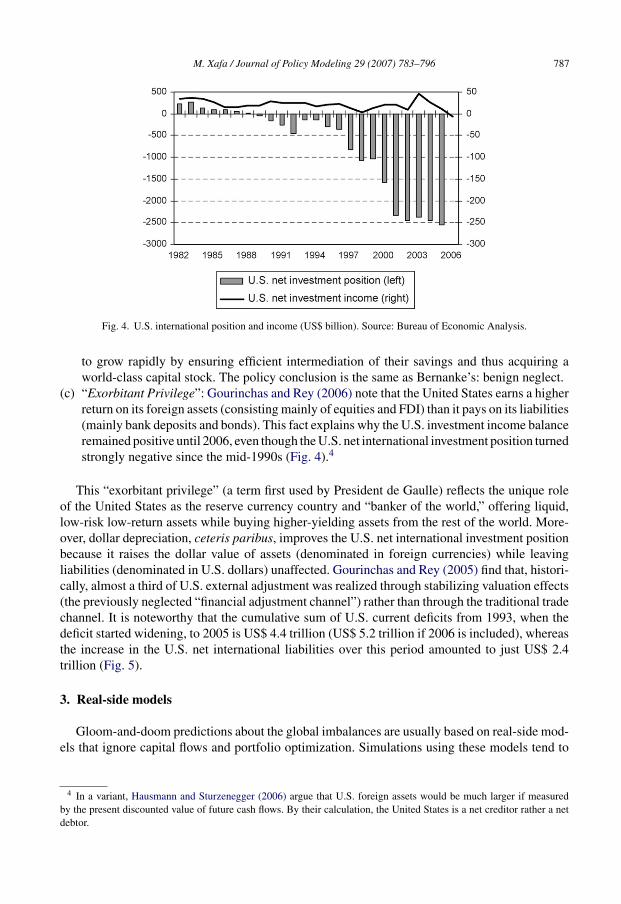
Fig. 4. U.S. international position and income (US$ billion). Source: Bureau of Economic Analysis.
to grow rapidly by ensuring efficient intermediation of their savings and thus acquiring aworld-class capital stock. The policy conclusion is the same as Bernanke’s: benign neglect.
(c) “Exorbitant Privilege”: Gourinchas and Rey (2006) note that the United States earns a higherreturn on its foreign assets (consisting mainly of equities and FDI) than it pays on its liabilities(mainly bank deposits and bonds). This fact explains why the U.S. investment income balanceremained positive until 2006, even though the U.S. net international investment position turnedstrongly negative since the mid-1990s (Fig. 4).4
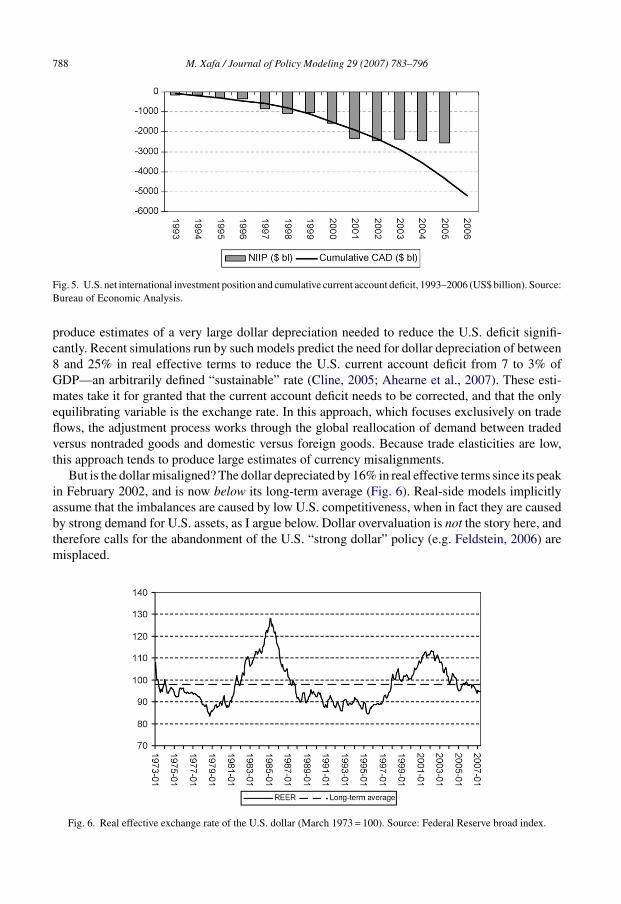
This “exorbitant privilege” (a term first used by President de Gaulle) reflects the unique roleof the United States as the reserve currency country and “banker of the world,” offering liquid,low-risk low-return assets while buying higher-yielding assets from the rest of the world. More-over, dollar depreciation, ceteris paribus, improves the U.S. net international investment positionbecause it raises the dollar value of assets (denominated in foreign currencies) while leavingliabilities (denominated in U.S. dollars) unaffected. Gourinchas and Rey (2005) find that, histori-cally, almost a third of U.S. external adjustment was realized through stabilizing valuation effects(the previously neglected “financial adjustment channel”) rather than through the traditional tradechannel. It is noteworthy that the cumulative sum of U.S. current deficits from 1993, when thedeficit started widening, to 2005 is US$ 4.4 trillion (US$ 5.2 trillion if 2006 is included), whereasthe increase in the U.S. net international liabilities over this period amounted to just US$ 2.4trillion (Fig. 5).
3. Real-side models
Gloom-and-doom predictions about the global imbalances are usually based on real-side mod-els that ignore capital flows and portfolio optimization. Simulations using these models tend to
4 In a variant, Hausmann and Sturzenegger (2006) argue that U.S. foreign assets would be much larger if measuredby the present discounted value of future cash flows. By their calculation, the United States is a net creditor rather a netdebtor.
788 M. Xafa / Journal of Policy Modeling 29 (2007) 783–796
Fig. 5. U.S. net international investment position and cumulative current account deficit, 1993–2006 (US$ billion). Source:Bureau of Economic Analysis.
produce estimates of a very large dollar depreciation needed to reduce the U.S. deficit signifi-cantly. Recent simulations run by such models predict the need for dollar depreciation of between8 and 25% in real effective terms to reduce the U.S. current account deficit from 7 to 3% ofGDP—an arbitrarily defined “sustainable” rate (Cline, 2005; Ahearne et al., 2007). These esti-mates take it for granted that the current account deficit needs to be corrected, and that the onlyequilibrating variable is the exchange rate. In this approach, which focuses exclusively on tradeflows, the adjustment process works through the global reallocation of demand between tradedversus nontraded goods and domestic versus foreign goods. Because trade elasticities are low,this approach tends to produce large estimates of currency misalignments.
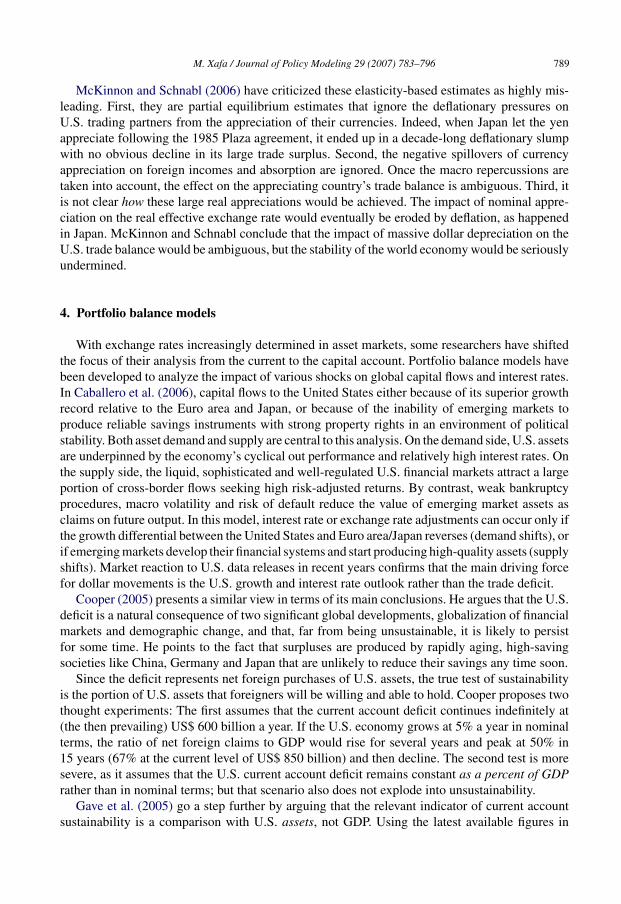
But is the dollar misaligned? The dollar depreciated by 16% in real effective terms since its peakin February 2002, and is now below its long-term average (Fig. 6). Real-side models implicitlyassume that the imbalances are caused by low U.S. competitiveness, when in fact they are causedby strong demand for U.S. assets, as I argue below. Dollar overvaluation is not the story here, andtherefore calls for the abandonment of the U.S. “strong dollar” policy (e.g. Feldstein, 2006) aremisplaced.
Fig. 6. Real effective exchange rate of the U.S. dollar (March 1973 = 100). Source: Federal Reserve broad index.
M. Xafa / Journal of Policy Modeling 29 (2007) 783–796 789
McKinnon and Schnabl (2006) have criticized these elasticity-based estimates as highly mis-leading. First, they are partial equilibrium estimates that ignore the deflationary pressures onU.S. trading partners from the appreciation of their currencies. Indeed, when Japan let the yenappreciate following the 1985 Plaza agreement, it ended up in a decade-long deflationary slumpwith no obvious decline in its large trade surplus. Second, the negative spillovers of currencyappreciation on foreign incomes and absorption are ignored. Once the macro repercussions aretaken into account, the effect on the appreciating country’s trade balance is ambiguous. Third, itis not clear how these large real appreciations would be achieved. The impact of nominal appre-ciation on the real effective exchange rate would eventually be eroded by deflation, as happenedin Japan. McKinnon and Schnabl conclude that the impact of massive dollar depreciation on theU.S. trade balance would be ambiguous, but the stability of the world economy would be seriouslyundermined.
4. Portfolio balance models
With exchange rates increasingly determined in asset markets, some researchers have shiftedthe focus of their analysis from the current to the capital account. Portfolio balance models havebeen developed to analyze the impact of various shocks on global capital flows and interest rates.In Caballero et al. (2006), capital flows to the United States either because of its superior growthrecord relative to the Euro area and Japan, or because of the inability of emerging markets toproduce reliable savings instruments with strong property rights in an environment of politicalstability. Both asset demand and supply are central to this analysis. On the demand side, U.S. assetsare underpinned by the economy’s cyclical out performance and relatively high interest rates. Onthe supply side, the liquid, sophisticated and well-regulated U.S. financial markets attract a largeportion of cross-border flows seeking high risk-adjusted returns. By contrast, weak bankruptcyprocedures, macro volatility and risk of default reduce the value of emerging market assets asclaims on future output. In this model, interest rate or exchange rate adjustments can occur only ifthe growth differential between the United States and Euro area/Japan reverses (demand shifts), orif emerging markets develop their financial systems and start producing high-quality assets (supplyshifts). Market reaction to U.S. data releases in recent years confirms that the main driving forcefor dollar movements is the U.S. growth and interest rate outlook rather than the trade deficit.
Cooper (2005) presents a similar view in terms of its main conclusions. He argues that the U.S.deficit is a natural consequence of two significant global developments, globalization of financialmarkets and demographic change, and that, far from being unsustainable, it is likely to persistfor some time. He points to the fact that surpluses are produced by rapidly aging, high-savingsocieties like China, Germany and Japan that are unlikely to reduce their savings any time soon.
Since the deficit represents net foreign purchases of U.S. assets, the true test of sustainabilityis the portion of U.S. assets that foreigners will be willing and able to hold. Cooper proposes twothought experiments: The first assumes that the current account deficit continues indefinitely at(the then prevailing) US$ 600 billion a year. If the U.S. economy grows at 5% a year in nominalterms, the ratio of net foreign claims to GDP would rise for several years and peak at 50% in15 years (67% at the current level of US$ 850 billion) and then decline. The second test is moresevere, as it assumes that the U.S. current account deficit remains constant as a percent of GDPrather than in nominal terms; but that scenario also does not explode into unsustainability.
Gave et al. (2005) go a step further by arguing that the relevant indicator of current accountsustainability is a comparison with U.S. assets, not GDP. Using the latest available figures in
790 M. Xafa / Journal of Policy Modeling 29 (2007) 783–796
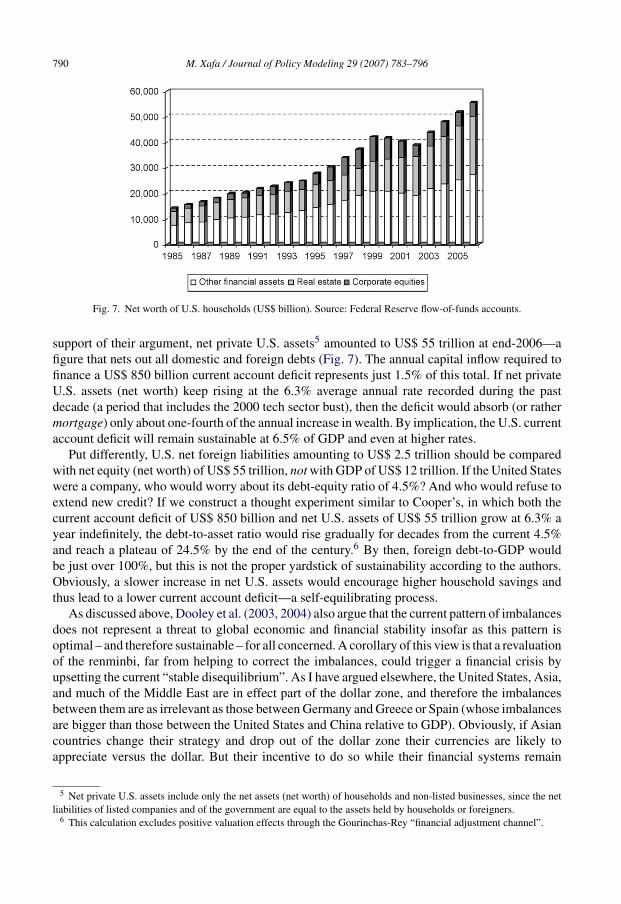
Fig. 7. Net worth of U.S. households (US$ billion). Source: Federal Reserve flow-of-funds accounts.
support of their argument, net private U.S. assets5 amounted to US$ 55 trillion at end-2006—afigure that nets out all domestic and foreign debts (Fig. 7). The annual capital inflow required tofinance a US$ 850 billion current account deficit represents just 1.5% of this total. If net privateU.S. assets (net worth) keep rising at the 6.3% average annual rate recorded during the pastdecade (a period that includes the 2000 tech sector bust), then the deficit would absorb (or rathermortgage) only about one-fourth of the annual increase in wealth. By implication, the U.S. currentaccount deficit will remain sustainable at 6.5% of GDP and even at higher rates.
Put differently, U.S. net foreign liabilities amounting to US$ 2.5 trillion should be comparedwith net equity (net worth) of US$ 55 trillion, not with GDP of US$ 12 trillion. If the United Stateswere a company, who would worry about its debt-equity ratio of 4.5%? And who would refuse toextend new credit? If we construct a thought experiment similar to Cooper’s, in which both thecurrent account deficit of US$ 850 billion and net U.S. assets of US$ 55 trillion grow at 6.3% ayear indefinitely, the debt-to-asset ratio would rise gradually for decades from the current 4.5%and reach a plateau of 24.5% by the end of the century.6 By then, foreign debt-to-GDP wouldbe just over 100%, but this is not the proper yardstick of sustainability according to the authors.Obviously, a slower increase in net U.S. assets would encourage higher household savings andthus lead to a lower current account deficit—a self-equilibrating process.
As discussed above, Dooley et al. (2003, 2004) also argue that the current pattern of imbalancesdoes not represent a threat to global economic and financial stability insofar as this pattern isoptimal – and therefore sustainable – for all concerned. A corollary of this view is that a revaluationof the renminbi, far from helping to correct the imbalances, could trigger a financial crisis byupsetting the current “stable disequilibrium”. As I have argued elsewhere, the United States, Asia,and much of the Middle East are in effect part of the dollar zone, and therefore the imbalancesbetween them are as irrelevant as those between Germany and Greece or Spain (whose imbalancesare bigger than those between the United States and China relative to GDP). Obviously, if Asiancountries change their strategy and drop out of the dollar zone their currencies are likely toappreciate versus the dollar. But their incentive to do so while their financial systems remain
5 Net private U.S. assets include only the net assets (net worth) of households and non-listed businesses, since the netliabilities of listed companies and of the government are equal to the assets held by households or foreigners.
6 This calculation excludes positive valuation effects through the Gourinchas-Rey “financial adjustment channel”.
M. Xafa / Journal of Policy Modeling 29 (2007) 783–796 791
underdeveloped, their reserves largely dollar-denominated and regional monetary cooperationembryonic, is weak. Besides, the impact of such a move on global outsourcing trends or globalimbalances is unlikely to be large, inter alia because Chinese wages still amount to just 3% ofU.S. wages.7 For purchasing power and import substitution effects to have a significant impact onsavings-investment balances, dramatic shifts in exchange rates would need to occur that woulddamage China’s growth prospects and test the system of “vendor financing” that helps fund theU.S. current account deficit. It is instructive that such concerns triggered an increase in U.S.Treasury yields in the wake of China’s move to a managed float on 21 July 2005.
Portfolio models that come up with less sanguine conclusions suffer from the same shortcomingas those based on trade elasticities—namely, that the real exchange rate is the only equilibratingvariable. Blanchard, Giavazzi, and Sa (2005) construct a portfolio balance model in which thereal exchange rate determines the allocation of both goods and assets between the domestic andforeign markets. In their model, increases in U.S. demand for foreign goods and in the foreigndemand for U.S. assets are the two main forces behind the U.S. current account deficit. To restoreequilibrium, the United States needs to generate a trade surplus to service the additional liabilitiesit issued in response to increased demand for U.S. assets. Restoring equilibrium in this modelinvolves a large gradual depreciation of the dollar because the current account depends only onthe real exchange rate, whereas relative growth rates do not enter the picture.
5. The “new paradigm” view
The global economy has undergone profound structural change over the past couple ofdecades. The collapse of the Soviet Union, Germany’s reunification, and the greater integrationof China, India and other emerging markets with the world economy have created a global supplychain—a hugely positive supply shock. Despite some hiccups, macro policies and central bankcredibility have improved over this period – especially in the 2000s – while financial innovationshave helped spread risk more widely. The benefits of these events have been lower inflation, amore muted business cycle, and reduced volatility due to lower “boom and bust” fear in financialmarkets. This “new paradigm”, in turn, has led to asset inflation and a reduction in financialreturns (hence the “search for yield”, as investors venture into new markets and products). Thesepositive structural trends, which represent a break with the past, should be distinguished fromcyclical components that are subject to reversal, such as global liquidity conditions and corporateleverage. The structural tailwinds – evidenced by the exceptionally low global inflation andinterest rates – remain in place even though the cyclical headwinds are starting to be felt as U.S.GDP growth slows to a projected 2.6% in 2007 from 3.3% in 2006.
In their book “Our Brave New World” (2005), Gave et al. argue that the global economy hasentered precisely such a period of exceptionally rapid wealth creation due to the more efficient useof labor and capital that globalization and information technology have permitted. The advancedcountries have outsourced manufacturing to the developing countries while retaining the manage-ment and other service components of the production cycle. The “platform company” businessmodel (e.g. Dell or Wal-Mart), specializing in design and marketing while outsourcing manufac-turing – the most volatile and capital-intensive part of the production cycle – has had the dual
7 See U.S. Department of Labor, Bureau of Labor Statistics, “International Comparisons of Hourly Compensation Costsfor Production Workers in Manufacturing, 2005”, November 30, 2006.
792 M. Xafa / Journal of Policy Modeling 29 (2007) 783–796
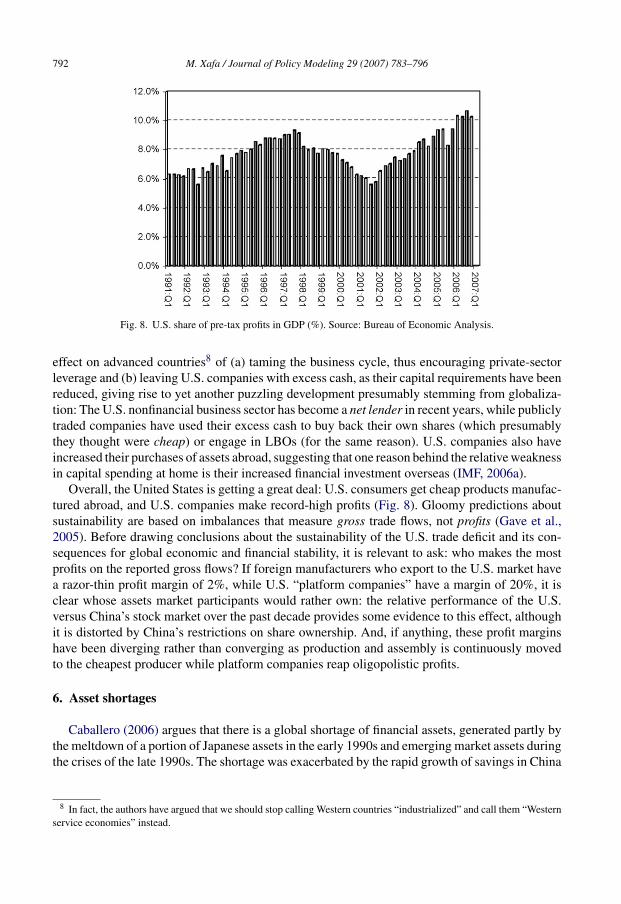
Fig. 8. U.S. share of pre-tax profits in GDP (%). Source: Bureau of Economic Analysis.
effect on advanced countries8 of (a) taming the business cycle, thus encouraging private-sectorleverage and (b) leaving U.S. companies with excess cash, as their capital requirements have beenreduced, giving rise to yet another puzzling development presumably stemming from globaliza-tion: The U.S. nonfinancial business sector has become a net lender in recent years, while publiclytraded companies have used their excess cash to buy back their own shares (which presumablythey thought were cheap) or engage in LBOs (for the same reason). U.S. companies also haveincreased their purchases of assets abroad, suggesting that one reason behind the relative weaknessin capital spending at home is their increased financial investment overseas (IMF, 2006a).
Overall, the United States is getting a great deal: U.S. consumers get cheap products manufac-tured abroad, and U.S. companies make record-high profits (Fig. 8). Gloomy predictions aboutsustainability are based on imbalances that measure gross trade flows, not profits (Gave et al.,2005). Before drawing conclusions about the sustainability of the U.S. trade deficit and its con-sequences for global economic and financial stability, it is relevant to ask: who makes the mostprofits on the reported gross flows? If foreign manufacturers who export to the U.S. market havea razor-thin profit margin of 2%, while U.S. “platform companies” have a margin of 20%, it isclear whose assets market participants would rather own: the relative performance of the U.S.versus China’s stock market over the past decade provides some evidence to this effect, althoughit is distorted by China’s restrictions on share ownership. And, if anything, these profit marginshave been diverging rather than converging as production and assembly is continuously movedto the cheapest producer while platform companies reap oligopolistic profits.
6. Asset shortages
Caballero (2006) argues that there is a global shortage of financial assets, generated partly bythe meltdown of a portion of Japanese assets in the early 1990s and emerging market assets duringthe crises of the late 1990s. The shortage was exacerbated by the rapid growth of savings in China
8 In fact, the authors have argued that we should stop calling Western countries “industrialized” and call them “Westernservice economies” instead.
M. Xafa / Journal of Policy Modeling 29 (2007) 783–796 793
and in commodity producing countries that do not generate financial assets on a sufficient scale tosatisfy demand. As a result, the supply of financial assets has not kept pace with global demand forcollateral and store of value by institutional investors, households and other market participants.Asset shortages have contributed to “asset inflation”, low interest rates and global imbalances.Such shortages are dollar-supportive because of the superior U.S. growth record and asset quality.And since asset bubbles are endemic to this environment, it is best to learn to manage the risksthan risk bursting the bubbles. According to Caballero, the same recommendations apply to theglobal imbalances and to the liquidity consequences of low interest rates.
An interesting set of reports by Morgan (2007a, 2007b) lends support to this hypothesis byanalyzing asset supply and its regional breakdown. The authors note that robust global growthhas improved fiscal positions everywhere, thus reducing issuance of sovereign debt and leadingto a decline in total outstanding sovereign debt relative to GDP from a peak of about 65% ofGDP in the mid-1990s to 59% now. Similarly, the value of net equity issuance globally declinedby 34% in real terms. By region, the United States remains by far the largest issuer of equi-ties since 2000, followed by Asia ex-Japan (AXJ). Issuance has been moderate in the Euro areaand low in the UK, Japan and Latin America. With Hong-Kong the premier Asian financialcenter, underpinned by its dollar peg, the dollar block offers by far the largest supply of high-quality assets for global investors; it is thus hardly surprising that much of the world’s excesssavings are invested there. By contrast, the supply of U.S. corporate bonds is constant or declin-ing as a percent of GDP, reflecting the cash-rich position of U.S. corporates, while it is rising inthe Euro area but from very low levels. The authors suggest that the surge in financial innova-tions, such as credit derivatives, is a case of strong demand for risky assets generating its ownsupply.
Demand-side factors also have helped fuel the asset shortage. The universe of eager buyers oflow-yielding assets has been widened by three developments: one is the “global savings glut”,partly triggered by the export-oriented strategy of Asian countries discussed above, which forcesAsian central banks to buy U.S. bonds irrespective of relative returns. But there are two addi-tional big buyers: Japanese investors and Western pension funds. Japanese investors consider U.S.Treasury and Agency returns quite high, at a time when Japanese government bond yields barelyexceed 1% while the yen is depreciating, partly as a result of the yen carry trade that involvesshorting the yen to buy higher-yielding currencies. Moreover, for regulatory reasons, developedmarket pension funds and insurance companies (mainly in the U.S. and U.K.) are increasing theirholdings of fixed-income securities while reducing their share of equities in order to match theirassets more closely with their long-term liabilities. The impact of the 2001 recession on theseinstitutions, which were overweight in equities on the asset side and long duration on the liabilityside, was a double-whammy of poor equity returns and falling bond yields that hurt both sides oftheir balance sheets.
7. An abrupt unwinding is highly unlikely
The traditional view of global imbalances is based on the notion that the U.S. current accountis unsustainable because it leads to an accumulation of foreign liabilities that will inevitably leadto a loss of market confidence. This view assumes that (a) adjustment induced by policy actions ismore likely to be orderly than one initiated by financial markets; (b) financial markets are likelyto change their minds abruptly about the sustainability of the imbalances, unless they see that themain players are able to agree on the direction of the desired policy changes.
794 M. Xafa / Journal of Policy Modeling 29 (2007) 783–796
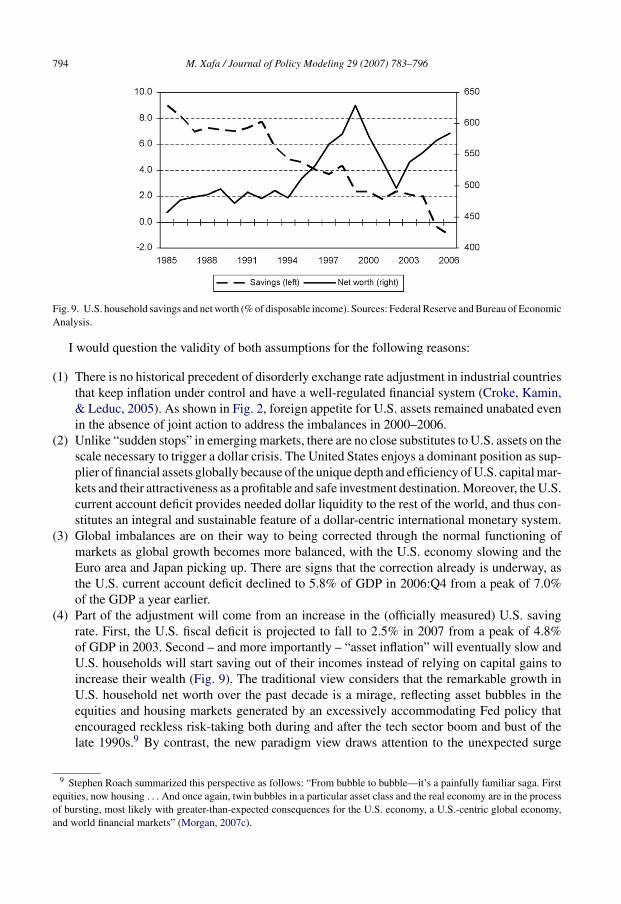
Fig. 9. U.S. household savings and net worth (% of disposable income). Sources: Federal Reserve and Bureau of EconomicAnalysis.
I would question the validity of both assumptions for the following reasons:
(1) There is no historical precedent of disorderly exchange rate adjustment in industrial countriesthat keep inflation under control and have a well-regulated financial system (Croke, Kamin,& Leduc, 2005). As shown in Fig. 2, foreign appetite for U.S. assets remained unabated evenin the absence of joint action to address the imbalances in 2000–2006.
(2) Unlike “sudden stops” in emerging markets, there are no close substitutes to U.S. assets on thescale necessary to trigger a dollar crisis. The United States enjoys a dominant position as sup-plier of financial assets globally because of the unique depth and efficiency of U.S. capital mar-kets and their attractiveness as a profitable and safe investment destination. Moreover, the U.S.current account deficit provides needed dollar liquidity to the rest of the world, and thus con-stitutes an integral and sustainable feature of a dollar-centric international monetary system.
(3) Global imbalances are on their way to being corrected through the normal functioning ofmarkets as global growth becomes more balanced, with the U.S. economy slowing and theEuro area and Japan picking up. There are signs that the correction already is underway, asthe U.S. current account deficit declined to 5.8% of GDP in 2006:Q4 from a peak of 7.0%of the GDP a year earlier.
(4) Part of the adjustment will come from an increase in the (officially measured) U.S. savingrate. First, the U.S. fiscal deficit is projected to fall to 2.5% in 2007 from a peak of 4.8%of GDP in 2003. Second – and more importantly – “asset inflation” will eventually slow andU.S. households will start saving out of their incomes instead of relying on capital gains toincrease their wealth (Fig. 9). The traditional view considers that the remarkable growth inU.S. household net worth over the past decade is a mirage, reflecting asset bubbles in theequities and housing markets generated by an excessively accommodating Fed policy thatencouraged reckless risk-taking both during and after the tech sector boom and bust of thelate 1990s.9 By contrast, the new paradigm view draws attention to the unexpected surge
9 Stephen Roach summarized this perspective as follows: “From bubble to bubble—it’s a painfully familiar saga. Firstequities, now housing . . . And once again, twin bubbles in a particular asset class and the real economy are in the processof bursting, most likely with greater-than-expected consequences for the U.S. economy, a U.S.-centric global economy,and world financial markets” (Morgan, 2007c).
M. Xafa / Journal of Policy Modeling 29 (2007) 783–796 795
in productivity and disinflation since the mid-1990s that lowered real long-term interestrates and raised the value of long-term assets (Lipsky, 2007). The first view regards the U.S.economy as flirting with recession and hard landing, whereas the second view predicts amarket-led, smooth unwinding of imbalances.10
(5) Just how small a probability markets attach to the abrupt unwinding scenario is reflected inasset price movements. The dollar’s gradual fall since its peak in February 2002 has beenremarkably benign in terms of its impact on financial markets, as it has been accompaniedby a decline in 10-year Treasury yields from 4.89% at end-February 2002 to 4.63% atend-March 2007). Markets continue to view U.S. Treasuries as a risk-free asset that benefitsfrom “safe-heaven” flows. In the two most recent risk-reduction episodes (May–June 2006and February–March 2007), flight to quality was associated with dollar appreciation,contrary to the predictions of the traditional view. And the forward discount of the dollarversus major currencies is small or negative.
8. Conclusion
Gloomy predictions about the unsustainability of the U.S. current account deficit and its dismalconsequences for the dollar and interest rates, repeated year after year, have failed to materi-alize and are unconvincing. Who is to tell financial markets what is sustainable and what isnot? Markets can be wrong for a while, as they were in the tech boom and bust of the late1990s, but they cannot be wrong for more than a decade. Financial innovations have improvedthe pricing, repackaging and spreading of risk and better supervision and risk managementpractices also have contributed to more resilient financial markets (IMF, 2006b). Globaliza-tion – both real and financial – has improved productivity while reducing “home bias” ininvestment decisions. The result has been an unprecedented and sustainable increase in globalwealth.
The rise in the U.S. current account deficit, the shift to surplus of emerging market coun-tries, and the low long-term real interest rates appear as anomalies in the traditional view.But once capital flows are endogenized as functions of risk-adjusted returns and diversifica-tion opportunities, global imbalances become an equilibrium outcome of differences in potentialgrowth rates and asset supplies across different countries and regions. The portfolio balancemodels constructed by Blanchard, Caballero, Dooley and their co-authors do not give rise toany catastrophic events. Instead of a crash landing, I have argued that the imbalances are ontheir way to being corrected by the normal functioning of markets, and that the obvious lack ofappetite for any concerted policy action by the major players should therefore not be cause forconcern.
Indeed, the biggest threat to the dollar and to global financial stability does not come fromthe global imbalances per se, but from the protectionist pressures they may trigger. The U.S.decision to impose countervailing duties on imports of certain Chinese products in March 2007triggered an immediate increase in speculative short positions against the U.S. dollar. The IMMCommitment of Traders report showed a US$ 4 billion jump in these positions to US$ 18 billionwithin a week, notably against long Euro positions. This reaction underscores the view thatit is policymakers, not market participants, who are more likely to upset the existing “stabledisequilibrium”.
10 See also Wolf (2004) and J.P. Morgan (2006, July 14) for a discussion of the two contrasting views.
796 M. Xafa / Journal of Policy Modeling 29 (2007) 783–796
References
Ahearne, A., Cline, W. R., Lee, K. T., Park, Y. C., Pisani-Ferry, J., & Williamson, J. (2007). Global imbalances: Time foraction. Peterson Institute for International Economics, Policy Brief No. 7-4.
Bernanke, B. S. (2005, March). Remarks at Sandridge lecture. Virginia Association of Economics, The Global SavingGlut and the U.S. Current Account Deficit. Richmond, VA.
Blanchard, O., Giavazzi, F., & Sa, F. (2005). The U.S. current account and the dollar (Brookings Papers on EconomicActivity, 2005-1).
Caballero, R., Farhi, E., & Gourinchas, P.-O. (2006). An equilibrium model of global imbalances and low interest rates(NBER Working Paper No. 11996).
Caballero, R. (2006). On the macroeconomics of assets shortages (NBER Working Paper No. 12753).Cline, W. (2005). The United States as a debtor nation. Institute for International Economics.Cooper, R. N. (2005, November). Living with global imbalances: A contrarian view. Institute for International Economics
Policy Brief No. 5-3.Croke, H., Kamin, S., & Leduc, S. (2005). Financial market developments and economic activity during the current
account adjustments in industrial economies (International Finance Discussion Paper No. 827). Federal ReserveBank.
Dooley, M., Folkerts-Landau, D., & Garber, P. (2003). An essay on the revived bretton woods system (NBER WorkingPaper No. 9971).
Dooley, M., Folkerts-Landau, D., & Garber, P. (2004). The U.S. current account deficit and economic development:Collateral for a total return swap (NBER Working Paper No. 10727).
Feldstein, M. (2006, April 28). The dollar at home and abroad. Wall Street Journal.Gave, C., Kaletsky, A., & Gave, L.-V. (2005). Our brave new world. Hong Kong: GaveKal Research.Gourinchas, P.-O., & Rey, H. (2005). International financial adjustment (Center for Economic Policy Research Discussion
Paper No. 4923).Gourinchas, P.-O., & Rey, H. (2006). From world banker to world venture capitalist: U.S. external adjustment and the
exorbitant privilege (NBER Working Paper No. 11562).Hausmann, R., & Sturzenegger, F. (2006). Global imbalances or accounting? The missing dark matter in the wealth
of nations (Center for International Development Working Paper No. 124). Harvard University, Kennedy School ofGovernment.
IMF. (2006, April). World economic outlook. Washington: International Monetary Fund. [Chapter IV].IMF. (2006, September). Global financial stability report. Washington: International Monetary Fund.J.P. Morgan (2006, July 14). A funny thing happened on the U.S. Comfortable Path to Ruin.Lipsky, J. (2007, March 30). Reducing the risk from global imbalances. Remarks at the Ambrosetti 18th Annual Forum
on the Outlook for Financial Markets.McKinnon, R., & Schnabl, G. (2006). Devaluing the dollar: A critical analysis of william cline’s case for a new plaza
agreement. Journal of Policy Modeling.Morgan Stanley. (2007, March 22). Proposing an asset shortage hypothesis. Currencies.Morgan Stanley. (2007, March 29). G10: Asset shortage hypothesis. FX Pulse.Morgan Stanley. (2007, March 16). The great unraveling. Global.Obstfeld, M., & Rogoff, K. (2000). The six major puzzles in international macroeconomics: Is there a common cause? In
B. S. Bernanke & K. Roggoff (Eds.), NBER macroeconomics annual. Cambridge, Mass: MIT Press.Obstfeld, M., & Rogoff, K. (2004). The unsustainable U.S. current account position revisited (NBER Working Paper No.
10869).Roubini, N., & Setser, B. (2004). The U.S. as a net debtor: The sustainability of the U.S. external imbalances. Stern School
of Business, NYU.Wolf, M. (2004, August 18). America is now on the comfortable path to ruin. Financial Times.Xafa, M. (2007). Global imbalances: Do they matter? Cato Journal, 27(1).
Recommended