Hate Crime Does Not Predict Trump Support, but Non-Reporting of Hate
Crime Does
By: Lauren Van De Hey
A Senior Honors Thesis in the Department of Political Science at the University of California, San Diego
April 3rd, 2017

Van De Hey 2
Table of Contents Acknowledgements ……………………………………………………………………………...4
Chapter 1: The Rise of Trump……….….……………………………………………………...5
Chapter 2: We Did Not See It Coming…………….….………………………….…………....13
2.1 Overview………………………………………………………………………….….13
2.2 Who Votes? ………………………………………………………………………….13
2.3 Who Voted for Trump? ………………………………………………………………15
2.4 Why Did People or Counties Vote for Trump? ……………………………….….….16
2.5 Trump Did Not Create Cultural Apathy, But He Benefited from It………………….17
2.6 The New Radical Right………………………………………………………………19
2.7 A Vote for the Radical Right?....………………………………………………….….20
Chapter 3: Theory and Hypothesis……………………………………………………………22
3.1 The Theory and its Limitations…………………….…….…….…………………….22
3.2 The Theory: Bad Reputation, Non-Elected Officers, and Elected Officials…………23
Chapter 4: Research Design…………….….……………………………………………….….27
4.1 Overview……………………………………………………………………….…….27
4.2 Dependent Variable: Trump Support………………………………………………...30
4.3 Independent Variables……………………………………………………………….31
4.4 Control Variables……………………………………………………………………33
4.5 Descriptive Statistics and Difference in Means Test..……………………………….35
Chapter 5: Multivariate Empirical Analysis………….….….….…..….….…..….…….…….36
5.1 Overview………………………………………………………………………….….36
5.2 Effect of Trump Support on Demographics, Income, and Education (Model 1) ...….37
5.3 Effect of Trump Support on Hate Not Reported (Model 2)...………………………...38
5.4 Effects of Trump Support on Hate Not Reported or Zero (Model 3).…….…….……38

Van De Hey 3
5.5 Effects of Trump Support on Magnitude of Hate (Model 4)….….….………….……39
5.6 Robustness Check for County Capacity……………………...………………………40
5.7 Robustness Check for Demographics…………………………………………….….41
5.8 Overall Effects……………………………………………………………………….43
Chapter 6: Discussion……………………………………………………………………….….45
6.1 Summary of Results……………………………………………………………….….45
6.2 Hate Reported…………………………………………………………………….….46
6.3 Academic Implications……………………………………………………………….47
6.4 Policy Proposal and Implications……………………………………………………48
6.5 Combating Underlying Racism and Racial Anxiety…………………………………50
Chapter 7: Racial and Ethnic Politics After Trump………….….….….…………………….50
7.1 Predicting the Unpredictable………………………………………………………...51
7.2 Rhetoric………………………………………………………………………………51
Works Cited…………………………………………………………………………….….……53
Appendix………………………………………………………………………...………………60

Van De Hey 4
Acknowledgements
I would like to thank my advisor Professor Tom Wong for pushing me throughout this
process, which has been challenging but gratifying. I simply would not have been able to write
this thesis without your guidance and support.
I would also like to thank Professors Adida and Broz for creating a supportive
environment in the honors thesis course, and for all of the individual feedback that each of you
has given to me and to everyone else in the honors program. You each genuinely care about all
of us and our work, and I am thankful that I decided to take this course.
I can’t thank PhD candidate Brandon Merrell enough for all of his help with STATA and
answering innumerable emails promptly and with seemingly endless patience. Thank you to my
friends, family, and fellow honors students for unwavering support during these past two
quarters.
Finally, I would like to thank Professor Jeff Gagnon for inspiring me to pursue a major in
the humanities.

Van De Hey 5
Chapter 1: The Rise of Trump
Very few people predicted the Trump phenomenon. Many people were left with the
question: how did someone with no political experience make it to the White House? Was it his
isolationist foreign relations positions, economic platform targeting the blue collar middle class,
anti-minority social rhetoric, or something else? Some people say his supporters do not fit into
consistent demographic patterns or ideological positions. To them, his election represents social
and political rebellion against the status quo (Sides 2016). Looking at the situation from that
angle, the question then becomes what are the underlying social and political factors that fueled
this rebellion? This is a larger question than “Why did people vote for Trump?”; this is a
question that tries to understand the dissatisfaction that led to the election of a populist candidate.
While these questions may seem the same to some, they are distinct. The first assumes people are
supporting a candidate for his specific views, positions, and policies, while the second speaks to
why the American people supported a symbol of anti-establishmentarianism.
Many political scientists have attempted to answer these difficult questions, though they
have not reached a consensus. Some simply see it as a demographics win for Trump. He was
able to mobilize the white, less educated, rural, and evangelical factions of our country more than
anyone expected, while Clinton failed to mobilize minorities, urban populations, and secular
voters to the same extent (Brockway 2016; Rodden 2017). Most, however, are entrenched in the
debate of whether it was economic or social—read racial—anxiety (Birnir 2016; Casselman
2017; Cerrato 2016; Collingwood 2016; Major 2016; Tesler 2016; Yanagizawa-Drott 2016). The
way these authors define and describe social and economic anxiety varies, but generally, there
seems to be common threads among each camp. Researchers describe and analyze economic
anxiety using myriad proxies from living in a post-industrial town, or one that is more vulnerable

Van De Hey 6
to import competition with China or Mexico, to the more traditional unemployment, job losses to
globalization, or surveys measuring economic optimism for the future (Casselman 2017; Cerrato
2016; Rothwell 2016). Researchers describe social anxiety in much the same way as economic
anxiety, in that it is described in every way imaginable—from the influx of immigration in a
certain area, or feelings toward one’s own racial group, to the loss of social mobility, or the
larger anxiety surrounding perceived loss of white power (Birnir 2016; Klinkner 2016; Major
2016; Rothwell 2016; Tesler 2015, 2016; Thompson 2016).
These opposing sides of debate share a common goal: they attempt to understand the
demographics that led to Trump support in the context of a larger explanation. Though these
larger explanations—economic and social anxiety—are often presented as conflicting views
using different proxies to describe them, most do share a common undertone. This undertone is
the feeling that the American Dream is failing, and [white] people are worse off now, socially
and economically, than their parents or grandparents were at their age (Cramer 2016; Rothwell
2016; Sides 2016; Thompson 2016; “Kaiser […]” 2016 ). Experts are arguing opposite sides,
using vastly different data, and still, when they step back to draw larger conclusions, they are
saying the same thing—white America is anxious and unhappy. The point is not which
explanation or narrative (economic or social) is more correct because, more likely than not, they
are both correct (Casselman 2017; Thompson 2016). The point is that economic and social
anxiety are not mutually exclusive, and moreover, they tend to be mutually reinforcing. Further,
they are two parts of a larger, underlying issue: racism (Thompson 2016).
Racism is a very broad term, and though political scientists have argued it is too
simplistic, I believe that the specific proxies listed above for measuring economic and social
anxiety are too narrow to encompass the larger trend of white dissatisfaction and disillusionment

Van De Hey 7
with the government. I argue that this dissatisfaction is not a result of recent social or economic
anxiety brought about by the 2016 election but is instead the most recent chapter in a backlash
against the changing demographic of the nation and Democratic party (Abrajano 2015). While
racism is not the sole reason Trump was elected, it does explain why there is no clear winner in
the economic versus social debate: economic and social anxiety are masking racism. Racism
flourishes during periods of weak economic growth or recession and an increasing minority
population (Thompson 2016). Racism also puts white dissatisfaction into context because when
the majority group feels socially or economically threatened, as during periods of weak
economic growth or recession and increasing minority population, they turn to nationalism and
nativism to consolidate what they perceive as rightfully theirs (Swain 2004; Thompson 2016).
Trump played on white America’s nativist anxieties with his “Make [white] America Great
Again” slogan and it won him the presidency.
Though this paper will be rooted in the expansive voting literatures, there is far less
material surrounding the voting tendencies of democracies when confronted with populist
candidates, and almost nothing that attempts to link voting, the election of populist candidates,
and racism using quantitative analyses. The literature on Trump, while large for the timespan, is
still very young. Political scientists and researchers of every field will be studying this election
for years, perhaps centuries, to come. My contribution to this literature will be to answer the
question: Can non-reporting of hate crimes predict Trump support? More specifically, is there a
correlation between instances of non-reporting of hate crime by county in 2015 and vote share
for Trump in the 2016 general presidential election? The term “non-reporting” in this paper
means counties that do not report hate crimes to the FBI.

Van De Hey 8
Non-reporting of hate crimes aggregated at the county level is my measure of racism.
Though hate crime is an obvious measure of racism, non-reporting of hate crimes is not so
obvious. Lawyers at the Department of Justice say there are two reasons counties do not report
hate crimes: (1) They do not have the financial resources; (2) They do not care (Wong).1 I
believe the latter and will use 2014 IRS tax data per capita as a measure of fiscal county capacity
to control for the former.
My main argument is that local elected officials in counties that do not report hate crimes
do not report because they do not care. There are many reasons why these officials may not care
about hate crime reporting. Their state might not require them to report so there is less incentive,
or if it is required, then they are reflecting local public opinion, which may not deem it
important. 2 Though elected officials do not comprise the majority of law enforcement, the
positions that they hold are influential. Governors and local sheriffs respond to public opinion,
and the public elects those they feel share similar values. Similarly, even though non-elected law
enforcement officials do not have to contend with reelections, they are still susceptible to public
opinion. A county that does not report hate crimes, if it is not constrained economically, is at the
very least indifferent to hate motivated crimes, and at most complicit in their proliferation.
I hypothesize that non-reporting counties will be able to predict areas of high Trump
support. I predict there will be a positive correlation between Trump support and the non-
reporting of hate crimes by county. In other words, counties that do not report hate crimes will
1 This information comes from my advisor Professor Tom Wong’s contacts at the Department of Justice. 2 Only five states have no state-level hate crime legislation in place. They are Arkansas, Georgia, Indiana, South Carolina, and Wyoming ("#50StatesAgainstHate: An Initiative for Stronger Hate Crime Laws").
Van De Hey 9
have significantly higher levels of Trump support than counties that do report hate crimes. Non-
reporting of hate crime is the variable of interest because it is the best measure of systematic hate
crime data available. The reported hate crime data published by the FBI is flawed. It is flawed
because while the Attorney General is mandated by congress to track and publish hate crime data
annually, states are encouraged, but not required, to submit hate crime data (King 2007). This
creates a response bias in the data where counties that track and submit data in good faith seem
to have a hate crime problem and counties that do not, appear to have no problem.
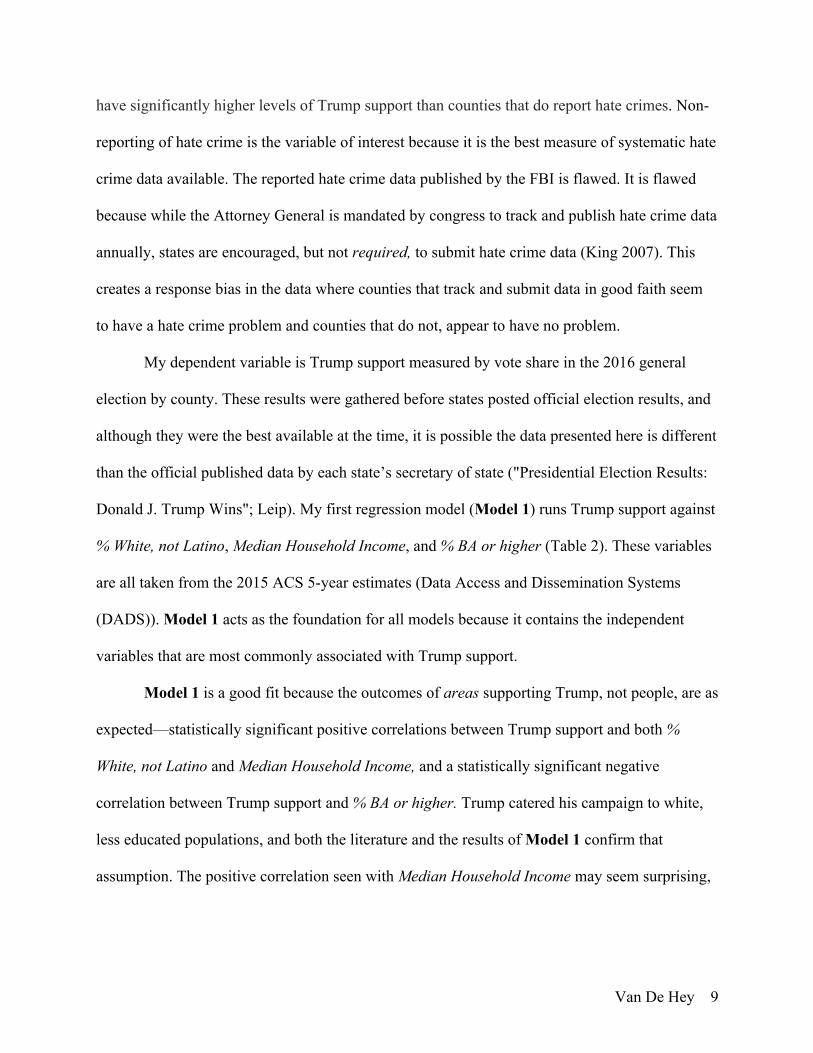
My dependent variable is Trump support measured by vote share in the 2016 general
election by county. These results were gathered before states posted official election results, and
although they were the best available at the time, it is possible the data presented here is different
than the official published data by each state’s secretary of state ("Presidential Election Results:
Donald J. Trump Wins"; Leip). My first regression model (Model 1) runs Trump support against
% White, not Latino, Median Household Income, and % BA or higher (Table 2). These variables
are all taken from the 2015 ACS 5-year estimates (Data Access and Dissemination Systems
(DADS)). Model 1 acts as the foundation for all models because it contains the independent
variables that are most commonly associated with Trump support.
Model 1 is a good fit because the outcomes of areas supporting Trump, not people, are as
expected—statistically significant positive correlations between Trump support and both %
White, not Latino and Median Household Income, and a statistically significant negative
correlation between Trump support and % BA or higher. Trump catered his campaign to white,
less educated populations, and both the literature and the results of Model 1 confirm that
assumption. The positive correlation seen with Median Household Income may seem surprising,

Van De Hey 10
but what must be understood is that while people in these areas may be economically anxious,
they are not undergoing economic hardship (Casselman 2017; Silver 2016; “Kaiser […]” 2016).
Model 2 contains the independent variable of interest—Hate Not Reported. Hate Not
Reported is the non-reporting of hate crimes that are derived from the FBI’s Uniform Crime
Reporting (UCR) for 2015 by county (“Table 14 […]”). Model 2 also controls for county
capacity by $ Per Capita, which is the total tax receipts from the 2014 IRS County Tax Data
divided by the population from the 2015 ACS 5-year estimates (Wong; Data Access and
Dissemination Systems (DADS)). For consistency, it also maintains the controls present in
Model 1—% White, not Latino, Median Household Income, and % BA or higher. I found that
counties that did not report hate crimes had significantly higher levels of Trump support than
those counties that did report hate crimes. These conclusions hold at the 99.9% confidence level
even when controlling for county capacity, percent white, median household income, and
education (Table 2).
Model 3 and Model 4 attempt to control for the ambiguity that results from a reporting of
zero hate crimes by counties. Zeros are ambiguous because they can indicate that a county did
not have any hate crimes during that year, or that they did but for whatever reason—not
investigating them, do not think they occur, trying to hide racial or minority tensions in their
jurisdictions—they report having zero hate crimes. Specific non-reporting theories are discussed
in chapter two.
Model 3 measures Hate Not Reported or Zero, which groups counties that did not report
hate crimes to the FBI in 2015 with counties that reported zero hate crimes to the FBI in 2015
(Table 14 […]”). Model 3 uses the same control variables that are present in Model 2—county
capacity ($ Per Capita), % White, not Latino, Median Household Income, and % BA or higher. I

Van De Hey 11
found that counties that did not report hate crimes or reported zero hate crimes had significantly
higher levels of Trump support than those counties that did report hate crimes. These conclusions
hold at the 99.9% confidence level even when controlling for county capacity, percent white,
median household income, and education (Table 2).
Model 4 measures Magnitude of Hate (H>0), which uses reported hate crimes by county
in 2015, though it excludes the counties that reported zero hate crimes (“Table 13[…]”; “Table
14[…]”). Model 4 uses the same control variables that are present in both Models 2 & 3—
county capacity ($ Per Capita), % White, not Latino, Median Household Income, and % BA or
higher. I found that there is a statistically significant negative relationship at the 99% confidence
level between reported, non-zero hate crimes and Trump support (Table 2). These conclusions
hold even when controlling for county capacity, percent white, median household income, and
education (Table 2). This is significant because without zeros in the data, the correlation between
reported hate crimes in 2015 and Trump support become more positive and less significant than
the Hate Reported data (appendix).
To summarize, Model 1 provides credibility for all models because it aligns with trends
in variables most commonly associated with counties that have high levels of Trump support.
Models 3 and 4 explore and check against the ambiguity of zeros in the FBI’s data, while Model
2 tests the main hypothesis: can non-reporting of hate crimes predict Trump support by county?
The takeaway of this paper is that while hate crimes cannot predict Trump support by county, the
non-reporting of hate crimes can.
Next, I will present an overview of the relevant literature and show how my research
both coincides and deviates from it. I will then cover my research design and multivariate

Van De Hey 12
empirical analysis and end with a discussion of the implications for hate crime laws, policy
suggestions, and lastly, implications of a Trump presidency.

Van De Hey 13
Chapter 2: We Did Not See It Coming
2.1 Overview
Trump’s presidential win came as a shock to most Democrats and Republicans alike.
They saw his rhetoric, tweets, and absence of a conventional political platform, and did not take
him seriously. Coastal and urban elites—largely Democrats—tend to be isolated from the
surrounding rural, or suburban areas, which are largely Republican strongholds (Bartels 2016;
Cramer 2016; Rodden 2017, 2017; Rothwell 2016). Couple that with one-sided social media and
biased news sources and it is not hard to see why people did not foresee a Trump presidency.
During and after Trump’s win, commentators, political scientists, and many others
attempted to explain why very few predicted Trump. Many argued that Trump was a new kind of
candidate for a variety of reasons ranging from his populist rejection of the current political
elites, to his economic isolationism, to his anti-minority rhetoric (Farrell 2016; Rothwell 2016;
Sides 2016). While arguments that claim Trump is a unique phenomenon are comforting because
they excuse the wrong predictions, they are false. A candidate like Trump is rare, especially after
1980, though he is not unique (Klinkner 2016). I will argue that the changing attitudes and values
in voting over the last forty years paved the way for a candidate like Trump.
2.2 Who Votes?
There is a vast amount of literature concerning voting—who votes, why they vote,
whether they vote Democrat, Republican, etc. On the forefront of voting literature in the late
twentieth century was Wolfinger and Rosenstone with Who Votes? (1980). Who Votes? was one
of the first sources that delved into analytical research for elections and concluded who votes in a
presidential election. They concluded that in the 1972 presidential election, education was the

Van De Hey 14
most important factor when determining whether someone would vote, that women voted less
than men, and that the old voted less than the young (Wolfinger 1980). They also concluded that
although voters had different demographic characteristics than non-voters, the voting population
was representative of the population as a whole, so it does not matter who votes (Wolfinger
1980).
More recently, Nagler and Leighley responded to Who Votes? with Who Votes Now?
Demographics, Issues, Inequality, and Turnout in the United States (2013). In a study that
analyzed voter turnout in every U.S. election from 1972 to 2008, they concluded that voters are
not representative of the entire population, so who votes does matter (Nagler 2013). Further, they
concluded that the income bias between voters and non-voters has remained stable in times of
increasing economic inequality, that the wealthy vote more than the poor, the more educated vote
more than the less educated, the old vote more than the young, and women vote more than men
(Nagler 2013).
Though this information is an important base for studying any facet of voting, the
question this paper is trying to answer is not “Who votes?” but, “Who voted for Trump?” and
“Why would the U.S. vote for a candidate like Trump?” These questions are distinct. The
answers to “Who voted for Trump? will be surface-level demographic information, while
answers to “Why would the U.S. vote for a candidate like Trump?” will be more complex.
However, there are a few missing links between these two questions that need to be clarified.
While a consensus around who voted for Trump will arise, and it will include a list of
demographic factors, it is unlikely that a consensus around the second question will arise
anytime soon. Finally, “Why did people vote for Trump?” stands somewhere in the middle of
“Who voted for Trump?” and “Why would the U.S. vote for a candidate like Trump?” Since it

Van De Hey 15
overlaps with both questions, it will be discussed in connection with “Who voted for Trump?”
and “Why would the U.S. vote for a candidate like Trump?” I first attempt to answer the
question: Who voted for Trump?
2.3 Who Voted for Trump?
From social media and news sources, people believed they had a handle on who voted for
Trump. They believed that it was poor, uneducated whites living in the middle of the country. Is
this true? Yes and no. Yes, it appears that as far as demographics go, people who are less
educated, white, evangelical, living in rural areas, and in fear of economic downfall tended to
vote for Trump (Brockway 2016; Casselman 2017; Collingwood 2016; Cramer 2016; "Kaiser
Family Foundation/CNN Working-Class Whites Poll." 2016; Rodden 2017; Rothwell 2016;
Sides 2016). However, the answer is also “no” because there are mixed reports on whether
Trump supporters suffer economic hardship, economic anxiety, or any financial burden at all
(Casselman 2017; Cerrato 2016; Collingwood 2016; "Kaiser Family Foundation/CNN Working-
Class Whites Poll." 2016; Silver 2016; Thompson 2016; Yanagizawa-Drott 2016).
It is my contention that Trump supporters are not suffering from economic hardship, on
average, but are suffering from economic anxiety (Casselman 2017; Cerrato 2016; Collingwood
2016; "Kaiser Family Foundation/CNN Working-Class Whites Poll." 2016; Silver 2016;
Thompson 2016; Yanagizawa-Drott 2016). Economic hardship is one’s dire economic position
right now, while economic anxiety is concern over one’s future economic position (Casselman
2017). Trump did not win on economic hardship, quite the opposite, but he did win on economic
anxiety (Silver 2016; Casselman 2017; Cerrato 2016; Collingwood 2016; Thompson 2016).

Van De Hey 16
Political scientists could not get a straight answer using traditional measures of economic
hardship, such as unemployment or poverty, so they turned to more creative measures that
reflected economic anxiety, such as counties where the jobs are vulnerable to automation or
outsourcing, instead of economic hardship (Silver 2016; Casselman 2017; Cerrato 2016;
Collingwood 2016; Thompson 2016). Why economic anxiety led white Americans to flee to
Trump is puzzling because white Americans of all income levels have benefitted more
economically under Democratic presidents than Republican presidents (Bartels 2016).
Other political scientists argued it was not one’s economic situation at all, but rather
social or racial anxiety brought to the surface by Trump’s anti-minority, anti-immigration
rhetoric that compelled voters to support him (Major 2016; Rothwell 2016; Sides 2016; Tesler
2015, 2016; Thompson 2016). For the purposes of this paper, racial anxiety is the changing
demographics of the nation, including the influx of non-white immigrants, and the reactions of
white America to these changes. These two theories—economic or social [racial] anxiety—
became the premiere debate in political science and it is widely accepted that the answer to
“Why Trump” lies somewhere within.
2.4 Why Did People or Counties Vote for Trump?
The economic versus racial debate attempts to understand voter demographics and frame
them as part of a larger explanation. This larger explanation is cultural apathy and
disillusionment with the government. The economic and racial anxiety debate attempts to
answer, “Why did people or counties vote for Trump?” through demographic data and link it to
this cultural dissatisfaction. In these articles, racial and economic anxieties were measured in
unusual ways, but they both tied back to the idea that the American Dream is failing and [white]

Van De Hey 17
people perceive themselves as worse off now than their parents or grandparents were at their age
(Cramer 2016; Rothwell 2016; Sides 2016; Thompson 2016; Kaiser 2016).
Indeed, the racial versus economic debate has not been adequately answered because the
answer is: they are both correct (Casselman 2016; Thompson 2016). Racial and economic
anxiety go hand-in-hand. Racism flourishes during periods of weak economic growth, recession,
and/or with increasing minority population (Thompson 2016). Racism also puts white
dissatisfaction into context because when the majority group feels socially or economically
threatened, as in these specific periods, they turn to nationalism and nativism to consolidate what
they perceive as theirs to lose (Swain 2004; Thompson 2016).
The economic-racial debate, and the underlying message of white anxiety, can then be
viewed as masking racist anxiety. Political scientists and commentators alike have sensed this
cultural, racial apathy (racist anxiety) and have tried to understand it. While some political
scientists have argued that this apathy was caused by Trump’s candidacy, still others believed
that Trump was only the symptom of an underlying, pre-existing American racism (Klinkner
2016). I will argue that while Trump’s candidacy may have increased voter apathy and racist
anxiety, he did not create it. I will argue that the cultural divide over race, racial polarization in
politics, the emergence of a new white nationalism, and the creation of the far-right party in the
U.S. has its roots even before the civil rights movement, and that these trends primed the
electorate for a Trump presidency.
2.5 Trump Did Not Create Cultural Apathy, But He Benefited from It
From 1932 through 1964, the Democratic party held a majority coalition comprised of
Northern liberals and Southern conservatives; the dividing line of politics was economics

Van De Hey 18
(Drutman 2016). The passage of the civil rights laws divided the Democratic party between
Northern liberals and Southern conservatives, and created a backlash among the Northern, white
working class, and the Southern, white conservatives in the Democratic party (Drutman 2016;
Sides 2016; Tesler 2013). This shifted the divisive issue from economics to race, and the
Republicans capitalized when the Northern, white working class, and the Southern, white
conservatives fled the Democratic party.
When the dividing line of politics became race after the civil rights era, racial rhetoric
was excised from political discourse. This stifled overt racism while fostering racial resentment
and anxiety (Klinkner 2016; Tesler 2013). From the 1980s onward, there was a slow, forty-year
realignment where the demographics of the Democratic and Republican parties switched, and
economics took the forefront once again (Drutman 2016). Republicans gained the less educated,
rural white conservative voters, while the Democrats gained the more educated, urban white
liberal voters (Drutman 2016; Tesler 2013).
During the early 2000s, these less educated, rural, conservative white Republicans were
losing their livelihoods and becoming more concerned with immigration and globalization. They
did not care as much about limiting the government’s reach or free trade as they did about
securing their disappearing jobs. The only way the Republican party retained these voters was by
convincing them that a large government meant that they, and the rest of the white middle class,
would be stuck paying for social relief programs for poor, people of color (Drutman 2016). This
strategy further racialized party lines, racialized social programs aimed to help all
underprivileged, and led to increased racial resentment among middle class Republicans.
After the election of Obama in 2008 and increased immigration, there was a racist
backlash against the perceived gains of minority groups (Sides 2016). Whites with strong white

Van De Hey 19
identity and racial attitudes became more socially conservative and Republican because of what
Michael Tesler (2013) coins “the spillover of radicalization”—Barack Obama’s historical and
cultural significance as the first African American president, which forced Americans to
constantly confront their racial attitudes (Tesler 2013). Since, racial attitudes have been able to
accurately predict non-race related issues, and these issues have begun to predict partisanship
(Drutman 2016; Klinkner 2016; Tesler 2013; Sides 2016).
2.6 The New Radical Right
After white working class Democrats fled to the Republican party in 1980, a subset (not
necessarily those that recently defected from the Democratic party) then moved further right—
forming the recent far populist right (Sides 2016). This new radical right in America arose in
response to the polarization of the parties based on race, and the perceived successes of minority
populations linked to the Democratic party (Bustikova 2014). The new radical right does not
resemble the radical right of the past, though they share similarities. The old radical right
included groups such as the Ku Klux Klan, reached out to only specific audiences, and condoned
violence (Swain 2004).
The new radical right in America, referred to as the new white nationalism, has toned
down its rhetoric, does not condone violence, and is focused on reaching mainstream audiences
(Swain 2004). New white nationalists feel that there is a racial double standard in this country,
that immigration is threatening the U.S., and that both threaten what is rightfully theirs (Swain
2004). While the new white nationalism may be separate from Trump’s brand of nativism, it is
hard to deny that they share a similar ideology. Trump is part of the new populist right in
America that resembles other populist groups in Europe, though it is distinct (Birnir 2016; Sides

Van De Hey 20
2016). While Trump does not hold a populist radical right ideology himself, he caters to populist
radical right voters with his antiestablishment rhetoric and nativist sentiments (Sides[Mudde]
2016). The largest difference between Trump’s populism and recent European populism is
deceivingly simple: America is not Europe. To use American and European populism
interchangeably would be to ignore America’s long history of deep-seeded racial conflict and
resentment. So, while Trump may not be a card-carrying member of the new white nationalism,
his rhetoric caters to them. Likewise, while the new American populist right may not be
exclusively a white nationalist group, they do share similar nativist ideologies.
2.7 A Vote for the Radical Right?
Though America’s long history of racist anxiety may have caused the rise of a new far-
right group in the U.S., that does not necessarily mean people who voted for Trump did so
because they are racist or in the far right. I have argued theoretically about the racial versus
economic debate masking racism, but is there evidence of this? In short, yes, there is. First, white
Republican racial resentment has increased compared to white Democratic resentment, and racial
resentment among white Southern Evangelical Republicans is greater than both white Northern
Evangelical Republicans and white Southern Republicans (Hetherington 2016).
Republicans are thirty percentage points more likely to vote for Trump if they believe
that Muslims pose an immediate threat to the U.S. than Republicans who do not view Muslims as
an immediate threat (Sides 2016). Republicans who are most opposed to immigration are fifty
percentage points more likely to vote for Trump than Republicans less opposed to immigration
(Tesler 2015). White Republicans were measured to be more ethnocentric than white Democrats,

Van De Hey 21
and white Republicans with the highest levels of ethnocentrism were more likely to support
Trump than any other candidate (Kalkan 2016).
Also, Trump did best among Americans who expressed more resentment toward
immigrants and African Americans (Tesler 2015). Luttig (2016) conducted an experiment that
went a step further than simply proving a correlation between Trump support and animosity
towards minority groups. He showed that white Trump supporters are less likely to give an
economic assistance policy when cued with pictures of black Americans compared with white
Americans (Luttig 2016). This demonstrates that racial animosity motivates Trump voters to
make political and/or legislative decisions (Luttig 2016).
I want to highlight the importance of the Luttig (2016) study. All of the other evidence in
this subsection is survey data in one form or another. These data are good for gauging an
individual’s likelihood of voting for Trump when they are primed with a question that attempts
to reveal racist feelings, but it is only a correlation. Luttig shows causation and gives direct
evidence that links racial animosity—an important value of the radical right—to political
decision-making.
Van De Hey 22
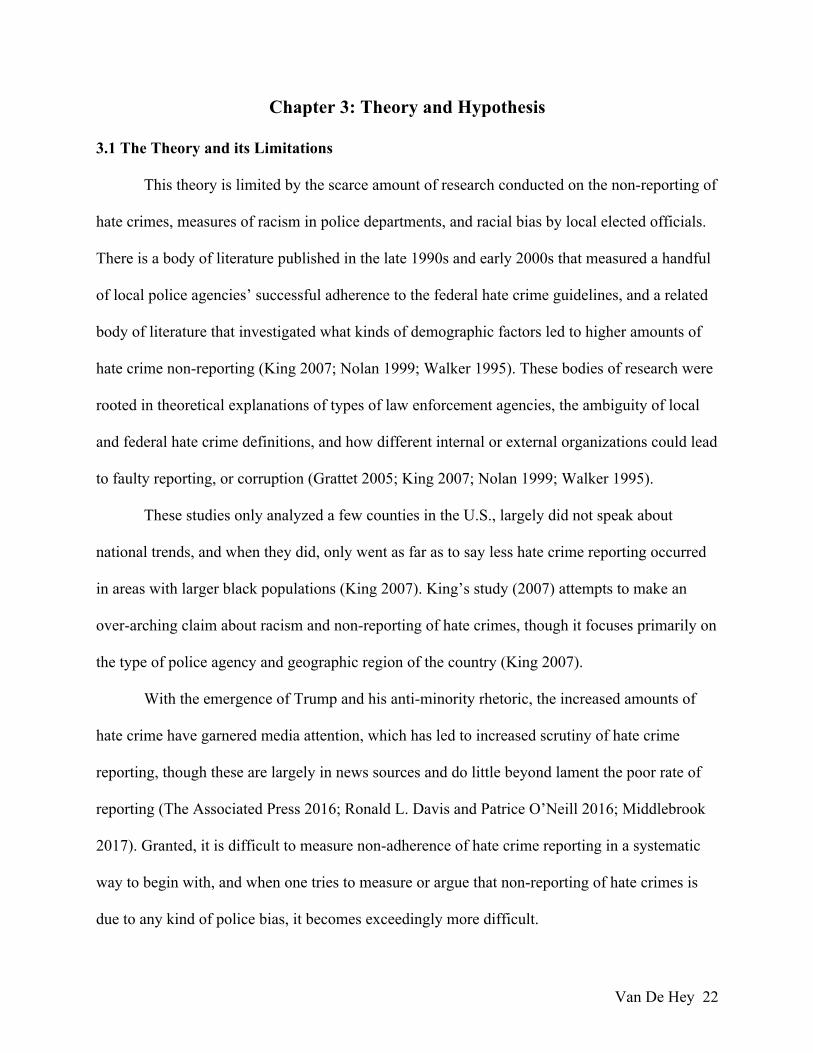
Chapter 3: Theory and Hypothesis
3.1 The Theory and its Limitations
This theory is limited by the scarce amount of research conducted on the non-reporting of
hate crimes, measures of racism in police departments, and racial bias by local elected officials.
There is a body of literature published in the late 1990s and early 2000s that measured a handful
of local police agencies’ successful adherence to the federal hate crime guidelines, and a related
body of literature that investigated what kinds of demographic factors led to higher amounts of
hate crime non-reporting (King 2007; Nolan 1999; Walker 1995). These bodies of research were
rooted in theoretical explanations of types of law enforcement agencies, the ambiguity of local
and federal hate crime definitions, and how different internal or external organizations could lead
to faulty reporting, or corruption (Grattet 2005; King 2007; Nolan 1999; Walker 1995).
These studies only analyzed a few counties in the U.S., largely did not speak about
national trends, and when they did, only went as far as to say less hate crime reporting occurred
in areas with larger black populations (King 2007). King’s study (2007) attempts to make an
over-arching claim about racism and non-reporting of hate crimes, though it focuses primarily on
the type of police agency and geographic region of the country (King 2007).
With the emergence of Trump and his anti-minority rhetoric, the increased amounts of
hate crime have garnered media attention, which has led to increased scrutiny of hate crime
reporting, though these are largely in news sources and do little beyond lament the poor rate of
reporting (The Associated Press 2016; Ronald L. Davis and Patrice O’Neill 2016; Middlebrook
2017). Granted, it is difficult to measure non-adherence of hate crime reporting in a systematic
way to begin with, and when one tries to measure or argue that non-reporting of hate crimes is
due to any kind of police bias, it becomes exceedingly more difficult.

Van De Hey 23
There is one recent case in New York, however, that demonstrates there is validity in the
concern over hate crime reporting and law enforcement bias. In 2013, the Suffolk County Police
Department was investigated by the Department of Justice, and their investigation “focused on
discriminatory policing allegations, including claims that SCPD discouraged Latino victims from
filing complaints and cooperating with the police, and failed to investigate crimes and hate crime
incidents involving Latinos” ("United States Agrees to Comprehensive Settlement with Suffolk
County Police Department to Resolve Investigation of Discriminatory Policing Against Latinos"
2013).New York is a state with local hate crime legislation, and though they are not
comprehensive, they are still present ("#50StatesAgainstHate: An Initiative for Stronger Hate
Crime Laws"). If this is an example of one county with some regulations, there are bound to be
more like it, and that is not even considering states without any local or state hate crime laws.
3.2 The Theory: Bad Reputation, Non-Elected Officers, and Elected Officials
Non-reporting of hate crimes by county will correlate with high areas of Trump support
because of latent racism. No causational link can be made here, though if the hypothesis above is
correct, there is a correlation between counties with high Trump support and counties who do not
report hate crimes.
Department of Justice lawyers say that counties do not report hate crimes because they
either do not have the financial resources to track them, or they do not care to track and/or
submit them (Wong). In my analysis, I will control for county capacity per capita to get a better
idea of whether counties have the monetary resources to report hate crimes. I predict that
counties do not report hate crimes because they do not care. There may be innumerable reasons
counties do not care, but I will propose three possibilities: The first is that counties do not want
Van De Hey 24
to admit they have a hate crime problem, so they withhold the information from the FBI; the
second is that non-elected officers believe their time should be spent on more important things,
and so they either do not collect or report hate crime data; the third is that elected officials
(sheriffs or governors) are responding to constituent’s feelings that hate crime collecting,
reporting, or both, are unnecessary.
There are numerous other possibilities, but aside from lack of resources, these seem to be
the most straightforward. Since I cannot provide empirical evidence for any of these mechanisms
at this time, all three are likely. All three of these theories tie in with racial resentment and
nativism. Minorities, and violence against minorities may not be seen as a priority because their
lives are presumed to be worth less than white lives. This does not mean that all police officers
or elected officials are racist or intentionally ignore hate crimes. This does not even mean that
those that fail to submit hate crime data are racist. This means that latent, subconscious racism is
a part of our society and needs to be evaluated.
Bad Reputation
Counties do not report they have a hate crime problem to the FBI because they do not
want to draw negative attention to their districts, and since hate crime reporting is not mandatory
for every state, they can do it. This is the least controversial of the three theories I propose
because it does not necessarily imply an intentional biased or negligent act. These agencies are
protecting themselves from scrutiny, and while the act of intentional non-transparency is
lamentable, it can be understood.

Van De Hey 25
Non-Elected Officers
Non-elected officers and elected officials are both a part of this discussion because there
are many ways county law enforcement agencies are organized and enforced. Officers, including
police chiefs, are municipal employees that are hired, not elected. Police chiefs, or other law
enforcement executives can be independent, or they can answer to a mayor; their police agencies
may be autonomous, or dominated by a political machine (Grattet 2005). Considering external or
internal influences is important for these theories because bias and corruption in police agencies
is not impossible.
Theoretically, non-elected officers come into contact with the surrounding community
more than elected officials. These officers are first and second responders who deal with crime
and the community directly, and while they do not need the public’s opinion to keep their job,
they are still influenced by it. They prioritize certain crimes over others, and while hate crime
data may be important to researchers, police chiefs or officers may not think it is an important
use of their time or resources (Nolan 1999). If these feelings are reinforced by the surrounding
community, then it makes it easier for non-reporting to occur.
Elected Officials
The elected officials’ theory is very similar to the non-elected officers’ theory. Elected
officials are not the people dealing directly with crime, but they do oversee the efficient running
of law enforcement agencies. “Efficient” here is open to interpretation. An elected official may
have a certain problem in their district, say it is drug abuse. That official wants to be reelected,
and their constituents are putting pressure on this elected official to solve the county’s drug
problem. Will this official still invest resources in hate crime investigation and reporting? The

Van De Hey 26
literature says that they will not if public opinion does not think it is important, they personally
feel it is not important, or they do not believe hate crimes occur in their districts (Nolan 1999;
Haider-Markel 2002; Walker 1995).
The consequences of non-reporting are the same for any mechanism. It makes it more
difficult for researchers to discover trends in data if the data is not accurate, and it obscures
potential trends of institutionalized racism among police agencies. Some may ask why is
prioritizing resources bad? Prioritizing is not inherently good or bad. Prioritizing is bad when
those decisions result in further victimization of minority groups. Prioritizing other things before
hate crime reporting is akin to saying hate crimes are not important. Saying hate crimes are not
important is a clear message to minorities that their lives do not matter (The Associated Press
2016). Still, some may ask how is this racism? It is racism because when one deems that
minority lives are not important, that inherently means white lives are important. It means they
are worth more, and that is racism.

Van De Hey 27
Chapter 4: Research Design
4.1 Overview
Background on Hate Crime Data
One of the most challenging aspects of this project was finding reliable hate crime data.
There are many private, independent organizations that track and analyze hate crimes ("Southern
Poverty Law Center"; "Hate Monitor Center"; "Muslim Advocates”). Most of these
organizations provide qualitative data about a single victimized group. This qualitative data can
come in the form of incident maps or articles. They tend to use different definitions of what
constitutes a hate crime and, largely, do not divulge whether these crimes have been confirmed
as hate crimes by the police. That is not to say that these organizations are not necessary or
important for the safety and protection of our most marginalized groups; it is simply saying that
these data are not the best for statistical research.
In 1990, the Hate Crime Statistics Act was passed, which required the Attorney General
to include hate crimes in the annual Uniform Crime Reports produced by the FBI (Kennelly
1989). This act was amended in 1994, and then again in 2009 with The Matthew Shepard and
James Byrd, Jr., Hate Crimes Prevention Act of 2009, which allowed the Justice Department to
aid with state and local investigations of hate crimes, providing additional resources to carry out
hate crime investigations, and expanded what types of hate crimes were tracked (King 2007;
"The Matthew Shepard And James Byrd, Jr., Hate Crimes Prevention Act Of 2009"). In theory,
this is a very important and useful mandate. In practice, it leaves much to be desired.
There are four main issues preventing this mandate from success. First, while federal hate
crime laws are in place, states vary in the comprehensiveness of their hate crime legislation
("#50StatesAgainstHate: An Initiative for Stronger Hate Crime Laws"). The lack of uniform

Van De Hey 28
policy on hate crimes between states and the federal government creates confusion at the local
levels. Five states—Arkansas, Georgia, Indiana, South Carolina, and Wyoming—do not even
have hate crime legislation at the state or local levels ("#50StatesAgainstHate: An Initiative for
Stronger Hate Crime Laws").
The second reason is underreporting, or even misreporting of hate crimes. Officers
dealing directly with the incident must determine whether a biased crime occurred. Then, if bias
is suspected, a more qualified officer confirms or rejects the initial officer’s assessment of bias
(Law Enforcement Support Section (LESS), and Crime Statistics Management Unit (CSMU)).
Hate crimes are severely underreported. The process above gives a clue as to why. Misreporting
hate crimes, or leaving out certain details in reports that lead to the rejection of bias are both
ways hate crimes continue to be underreported. Hate crimes are not an entirely new category of
crime, but rather a traditional crime motivated by the offender’s bias. It was not made into its
own category to avoid placing new reporting burdens on law enforcement agencies (Law
Enforcement Support Section (LESS), and Crime Statistics Management Unit (CSMU)). While
the Attorney General is mandated to track hate crime statistics, that mandate does not require
states to submit their data to the FBI (King 2007). This is different than the first point because
state that do or do not have comprehensive hate crime legislation equally do not have to report
their data to the FBI. Simply put, the third obstacle is non-reporting by states.
The fourth barrier to complete and accurate hate crime data is the non-reporting of hate
crimes by victims. Certain situations or environments, such as fear and intimidation, prevent or
deter victims from seeking legal help, which also contributes to the underreporting of hate
crimes. In 2003, the National Crime Victimization Survey (NCVS) by the Bureau of Justice
Statistics (BJS) attempted to take a different approach to hate crime reporting. It uses the same

Van De Hey 29
definition of hate crime that was passed in the Hate Crime Statistics Act, though it asks victims if
they believe the crime committed against them was motivated by bias instead of relying on
police reporting (Kennelly 1989; Hate Crime Victimization, 2004-2012 - Statistical Tables).
Many view this new reporting method as more accurately reflecting the actual number of
hate crimes committed in the U.S each year (Middlebrook 2017). For instance, there were
293,800 hate crimes reported by the NCVS in 2012, but only 5,796 reported by the FBI’s UCR
(Hate Crime Victimization, 2004-2012 - Statistical Tables; FBI). The survey estimates that in
2012, about 60% of the hate crimes reported in the survey were not reported to the police. Still,
that means that 40% of those almost 300,000 hate crimes—about 117,520—were reported to
police. Out of approximately 117,520 hate crimes that were reported to the police, only 5,796
hate crimes were published by the FBI. That is just under five percent. Five percent of hate
crimes that were reported to police in 2012 made it into the final published report. While it
would be very difficult to change the amount of hate crimes not reported to police, it would be
much easier to take measures to increase that 5% statistic. I will discuss these proposed measures
later in this paper, but suffice to say that 5% is unacceptable.
The hate crime data I used for this paper was from the FBI’s UCR data. The NCVS,
arguably a more accurate estimate of hate crimes in the U.S., contains voluntary response bias,
and does not cover all states. Many of the other private organizations tracking hate crimes do not
have reliable, systematic data. Initially, I attempted to look at the relationship between hate
crimes reported in 2015 and Trump support (“Table 13 […]”). I was unable to complete this
analysis with any confidence because of missing data. Counties either submitted data to the FBI
for all quarters, some quarters, or did not submit anything at all. The data tables from the FBI are
recorded by city, county, and agency (“Table 13[…]”; “Table 14 […]”). In the dataset that

Van De Hey 30
contains data for zero hate crimes committed (“Table 14 […]”), there were 1,948 cities, counties,
and agencies that did not report data for one to three quarters. In this table, there were a total of
3,007 quarters of non-reported data. The counties, cities, and agencies that did not participate—
no data submitted—are not present on any of the tables published by the FBI. After all of the
cities were placed into counties, and the missing counties were identified, there were a total of
3,384 quarters that had no reported data. In 2015, 2,318 counties either reported zero hate crimes
or did not report hate crimes, and 768 counties did not report anything. How I transformed the
FBI’s data into my dataset is in the “Independent Variables” section.
Areas not Included in this Dataset
The results concluded in this paper are taken from an original dataset that includes every
county in the United States, except Kalawao, Hawaii, and the state of Alaska. Kalawao, Hawaii
is not included because it is a partial county that has census information, but votes with Maui
County ("Office of the County Clerk | Maui County, HI."; "§326-34 County of Kalawao;
Governance."). Alaska is not included in this analysis because their voting areas, known as State
House Districts, and census areas, are not the same, and are not easily combined ("Overview of
Alaska (State)").
4.2 Dependent Variable: Trump Support
Trump support is the dependent variable. It is measured by Trump’s vote share by county
in the 2016 general presidential election (Presidential Election Results: Donald J. Trump Wins
2016; Leip). This data was gathered when the election results were unofficial, so there may be
Van De Hey 31
slight differences between this data and the official data published by each state’s secretary of
state.
4.3 Independent Variables
The independent variables all stem from the FBI’s 2015 hate crime data, specifically
Tables 13 and 14, which are hate crimes reported and zero hate crimes reported, respectively
(“Table 13[…]”; “Table 14[…]”).
Hate Reported
This data was taken from Table 13 (“Table 13[…]”). Since the FBI records the hate
crimes by city, county, and different agencies, the cities and applicable agencies had to be placed
into their corresponding counties so the unit of measure between hate crimes and Trump support
agreed. If a city resided in more than one county, it was coded for multiple county and placed in
the county that contained most of the city’s geographic area. If the city was evenly split between
counties, then it was coded for multiple county and placed in one of the counties by alphabetical
order.
Hate Not Reported
Hate Not Reported was created from the absence of data in Table 14 (“Table 14 […]”).
First, cities and counties with missing data were identified. Then they were coded by
completeness of their data—if they had incomplete data, and then how many quarters were
missing data from non-reporting. Second, the list of counties in Table 14 was checked against the
list of all counties in the U.S. Those counties that did not submit any data and were not in any of
Van De Hey 32
the FBI’s tables were coded as incomplete data, and then as missing 4 quarters of data. If a city
submitted hate crime data but its county did not, then the county’s number of quarters not
reported was noted, but it was included in the “reported” category. Hate Not Reported was coded
as 0 for “reported” data and 1 for “not reported” data. In the dataset, 768 counties were coded for
1 as “not reported.”
Hate Not Reported or Zero
This is the same variable as Hate Not Reported, but it also contains counties that reported
no hate crimes in their area. “Reported” hate crimes here are nonzero numbers taken from Table
13, and they are coded as 0 (“Table 13 […]”). Hate Not Reported or Zero includes “not
reported” from the Hate Not Reported variable, but also adds counties that reported zero hate
crimes in their area; these counties were coded as 1, and there were 2,318 of them in 2015.
Hate Not Reported or Zero was included in the analysis because zeros should be
questioned (Nolan 1999). In 2015, Mississippi reported zero hate crimes. Very few counties in
Mississippi reported data (3/82 counties), but when counties reported at all, they only reported
zero hate crimes. Likewise, Alabama only had six counties report hate crime data, totaling ten
hate crimes for 2015, but out of those six counties, three of them were zeros (2015 Hate Crime
Statistics). Compare these meager numbers with New Jersey, which reported 330 hate crimes in
2015, or California, which reported 837 (2015 Hate Crime Statistics). In states with histories of
racial violence, it is very difficult to take these zeros at face value.

Van De Hey 33
Magnitude of Hate
Since the zeros were taken out of the Hate Reported variable and run with the Hate Not
Reported or Zero variable, the Hate Reported variable was run without zeros—called Magnitude
of Hate. Though underreporting is still a large issue in any measure of hate crime, the Magnitude
of Hate is meant to correct for some of the questionable zeros.
4.4 Control Variables
County Capacity: Dollars Per Person
This data was taken from the IRS County Tax Data from 2014 (Wong). For the main
measure of county capacity, the amount of total tax payments by county was taken from the IRS
tax data and divided by the 2015 population by county, which was taken from the ACS 2015 5-
year estimates (Wong, Data Access and Dissemination Systems (DADS)). Measures of county
capacity are crucial control variables for this analysis because it helps to answer the question of
whether counties do not have the resources to gather and submit hate crime data, or if they do
have the resources and simply do not care. The other measures of county capacity detailed in the
appendix tables are gross amount (the untransformed data from IRS county tax data), and the
natural log of the gross amount.
% White, not Latino
This data was taken from the 2015 ACS 5-year estimates, and then divided by total
population by county, and multiplied by 100 (Data Access and Dissemination Systems (DADS)).
Other measures of race and foreign born are detailed in the appendix, but they were all taken
from the ACS 5-year estimates and follow the same transformation procedure as % White, not

Van De Hey 34
Latino. This is used because it is reasonable to assume that the racial composition of a county—
particularly the white population—might be connected to Trump support and/ or hate crimes in a
given county.
Median Household Income
Median household income is measured in dollars, and is taken from the 2015 ACS 5-year
estimates. It is not transformed (Data Access and Dissemination Systems (DADS)). Income is
included in this analysis as a control because there is controversy over whether Trump voters are
wealthy or poor, and it is not well known if income of a county correlates with hate crimes
(Casselman 2017; Cerrato 2016; Collingwood 2016; "Kaiser Family Foundation/CNN Working-
Class Whites Poll." 2016; Thompson 2016; Yanagizawa-Drott 2016).
Percent Bachelor’s Degree or Higher
Whether voters had bachelor’s degree or higher was taken from the 2015 ACS 5-year
estimates, but was transformed into Percent Bachelor’s Degree or Higher by dividing by the
total population by county and multiplying by 100 (Data Access and Dissemination Systems
(DADS)). Bachelor’s degree or higher is included as a control because Trump supporters are
known to be less educated than other voters, and its inclusion in this analysis will determine
whether this holds for counties.

Van De Hey 35
4.5 Descriptive Statistics and Difference in Means Test
Consistent with my hypothesis, both Hate Not Reported and Hate Not Reported or Zero
have a statistically significant lower Trump mean vote share than their respective Hate Reported
categories.
Trump Support (% Vote Share)
Mean Difference from Reported Hate Crimes
Standard Error of Difference
P-Value T-Score
Hate Not Reported -1.878 0.6556 0.0042 -2.864
Hate Not Reported or Zero -11.69 0.6101 0.0000 -19.16
Table 1: Two-sample T test with Equal Variance
Note: When Hate Not Reported = 0, hate crimes are reported (including a reporting of zero hate crimes). When Hate Not Reported = 1, hate crimes are not reported. When Hate Not Reported or Zero = 0, hate crimes are reported (not including a reporting of zero hate crimes). When Hate Not Reported or Zero =1, hate crimes are not reported. A negative difference of means signifies a higher Trump support in counties not reporting hate crimes to the FBI. Source: An original dataset. Trump support data comes from The New York Times election map and Dave Leip’s Atlas of U.S. Presidential Elections (Leip; "Presidential Election Results: Donald J. Trump Wins"). The Hate Not Reported and Hate Not Reported or Zero variables were created using data from the FBI’s UCR data ("Table 14: Hate Crime Zero Data Submitted per Quarter by State and Agency, 2015").

Van De Hey 36
Chapter 5: Multivariate Empirical Analysis 5.1 Overview This multivariate empirical analysis includes four models. All models use the same
dependent variable: Trump support—vote share of Trump support in the 2016 presidential
election. Model 1 contains a regression of the dependent variable Trump Support, and the control
variables that will remain constant across all models—% White, not Latino, Median Household
Income in dollars, and % BA or higher (Table 2). All of the control variables in Model 1 were
taken from the 2015 ACS 5-year estimates. Model 1 acts as the foundation for all models
because it contains the independent variables that are most commonly associated with Trump
support.
Model 2 contains the independent variable of interest, Hate Not Reported, and the same
controls as Model 1 (% White, not Latino, Median Household Income, and % BA or higher), in
addition to county capacity measured by $ Per Capita—total IRS tax receipts divided by ACS
2015 population. County capacity is included in all models except Model 1 to better understand
the question—do counties fail to report because of lack of resources, or because they do not
care?
Model 3 and Model 4 attempt to control for the ambiguity that results from a reporting of
zero hate crimes by counties. Zeros are ambiguous because they can indicate that a county did
not have any hate crimes during that year, or that they did, but for whatever reason still
submitted a report indicating there were zero hate crimes. Model 3 measures Hate Not Reported
or Zero, which groups counties that did not report hate crimes to the FBI in 2015 with counties
that reported zero hate crimes to the FBI in 2015 (“Table 14 […]”). Model 3 uses the same

Van De Hey 37
control variables that are present in Model 2—county capacity ($ Per Capita), % White, not
Latino, Median Household Income, and % BA or higher.
Model 4 measures Magnitude of Hate (H>0), which uses reported hate crimes by county
in 2015, though it excludes the counties that reported zero hate crimes (“Table 13 […]”; “Table
14 […]”). Model 4 uses the same control variables that are present in both Models 2 & 3—
county capacity ($ Per Capita), % White, not Latino, Median Household Income, and % BA or
higher.
5.2 Effect of Trump Support on Demographics, Income, and Education (Model 1)
My dependent variable is Trump support measured by vote share in the 2016 general
election by county and it is used with all statistical models. Model 1 runs Trump support against
% White, not Latino, Median Household Income, and % BA or higher (Table 2). Model 1 shows
statistically significant positive correlations at the 99.9% confidence level between Trump
support and both % White, not Latino and Median Household Income, and a statistically
significant negative correlation at the 99.9% confidence level between Trump support and % BA
or higher. The positive correlations with demographics and income show that counties that had
high Trump support also had higher white (% White, not Latino) and wealthy (Median
Household Income) populations than counties with lower Trump support. Education shows that
counties with higher Trump support had less educated (% BA or higher) populations then
counties with lower Trump support. Trump catered his campaign to white, less educated
populations, and both the literature and the results of Model 1 confirm this. The positive
correlation seen with Median Household Income may seem counterintuitive at first, but what

Van De Hey 38
must be understood is that while people in these areas may be economically anxious, they are not
undergoing economic hardship (Casselman 2017; Silver 2016; “Kaiser […]” 2016).
5.3 Effect of Trump Support on Hate Not Reported (Model 2)
Model 2 contains the independent variable of interest—Hate Not Reported. Hate Not
Reported is the non-reporting of hate crimes that are derived from the FBI’s Uniform Crime
Reporting (UCR) for 2015 by county (“Table 14 […]”). Model 2 maintains the controls present
in Model 1—% White, not Latino, Median Household Income, and % BA or higher—but also
controls for county capacity by $ Per Capita. Hate Not Reported, % White, not Latino, and
Median Household Income have a statistically significant positive correlation with Trump
support at the 99.9% confidence level (Table 2). County capacity ($ Per Capita) also has a
statistically significant positive correlation with Trump support, but at the 95% confidence level,
while % BA or higher has a statistically significant negative correlation with Trump support at
the 99.9% confidence level (Table 2). % White, not Latino, Median Household Income, and %
BA or higher remained very consistent between Models 1 and 2.
I found that counties that did not report hate crimes had significantly higher levels of
Trump support than those counties that did report hate crimes. These conclusions hold at the
99.9% confidence level even when controlling for county capacity, percent white, median
household income, and education (Table 2).
5.4 Effects of Trump Support on Hate Not Reported or Zero (Model 3)
Model 3 measures Hate Not Reported or Zero, which groups counties that did not report
hate crimes to the FBI in 2015 with counties that reported zero hate crimes to the FBI in 2015

Van De Hey 39
(“Table 14 […]”). Model 3 uses the same control variables that are present in Model 2—county
capacity ($ Per Capita), % White, not Latino, Median Household Income, and % BA or higher.
There are statistically significant positive correlations between Trump support and Hate Not
Reported or Zero, county capacity ($ Per Capita), % White, not Latino, and Median Household
Income all at the 99.9% confidence level, while % BA or higher has a statistically significant
negative correlation with Trump support at the 99.9% confidence level (Table 2). These results
are very similar to both Models 1 and 2.
I found that counties that did not report hate crimes or reported zero hate crimes had
significantly higher levels of Trump support than those counties that did report hate crimes.
These conclusions hold at the 99.9% confidence level even when controlling for county capacity,
percent white, median household income, and education (Table 2).
5.5 Effects of Trump Support on Magnitude of Hate (Model 4)
Model 4 measures Magnitude of Hate (H>0), which uses reported hate crimes by county
in 2015, though it excludes the counties that reported zero hate crimes (“Table 13 […]”; “Table
14 […]”). Model 4 uses the same control variables that are present in both Models 2 & 3—
county capacity ($ Per Capita), % White, not Latino, Median Household Income, and % BA or
higher. This model is best compared to Hate Reported in either Appendix tables 1 or 3. There is
a statistically significant negative correlation between Trump Support and Magnitude of Hate at
the 99% confidence level, which is in line with the regression using Hate Reported as the
primary independent variable, though it is both less negative and less significant. In this way, it
mirrors the relationship between Hate Not Reported and Hate Not Reported or Zero. When the
zeros are added to Hate Not Reported, it becomes more positive and more significant, just as

Van De Hey 40
taking zeros out of Hate Reported causes Magnitude of Hate to become less negative and less
significant. The Magnitude of Hate (H>0) conclusions hold even when controlling for county
capacity, percent white, median household income, and education (Table 2).
The control variables maintain the same trends as in all the other models and with that of
Hate Reported (A1 & A13): positive correlation between Trump support and county capacity ($
Per Capita), % White, not Latino, and Median Household Income, while negative with % BA or
higher. County capacity ($ Per Capita) is positive, though less so than with Hate Reported, and
less significant as well. It is important to note that while the signs of the correlation change
between the reported variables (Hate Reported and Magnitude of Hate) and the non-reported
variables (Hate Not Reported and Hate Not Reported or Zero), county capacity ($ Per Capita)
remains positive and significant for all Models. This gives further evidence that counties do have
the financial resources to track hate crimes, and that the reason more are not recorded is that, for
one reason or another, counties do not care about reporting hate crimes.
5.6 Robustness Check for County Capacity
Appendix tables 1 and 2 (A1-A12) check Model 2-4’s robustness by using different
measures of county-level capacity. Table 2 uses county-level capacity measured by total IRS tax
receipts (2014) divided by ACS 2015 population. This is the best measure of county capacity
because it transforms this variable into a more manageable number and puts it in context of
money per capita. It was chosen as the main measure of county-level capacity for these reasons.
The second measure of county-level capacity is the Gross Amount (total) in dollars taken directly
from the 2014 IRS tax data by county. The third measure is the Natural log of [the] Gross
Amount.
Van De Hey 41
Since the county capacity per capita was discussed previously, A1, A4, A7, and A10 will
not be discussed. The correlations between Trump support and both Hate Reported and
Magnitude of Hate remained negative using the Gross Amount (A2 and A11), though they are
less negative than their counterparts using the per capita ($ Per Capita) variable. Neither are
significant. Hate Not Reported and Hate Not Reported or Zero both remained positive,
significant at the 99.9% confidence level, and remained very close to the values using the per
capita variable (A5 and A8).
The regressions using the Natural log of Gross Amount are very similar to the regressions
using the Gross Amount. The correlations between Trump Support and both Hate Reported and
Magnitude of Hate remained negative, though less so than their regressions using both Gross
Amount and Per Capita (A3 and A12); both remain statistically insignificant. Hate Not Reported
and Hate Not Reported or Zero both remained positive and significant at the 99.9% confidence
level (A6 and A9). Hate Not Reported shifted in value more than Hate Not Reported or Zero,
which remained nearly identical to its previous values.
5.7 Robustness Check for Demographics
Appendix Tables 2 and 3 (A13-A24) check Model 2-4’s robustness by using different
measures of demographics. Table 2 uses % White, not Latino as the measure of demographics to
hold constant because the white population was the most important racial group in electing
Trump. Demographics are measured two other ways: % African American, % Asian, and %
Latino in a county, and the percent foreign-born in a county. These measurements are all taken
from the ACS 2015 5-year estimates and then divided by population and turned into a percent.

Van De Hey 42
The percentage of the foreign-born population (% Foreign-born) was determined in the same
way as each of the other demographic percentages.
Since the % White, not Latino regressions were discussed earlier, A13, A16, A19, A22
will not be discussed. The regressions using these three main racial groups are important
controls, especially considering Trump’s rhetoric towards minorities. The correlations between
Trump Support and both Hate Reported and Magnitude of Hate remained negative when
controlling for % African American, % Asian, and % Latino, though became less significant
(A14 and A23). Hate Not Reported and Hate Not Reported or Zero both remained positive and
significant at the 99% and 99.9% confidence levels, respectively (A17 and A20).
The regressions using the percentage of foreign-born are necessary because of Trump’s
anti-immigration rhetoric. The correlations between Trump Support and both Hate Reported and
Magnitude of Hate remained negative when controlling for % African American, % Asian, and
% Latino, though Hate Reported became more negative and significant, while Magnitude of
Hate became more positive and less significant (A15, A 24). Hate Not Reported or Zero became
marginally more positive and maintained its significance at the 99.9% confidence level (A18).
Hate Not Reported changed in sign from positive to negative and became significant at the 95%
confidence level.
Though the main purpose of these tests of robustness is to determine whether the variable
of interest remained stable in value and significance using different control variables, it is
interesting to note that the percent of foreign-born population in a county is negatively correlated
with Trump Support. Additionally, controlling for this variable changed the variables of interest
more than any other control in the appendix tables.

Van De Hey 43
5.8 Overall Effects
The variable Hate Reported, and its subsequent regressions, cannot be taken at face-
value because of non-reporting. It is unclear what the trend would be if every county in the
United States submitted complete and accurate hate crime data to the FBI. Because of this, the
question: “Can hate crime predict Trump support?” cannot be answered with any confidence at
this time. Though it is unclear whether hate crime can predict Trump support, it is clear that the
non-reporting of hate crime can predict Trump support.
The models appear very consistent, and the results are robust. Model 2—Hate Not
Reported is positive and significant at the 99.9% confidence level; it is robust for different
measures of county-level capacity and demographics. Model 3—Hate Not Reported and Zero is
positive and significant at the 99.9% confidence level; it is robust for different measures of
county-level capacity, and demographics. Model 4—Magnitude of Hate is negative and
significant at the 99% confidence level; it is robust for different measures of county-level
capacity and demographics.

Van De Hey 44
Table 2: Trump Support Effects on Models
* = p < .05 ** = p < .01 *** = p < .001
Trump Support Model 1 Model 2 Model 3 Model 4 Magnitude of Hate (H>0) -0.0567**
(0.0182) Hate Not Reported or Zero 4.522***
(0.4697)
Hate Not Reported 1.942*** (0.4583)
County Capacity $ Per Capita 0.2590*
(0.1073) 0.2589* (0.1060)
0.5011* (0.2160)
Demographics % White, not Latino 0.5065 ***
(0.0123) 0.5148*** (0.0124)
0.4977*** (0.0122)
0.5208*** (0.0262)
Income Median Household
Income 0.0001*** (2.27E-05)
0.0001*** (2.42E-05)
0.0001*** (2.39E-05)
0.0001*** (4.03E-05)
Education % BA or higher -0.9641***
(0.0301) -0.9715*** (0.0309)
-0.9106*** (0.0314)
-1.037*** (0.0507)
State Fixed Effects i i i i
Note: The dependent variable in all models is Trump Support measured by vote share in the 2016 general presidential election. Regression coefficients are listed with regression standard errors in parentheses. Model 1 contains controls generally thought to be significant for Trump Support. Model 2 is the Hate Not Reported model, which contains the same controls as Model 1 as well as county capacity per capita. Model 3 is Hate Not Reported or Zero, and contains all the same controls as Model 2. Model 4 is the Magnitude of Hate (Hate Reported >0) along with the same controls as Models 2 and 3. Source: Trump support data: Leip & "Presidential Election Results: Donald J. Trump Wins". Magnitude of Hate (H>0), Hate Not Reported and Hate Not Reported or Zero variables derived from Table 14: Hate Crime Zero Data Submitted per Quarter by State and Agency, 2015". County capacity: IRS 2014 tax data; Demographics, Income, and Education are from ACS 5-year estimates.

Van De Hey 45
Chapter 6: Discussion
6.1 Summary of Results
This paper sought to answer the question: Can non-reporting of hate crimes by county
predict Trump support in the 2016 presidential election? In short, the answer was yes. The non-
reporting of hate crimes was statistically significant at the 99.9% confidence level, while
controlling for county capacity, demographics, median household income, and educational
attainment (Model 2). This means there is a strong correlation between counties that had large
amounts of Trump support in 2016, and counties that did not report hate crimes in 2015. The
other Models—1, 3, 4—are present to act as validity checks for the structure of the models.
Model 1 is meant as a check against the current literature. Essentially, does this model
say the same things that other Trump literature says? It does. While Trump support was difficult
to measure using straight demographic data because of conflicting measurements (economic
anxiety versus economic hardship), the model does align with what is commonly thought of as
characteristics of places where Trump did best. Trump did best in areas with a large white
population, higher household income—as mentioned before, economic hardship is different than
economic anxiety—and less educated populations (Casselman 2017; Silver 2016; "Kaiser Family
Foundation/CNN Working-Class Whites Poll." 2016). These are all significant at the 99.9%
confidence level.
Models 3 and 4 are checks against the uncertainty of the zeros in the FBI’s hate crime
data. Model 3 is added to demonstrate the change in significance if the zeros reported to the FBI
are false negatives. Model 4 is similar to Model 3 in that it also assumes the zeros reported to the
FBI are false negatives. Model 3 takes the zeros out of the reported hate crime data and adds
them to the non-reported variable, while Model 4 measures the reported hate crime data without

Van De Hey 46
the reported zeros. Both models performed as expected. Model 3 became a more significant (in
all values) version of Model 2, while Model 4 became a less significant (in magnitude of hate
and county capacity) version of Hate Reported (A1).
6.2 Hate Reported
My original interest in this project began with the question: Can hate crimes predict
Trump support by county? My hypothesis was that there would be a positive correlation between
hate crimes and Trump support by county. The regression between Trump vote share and Hate
Reported did not substantiate this hypothesis (A1). There was a statistically significant negative
correlation between Trump support and hate crimes. However, upon further analysis of the FBI’s
Table 14 (Hate Crime Zero Data Submitted per Quarter by State and Agency), I noticed that
there were quarters of missing data and counties that were not on either table (“Table 13[…]”;
“Table 14 […]”).
Given the significant missing values in the FBI’s data, which is already underreported, I
do not believe this result is valid ("Hate Crime Victimization, 2004-2012 - Statistical Tables.",
FBI). Because of these missing data, I argue that non-reporting of hate crimes by local
governments is a more accurate measure of racism than is the reported hate crimes themselves.
Until there is a standardization of hate crime reporting techniques and policies among all states,
and the requirement that all states submit hate crime reports to the federal government, this data
will not be accurate.

Van De Hey 47
6.3 Academic Implications
This research is unique in a few ways. First, it attempts to add to the fast-growing
literature attempting to explain Trump. I attempt to connect the racial versus economic anxiety
positions and place them in the context of a much larger conversation about minorities,
immigration, party identification, and white racist anxiety. I use the non-reporting of hate crimes
as a proxy for racism or racial anxiety. Additionally, this paper is unique because it proposes a
quantitative measure of racism and attempts to use it to explain voting behavior by county. Most
other measures of racial “anxiety” discussed in the literature review are survey data. They ask
people to gauge their perceptions of themselves in relation to minority groups or other indirect
methods. There is response bias in surveys and no way to determine whether the questions
accurately gauge racial sentiments. My data most resembles Michael Tesler’s (2013) research on
“Old Fashioned Racism” and the Obama administration because he measures racism and its link
to partisanship (Tesler 2013). Unlike Tesler’s work (2013), I am studying Trump and using hate
crime data from every county in the U.S. excluding Alaska. My data is also unique in the realm
of hate crime literature because it is quantitative and attempts to tie the non-reporting of hate
crimes by county to a measure that is not demographic.
With Trump’s election win and the increase in hate crimes, I believe there will be much
more data analyses like this one. It will be crucial in the years to come to determine the effect of
Trump on hate crimes, race relations in the U.S., and the emergence of the American far-right.
To see the effect of Trump on hate crimes in the U.S., there needs to be massive mandatory hate
crime legislation implementation, standardization, and reporting among states. The section that
follows will describe the specific policy implementations states should take to ensure this.

Van De Hey 48
6.4 Policy Proposal and Implications
The policy and academic implications for this paper are mutually reinforcing. Academic
study of hate crimes and larger trends are needed to draw attention to the inconsistent and
lacking hate crime legislation. More confident analyses of hate crime data cannot be performed
without better data, and better data can only be obtained with increased hate crime legislation
and enforcement. The subsections that follow illustrate the main obstacles to proper hate crime
reporting.
(1) Victim Reporting
It was estimated that only about 40% of hate crimes in 2012 were reported to
police ("Hate Crime Victimization, 2004-2012 - Statistical Tables). For the 60% of
crimes that did not get reported to police agencies, the goal should be community
outreach and hate crime education. Victims do not report hate crimes for numerous
reasons, including but not limited to: lack of knowledge of what constitutes a hate crime;
lack of knowledge about victims’ rights or available resources; fear of retaliation; fear of
being re-victimized by law enforcement (Ahearn 2011). With the creation of a hate crime
taskforce, community outreach, and local government elites condemning hate crimes,
victims will be more likely to report their attacks (Ahearn 2011).
(2) Initial Police Responder
Police officers and law enforcement administrators alike need to take part in
mandatory annual training programs. They should also be required to carry a written
definition of what constitutes a hate crime, and the proper procedure for observing and
Van De Hey 49
reporting hate crimes. The creation of national hate crime taskforces would be instrumental
to increase reporting. They would create and lead the annual hate crime training programs
and be an independently functioning body, thereby creating oversight and preventing biased
non-reporting.
(3) Secondary Responder and Determination of Bias
Each possible case of biased crime should be reported directly to the hate crime
taskforce corresponding to that particular precinct. This way trained experts review each case
and make an informed decision of whether bias occurred. Each taskforce is required to stay
in contact with precincts under their purview, and precincts are required to stay in contact
with their respective taskforces. If precincts are noncompliant, then taskforces will record
their noncompliance in a quarterly report that will be sent to their state attorney general as
well as the U.S. attorney general.
(4) Participation in National Hate Crime Reporting
Each state’s attorney general must publish quarterly hate crime reports on their
websites, and send compiled annual reports to the FBI. These steps will only succeed if states
are required to submit annual hate crime reports to the FBI and all states pass comprehensive
hate crime legislation that use the FBI’s definition of hate crime.3 The most important aspect
of this proposal is the creation of hate crime taskforces that have oversight powers. These
3 The FBI’s definition of a hate crime is any “criminal offense against a person or property motivated in whole or in part by an offender’s bias against a race, religion, disability, sexual orientation, ethnicity, gender, or gender identity” (Hate Crimes).

Van De Hey 50
taskforces should have standardized training and personnel should be implemented for a
certain proportion of population—twenty taskforces total, each overseeing ~157 counties and
the municipalities therein. If comprehensive laws are not passed, the implementation of hate
crime taskforces would create a certain measure of accountability among counties and
reporting would increase nonetheless.
6.5 Combating Underlying Racism and Racial Anxiety
Even if hate crime policies are implemented, that will not alter the underlying reasons
people commit hate crimes, or the racist superiority that led to county non-reporting to begin
with. If the basis for my proposed mechanisms are correct, then understanding how to reach the
racially and anxious white population is important. More cultural education in schools that
feature open discussions of race, rather than stifling these discussions in favor of colorblindness
would be a start. Mandatory racial anxiety seminars given at workplaces, or free counseling
sessions that focus on racial anxiety would also be helpful.
More research needs to be done to determine what methods help ease racial anxiety
without fostering more resentment because of those methods. There is going to be no single
answer to this problem. We cannot simply ask people not to be racist; most people’s racism is
subconscious and out of their control. Feelings of racial resentment have been simmering in
white America since the civil rights era and before, but especially since the realignment of 1980,
the events of 2001, and the presidency of Barack Obama. Trump’s rhetoric spoke to this
resentment, and his candidacy has shed light on racial tensions that America has tried to bury for
a generation. Trump is the candidate of white backlash; what we must do now is figure out how
to combat that.

Van De Hey 51
Chapter 7: Racial and Ethnic Politics After Trump
7.1 Predicting the Unpredictable
Trump is an unpredictable president. He continues to flip-flop on policies, and he views
every encounter as an opportunity to “win” at all costs (Brams 2017). Since Trump took office,
he has signed 16 executive orders (Trump). Some of these include rolling back Obamacare,
fulfilling his campaign promise to build a wall along the U.S.-Mexico border, cutting the funding
for sanctuary cities, banning visas for six majority Muslim countries—Iran, Libya, Somalia,
Sudan, Syria, Yemen—and creating a task force to reduce illegal immigration, drug trafficking,
and violent crimes (Trump). The first travel ban was blocked by a federal judge, but the revised
version, which also suspends refugee resettlement, has not been blocked. Trump has also signed
a memorandum banning U.S. funding of international NGO’s that provide abortions (Trump).
Between Trump’s slew of executive orders, memoranda, and filling his cabinet with wealthy
business tycoons who seem to have little to no governmental experience, Trump has proven
himself to be the unconventional and unpredictable candidate (Berman 2017).
While the travel ban and cutting abortion funding have grabbed people’s attention, the
task force to reduce illegal immigration, drug trafficking, and violent crimes is also troubling.
Given Jeff Sessions’s history of blatantly racist, anti-black remarks and his staunch opposition to
both legal and illegal immigration, he is an unsettling choice as Attorney General and does not
bode well for increased hate crime legislation or support (Berman 2017, Farrell 2016).
7.2 Rhetoric
Donald Trump is notorious for his rhetoric—mainly his anti-minority, anti-immigration
rhetoric. However, Trump’s rhetoric represents a break from political correctness that has been

Van De Hey 52
present in political and social culture since the 1970s-1980s. His supporters see him as genuine
and “just telling it like it is,” but the loss of political correctness may have far broader
implications (Farrell 2016). If reports surrounding increased amounts of hate crime following the
election are true, then people who have always been racist, but prevented by social norms from
showing it publicly, have just witnessed the election of a man who has made overtly racist
comments about minorities and surrounded himself with people who are even more racist
(Farrell 2016). The knowledge that their views are more widely shared than they thought before,
or the fact that a political elite, celebrity, and now president seems to share their racist sentiments
could embolden such people to act on their beliefs when they previously would not have.
Can Trump be blamed for this violence? Recent judicial rulings seem to indicate that he
can be. A federal judge in Kentucky recently ruled that Trump’s rhetoric incited violence at one
of his campaign rallies last year, thereby nullifying his first amendment right of free speech
(Blake). A different federal judge from Hawaii recently rejected Trump attorney’s argument that
the travel ban executive order should be considered apart from Trump’s previous comments
regarding the initial purpose of the ban—to target Muslims (Blake). These rulings indicate that
judges and arguably rally goers are taking his words at face value. How many other people are
taking Trump’s rhetoric at face value and internalizing it? I believe proving this last question,
and the extent to which elite rhetoric against minority population(s) influences people’s actions
towards those groups will be of the utmost importance.
It will take years to fully understand the implications of a Trump presidency on the race
relations in the United States, but from what can be seen so far, Trump seems to be keeping his
election promises, and that is bad for racial equality.

Van De Hey 53
Works Cited
"#50StatesAgainstHate: An Initiative for Stronger Hate Crime Laws." Anti-Defamation League. N.p.,
n.d. Web. 12 Mar. 2017. <https://www.adl.org/50statesagainsthate>.
Abrajano, Marisa, and Zoltan Hajnal. White Backlash: Immigration, Race, and American Politics. New
Jersey: Princeton UP, 2015. Print.
Ahearn, Laura. "Why Are Hate Crimes Not Reported in the United States and in Suffolk County?"
Crime Victims Center: Hate Crime Task Force Recommendations. N.p., Apr. 2011. Web. 12
Mar. 2017.
<https://www.bing.com/cr?IG=2C42410E7A98461487941E3B9146FC57&CID=35B3CE935F
BA65F033BFC4D75E8B64BA&rd=1&h=Z-6EEJQL-
w3W5va38fa_zyK3WKola4zxm_uHj3GGYFw&v=1&r=https%3a%2f%2fwww.parentsformeg
anslaw.org%2fpublic%2fCRIMEV_x007E_2.PDF&p=DevEx,5061.1>.
Bartels, Larry. "Analysis | 2016 Was an Ordinary Election, Not a Realignment." The Washington Post.
WP Company, 10 Nov. 2016. Web. 05 Mar. 2017.
Bartels, Larry "Why Are White Men the Soccer Moms of 2016?" Vox. Vox, 20 Sept. 2016. Web. 11
Mar. 2017.
Berman, Russell. "The Donald Trump Cabinet Tracker." The Atlantic. Atlantic Media Company, 02
Mar. 2017. Web. 12 Mar. 2017.
Birnir, Jóhanna Kristín, Christian Davenport, and Erika Forsberg. "Analysis | Is Diversity Inherently
Dangerous?" The Washington Post. WP Company, 16 Dec. 2016. Web. 01 Mar. 2017.
Blake, Aaron. "A Judge Rules Trump May Have Incited Violence ... and Trump Again Has His Own
Mouth to Blame." The Washington Post. WP Company, 02 Apr. 2017. Web. 02 Apr. 2017.

Van De Hey 54
Brams, Steven J. "Is President Trump Irrational — or Just Playing a Different Game than Everyone
Else?" The Washington Post. WP Company, 01 Mar. 2017. Web. 12 Mar. 2017.
Brockway, Mark, David Campbell, and Geoffrey Layman. "Secular Voters Didn’t Turn out for Clinton
the Way White Evangelicals Did for Trump." The Washington Post. WP Company, 18 Nov.
2016. Web. 05 Mar. 2017.
Bustikova, Lenka. "Revenge of the Radical Right." Comparative Political Studies 47.12 (2014): 1738-
765. Web. 01 Mar. 2017.
Casselman, Ben. "Stop Saying Trump's Win Had Nothing To Do With Economics." FiveThirtyEight.
FiveThirtyEight, 09 Jan. 2017. Web. 01 Mar. 2017.
Cerrato, Andrea, Francesco Ruggieri, and Federico Maria Ferrara. "Trump Won in Counties That Lost
Jobs to China and Mexico." The Washington Post. WP Company, 02 Dec. 2016. Web. 01 Mar.
2017.
Collingwood, Loren. "The County-by-county Data on Trump Voters Shows Why He Won." The
Washington Post. WP Company, 19 Nov. 2016. Web. 01 Mar. 2017.
Cramer, Katherine. "Analysis | How Rural Resentment Helps Explain the Surprising Victory of Donald
Trump." The Washington Post. WP Company, 13 Nov. 2016. Web. 05 Mar. 2017.
Data Access and Dissemination Systems (DADS). "American FactFinder - 2015 ACS 5-year
Estimates." American FactFinder. N.p., n.d. Web. 01 Mar. 2017.
Ronald L. Davis and Patrice O’Neill, “The Hate Crimes Reporting Gap: Low Numbers Keep Tensions
High,” The Police Chief 83 (May 2016). Web. 12 Mar. 2017.
Drutman, Lee. "How Race and Identity Became the Central Dividing Line in American Politics." Vox.
Vox, 30 Aug. 2016. Web. 11 Mar. 2017.
FBI. "2012 Hate Crime Statistics Report." FBI. N.p., n.d. Web. 5 Mar. 2017.

Van De Hey 55
Farrell, Henry. "Analysis | Trump’s Election Has Undermined ‘political Correctness.’ That Might
Actually Be a Problem." The Washington Post. WP Company, 19 Nov. 2016. Web. 01 Mar.
2017.
Grattet, Ryken, and Valerie Jenness. "The Reconstitution of Law in Local Settings: Agency Discretion,
Ambiguity, and a Surplus of Law in the Policing of Hate Crime." Law Society Review 39.4
(2005): 893-942. Web. 12 Mar. 2017.
Haider-Markel, Donald P. "Regulating Hate: State and Local Influences on Hate Crime Law
Enforcement." State Politics & Policy Quarterly. Sage Journals, 2002. Web. 12 Mar. 2017.
"Hate Crime Victimization, 2004-2012 - Statistical Tables." Bureau of Justice Statistics (BJS). N.p.,
n.d. Web. 01 Mar. 2017.
"Hate Crimes." FBI. FBI, 17 Feb. 2017. Web. 01 Apr. 2017.
"Hate Monitor Center." Center for the Study of Hate and Extremism. N.p., n.d. Web. 01 Mar. 2017.
Hetherington, Marc, and Drew Engelhardt. "Donald Trump’s Surprising Success with Southern
Evangelicals." The Cook Political Report. N.p., 26 Feb. 2016. Web. 12 Mar. 2017.
"Kaiser Family Foundation/CNN Working-Class Whites Poll." Encyclopedia of Children, Adolescents,
and the Media (n.d.): n. pag. CNN Politics. Kaiser & CNN, Sept. 2016. Web. 10 Mar. 2017.
<http://i2.cdn.turner.com/cnn/2016/images/09/19/kff_cnn_wcw_topline_final.-.day1.pdf>.
Kalkan, Kerem Ozan. "What Differentiates Trump Supporters from Other Republicans?
Ethnocentrism." The Washington Post. WP Company, 28 Feb. 2016. Web. 12 Mar. 2017.
Kennelly, Barbara. "H.R.947 - 101st Congress (1989-1990): Hate Crime Statistics Act." Congress.gov.
N.p., 27 Mar. 1989. Web. 01 Mar. 2017.
King, Ryan D. "The Context of Minority Group Threat: Race, Institutions, and Complying with Hate
Crime Law." Law & Society Review 41.1 (2007): 189-224. Web. 12 Mar. 2017.

Van De Hey 56
Klinkner, Philip A., and Rogers M. Smith. "Trump’s Election Is Actually a Return to Normal Racial
Politics. Here’s Why." The Washington Post. WP Company, 17 Nov. 2016. Web. 05 Mar. 2017.
Law Enforcement Support Section (LESS), and Crime Statistics Management Unit (CSMU). "Hate
Crime Data Collection Guidelines And Training Manual." (n.d.): n. pag. Criminal Justice
Information Services (CJIS) Division Uniform Crime Reporting (UCR) Program. FBI, 27 Feb.
2015. Web. 01 Mar. 2017
Leip, David. "Dave Leip's Atlas of U.S. Presidential Elections." Dave Leip's Atlas of U.S. Presidential
Elections. N.p., n.d. Web. 01 Mar. 2017.
Luttig, Matthew D., Christopher Federico, and Howard Lavine. "We Showed Trump Voters Photos of
Black and White Americans. Here's How It Affected Their Views." The Washington Post. WP
Company, 24 Oct. 2016. Web. 11 Mar. 2017.
Major, B., A. Blodorn, and G. Major Blascovich. "The Threat of Increasing Diversity: Why Many
White Americans Support Trump in the 2016 Presidential Election." Group Processes &
Intergroup Relations (2016): n. pag. SAGE Journals. Web. 5 Mar. 2017.
"The Matthew Shepard And James Byrd, Jr., Hate Crimes Prevention Act Of 2009." The United States
Department of Justice. N.p., n.d. Web. 01 Mar. 2017.
Middlebrook, Hailey. "Hate Crime Tracking: The Fascinating, If Unreliable, History of Hate Crime
Tracking in the US." CNN. Cable News Network, 12 Jan. 2017. Web. 01 Mar. 2017.
"Muslim Advocates." Muslim Advocates. N.p., n.d. Web. 01 Mar. 2017.
Nagler, Jonathan, and Jan E. Leighley. Who Votes Now? Demographics, Issues, Inequality, and
Turnout in the United States. N.p.: Princeton UP, 2013. Print.

Van De Hey 57
Nolan, James J., and Yoshio Akiyama. "An Analysis of Factors That Affect Law Enforcement
Participation in Hate Crime Reporting." Journal of Contemporary Criminal Justice 15.1 (1999):
111-27. Web. 12 Mar. 2017.
"Office of the County Clerk | Maui County, HI." Aloha: Welcome to Maui County. The County of
Maui, Hawaii, n.d. Web. 10 Mar. 2017.
"Overview of Alaska (State)." Statistical Atlas. N.p., 17 Apr. 2015. Web. 10 Mar. 2017.
"Presidential Election Results: Donald J. Trump Wins." The New York Times. The New York Times,
n.d. Web. 01 Mar. 2017.
Rodden, Jonathan. "Analysis | 'Red' America Is an Illusion. Postindustrial Towns Go for
Democrats." The Washington Post. WP Company, 14 Feb. 2017. Web. 01 Mar. 2017.
Rodden, Jonathan. "Analysis | This Is Why Democrats Lose in ‘rural’ Postindustrial America." The
Washington Post. WP Company, 14 Feb. 2017. Web. 01 Mar. 2017.
Rothwell, Jonathan T. "Explaining Nationalist Political Views: The Case of Donald Trump." SSRN.
SSRN, 15 Aug. 2016. Web. 18 Oct. 2016.
Sides, John, ed. The Science of Trump: Explaining the Rise of an Unlikely Candidate. N.p.: Monkey
Cage, 2016. Print.
Silver, Nate. "The Mythology Of Trump's ‘Working Class’ Support." FiveThirtyEight.
FiveThirtyEight, 03 May 2016. Web. 11 Mar. 2017.
"Southern Poverty Law Center." Southern Poverty Law Center. N.p., n.d. Web. 01 Mar. 2017.
Swain, Carol Miller. The New White Nationalism In America: Its Challenge to Integration. Cambridge:
Cambridge UP, 2004. Print.
"Table 13: Hate Crime Incidents per Bias Motivation and Quarter by State and Agency, 2015." FBI.
FBI, 27 Oct. 2016. Web. 01 Mar. 2017.

Van De Hey 58
"Table 14: Hate Crime Zero Data Submitted per Quarter by State and Agency, 2015." FBI. FBI, 27
Oct. 2016. Web. 01 Mar. 2017.
Tesler, Michael. “How Anti-Immigrant Attitudes Are Fueling Support for Donald Trump.”
WashingtonPost.com. The Washington Post, 24 Nov. 2015. Web. 01 Mar. 2017. <
Tesler, Michael. "How Racially Resentful Working-class Whites Fled the Democratic Party - before
Donald Trump." The Washington Post. WP Company, 21 Nov. 2016. Web. 01 Mar. 2017.
Tesler, Michael. "Views about Race Mattered More in Electing Trump than in Electing Obama." The
Washington Post. WP Company, 22 Nov. 2016. Web. 05 Mar. 2017.
Tesler, Michael. "The Return of Old-Fashioned Racism to White Americansâ Partisan Preferences in
the Early Obama Era." The Journal of Politics 75.1 (2013): 110-23. Web.
The Associated Press. "Police Fail to Consistently Report Hate Crime Numbers to FBI, AP
Investigation Finds." OregonLive.com. N.p., 03 June 2016. Web. 12 Mar. 2017.
Thompson, Derek. "Donald Trump and 'Economic Anxiety'." The Atlantic. Atlantic Media Company,
18 Aug. 2016. Web. 01 Mar. 2017.
Trump, Donald J. "Executive Orders." The White House. The United States Government, 30 Jan. 2017.
Web. 12 Mar. 2017.
Trump, Donald J. "Presidential Memorandum Regarding the Mexico City Policy." The White House.
The United States Government, 23 Jan. 2017. Web. 12 Mar. 2017.
"United States Agrees to Comprehensive Settlement with Suffolk County Police Department to
Resolve Investigation of Discriminatory Policing Against Latinos." The United States
Department of Justice. N.p., 03 Dec. 2013. Web. 12 Mar. 2017.
"§326-34 County of Kalawao; Governance." Hawaii State Legislature. N.p., n.d. Web. 10 Mar. 2017.

Van De Hey 59
Walker, Samuel, and Charles M. Katz. "Less than Meets the Eye: Police Department Bias Crime
Units." American Journal of Police 14.1 (1995): 29-48. Web.
Wong, Tom K.
Wolfinger, Raymond E., and Steven J. Rosenstone. Who Votes? New Haven: Yale UP, 1980. Print.
Yanagizawa-Drott, Filipe Campante and David. "Did Declining Social Mobility Cause Trump's Rise?
In a Word, No." Vox. Vox, 09 Dec. 2016. Web. 01 Mar. 2017.
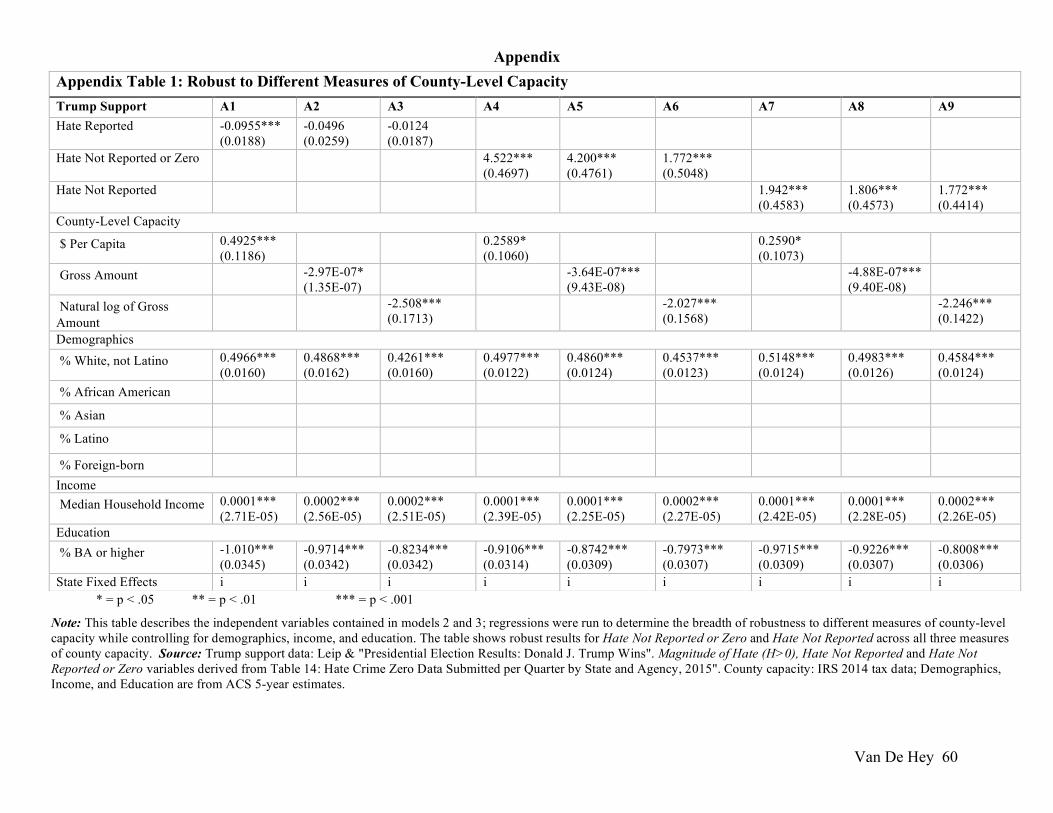
Appendix
Van De Hey 60
* = p < .05 ** = p < .01 *** = p < .001
Appendix Table 1: Robust to Different Measures of County-Level Capacity Trump Support A1 A2 A3 A4 A5 A6 A7 A8 A9 Hate Reported -0.0955***
(0.0188) -0.0496 (0.0259)
-0.0124 (0.0187)
Hate Not Reported or Zero 4.522*** (0.4697)
4.200*** (0.4761)
1.772*** (0.5048)
Hate Not Reported 1.942*** (0.4583)
1.806*** (0.4573)
1.772*** (0.4414)
County-Level Capacity
$ Per Capita 0.4925*** (0.1186)
0.2589* (0.1060)
0.2590* (0.1073)
Gross Amount -2.97E-07* (1.35E-07)
-3.64E-07*** (9.43E-08)
-4.88E-07*** (9.40E-08)
Natural log of Gross Amount
-2.508*** (0.1713)
-2.027*** (0.1568)
-2.246*** (0.1422)
Demographics
% White, not Latino 0.4966*** (0.0160)
0.4868*** (0.0162)
0.4261*** (0.0160)
0.4977*** (0.0122)
0.4860*** (0.0124)
0.4537*** (0.0123)
0.5148*** (0.0124)
0.4983*** (0.0126)
0.4584*** (0.0124)
% African American % Asian % Latino % Foreign-born Income Median Household Income 0.0001***
(2.71E-05) 0.0002*** (2.56E-05)
0.0002*** (2.51E-05)
0.0001*** (2.39E-05)
0.0001*** (2.25E-05)
0.0002*** (2.27E-05)
0.0001*** (2.42E-05)
0.0001*** (2.28E-05)
0.0002*** (2.26E-05)
Education % BA or higher -1.010***
(0.0345) -0.9714*** (0.0342)
-0.8234*** (0.0342)
-0.9106*** (0.0314)
-0.8742*** (0.0309)
-0.7973*** (0.0307)
-0.9715*** (0.0309)
-0.9226*** (0.0307)
-0.8008*** (0.0306)
State Fixed Effects i i i i i i i i i
Note: This table describes the independent variables contained in models 2 and 3; regressions were run to determine the breadth of robustness to different measures of county-level capacity while controlling for demographics, income, and education. The table shows robust results for Hate Not Reported or Zero and Hate Not Reported across all three measures of county capacity. Source: Trump support data: Leip & "Presidential Election Results: Donald J. Trump Wins". Magnitude of Hate (H>0), Hate Not Reported and Hate Not Reported or Zero variables derived from Table 14: Hate Crime Zero Data Submitted per Quarter by State and Agency, 2015". County capacity: IRS 2014 tax data; Demographics, Income, and Education are from ACS 5-year estimates.

Van De Hey 61
* = p < .05 ** = p < .01 *** = p < .001
Appendix Table 2: Robust to Different Measures of County-Level Capacity
Trump Support A10 A11 A12
Magnitude of Hate (H>0) -0.057** -0.0310 -0.0090
(0.0182) (0 .0242) (0.0186)
County-Level Capacity
$ Per Capita
0.5011*
(0.2160)
Gross Amount
-1.64E-07
(1.29E-07)
Natural log of Gross Amount
-2.232***
(0.3218)
Demographics
% White, not Latino
0.5208*** 0.5092*** 0.4508***
(0.0262) (0.0268) (0.0272)
% African American
% Asian
% Latino
% Foreign-born
Income
Median Household Income
1.44E-04*** 1.94E-04*** 2.53E-04***
(4.03E-05) (3.65E-05) (3.63E-05)
Education
% BA or higher
-1.037*** -0.9906*** -0.8653***
(0.0507) (0.0481) (0.0503)
State Fixed Effects i i i
Note: This table describes the independent variable contained in model 4; regressions were run to determine the breadth of robustness to different measures of county-level capacity while controlling for demographics, income, and education. Source: Trump support data: Leip & "Presidential Election Results: Donald J. Trump Wins". Magnitude of Hate (H>0), Hate Not Reported and Hate Not Reported or Zero variables derived from Table 14: Hate Crime Zero Data Submitted per Quarter by State and Agency, 2015". County capacity: IRS 2014 tax data; Demographics, Income, and Education are from ACS 5-year estimates.

Van De Hey 62
* = p < .05 ** = p < .01 *** = p < .001
Appendix Table 3: Robust to Different Measures of Demographics Trump Support A13 A14 A15 A16 A17 A18 A19 A20 A21
Hate Reported -0.0955*** (0.0188)
-0.0638** (0.0193)
-0.1040*** (0.0218)
Hate Not Reported or Zero 4.522*** (0.4697)
4.135*** (0.4756)
4.605*** (0.5659)
Hate Not Reported 1.942*** (0.4583)
1.459** (0.4635)
-1.183* (0.5424)
County-Level Capacity
$ Per Capita 0.4925*** (0.1186)
0.7039*** (0.1183)
0.5164*** (0.1350)
0.2589* (0.1060)
0.4849*** (0.1077)
0.2030 (0.1268)
0.2590* (0.1073)
0.4863*** (0.1088)
0.2162 (0.1280)
Gross Amount
Natural log of Gross Amount
Demographics
% White, not Latino 0.4966*** (0.0160)
0.4977*** (0.0122)
0.5148*** (0.0124)
% African American -0.4957*** (0.0186)
-0.4766*** (0.0141)
-0.4867*** (0.0144)
% Asian -1.118*** (0.1194)
-1.037*** (0.0937)
-1.156*** (0.0938)
% Latino -0.2255*** (0.0163)
-0.2451*** (0.0147)
-0.2480 *** (0.0149)
% Foreign-born -0.7348*** (0.0480)
-0.7275*** (0.0452)
-0.8043*** (0.0451)
Income
Median Household Income 0.0001*** (2.71E-05)
0.0001*** (2.72E-05)
0.0003*** (3.06E-05)
0.0001*** (2.39E-05)
0.0002*** (2.45E-05)
0.0004*** (2.76E-05)
0.0001*** (2.42E-05)
0.0002*** (2.48E-05)
0.0004*** (2.80E-05)
Education
% BA or higher -1.010*** (0.0345)
-0.9981*** (0.0362)
-1.050*** (0.0391)
-0.9106*** (0.0314)
-0.9094*** (0.0328)
-1.001*** (0.0372)
-0.9715*** (0.0309)
-0.9569*** (0.0326)
-1.072*** (0.0367)
State Fixed Effects i i i i i i i i i
Note: This table describes the independent variables contained in models 2 and 3; regressions were run to determine the breadth of robustness to different measures of demographics while controlling for county capacity, income, and education. The table shows robust results for Hate Not Reported or Zero and Hate Not Reported. Source: Trump support data: Leip & "Presidential Election Results: Donald J. Trump Wins". Magnitude of Hate (H>0), Hate Not Reported and Hate Not Reported or Zero variables derived from Table 14: Hate Crime Zero Data Submitted per Quarter by State and Agency, 2015". County capacity: IRS 2014 tax data; Demographics, Income, and Education are from ACS 5-year estimates.

Van De Hey 63
* = p < .05 ** = p < .01 *** = p < .001
Appendix Table 4: Robust to Different Measures of Demographics
Trump Support A22 A23 A24
Magnitude of Hate (H>0) -0.057** -0.0408* -0.0390
(0.0182) (0.0177) (0.0200)
County-Level Capacity
$ Per Capita
0.5011* (0.2160)
0.6184** (0.2051)
0.6381** (0.2329)
Gross Amount
Natural log of Gross Amount
Demographics
% White, not Latino
0.5208*** (0.0262)
% African American
-0.4783*** (0.0295)
% Asian
-0.6710*** (0.1264)
% Latino
-0.3517*** (0.0264)
% Foreign-born
-0.9204*** (0.0596)
Income
Median Household Income
0.0001*** 0.0002*** 0.0003***
(4.03E-05) (3.99E-05) (4.33E-05)
Education
% BA or higher
-1.037*** -1.069*** -1.089***
(0.0507) (0.0504) (0.0542)
State Fixed Effects i i i
Note: This table describes the independent variable contained in model 4; regressions were run to determine the breadth of robustness to different measures of demographics while controlling for county-level capacity, income, and education. Source: Trump support data: Leip & "Presidential Election Results: Donald J. Trump Wins". Magnitude of Hate (H>0), Hate Not Reported and Hate Not Reported or Zero variables derived from Table 14: Hate Crime Zero Data Submitted per Quarter by State and Agency, 2015". County capacity: IRS 2014 tax data; Demographics, Income, and Education are from ACS 5-year estimates.
Recommended