David Moret FernándezDavid Moret Fernández
Efectos del laboreo sobre las propiedades
hidrofísicas y balance hídrico del suelo
durante el periodo de barbecho de una rotación
cebada-barbecho en condiciones de secano
semiárido del centro de Aragón
TESIS DOCTORALTESIS DOCTORAL
Zaragoza 2004Zaragoza 2004
David
Moret
Fernández
20
04
Tesis
Docto
ral

Consejo Superior de Investigaciones Científicas
Universidad de Lleida
TESIS DOCTORAL
Efectos del laboreo sobre las propiedades hidrofísicas y
balance hídrico del suelo durante el periodo de barbecho de
una rotación cebada-barbecho en condiciones de secano
semiárido del centro de Aragón
Estación Experimental de Aula Dei
Departamento de Edafología
David Moret Fernández
Zaragoza 2004

Este trabajo de investigación ha sido realizado gracias a una beca del Plan
Nacional de Formación de Personal Investigador (Ministerio de Ciencia y
Tecnología) adscrita al Proyecto de Investigación AGF98-0261-CO2-02.

José Luís Arrúe Ugarte, Investigador Científico del Consejo Superior de
Investigaciones Científicas (CSIC) en la Estación Experimental de Aula Dei
(EEAD),
CERTIFICA:
Que Don David Moret Fernández ha realizado bajo mi dirección el trabajo
que, para optar al grado de Doctor Ingeniero Agrónomo, presenta con el título:
Efectos del laboreo sobre las propiedades hidrofísicas y balance hídrico
del suelo durante el periodo de barbecho de una rotación cebada-
barbecho en condiciones de secano semiárido del centro de Aragón.
Y para que así conste, firmo la presente Certificación en Zaragoza a veinticuatro
de octubre de dos mil tres.


Carlos Cantero Martínez, Profesor Titular de Universidad en la Escuela
Técnica Superior de Ingeniería Agraria de la Universidad de Lleida
CERTIFICA:
Que Don David Moret Fernández ha realizado bajo mi tutela, como ponente
en el Departamento de Producción Vegetal y Ciencias Forestales de la Universidad
de Lleida, el trabajo que, para optar al grado de Doctor Ingeniero Agrónomo,
presenta con el título:
Efectos del laboreo sobre las propiedades hidrofísicas y balance hídrico
del suelo durante el periodo de barbecho de una rotación cebada-
barbecho en condiciones de secano semiárido del centro de Aragón.
Y para que así conste, firmo la presente Certificación en Lleida a veinticuatro de
octubre de dos mil tres.


i
Agradecimientos
Después de cinco años viviendo y trabajando en Zaragoza quiero expresar mi
más sincero agradecimiento a todas aquellas personas que de una manera u otra han
intervenido en la Tesis o con quienes he compartido muy agradables momentos
durante su realización.
En primer lugar, al Dr. José Luis Arrúe Ugarte como director de esta Tesis por
haberme permitido desarrollar las ideas surgidas a lo largo de la misma, así como su
entera disponibilidad y constante ayuda y estímulo.
Agradecer a mis compañeros de grupo de investigación, Ricardo, Mariví, Pepa y
Jorge, por la ayuda siempre disponible en todo momento. Gracias también al resto
de compañeros del Departamento de Edafología, Maribel, Tere López y Tere
Guillamon, Mabel, Ana y Javier con quienes he compartido muy agradables ratos y
unas excelentes costilladas y calçotadas.
A todas las personas de la Estación Experimental de Aula Dei con quienes he
compartido buenos momentos y han ofrecido su ayuda desinteresadamente.
Agradecer en especial al personal de mantenimiento (David, Enrique, Javier,
Manolo y Tomás) por sus consejos prácticos a la hora de desarrollar las ideas
surgidas a lo largo de la Tesis. Al personal de la casa de labor (José Andrés, Adolfo,
Jesús, Miguel Ángel, Fernando y Andrés) por su colaboración en los trabajos de
campo y al personal de administración (Marisa, Mª Pilar, Lola, Gonzalo,
Armando…) por su simpatía siempre presente en todo momento. Agradecer
también a los becarios del centro (Marías, Loreto, Jorge, Raquel, Ana, Sofía…) y
demás personas (Aurora, Piluca, Carmen, Conchita……..) con quienes he
compartido muy agradables ratos durante los cafés.
Agradecer también su compañía y amistad a los becarios del campus de Aula
Dei (Yoli, Santi, Olga, Noe, Pili, entre otros).
A mis compañeros de los sucesivos pisos en los que he estado viviendo durante
mi estancia en Zaragoza (Manu, Houssem, Yoana e Ichie) y en especial a las chicas

ii
de la Casa Rosa (Ana, Viki, Carmen, Mabel, Piasca y Mareke) con quienes sigo
viviendo muy a gusto.
A toda la gente que he ido conociendo durante mi estancia en Zaragoza: la gente
del Comité, los compañeros del MRG, de la Vía, y un sinfín de personas que no
nombro porque la lista sería interminable.
Finalmente, a mi familia por su cariño y su incondicional apoyo durante estos
años.

iii
Resum
L’objectiu del present treball ha estat investigar l’efecte del sistema de conreu i del guaret sobre les propietats hidrofísiques i el balanç d’aigua durant el període de guaret de la rotació cereal-guaret, en un secà semiàrid del centre d’Aragó, din tre d’un experiment a llarg termini. El sòl del camp experimental és franc (Xerollic Calciorthid) i té una profunditat útil de 70 cm. La precipitació mitjana anual és de 390 mm. Es va disposar de tres blocs de parcel· les, una amb conreu continuat (CC) amb ordi, i dues amb rotació ordi-guaret (CF), i es van comparar tres sistemes de conreu (conreu convencional, CT; conreu reduit (RT); i no conreu, NT) durant tres cicles de cultiu i guaret (1999-2000, 2000-2001 i 2001-2002) en ambdós sistemes de cultiu. Durant el període de guaret en CF es van realitzar mesures de densitat aparent (ρb), conductivitat hidràulica (K) y corba de retenció d’aigua al sòl a 2 i 40 cm de profunditat. Per les mesures de K, es va desenvolupar un infiltròmetre de disc que incorpora un sistema de Reflectometria de Domini Temporal (TDR) que permet una lectura automàtica de la infiltració. En el experiment es va utilitzar un sistema experimental de blocs incomplets. En total, durant el guaret de CF es van realitzar quatre mesures de propietat hidrofísiques: abans i després de les operacions primàries de conreu, després del conreu i les primeres pluges, i al final de guaret. El perfil d’humitat del sòl es va mesurar amb la tècnica TDR. Durant els períodes de cultiu es va també determinar la biomassa i el rendiment. Després de 8-10 anys d’assaig, ρb amb NT va ser més gran que l’observada amb CT i RT a 2 cm de profunditat. NT va presentar una més baixa humitat a saturació i aigua disponible per a les plantes, i una més baixa K degut a un menor número de macropors i mesopors. Les operacions primàries de conreu amb CT i RT van reduir la ρb, augmentant la porositat d’aireació i reduint l’aigua disponible per les plantes. Es va observar també una reducció del tamany de por representatiu i un augment del nombre de pors transmissors d’aigua, i per tant una més alta K. Les pluges després de les operacions de conreu van augmentar ρb de CT i RT en la superfície, lo que va reduir la porositat d’aireació i la K, a través de un més baix nombre de pors transmissors d’aigua. Les operacions primàries de conreu van augmentar de manera notable la tassa de evaporació d’aigua del sòl durant les primeres 24 h després del conreu. Les operacions secundàries de conreu van afavorir la conservació de l’aigua del sòl al reduir la tassa de evaporació en relació amb NT. L’eficiència del guaret per l’acumulació d’aigua al sòl (PSE) va ser baixa (11%), augmentant en aquells períodes quan la pluja era important en els últims dos mesos del guaret. El sistema de CF va conservar al final del guaret 22 mm més d’aigua que el sistema CC. Per una altra banda, el sistema de conreu no va tenir cap efecte sobre el PSE. L’aplicació del model de simulació SiSPAT per estimar el balanç d’aigua del període de guaret va permetre observar que, sense operacions de conreu durant el guaret, el sòl amb NT tendeix a evaporar més aigua que amb CT i RT, els quals afavoreixen el drenatge profund. Comparant la PSE mesurada al camp amb l’estimada mitjançant el model, es va observar que en anys amb una primera fase de guaret molt plujosa, les operacions de conreu afavoreixen les pèrdues d’aigua, reduint la PSE. El rendiment de l’ordi va ser més gran en els anys amb més abundants pluges efectives en primavera, essent, en conjunt, un 49% mes gran en CF que en CC. Per una altra banda, CC va tenir un rendiment 34% més gran que CF quan la producció de gra es va ajustar a una base anual considerant la precipitació entre dos collites consecutives i la duració del període de guaret en cada sistema. El sistema de conreu no va tenir cap efecte sobre el rendiment.


iv
Resumen
El objetivo principal del presente trabajo ha sido evaluar el efecto del sistema de laboreo sobre las propiedades hidrofísicas y el balance de agua durante el periodo de barbecho de la rotación cereal-barbecho (cultivo de “año y vez”) en un secano semiárido del centro de Aragón como parte de un experimento de laboreo de larga duración. En el sitio experimental, el suelo, de textura franca (Xerollic Calciorthid), tiene una profundidad útil de 70 cm y la precipitación media anual es de 390 mm. Se dispusieron tres bloques de parcelas, uno con cultivo continuo (CC) de cebada y dos, contiguos a éste, en rotación “año y vez” (CF), y se compararon tres sistemas de laboreo (laboreo convencional, CT; laboreo reducido, RT; y no-laboreo, NT) durante tres ciclos de barbecho y cultivo (1999-2000, 2000-2001 y 2001-2002) en ambos sistemas de cultivo. Durante el periodo de barbecho en CF se efectuaron medidas de densidad aparente (ρb), conductividad hidráulica (K) y curva de retención de agua del suelo a 2 y 40 cm de profundidad. Para la medida de K se desarrolló un infiltrómetro de discos que incorpora un sistema de Reflectometría de Dominio Temporal (TDR) y permite la lectura automática de la infiltración. Las determinaciones, siguiendo un diseño de bloques incompletos, se efectuaron en cuatro momentos del barbecho: antes de labores primarias, inmediatamente después de estas labores, tras las primeras lluvias después de labores y al final del barbecho. El perfil de humedad del suelo (0-70 cm) se monitorizó durante el periodo experimental por TDR. Durante los periodos de cultivo, se determinó la biomasa y el rendimiento. Tras 8-10 años de ensayo, ρb en NT fue mayor que en CT y RT a 2 cm. NT presentó también a esa profundidad una menor humedad a saturación y agua disponible para las plantas, y una menor K debido a un menor número de macroporos y mesoporos. Las labores primarias aplicadas en CT (vertedera) y RT (chisel) redujeron ρb, aumentando la porosidad de aireación y reduciendo el agua disponible para las plantas. También se observó una reducción del tamaño del poro representativo y un aumento del número de poros transmisores de agua, y con ello una K más elevada. Las lluvias tras labores primarias aumentaron ρb en la superficie en CT y RT, lo que redujo la porosidad de aireación y la K, a través de un menor número de poros transmisores de agua. Las labores primarias incrementaron de manera notable la tasa de evaporación durante las primeras 24 horas tras labores. Sin embargo, las labores secundarias favorecieron la conservación del agua del suelo a medio plazo al reducir la tasa de evaporación con relación a NT. La eficiencia del barbecho para acumular agua en el suelo (PSE) fue baja (11 %), siendo mayor en periodos de barbecho con elevada pluviometría en los tres últimos meses del barbecho. Como promedio, el sistema CF almacenó al final del barbecho 22 mm más agua que el sistema CC. Por otro lado, el sistema de laboreo no tuvo efectos significativos sobre la eficiencia del barbecho. La aplicación del modelo SiSPAT para simular el balance de agua durante el barbecho permitió observar que, en ausencia de labores durante el barbecho, el suelo bajo NT tiende a evaporar más agua que en CT y RT, los cuales favorecen el drenaje profundo. Comparando la PSE medida en campo con la estimada por el modelo se observó que en años con una primera fase de barbecho muy lluviosa las labores favorecen las pérdidas de agua por evaporación, reduciéndose la PSE. El rendimiento de cebada fue mayor en años con abundantes lluvias efectivas en primavera, siendo, en conjunto, un 49% mayor en CF que en CC. Sin embargo, CC rindió un 34% más que CF cuando la producción de grano se ajustó a una base anual considerando la precipitación entre dos cosechas consecutivas y la duración del periodo de barbecho en cada sistema. El sistema de laboreo no tuvo ningún efecto significativo sobre el rendimiento.


v
Abstract
The main objectives of this research, as part of long-term tillage experiment, were: i) to evaluate the effects of three fallow tillage management systems (conventional tillage, CT, reduced tillage, RT, and no-tillage, NT) on soil hydrophysical properties and water balance during three long fallow periods (1999-2000, 2000-2001 and 2001-2002) in a dryland cereal-growing area of Central Aragon; and ii) to investigate the influence of those effects on the response of a winter barley crop in terms of growth, yield and water use efficiency. Soil at the research site, with an average annual precipitation of 390 mm, is a loam (fine-loamy, mixed thermic Xerollic Calciorthid). The study was conducted on three adjacent large blocks of plots, one under continuous cropping (CC) and two under a cereal-fallow (CF) rotation. Soil bulk density, ρb, soil water retention curve, θ(ψ), and soil hydraulic conductivity, K(ψ), at –14, -4, -1 and 0 cm pressure head, and related hydraulic parameters were measured at 2 and 40 cm depth before and immediately after primary tillage, after post-tillage rains and at the end of fallow, according to an incomplet block design. An automated tension disc infiltrometer that measures the water level changes in the Mariotte-type supply reservoir via time domain reflectometry (TDR) was developed for measuring K. The soil water profile (0-70 cm) was monitored over the entire experimental period by TDR. During the growing seasons, crop above-ground biomas at different stages and yield were measured. After 8-10 years of trial, and compared with CT and RT, NT plots presented a more compacted topsoil, which resulted in a lower water content at saturation and a lower available water-holding capacity. Although a larger macropore size was observed under NT, K under this treatment was significantly lower than under CT and RT due to a lower number of water transmitting pores per unit area. In the short term, soil loosening by tillage increased the aeration porosity (pores > 300 µm) and decreased available water retention micropores (30-0.2 µm pores). Tillage also increased the number of water conducting mesopores, which increased K. The rainfall after primary tillage under CT and RT, increased the surface ρb, which reduced the aeration porosity and K, though out a decrease of number of water conducting pores. Primary tillage implemented in CT (mouldboard ploughing) and RT (chiselling) plots induced significant E losses from the plough layer for the first 24 h after tillage. However, secondary tillage under CT and RT appeared to have a positive effect on soil water storage (SWS) at the end of fallow. Overall, fallow precipitation storage efficiency (PSE) was low (11% on average) and increased when most of fallow seasonal precipitation occurred in the last three months of the fallow period. Neither SWS nor PSE under CF were significantly affected by the tillage system. The application of the SiSPAT model to simulate the water balance during long fallow allowed to observe that the NT soil tends to evaporate more water than the CT and RT soils. The comparison between measured and estimated SWS at the end of a wet-autumn fallow showed that PSE under CT and RT was about half of the efficiency predicted by the model. On the assumption that soil properties measured under the three tillage treatments do not change over the whole fallow period, the SiSPAT model estimated that about 80% of fallow seasonal precipitation is lost by evaporation in long-fallow periods with both a dry autumn in the first year of fallow and a rainfall above normal in spring. On average, and regardless of tillage, CF yielded 49% more grain than CC. However, CC yielded 34% more grain than the CF rotation when yields were adjusted to an annual basis including the length of fallow. No differences in crop yield were observed among tillage treatments in the study period.

vi
Índice general
Agradecimientos…………………………………………………………………... i
Resum……………………………………………………………………………... iii
Resumen…………………………………………………………….……………... iv
Abstract…………………………………………………………….……………… v
Índice general…………………………………………………………….………... vi
Índice de figuras…………….…………………………………………….……….. x
Índice de tablas…………………………………………………………….……… xv
Lista símbolos y abreviaturas……….…………………………………….……….. xviii
Capítulo 1. Introducción general…...………………………………………….… 1
1. Los secanos semiáridos de la zona centro del valle del Ebro…….. 3
2. Limitaciones de los sistemas tradicionales de cultivo……………. 4
3. Objetivos y estructura del trabajo………………………………… 8
Referencias……………………………………………………….. 10
Capítulo 2. TDR application for automated water level measurement from
mariotte reservoirs in tension disc infiltrometers……………...….....
13
1. Introduction……………………………….……………………… 15
2. Material and methods……………………………….……………. 17
2.1. Theory……………………………………...………….…. 17
2.2. TDR-based water level sensing set-up: probe design and
waveform analysis……………………………….………
18
2.3. Performance and field application…………..………….. 22
3. Results and discussion………………………………….………… 24
4. Conclusions…………………………………………………….… 28
References………………………………………………….…….. 28
Capítulo 3. Limitations of tension disc infiltrometers for measuring water flow
in freshly tilled soils………………………………………………...
31
vii
1. Introduction……………………………………………….……… 33
2. Material and methods………………………………….…………. 34
2.1. Tension infiltration procedures……………..….……… 34
2.2. Field measurements…………………………..………….. 37
3. Results and discussion……………………………...……..……… 38
References………………………………………………….…….. 43
Capítulo 4. Dynamics of soil hydrophysical properties during fallow as affected
by conventional and conservation tillage systems…………………...
45
1. Introduction………………………………………………….…… 48
2. Material and methods………………………………………….…. 51
2.1. Experimental site and procedures……………………….. 51
2.2. Experimental measurements……………………………... 53
2.2.1. Bulk density and moisture content…………………. 54
2.2.2. Soil water retention………………………………… 55
2.2.3. Soil hydraulic properties…………………………… 56
3. Results and discussion……………………………...……..……… 59
3.1. Weather conditions and dynamics of soil water content… 59
3.2. Soil bulk density………………………………………….. 60
3.3. Soil water retention and pore-size distribution………….. 62
3.4 Soil hydraulic properties………………………………… 66
3.4.1. Soil hydraulic conductivity (K) and sorptivity (S)….. 66
3.4.2. K, λψ and Nψ relationships…………………………. 71
3.4.3. Contribution of macropores and mesopores to
water flow………………………………………….
74
3.4.4. Validity of λ∆ψ as a pore index………………... 78
4. Conclusions…………………………………………………….… 79
References………………………………………………………... 81
viii
Capítulo 5. Influence of Fallowing Practices on Soil Water and Precipitation
Storage Efficiency in Semiarid Aragon (NE Spain)…………………
87
1. Introduction……………………………………………….……… 90
2. Material and methods…………………………………….………. 92
2.1. Site, fallow tillage systems and experimental design……. 92
2.2. Field measurements and calculations……………………. 95
2.2.1. Weather…………………………………………… 95
2.2.2. Soil moisture measurements………………………... 95
2.3. Soil water balance and precipitation storage efficiency… 96
3. Results and discussion……………………………...……..……… 97
3.1. Weather conditions………………………………………. 97
3.2. Soil water balance during fallow………………………… 99
3.2.1. Soil water losses……………………………………. 99
3.2.2. Soil water storage and efficiency…………………... 108
4. Conclusions……………………………………….….…………… 113
References……………………………………….…….………….. 115
Capítulo 6. Water Balance Simulation of a Dryland Soil during Fallow under
Conventional and Conservation Tillage in Semiarid Aragón (NE
Spain)………………………………………………………………...
119
1. Introduction………………………………………………………. 122
2. Material and methods…………………………………………….. 123
2.1. Model description………………………………………... 123
2.2. Field data set…………………………………………….. 124
2.2.1. Experimental site and fallow management systems... 124
2.2.2. Climatic variables………………………………….. 125
2.2.3. Soil parameters…………………………………….. 126
2.2.4. Field water balance……………………………….. 130
2.2.5. Modelling strategy…………………………………. 130
3. Results and discussion……………………………...…………….. 133

ix
3.1. Model performance…………………………….………… 133
3.2. Simulation of soil water balance and components during
fallow……………………….…………………………….
139
4. Conclusions……………………………………………………… 146
References……………………………………………………….. 148
Capítulo 7. Winter Barley Performance under different Cropping and Tillage
Systems in Semiarid Aragon (NE Spain)……………………………
151
1. Introduction………………………………………………………. 154
2. Material and methods…………………………………………….. 156
2.1. Site, tillage, crop management and experimental design... 156
2.2. Sampling and measurements…………………………….. 159
2.2.1. Weather…………………………………………….. 159
2.2.2. Soil water content ……………………………………. 159
2.2.3. Crop growth and yield……………………………... 160
2.2.4. Water use and water use efficiency indices………… 161
3. Results and discussion……………………………...…………….. 162
3.1. Seasonal rainfall and soil water storage………………… 162
3.2. Crop performance………………………………………... 164
3.2.1. Crop establishment and growth……………………. 164
3.2.2. Crop yield…………………………………………... 169
3.3. Crop water use…………………………………………… 173
3.3.1. Total water use…………………………………….. 173
3.3.2. Crop transpiration and soil water evaporation……. 175
3.3.3. Quantitative indices of water use and precipitation
use efficiency ………………………...…………….
177
4. Conclusions……………………………………………………… 182
References…………………………………………………………
183
Capítulo 8. Conclusiones generales……………………………………………… 187

x
Índice de figuras
Capítulo 2 2.1. Cross section of a tension disc infiltrometer configured with a TDR probe inside the
water-supply reservoir ………………………..………………………….………….
19
2.2. Comparison of TDR signatures for the three-rod probe developed to measure water level changes in a Mariotte reservoir: (a) probe with uncoated rods and reservoir full of water; (b) probe with rods coated with polyolefin tubing and reservoir empty (I), half-full of water (II) and full of water (III).……………………………………..
21
2.3. Relationship between the water level determined using a TDR probe and a single differential pressure transducer (PT) and the water level determined visually in a Mariotte column 90 cm high under laboratory conditions.……………………..…...
24
2.4. Infiltration test performed with a tension disc infiltrometer on a recently tilled loamy soil at a pressure head, ψ, of 0 cm: (a) cumulative infiltration ( I) determined from TDR, pressure transducer (PT) and visual readings, and time curse of the volumetric water content of soil (θ) measured with a TDR probe horizontally installed under the infiltrometer disc at a depth of 4 cm; (b) soil sorptivity (S) and hydraulic conductivity (K ) estimates from TDR-measured infiltration according to Vandervaere et al. (1997)…………………………………………………………….
26
Capítulo 3
3.1. Schematic diagram of a tension disc infiltrometer with the water supply reservoir and the bubbling tower separated from the infiltrometer disc (Mode 2)……….….…
36
3.2. Relationship between steady-state flow rate (Q) and pressure potential (ψ) obtained on the surface of a loam soil with initial dry bulk density (ρb) values of 1.24 (a), 1.18 (b), and 0.87 g cm-3 (c), by using three tension disc infiltrometers (Mode 1, êê; Mode 2, cc ; and Mode 3, ΟΟ). Bars represent LSD (P < 0.05) for comparison among disc infiltrometers at the same tension and soil condition , where significant differences were found using the Duncan´s multiple range test.…...……………………………………………………………...……….
39
3.3. Cumulative infiltration at saturation (ψ = 0) on a structureless rototilled loam soil measured by using the tension disc infiltrometer shown in Fig. 3.1 with a supporting wire mesh beneath the disc (Mode 3).……………………………………
42
3.4. Soil collapse during (a) and at the end (b) of infiltration at saturation with disc infiltrometer Mode 3 on a structureless soil…………..………………………….
42

xi
Capítulo 4
4.1. a) Timing of rainfall and tillage practices (T, primary tillage; t, secondary tillage) in relation to soil property measurement dates under conventional tillage (CT), reduced tillage (RT) and no-tillage (NT) treatments during three fallow seasons (M, infiltration and bulk density measurements at 2 cm depth; m, ibid. at 40 cm depth; I, infiltration measurements at saturation on surface-crusted soil; R, water retention curve determination at 5 cm depth; r, ibid. at 45cm; *, measurements taken only under CT and RT). b) Time course of volumetric water content in the surface soil (0-20 cm) under CT, RT and NT treatments. Bars represent LSD (P < 0.05) for comparison among tillage treatments where significant differences were found...….
52
4.2. Soil water retention curves for conventional tillage (CT), reduced tillage (RT) and no-tillage (NT) at 5 cm depth on four dates over the 2001-2002 fallow period (Field 2): (a) before primary tillage (pre-tillage); (b) after primary tillage but before any rainfall event (post-tillage); (c) after primary tillage but following a period of intermittent rainfall events (post-tillage+rain); and (d) during the last phase of the fallow period (late fallow). Fitted curves for CT and RT in (b), (c) and (d) plots were obtained using total porosity, ξ, data as soil water content at saturation.…………………………………………………….………………………
63
4.3. Soil hydraulic conductivity (K) versus pressure head (ψ) relationships for conventional tillage (CT), reduced tillage (RT) and no-tillage (NT) at 2 cm depth on four dates over the 1999-2000 (Field 2), 2000-2001 (Field 1) and 2001-2002 (Field 2) fallow periods: (a) before primary tillage (pre-tillage); (b) after primary tillage but before any rainfall event (post-tillage); (c) after primary tillage but following a period of intermittent rainfall events (post-tillage+rain); and (d) during the last phase of the fallow period (late fallow). * Significant difference among tillage treatments at P < 0.05…………………………………………….………………….
67
4.4. Number of effective water transmitting macropores per unit area (Nψ) and representative mean pore radius (λψ) versus soil hydraulic conductivity (K) at 2 cm depth under conventional tillage (CT), reduced tillage (RT) and no-tillage (NT) at four dates over the 2000-2001 (Field 1) and 2001-2002 (Field 2) fallow periods: (a) before primary tillage (pre-tillage); (b) after primary tillage but before any rainfall event (post-tillage); (c) after primary tillage but following a period of intermittent rainfall events (post-tillage+rain); and (d) during the last phase of the fallow period (late fallow). Bars represent LSD (P < 0.05) for comparison among tillage treatments where significant differences were found ………………………………..
72
Capítulo 5
5.1. Soil water content profile measured under conventional tillage (CT), reduced tillage (RT) and no-tillage (NT) treatments before (continuous line) and after (broken line) primary tillage implementation on CT and RT plots in the 1999-2000, 2000-2001 and 2001-2002 fallow periods. Horizontal bars represent LSD (P<0.05) for comparison among tillage treatments, where significant differences were found.…..
102

xii
5.2. Cumulative water loss by evaporation under conventional tillage (CT), reduced tillage (RT) and no-tillage (NT) for the first 24 hours after tillage implementation on CT and RT plots in the 1999-2000, 2000-2001 and 2001-2002 fallow periods: (a) from the 0-40 cm soil layer after primary tillage; and (b) from the 0-20 cm soil layer after secondary tillage. Different letters above bars indicate significant differences at P<0.05.………………………………………………………………..
103
5.3. Soil surface roughness following mouldboard ploughing (a) and chiselling (b) at the experimental site……………………………………………………………………..
103
5.4. Time course of rainfall and volumetric soil water content (θ ) in the plough layer (0-
40 cm depth) under conventional tillage (CT), reduced tillage (RT) and no-tillage (NT) following the implementation of primary tillage (T) on CT and RT plots in the second year of the 1999-2000 (a), 2000-2001 (b) and 2001-2002 (c) fallow periods. Bars represent LSD (P<0.05) for comparison among tillage treatments, where significant differences were found.………………………….………………………
105
5.5. Cumulative water evaporation from the upper 40 cm of soil under conventional tillage (CT), reduced tillage (RT) and no-tillage (NT): (a) for a 23-day period after primary tillage and (b) for a 96-day period after secondary tillage in the 2000-2001 fallow season. T and t indicate primary and secondary tillage dates and; bars represent LSD (P<0.05) for comparison among tillage treatments, where significant differences were found….…………………………………………………………...
106
5.6. (a) Daily precipitation (columns) and reference evapotranspiration (ET0) (continuous line) during the 1999-2000, 2000-2001 and 2001-2002 fallow periods. (b) Time course of water stored in the soil profile (0-70 cm) (SWS) for the same fallow periods under conventional tillage (CT), reduced tillage (RT) and no-tillage (NT) treatments. T and t indicate primary and secondary tillage dates; bars represent LSD (P<0.05) for comparison among tillage treatments, where significant differences were found. SWS values are computed in reference to the start of each fallow period. HF: harvest to late fall; FS: late fall to late spring; SS: late spring to sowing………………………………………………………………………………..
109
5.7. Soil water storage efficiency during the 1999-2000, 2000-2001 and 2001-2002 fallow periods under conventional tillage (CT), reduced tillage (RT) and no-tillage (NT) treatments. Bars represent LSD (P<0.05) for comparison among tillage treatments, where significant differences were found. (The efficiency values are computed in reference to the start of each fallow period)……………………………
111
Capítulo 6
6.1. Time course of the volumetric soil water content (θ ) in the the 0-10 cm, 10-20 cm, 20-40 cm and 40-70 cm layers measured in Field 2 under conventional tillage (CT), reduced tillage (RT) and no-tillage (NT) during the 1999-2000 fallow season from 21 September 1999 to 25 April 2000………………………………………………..
129

xiii
6.2. Simulated (continuous line) and measured (symbols) soil temperature at 6 cm depth in Field 2 under conventional tillage (CT), reduced tillage (RT) and no-tillage (NT) for 7-9 November 1999………………………………………………………………
137
6.3. Comparison of simulated (continuous line) soil volumetric water content (θ) for the 0-40 cm horizon with observations (symbols) from TDR measurements in Field 2 under conventional tillage (CT), reduced tillage (RT) and no-tillage (NT) during the 1999-2000 fallow season from 21 September 1999 to 13 December 2000 (T, primary tillage; t, secondary tillage).………………………………………………...
138
6.4. Comparison of simulated (continuous line) and observed (dotted line) soil heat flux under no-tillage (NT) in Field 2 on 25-27 June 1999……………….……………….
139
6.5. Cumulative precipitation received during the 1999-2000, 2000-2001 and 2001-2002 long-fallow periods and corresponding cumulative water losses from the soil profile (0-70 cm depth) by evaporation and deep drainage predicted by SiSPAT under conventional tillage (CT), reduced tillage (RT) and no-tillage (NT)………………...
140
6.6. Cumulative evaporation measured (symbols) and predicted by SiSPAT (continuous line) under conventional tillage (CT), reduced tillage (RT) and no-tillage (NT) during the 2000-2001 fallow period: (a) from the upper 40 cm of soil following primary tillage (T) and (b) from the upper 10 cm of soil following secondary tillage (t). Bars indicate rainfall events.……………………………….……………………
146
Capítulo 7
7.1. Schematic of dryland cropping systems showing phases, phase length in days (D) and agronomic practices…………………………….……………………….……….
158
7.2. Monthly rainfall for the experimental period (1999-2002) vs. long-term average (1954-2002) (a) and dynamics of soil water content (0-70 cm) for conventional tillage (CT), reduced tillage (RT) and no-tillage (NT) under continuous cropping (b) and crop-fallow rotation (c) and (d). S and H indicate sowing and harvest dates, respectively. Vertical bars indicate LSD (P < 0.05).………………………………...
163
7.3. Soil water (θ) profiles at sowing and harvesting of barley as affected by tillage (CT, conventional tillage; RT, reduced tillage; and NT, no-tillage) under continuous cropping (CC) (left) and crop-fallow rotation (CF) (right) in the 1999-2000, 2000-2001 and 2001-2002 growing seasons. Horizontal bars indicate LSD (P < 0.05)…...
165
7.4. Seasonal changes in total above-ground dry matter and plant available soil water content (PASW) (0-70 cm) as affected by tillage (CT, conventional tillage; RT, reduced tillage; and NT, no-tillage) under continuous cropping (CC) and crop-fallow (CF) rotation during the 1999-2000, 2000-2001 and 2001-2002 growing seasons. Vertical bars indicate LSD (P < 0.05).……………………………..………
167

xiv
7.5. Crop water use (ET) during different phases of barley growth as affected by tillage (CT, conventional tillage; RT, reduced tillage; and NT, no-tillage) under continuous crop (CC) and crop-fallow rotation (CF) and seasonal precipitation during the 1999-2000, 2000-2001 and 2001-2002 growing seasons. ZGS indicates Zadoks growth stages. An asterisk indicates significant differences among tillage treatments at P<0.05 for a given growth phase and crop system.. ………………………………
174
7.6. Water use efficiency for above-ground biomass (WUEb) matter (DM) and grain (WUEg) of barley as affected by tillage (CT, conventional tillage; RT, reduced tillage; and NT, no-tillage) under cropping system (CC, continuous cropping; CF, crop-fallow rotation) in the 1999-2000, 2000-2001 and 2001-2002 growing seasons. Vertical bars indicate LSD (P < 0.05)...……………………………………
178
7.7. Barley yield for the crop-fallow rotation in the 1999-2000, 2000-2001 and 2001-2002 growing seasons versus precipitation storage efficiency (PSE) of long fallow in that cropping system (CT, conventional tillage; RT, reduced tillage; and NT, no-tillage)…………………………………………………………………………….….
181


xv
Índice de tablas
Capítulo 3
3.1. Average values of the piecewise linear slope ( yx,α ) between adjacent (ψ,Q) data
pairs (Fig. 2) and K(ψ)† calculated according to Reynolds and Elrick (1991) for the tension disc infiltrometers and soil conditions used in this study…………………..
40
Capítulo 4
4.1. Average dry bulk density (ρb) and volumetric water content (θ) of the surface soil (2-7 cm) determined on four dates over the three experimental fallow seasons under conventional tillage (CT), reduced tillage (RT) and no-tillage (NT).………………………………………………………………………..………..
61
4.2. Total pore volume and selected pore-size fractions† in the surface soil (2-10 cm depth) estimated from soil water retention curves (Fig. 4.2) at four times during the 2001-2002 fallow period under conventional tillage (CT), reduced tillage (RT) and no-tillage (NT)………………………………………………………………………..
65
4.3. Sorptivity of the soil surface (2 cm) at 0 cm tension measured on three occasions within three experimental fallow seasons under three management treatments (CT, conventional tillage; RT, reduced tillage; NT, no-tillage)..………………………….
70
4.4. Representative pore size, λ∆ψ (mm) and number of λ∆ψ pores per unit of area (pores per m2), N∆ψ, for soil macropores (0<ψ<4 cm)† and mesopores (4<ψ<14 cm)‡ measured at 2 cm depth on four dates during the experimental fallow seasons under different management treatments (CT, conventional tillage; RT, reduced tillage; NT, no-tillage).. …………………………………………………...…………………
75
4.5. Effective porosity (θå) and contribution to flow (ϕ) of soil macropores (0<ψ<4 cm)† and mesopores (4<ψ<14 cm)‡ measured at 2 cm depth on four dates during the experimental fallow seasons under different management treatments (CT, conventional tillage; RT, reduced tillage; NT, no-tillage).…………………………..
76
Capítulo 5
5.1. Starting and ending dates for the experimental fallow periods and sub-periods and timing of tillage practices. ……………………………………...……………………
94
5.2. Monthly rainfall totals during the 1999-2000, 2000-2001 and 2001-2002 long-fallow seasons, with corresponding long-term averages (1954 - 2002), and mean monthly reference evaporation (ET0) for the 1999-2002 period at Peñaflor experimental site...……………………………………………………………………
98

xvi
5.3. Soil water loss (E), soil water storage (SWS) and precipitation storage efficiency (PSE) during specific phases of the 1999-2000, 2000-2001 and 2001-2002 long fallow seasons under conventional tillage (CT), reduced tillage (RT) and no-tillage (NT).…………………………………………………………….……………………
100
5.4. Precipitation storage efficiency of long fallow relative to short fallow (RPSE) for the 1998-1999, 1999-2000, 2000-2001 and 2001-2002 long fallow seasons as affected by conventional tillage (CT), reduced tillage (RT) and no-tillage (NT)……………………………………………………………………………..…...
113
Capítulo 6
6.1. Monthly precipitation (mm) during the 1999-2000, 2000-2001 and 2001-2002 long-fallow seasons compared with long-term monthly totals (1954-2002 average) at Peñaflor experimental site.………………………...…………………………………
127
6.2. Average values of soil parameters† measured in the surface crust (0-1 cm), and the 1-10 and 40-50 cm soil horizons in Field 2 under conventional tillage (CT), reduced tillage (RT) and no tillage (NT) treatments…………………………………
132
6.3. Coefficient of determination R2, slope and intercept of the regressions Var(mod) = Slope x Var(obs) + Intercept and RMSE obtained during model calibration under conventional tillage (CT), reduced tillage (RT) and no tillage (NT) treatments during the 2001-2002 fallow period.…………………..…………………………….
134
6.4. Coefficient of determination R2, slope and intercept of the regressions Var(mod) = Slope x Var(obs) + Intercept and RMSE obtained during model validation under conventional tillage (CT), reduced tillage (RT) and no tillage (NT) treatments during the 1999-2000 and 2000-2001 fallow periods ……………………..………..
136
6.5. Fallow precipitation storage efficiency† measured (WSEM) and simulated by SiPSAT (WSES) under conventional tillage (CT), reduced tillage (RT) and no tillage (NT) treatments during the 1999-2000, 2000-2001 and 2001-2002 fallow periods ...
143
Capítulo 7
7.1. Crop establishment of barley as affected by tillage (conventional tillage; CT, reduced tillage, RT; and no-tillage NT), and cropping system (CC, continuous cropping; CF, cereal-fallow rotation) in the 1999-2000, 2000-2001 and 2001-2002 growing seasons.……………...………………………………………………………
166
7.2. Grain yield and yield components of barley as affected by tillage (conventional tillage, CT; reduced tillage, RT; and no-tillage NT), and cropping system (CC, continuous cropping; CF, cereal-fallow rotation) in the 1999-2000, 2000-2001 and 2001-2002 growing seasons. …………………………………...…………………….
170

xvii
7.3. Crop transpiration (T), its contribution to water use (T/ET) and transpiration efficiency for grain yield (TE) of barley, estimated from vapour pressure deficit (e* - e) and above-ground dry matter (DM) for conventional tillage (CT), reduced tillage (RT) and no-tillage (NT) under continuous cropping (CC) and cereal-fallow (CF) rotation in the 1999-2000, 2000-2001 and 2001-2002 growing seasons……....
176
7.4. Precipitation use efficiency (PUE) of barley (grain yield divided by harvest-to-harvest crop water use) as affected by tillage (CT, conventional tillage; RT, reduced tillage; NT, no-tillage), and cropping system (CC, continuous cropping; CF, cereal-fallow rotation) in the 1999-2000, 2000-2001 and 2001-2002 growing seasons ..….
180


xviii
Lista de símbolos y abreviaturas AWHC Contenido de agua disponible para las plantas (m3 m-3) c Velocidad de propagación de la luz en el vacío (3 x 10⁸ m s-1) C0 Radio máximo de poro para una tensión ψ determinada (mm) CC Sistema de cultivo anual CF Sistema de cultivo de “año y vez” CT Sistema de laboreo convencional DM Biomasa del cultivo (g m-2) (e*-e) Déficit de presión de vapor medio diurno (Pa) E Pérdidas de agua del suelo (mm) Eh Evaporación acumulada 24 horas después de las labores (mm) Er Tasa diaria de pérdidas de agua del suelo (mm día-1) EDP Diámetro de poro equivalente (µm) ER Lluvia efectiva (> 10 mm día-1) ET Evapotranspiración o agua utilizada por el cultivo (mm) ET0 Evapotranspiración de referencia (mm) FS Segunda fase del periodo de barbecho largo (16-18 meses) (desde finales de
otoño hasta principios de verano) g Aceleración debida a la fuerza de la gravedad (9.8 m s-2) G Flujo de calor del suelo (W m-2) h Tensión de agua en el suelo (kPa, cm) hg Factor de escala en le modelo de van Genuchten de curva de retención de agua
en el suelo (m) HF Primera fase del periodo de barbecho largo (16-18 meses) (desde cosecha hasta
finales de otoño) I Infiltración acumulada de agua en el suelo (mm) k Coeficiente de eficiencia del cultivo (Pa) K Conductividad hidráulica del suelo (mm s-1, cm s-1) Ki, Ksat Conductividad hidráulica del suelo a tensión i y a saturación, respectivamente
(mm s-1, cm s-1) Kc Conductividad hidráulica a saturación de la costra superficial del suelo (mm s-1,
cm s-1) L Longitud de una sonda TDR (m) m Factor de forma en el modelo de van Genuchten (1980) de curva de retención
de agua en el suelo (-) n Factor de forma en el modelo de van Genuchten (1980) de curva de retención
de agua en el suelo (-) NWL Número de poros efectivos de transmisión de agua por unidad de superficie de
suelo según Watson y Luxmoore (1986) (poros m-2) Nψ Número de poros efectivos de transmisión de agua de radio λψ por unidad de
superficie de suelo (poros m-2) N∆ψ Número de poros efectivos de transmisión de agua de radio λ∆ψ por unidad de
superficie de suelo (poros m-2) NER Lluvia no efectiva (< 10 mm día-1) NT Sistema de no-laboreo o siembra directa P Precipitación (mm) PF Precipitación registrada durante el periodo de barbecho (mm)

xix
PTS Precipitación desde la fecha de labores primarias en el sistema de cultivo continuo hasta la siembra del año siguiente (mm)
PASW Agua del suelo disponible para las plantas (mm) PUE Eficiencia de uso de la precipitación (kg ha-1 mm-1) PSE Eficiencia de almacenamiento de agua de lluvia durante el periodo de barbecho
(%) PT Transductores de presión Q Caudal de infiltración de agua en el suelo (cm3 s-1) Rn Radiación neta (W m-2) RPSE Eficiencia de almacenamiento de agua de lluvia durante el barbecho largo (16-
18 meses) en relación al barbecho corto (5-6 meses) (%) RT Sistema de laboreo reducido S Sortividad del suelo (mm s-0.5) S0 Sortividad del suelo a saturación (mm s-0.5) SiSPAT Simple-Soil-Plant-Atmosphere-Transfer model SS Tercera fase del periodo de barbecho largo (16-18 meses) (desde principios de
verano hasta siembra) SWS Almacenamiento de agua en el suelo (mm) t Fecha de labores secundarias t Tiempo (h, s) T Transpiración del cultivo (mm) T Fecha de labores primarias. Tsoil Temperatura del suelo (ºC) TE Eficiencia de transpiración (kg ha-1 m-1) TDR Reflectometría de Dominio Temporal. v Velocidad de propagación de una onda electromagnética en un medio
dieléctrico (m s–1) WSE Eficiencia de almacenamiento de agua en el suelo (%) WSEM,, WSEM, Eficiencia de almacenamiento de agua en el suelo medida y simulada por el
modelo SISPAT, respectivamente (%) WUEb Eficiencia de uso de agua del cultivo para la producción de biomasa (kg ha-1
mm-1) WUEg Eficiencia de uso de agua del cultivo para la producción de grano (kg ha-1 mm-1) zom Longitud de rugosidad (m) α Albedo del suelo desnudo (-)
yx ,α Pendiente del tramo lineal entre las tensiones x e y en el modelo exponencial de conductividad hidráulica de Reynolds y Elrick (1991)
β Factor de forma en el modelo de Brooks y Corey (1964) de curva de conductividad hidráulica del suelo (-)
∆S Cambios en el contenido de humedad en el perfil del suelo (mm) ∆SWS Agua adicional almacenada en el suelo durante el periodo de barbecho largo
(16-18 meses) con respecto al barbecho corto (5-6 meses) (mm) ε Constante dieléctrica de un medio (+) εair Constante dieléctrica del aire (1) εTDR Constante dieléctrica medida por TDR (+) εwater Constante dieléctrica del agua (81 a 25 ºC) φ Potencial de flujo mátrico del suelo (cm2 s-1)

xx
ϕ Contribución de diferentes clases de tamaño de poros del suelo al flujo de agua a saturación (%)
λ Conductividad térmica aparente del suelo (W m-1 K-1) λψ Tamaño de poro representativo de transmisión de agua a tensión ψ (mm) λ∆ψ Tamaño de poro representativo de transmisión de agua para dos tensiones
consecutivas (mm) µ Viscosidad dinámica del agua (g cm-1 s-1) ρ Densidad (g cm-3) ρb Densidad aparente del suelo (g cm-3) ρs Densidad real del suelo (2.65 g cm-3) σ Tensión superficial del agua (g s-2) θ Contenido volumétrico de humedad del suelo (m3 m-3) θr Contenido volumétrico de humedad residual del suelo (m3 m-3) θsat Contenido volumétrico de humedad del suelo a saturación (m3 m-3) θFC Contenido volumétrico de humedad del suelo a capacidad de campo (ψ = -10
kPa ) (m3 m-3) θPWP Contenido volumétrico de humedad del suelo a punto de marchitez permanente
(ψ = -1500 kPa) (m3 m-3) θWL Porosidad efectiva de transmisión de agua en el suelo para dos tensiones
consecutivas según Watson y Luxmoore (1986) (m3 m-3) θξ Porosidad efectiva de transmisión de agua en el suelo para dos tensiones
consecutivas (m3 m-3) ψ Tensión de agua en el suelo (kPa, cm) ξ Porosidad total del suelo (m3 m-3)


Capítulo 1
Introducción general

3
Introducción general
1. Los secanos semiáridos de la zona centro del valle del Ebro.
En Aragón, donde la superficie cultivada en secano representa aproximadamente
el 75 % de la superficie agrícola total (Gobierno de Aragón, 2001), gran parte de los
cultivos herbáceos se realizan en zonas de clima árido o semiárido, con una
pluviometría media anual inferior a 500 mm. La escasa precipitación y la irregular
distribución de ésta a lo largo del año constituyen los principales factores limitantes
de la producción agrícola de secano, cuyas consecuencias son bajos rendimientos y
alta variabilidad interanual (McAneney y Arrúe, 1993).
La cebada, con una superficie cultivada de aproximadamente el 30 % (380.000
ha) de la superficie total agrícola de Aragón, es el cultivo más extendido en esta
comunidad (Gobierno de Aragón, 2001). El rendimiento medio en grano de este
cultivo en las zonas de secano semiárido oscila entre los 1500 y 2000 kg ha-1. El
sistema de cultivo tradicional en estas condiciones es la rotación cebada-barbecho,
o cultivo de “año y vez”, que incluye un largo periodo de barbecho de 16 a 18
meses de duración y que transcurre desde la cosecha (junio-julio) hasta la siembra
(noviembre-diciembre) del año siguiente. Los principales motivos para la
utilización de este tipo de barbecho son el aumento del agua disponible para el
cultivo al final del mismo, la mejora de la fertilidad de suelo y la reducción de la
incidencia de malas hierbas, plagas y enfermedades que puedan afectar al siguiente
cultivo. A esta justificación agronómica del uso del barbecho, hay que añadir la
relacionada con el cumplimiento de las directivas de la Política Agraria
Comunitaria (PAC), que ha hecho renacer el “interés” por esta práctica en los
últimos años.

4 Capítulo 1
En los secanos semiáridos del centro del valle del Ebro, la aplicación de un pase
con arado de vertedera, como labor primaria, seguido por varios pases de
cultivador, como labores secundarias, sigue siendo el sistema convencional de
manejo del suelo durante el periodo de barbecho en el sistema de cultivo de “año y
vez”. Este manejo viene justificado porque, en principio, mejora la infiltración del
agua de lluvia tras las labores, elimina malas hierbas y favorece la mineralización
de la materia orgánica del suelo. Sin embargo, el uso del laboreo tradicional en los
secanos del valle del Ebro ha experimentado en las últimas décadas una progresiva
regresión, a consecuencia de la disminución del precio del grano y del aumento de
los costes de combustible y otros insumos. Ello ha propiciado la búsqueda de
prácticas alternativas de manejo de suelo encaminadas a aumentar los rendimientos
de cosecha y a reducir los costes de producción. En este sentido, es a principios de
los años 90 del pasado siglo cuando comienza a considerarse la posibilidad de
sustituir, en los sistemas de cultivo de “año y vez” de los secanos semiáridos de la
zona centro del valle del Ebro, el laboreo convencional por prácticas de laboreo de
conservación (mínimo laboreo y no laboreo) que reducen el número de labores
previas a la siembra y permiten un mayor ahorro energético (Arrúe y López, 1991).
A esta consideración de índole económica habría que añadir el cumplimiento de las
medidas agroambientales de la PAC, orientadas a la protección del suelo a través de
la sustitución de los sistemas tradicionales de laboreo, que favorecen las pérdidas de
suelo por erosión hídrica y eólica, por prácticas agrícolas respetuosas con el medio
ambiente como es el caso del laboreo de conservación.
2. Limitaciones de los sistemas tradicionales de cultivo
Dada la importancia que el sistema de cultivo tradicional de “año y vez” tiene en
el centro del valle del Ebro, se ha planteado la necesidad de comprobar si esta
rotación es un sistema agronómicamente sustentable en relación con la rentabilidad
de las explotaciones agrícolas de secano, el aprovechamiento del agua de lluvia o la

Introducción general 5
mejora de la fertilidad física y química del suelo. De los resultados obtenidos en los
escasos estudios realizados hasta el presente sobre esta problemática (McAneney y
Arrúe, 1993;, López et al.,1996; Austin et al., 1998a; Austin et al., 1998b) puede
concluirse que la práctica del barbecho en la rotación cereal-barbecho es ineficiente
desde el punto de vista de la conservación del agua del suelo cuando se compara
con un sistema anual de monocultivo, aún cuando las estimaciones indican que el
rendimiento en grano de una rotación de cebada-barbecho puede ser, por término
medio, un 15 % superior al obtenido con un cultivo continuo de cebada (Austin et
al., 1998a). Este incremento potencial, debido principalmente al incremento del
agua almacenada en el suelo en el sistema de “año y vez” (un 6.2% con respecto al
cultivo anual), supondría un aumento de unos10 kg ha-1 de grano por mm de agua
conservada (Austin et al., 1998b). Según estos autores, la decisión de utilizar la
rotación cereal-barbecho o un cultivo continuo vendría definida principalmente por
la lluvia recibida en los tres últimos meses del barbecho, de modo que en años con
otoños lluviosos, un cultivo con un barbecho corto (5-6 meses tras la cosecha)
podría resultar viable, al igual que en años con otoños secos, donde existiría un alto
riesgo de fallos de siembra, un barbecho largo podría favorecer el almacenamiento
de agua en el suelo en el momento de la siembra, lo que reduciría dichos riesgos
(Austin et al., 1998a). Así, pues, de acuerdo con los resultados mencionados, la
viabilidad económica del sistema de cultivo de “año y vez” continúa siendo
cuestionable, ya que, además, para que fuera rentable, en sentido estricto, los
rendimientos del mismo deberían doblar como mínimo los obtenidos con un sistema
de cultivo continuo (Austin et al., 1998a).
Ante esta disyuntiva, una posible solución para mejorar la eficiencia en el uso de
la precipitación recibida durante el periodo de barbecho podría encontrarse en una
intensificación de los actuales sistemas de cultivos extensivos de secano incluyendo
nuevas rotaciones, tal como se ha planteado en otras regiones semiáridas (Farahani
et al., 1998 López-Bellido et al., 2000; Díaz-Ambrona and Mínguez, 2001;). Sin

6 Capítulo 1
embargo, la eficiencia del barbecho para conservar agua no sólo depende del tipo de
suelo y del régimen pluviométrico sino también del manejo del suelo (Lampurlanés
et al., 2002). Así, pues, el laboreo, práctica de manejo de suelo que altera las
propiedades de retención y transmisión de agua en el suelo, interviene directamente
sobre los componentes del balance del agua (almacenamiento, evaporación y
drenaje) (Singh et al., 1996) y, por tanto, sobre la economía del agua durante el
barbecho. Sin embargo, aunque un incremento en la porosidad y en la continuidad
de los poros aumenta el flujo y la capacidad de almacenamiento de agua en el suelo,
también puede favorecer la evaporación del agua acumulada en profundidad
(Baunmhardt and Jones, 2002). Por ello, un conocimiento adecuado del
comportamiento de las propiedades hidrofísicas del suelo resulta imprescindible si
queremos determinar qué prácticas de laboreo durante el barbecho pueden conducir
a unas condiciones óptimas de crecimiento y desarrollo del cultivo.
Hasta la fecha son escasas las investigaciones realizadas en las zonas semiáridas
del valle del Ebro en las que se hayan cuantificado los efectos de diferentes
sistemas de laboreo sobre las propiedades físicas del suelo y su repercusión en los
componentes del balance del agua. A este respecto, López (1993), en uno de los
primeros estudios de comparación de sistemas de laboreo realizados en la zona,
observó que tras dos años de ensayo, el sistema de no-laboreo aumentaba la
resistencia a la penetración del suelo frente al laboreo reducido y el laboreo
tradicional. Similares resultados obtuvo Lampurlanés (2000) al comprobar que la
densidad aparente del suelo bajo no-laboreo era mayor que en tratamientos de
mínimo laboreo y subsolado. Estas diferencias de compactación entre suelos
labrados y no labrados se deben a la modificación de la estructura del suelo por
efecto de las labores anuales. Ello supone un aumento inicial de la porosidad, que
posteriormente se reduce y estabiliza debido a la reconsolidación del suelo que tiene
lugar por la acción de las lluvias y los consiguientes ciclos de humectación y
desecación del suelo (Green et al., 2003). Los cambios de porosidad del suelo

Introducción general 7
afectan, a su vez, a la retención humedad y a la tasa de infiltración y movimiento
del agua en el suelo. Así, mientras López (1993) no observó, tras dos años de
ensayo, un empeoramiento en la conductividad hidráulica del suelo a saturación
bajo no-laboreo con respecto a sistemas de laboreo reducido y convencional,
Lampurlanés (2000) si encontró en siembra directa, con una mayor compactación
del suelo, una menor conductividad hidráulica que bajo mínimo laboreo y que el
incremento de ésta tras las labores se reducía progresivamente durante el barbecho
por el efecto de la lluvia. En cuanto a la influencia de los diferentes sistemas
laboreo sobre la capacidad de retención de agua en el suelo, aún no se ha realizado
ningún estudio en el centro de Aragón sobre este particular aspecto, siendo escasos
los llevados a cabo en otras regiones. Según el trabajo de Evett et al. (1999), en las
Grandes Llanuras de Estados Unidos, frente a sistemas de laboreo convencionales,
la siembra directa tiende a reducir la retención de agua en condiciones próximas a
saturación y a incrementar la misma a tensiones inferiores a 7 kPa.
Así, pues, a tenor de los efectos potenciales que los sistemas de laboreo tienen
sobre el régimen hídrico del suelo y de las exigencias de una agricultura moderna y
sostenible en cuanto a reducción de costes de producción y mejora de la calidad del
suelo, se ha planteado la necesidad de evaluar las ventajas que los sistemas de
laboreo de conservación presentan frente al laboreo convencional, para la
conservación del agua en el suelo durante el barbecho. Por otro lado, y tal como se
ha indicado, los estudios de campo realizados en el centro de Aragón han sido hasta
la fecha escasos e insuficientes. López et al. (1996) observaron, comparando
sistemas de laboreo convencional y laboreo de conservación, que mientras los
sistemas de labranza con vertedera y chisel conservaban al final del barbecho
cantidades similares de agua, los efectos del sistema de siembra directa resultaron
inconsistentes. Por su parte, Lampurlanés et al. (2002) observaron, en otra zona
semiárida del valle del Ebro, que el sistema de no-laboreo, sin eliminación de los
residuos superficiales de post-cosecha, era potencialmente el más eficiente en la

8 Capítulo 1
conservación del agua del suelo al final del periodo de barbecho. Por otra parte, y al
margen del efecto beneficioso sobre la conservación del agua del suelo, el laboreo
tiene también repercusiones sobre los rendimientos del cultivo. Así, pues, López y
Arrúe (1997) concluyeron que el laboreo reducido era la mejor alternativa al
laboreo convencional para mantener la producción en los secanos semiáridos de la
zona centro del valle del Ebro. Similares resultados obtuvieron Angás (2001) y
Lampurlanés et al. (2002), quienes observaron que el laboreo de conservación
aplicado en sistemas agrícolas de secano en condiciones semiáridas de la zona
oriental del valle del Ebro mejoraba el rendimiento del cultivo de cebada,
especialmente en años secos, en los que el laboreo convencional tenía un
comportamiento negativo.
3. Objetivos y estructura del trabajo
Partiendo de la base de que el agua es el principal factor limitante de la
producción agrícola en las zonas semiáridas de secano, como es el caso del centro
de Aragón, resulta esencial investigar aquellas prácticas agronómicas que puedan
reducir las pérdidas de agua del suelo por evaporación. Así, pues, el objetivo
general del presente trabajo ha sido evaluar, en las condiciones de secano semárido
del centro de Aragón, los efectos del laboreo convencional (CT) y del laboreo de
conservación -mínimo laboreo (RT) y no-laboreo (NT)- sobre las propiedades
hidrofísicas y el balance de agua del suelo a lo largo del periodo de barbecho que
caracteriza el sistema de cultivo de “año y vez”, así como las repercusiones de
dichos efectos sobre el crecimiento y rendimiento de un cultivo de cebada, tanto
bajo cultivo continuo como en la rotación cebada-barbecho.
El trabajo de campo del presente estudio se ha llevado a cabo entre agosto de
1999 y noviembre de 2002. En este periodo, que incluye tres ciclos de cultivo con

Introducción general 9
sus respectivos periodos de barbecho, se han desarrollado cuatro objetivos
particulares según se detalla a continuación.
Con el fin de interpretar el efecto de los diferentes sistemas de laboreo sobre la
dinámica del agua en el suelo a lo largo del periodo de barbecho en el sistema de
“año y vez”, el primer objetivo ha consistido en estudiar para cada uno de los
tratamientos la evolución de las principales propiedades hidráulicas del suelo
(conductividad hidráulica y curva de retención de humedad del suelo) a lo largo del
periodo de barbecho (Capítulo 4). En el caso de las medidas in situ de la
conductividad hidráulica del suelo, éstas se han realizado mediante un nuevo
sistema de medida de infiltración desarrollado al efecto y compuesto por un
infiltrómetro de disco asociado a un sistema TDR (Reflectometría de Dominio
Temporal), que permite automatizar las lecturas y eliminar errores de medida
(Capítulo 2). Asimismo, y dado que las labores reducen la resistencia del suelo a la
penetración por un mayor esponjamiento del mismo, se ha estudiado el efecto del
peso del infiltrómetro sobre las medidas de conductividad hidráulica del suelo, a fin
de valorar los posibles errores cometidos en dichas medidas en suelos recientemente
labrados (Capítulo 3).
Un segundo objetivo ha sido estudiar el efecto del sistema de laboreo sobre la
dinámica del contenido de agua del suelo a lo largo del periodo de barbecho en el
sistema de cultivo de “año y vez” y evaluar, frente al sistema de cultivo continuo, la
eficiencia del barbecho en la rotación cebada – barbecho en el almacenamiento de
agua (Capítulo 5).
A partir de los datos agrometeorológicos y de las medidas de propiedades
hidrofísicas registradas a lo largo de los tres periodos de barbecho “año y vez”
caracterizados, se ha calibrado y validado el modelo de simulación SiSPAT (Braud
et al., 1995), para lo cual se han utilizado también los datos de humedad,
temperatura y flujo de calor del suelo registrados durante los tres años
experimentales. La posterior aplicación del modelo SiSPAT a los datos de campo

10 Capítulo 1
tuvo como objetivo estimar las pérdidas potenciales de agua por evaporación y
drenaje profundo que pueden tener lugar durante el barbecho en el caso hipotético
de que, durante dicho periodo, no se realice ningún tipo de labor agrícola y valorar
nuevas alternativas a los sistemas tradicionales de laboreo, tales como el retraso de
las labores o la alternancia de sistemas de laboreo en función de la pluviometría
(Capítulo 6).
Finalmente, tras examinar el efecto de los diferentes sistemas de cultivo y
tratamientos de laboreo sobre la conservación del agua en el suelo al final de los
periodos de barbecho, el último objetivo ha consistido en evaluar la influencia de
las diferentes prácticas de cultivo sobre el crecimiento, rendimiento y eficiencia en
el uso del agua del cultivo de cebada en condiciones semiáridas de secano
semiárido en la zona centro del valle del Ebro (Capítulo 7). En la sección final de
Conclusiones generales se resumen los principales resultados obtenidos en la Tesis.
Referencias
Angás, P., 2001. Análisis de la influencia de las técnicas de laboreo y fertilización
nitrogenada sobre la dinámica del agua y el nitrógeno del suelo en el cultivo de cebada
(Hordeum vulgare L.) en las zonas áridas y semiáridas del Valle del Ebro. Agronomía
y modelización. Tesis Doctoral, ETSEA, Universidad de Lleida.
Arrúe, J.L., López, M.V., 1991. Laboreo de conservación: tendencias y prioridades de
investigación. Suelo y Planta, 1, 555-564.
Austin, R.B., Playán, E., Gimeno, J., 1998a. Water storage in soils during the fallow:
prediction of the effects of rainfall pattern and soil conditions in the Ebro valley of
Spain. Agric Water Manag. 8, 239-248.
Austin, R.B., Cantero-Martinez, C., Arrúe, J,L., Playán, E., Cano-Marcellán, P., 1998b.
Yield-rainfall relationships in cereal cropping systems in the Ebro river valley of Spain.
Eur. J. Agron. 8, 239-248.
Baumhardt, R.L., Jones, O.R., 2002. Residue management and paratillage effects on some
soil properties and rain infiltration. Soil Till. Res. 65, 19-27.

Introducción general 11
Braud, I., Dantas-Antonino, A.C., Vaculin, M., Thony, J.L., Rulle, P., 1995. A Simple soil-
plant-atmosphere transfer model (SiSPAT) development and field verification. J.
Hydrol. 166, 213-250.
Díaz-Ambrona, C.H., Mínguez, M.I., 2001. Cereal-legume rotation in a Mediterranean
environment: biomass and yield production. Field Crop Res. 70, 139-151.
Evett, S.R., Peters, F.H., Jones, O.R., Unger, P.W., 1999. Soil hydraulic conductivity and
retention curves from tension infiltrometer and laboratory data. In: van Genuchten, M.
T., Leij, F.J., Wu, L. (Eds.), Characterization and Measurement of the Hydraulic
Properties of Unsaturated Porous Media. Part 1, USDA, Riverside, California, pp. 541-
551.
Farahani, H.J., Peterson, G.A., Westfall, D.G., Sherrod, L.A., Ahuja, L.R., 1998. Soil water
storage indryland cropping systems: The significance of cropping intensification. Soil
Sci. Soc. Am. J. 62, 984-991.
Gobierno de Aragón, 2001. Anuario Estadístico de Aragón 1999. Departamento de
Agricultura, Secretaría General Técnica, Zaragoza.
Green, R.T., Ahuja, L.R.; Benjamin, J. G., 2003. Advances and challenges in predicting
agricultural management effects on soil hydraulic properties. Geoderma 116, 3-27.
Lampurlanés, J. 2000. Influencia del sistema de laboreo y del barbecho sobre la dinámica
del agua del suelo y el crecimiento del sistema radicular en condiciones de secano
semiárido. Tesis Doctoral. Escuela Técnica Superior de Ingeniería Agraria.
Universidad de Lleida.
Lampurlanés, J., Angás, P., Cantero-Martínez, C., 2002. Tillage effects on water storage
during fallow, and on barley root growth and yield in two contrasting soils of the
semiarid Segarra region in Spain. Soil Till. Res. 65, 207-220.
López, M.V., 1993. Respuesta del suelo y de un cultivo de cebada al laboreo de
conservación en agrosistemas de secano de Aragón. Tesis Doctoral. Facultad de
Ciencias, Universidad de Navarra.
López, M.V., Arrúe, J.L., 1997. Growth, yield and water use efficiency of winter barley in
response to conservation tillage in a semiarid region of Spain. Soil Till. Res. 44, 35-54.
López, M.V., Arrúe, J.L., Sánchez-Girón, V., 1996. A comparison between seasonal
changes in soil water storage and penetration resistance under conventional and
12 Capítulo 1
conservation tillage systems in Aragón. Soil Till. Res. 37, 251-271.
López-Bellido, L., López-Bellido, R.J., Castillo, J.E., López-Bellido, F.J., 2000. Effects of
tillage, crop rotation, and nitrogen fertilisation on wheat under rainfed Mediterranean
conditions. Agron. J. 92, 1054-1063.
McAneney, K. J., Arrúe, J. L., 1993. A wheat-fallow rotation in north-eastern Spain: water
balance-yield considerations. Agronomie 13, 481-490.
Singh, B., Chanasyk, D.S., McGill, W.B., 1996. Soil hydraulic properties of an Orthic black
chernozem under long-term tillage and residue management. Can. J. Soil Sci. 76, 63-
71.

Capítulo 2
TDR Application for Automated Water Level
Measurement from Mariotte Reservoirs in Tension
Disc Infiltrometers
D. Moret, M.V. López and J.L. Arrúe
Submitted to: Journal of Hydrology


15
TDR Application for Automated Water Level Measurement
from Mariotte Reservoirs in Tension Disc Infiltrometers
ABSTRACT
This paper describes the use of an automated method of measuring water level
changes in Mariotte-type reservoirs via time domain reflectometry (TDR) and
demonstrates its field application for measurements of soil hydraulic properties. The
method is based on the assumption that the travel time of a TDR pulse propagating
along a transmission line immersed in an air-water medium is the summation of the
pulse travel times in the air and water phases. A TDR cable tester generates a pulse
that propagates through a three-rod probe traversing the centre of the Mariotte
reservoir from top to bottom. The reflection of the pulse is automatically transferred
to a computer for waveform analysis with the water level being a simple function of
probe length and the air, water, and air-water medium dielectric constants as
measured by the cable tester. Water level measurements obtained with the TDR
technique showed close agreement with those obtained using visual and pressure
transducer procedures. The advantages of this TDR method over more traditional
methods was demonstrated in a field experiment using a tension disc infiltrometer.
The new approach allows for automated water level measurements and is simple,
accurate and easy to implement. Moreover, it allows for simultaneous TDR
measurements of both water flow and volumetric water content of soil below the
infiltrometer disc.
1. Introduction
Accurate characterisation of soil hydraulic properties is crucial to solving many
hydrological, engineering, and environmental issues linked to soil water storage and
transport in the vadose zone. In practice, this is achieved using field determinations

16 Capítulo 2
of transient and steady-state infiltration rates of water into the soil, either under
positive or negative head conditions (Angulo-Jaramillo et al., 2000). Both methods
involve measuring the change of water level in a water-supply reservoir. Generally,
this is done by visually noting the water level drop in a Mariotte column. However,
this practice requires constant vigilance since visual readings have to be made at
constant intervals and sometimes over long periods of time as in the case of slowly
permeable clay soils. In other situations, when using early-time transient flow to
infer soil hydraulic properties (Vandervaere et al., 1997), initial infiltration rates can
be too rapid to be recorded with the required precision.
Over the last decade, the tension disc infiltrometer (Perroux and White, 1988)
has become a popular tool in the study of saturated and near saturated soil water
flows (Angulo-Jaramillo et al., 2000). To overcome the limitations of the standard
visual technique, automated tension infiltrometers have been configured with either
two gage transducers (Ankeny et al., 1988) or a single differential transducer (Casey
and Derby, 2002). Though these infiltrometers are capable of providing accurate
water level measurements, they depend upon accurate calibration.
When estimating soil hydraulic properties from disc infiltrometer measurements,
determination of the initial and final soil volumetric water content below the
infiltrometer disc is also required. This is usually done by extracting soil cores, an
exacting and laborious task but one that could also be achieved using time domain
reflectometry (TDR), a relatively new and highly accurate technique now widely
used in many soil science and hydrology laboratories (Jones et al., 2002). Some
studies have already explored the combined use of tension disc infiltrometry and
TDR measurements of soil water content (Vogeler et al., 1996; Schwartz and Evett,
2002). The present study further develops this idea more fully in exploiting TDR for
the infiltration measurements themselves.
TDR technology has also been used to measure the elevation of ground water
table depths (O’Connor and Dowding, 1999) and the water level in tanks collecting

TDR disc infiltrometer 17
surface runoff from erosion field plots (Thomsen et al., 2000). In these and other
applications, such as the “guided microwave” devices commercially available for
level measurement of fluids in industrial containers, the measurement principle is
the location of the TDR voltage reflection at the air-medium interface. However,
errors are possible if the operator does not correctly identify such reflections, as can
happen when TDR signatures are visually analysed to locate the air-water interface
in piezometric tubes (O’Connor and Dowding, 1999). In contrast, the standard TDR
method for automated measurement of soil water content considers the travel time
of the TDR pulse along the whole length of the transmission line. We develop a
similar approach here for the measurement of water level changes in order to
calculate infiltration rates from a disc infiltrometer.
The objectives of this research were twofold: firstly, to test the use of TDR for
automated, unattended measurement of water level changes in Mariotte-type
reservoirs, and secondly, to demonstrate its field use with a tension disc
infiltrometer to provide simultaneous TDR measurements of both water flow and
soil water content.
2. Materials and methods
2.1. Theory
TDR relies on the determination of the propagation velocity of electromagnetic
waves along parallel metallic probes embedded in the medium of interest. The
fundamental physical property affecting the pulse transit time is the dielectric
property of the medium with the propagation velocity (ν ) expressed as :
ε
cv = (2.1)
where c is the velocity of light in free space (3 x 10⁸ m s-1) and ε is the relative
dielectric constant of the medium (Topp et al., 1980). By definition, the propagation

18 Capítulo 2
velocity (ν ) along a TDR probe of length L is given in terms of the pulse transit
time, t, and the path length, 2L (Dalton, 1992) as
tL
v2
= (2.2)
Equating Equation (2.1) and Equation (2.2) and solving for the transit time gives
c
Lt
ε2= (2.3)
In the case of a TDR probe vertically inserted in a stratified medium with
different phases the measured total travel time of the TDR pulse is a summation of
the travel times in the different phases (Ferré et al., 1996):
iitt Σ= (2.4)
where the subscripts refer to the different phases. In the case of a TDR probe of
length L traversing from the top to the bottom of a Mariotte reservoir of height L
partially filled with water (Fig. 2.1) we obtain
( )c
xL
c
x
c
Lt waterairTDR εεε −
+==222
(2.5)
where εTDR is the apparent dielectric constant measured by the TDR cable tester; εair
and εwater are the relative dielectric constants of air and water measured previously
with the same probe; and x is the probe length above water level.
Solving the equality (2.5) for x we obtain
waterair
waterTDRLxεε
εε
−
−= (2.6)
2.2. TDR-based water level sensing set-up: probe design and waveform analysis
On the basis of the above theoretical considerations, this paper presents a new
system for automated water level measurements in a Mariotte column (e.g. the
water- supply reservoir of a tension disc infiltrometer using TDR (Fig. 2.1). This

TDR disc infiltrometer 19
Air outlet
Mariotte reservoir
Three-rod TDR probe
Water inlet
Shut-off valve
Disc
Bubble tower
L
50 Coaxial cableΩ
Water level
To TDR cable tester
To TDR cable tester
Three-rodTDR probe
Figure 2.1. Cross section of a tension disc infiltrometer configured with a TDR probe inside the water-supply reservoir

20 Capítulo 2
application comprises a three-rod coaxial TDR probe placed in the centre of the
water reservoir and connected to a TDR pulser (Tektronix 1502C Metallic Time
Domain Reflectometer) equipped with a SP232 serial communication port. The
probe is firmly fixed to the water reservoir by means of an epoxy casing at the top
and a PVC rod of 12 mm of diameter traversing the reservoir at the bottom. The
cable tester generates electromagnetic pulses at predetermined intervals that
propagate through the water reservoir along the probe. Reflections of the pulse
propagate back to the receiving unit in the TDR pulser. The waveform is then
transferred to the computer and automatically analysed using the software
WinTDR’98 (Or et al., 1998).
The waveform characteristics of several three-wire TDR probe designs with
different wire material (steel, tin and copper) and geometrical configurations were
investigated before choosing copper rods with a diameter of 1.6 mm and a
separation of 10 mm for the outermost rods.
To reduce conductive losses and improve the quality of the TDR waveforms and
their analysis by using the double-reflection procedure (Heimovaara, 1993), probe
rods were insulated with polyolefin heat-shrink tubing having a wall thickness of
0.5 mm. Figure 2.2 shows the effect of this type of coating. For a Mariotte reservoir
full of water and with a probe without coating, the signature of the second reflection
is poorly defined (Fig. 2.2a). By contrast, the definition substantially improves
when the same probe is coated (Fig. 2.2b, waveform III). This improvement, which
is maintained as the water reservoir empties (Fig. 2.2b), substantively improves the
accuracy in finding the second reflection point on the wave trace by using the
tangent lines procedure with either the classical sloped line method or the flat line
method as designed in WinTDR’98 for well defined waveforms (Or et al., 1998).
Once the apparent dielectric constant of the air - water medium within the water
reservoir, εTDR , is obtained via Equation (2.3), the water level height (L-x) is
calculated from Equation (2.6). Values of εair and εwater are measured with the

TDR disc infiltrometer 21
Figure 2.2. Comparison of TDR signatures for the three-rod probe developed to measure water level changes in a Mariotte reservoir: (a) probe with uncoated rods and reservoir full of water; (b) probe with rods coated with polyolefin tubing and reservoir empty (I), half-full of water (II) and full of water (III).

22 Capítulo 2
reservoir empty and full of water, respectively, immediately prior to the
experimental runs.
2.3. Performance and field application
In order to evaluate the capability of the new TDR-based water level sensing
technique for in situ automated water flow measurement by tension disc
infiltrometry, two experiments were conducted. In both tap water with an electrical
conductivity of 1.14 dS m-1 was used.
The first experiment was undertaken in the laboratory to test the performance
and precision of the proposed TDR application under ideal conditions for measuring
the water level in Mariotte reservoirs. TDR was compared with the standard visual
technique, with readings made to the nearest millimetre, and a single differential
pressure transducer. To this end, a vertical water reservoir, consisting of a 90 cm
tube made of clear methacrylate plastic with 4.2 cm of internal diameter, was
equipped with a coated three-wire TDR probe 86.5 cm long similar to that
described previously (Fig. 2.1). A differential pressure transducer (model
26PCDFA6D, Microswitch, Honeywell) was installed at the bottom of the reservoir
and calibrated as described by Casey and Derby (2002). A transparent calibrated
measuring tape was externally attached to the reservoir wall for visual water level
measurements. To allow for stationary water level measurements, the reservoir was
closed at the bottom by means of a rubber stopper having a PVC stopcock.
Simultaneous visual, pressure transducer and TDR-based depth measurements were
made at intervals of approximately 5-10 cm, from 0 cm (reservoir full of water)
down to 86.5 cm (reservoir full of air). This procedure was repeated twice.
A second experiment to demonstrate the field use of the new TDR application
was also carried out. It consisted of measuring the infiltration rate of a recently
tilled loamy soil at a water pressure head (ψ ) of 0 cm using a 0.25 m diameter
tension disc infiltrometer (Perroux and White, 1988). In this case, the TDR

TDR disc infiltrometer 23
instrumented Mariotte column used in the laboratory experiment acted as the water-
supply reservoir. As in the laboratory, it was also equipped with a measuring tape
and a calibrated single differential transducer. Prior to the infiltration
measurements, the reservoir was filled with water in situ by closing both the air-
inlet stopcock at the bubbling tower and the valve between the reservoir and the
base of the disc (Fig. 2.1). Then, opening the air-outlet and water-inlet stopcocks at
the top the reservoir allows air to evacuate while water is poured in to rapidly fill
the Mariotte reservoir. The base of the disc was covered with a nylon cloth of 20-
µm mesh and a thin layer of commercial sand (80-160 µm grain size) poured onto
the soil surface to ensure good contact between the disc and the soil.
For the imposed tension, and taking into account the infiltration surface area and
the cross sectional area of the reservoir tube and that of the probe rods, the
cumulative infiltration was calculated from water-level drop in the reservoir every
30 seconds by the visual, pressure transducer and TDR methods.
Prior to the infiltration test, a TDR probe of three stainless steel rods (diameter:
2 mm; length: 100 mm; spacing for the outermost rods: 25 mm) was carefully
inserted horizontally into the soil beneath the infiltrometer disc at a depth of 4 cm to
monitor the volumetric water content of soil (θ ) (Fig. 2.1).
Six additional infiltration tests were performed also at ψ = 0 mm with the aim of
testing the suitability of the TDR technique against the more common gravimetric
method of obtaining the final water content of soil below the infiltrometer. At the
completion of each test (steady-state infiltration rate), the volumetric water content
of a surface soil core (50 mm in diameter by 50 mm height) was determined
gravimetrically.
TDR measurements of both cumulative infiltration and θ were synchronously
and automatically made every 30 seconds using WinTDR’98 (Or et al., 1998). To
this end, the two TDR probes were connected to a multiplexer (model SDMX50,
Campbell Scientific Inc.).

24 Capítulo 2
3. Results and discussion
Figure 2.3 shows the results of the laboratory experiment. There was an
excellent correlation between visual measurements of water level height (hVIS) in the
Mariotte column and simultaneous measurements obtained using either the pressure
transducer (PT) (hPT = 0.994 hVIS - 0.578, r2 = 0.998) or TDR (hTDR = 1.006 hVIS –
0.279, r2 = 0.999).
The variability observed among TDR water level readings for a given height was
very low, as reflected by an average coefficient of variation of 0.11% obtained in an
Water level (cm), visual
0 20 40 60 80 100
Wa
ter
leve
l (cm
), T
DR
, PT
0
20
40
60
80
100
1:1
TDR
PT
Figure 2.3. Relationship between the water level determined using a TDR probe and a single differential pressure transducer (PT) and the water level determined visually in a Mariotte column 90 cm high under laboratory conditions.

TDR disc infiltrometer 25
additional experiment in which TDR measurements were made in triplicate at 19
reference heights.
The field experiment demonstrated the performance of the proposed TDR-based
technique during a typical infiltration test under field conditions (Fig. 2.4a). Again
agreement between the visual and PT and TDR methods was excellent (hPT = 0.971
hVIS + 0.531, r2 = 0.999; hTDR = 0.996 hVIS + 0.593, r2 = 0.999).
If either the standard deviation of the regression (SD) or the root mean standard
error (RMSE = ∑ =−
n
i visPTTDR nhh1
2, )( ) is taken a measure of the dispersion
between measured (TDR or PT readings) and reference (visual) water level values,
the proposed TDR method appears to be slightly more accurate than the PT method.
For the laboratory experiment (n=18), those parameters were lower for the TDR
method (SD = 0.42 cm; RMSE = 0.41 cm) than for the PT method (SD = 0.46 cm;
RMSE = 0.73 cm). This was also the case for the field experiment, where the SD
and RMSE values (n=28) for the TDR technique were lower (SD = 0.25 cm; RMSE
= 0.47 cm) than for the PT method (SD = 0.79 cm; RMSE = 0.73 cm). The standard
error for the TDR measurements in the laboratory and field experiments was 1.0
and 0.5 mm, respectively. Thomsen et al. (2002) reported a standard error of 2.5
mm for a calibration experiment under laboratory conditions in which visual
measurements of water depth were compared with measurements taken with their
prototype of TDR water level probe.
The new automated TDR technique has certain advantages over other methods
of measuring the water level change in the water-supply reservoir of tension disc
infiltrometers. Firstly, the TDR water level reading is not subject to uncertainties
arising from visual measurement errors due to parallax viewing and potential errors
in recording the reading time. Secondly, since the proposed TDR method does not
require any laboratory or field calibration before its use in the field, errors
associated to pressure transducer calibration are also eliminated. Moreover, since
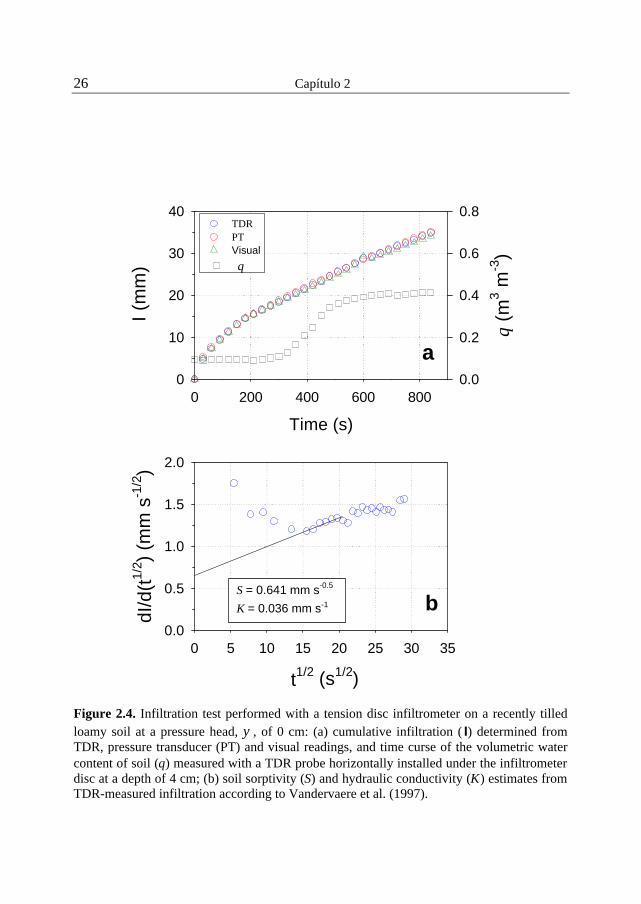
26 Capítulo 2
Time (s)
0 200 400 600 8000
10
20
30
40
θ (m
3 m
-3)
0.0
0.2
0.4
0.6
0.8
0 5 10 15 20 25 30 35
dI/
d(t
1/2)
(mm
s-1
/2)
0.0
0.5
1.0
1.5
2.0
t1/2 (s1/2)
I (m
m)
b
a
S = 0.641 mm s-0.5
K = 0.036 mm s-1
TDRPTVisual
θ
Figure 2.4. Infiltration test performed with a tension disc infiltrometer on a recently tilled loamy soil at a pressure head, ψ, of 0 cm: (a) cumulative infiltration ( I) determined from TDR, pressure transducer (PT) and visual readings, and time curse of the volumetric water content of soil (θ) measured with a TDR probe horizontally installed under the infiltrometer disc at a depth of 4 cm; (b) soil sorptivity (S) and hydraulic conductivity (K ) estimates from TDR-measured infiltration according to Vandervaere et al. (1997).

TDR disc infiltrometer 27
the TDR method is based upon measurement of the changes in the apparent
dielectric constant (εTDR) of an air-water medium, its precision is not affected by
pressure fluctuations due to bubbling.
A singular feature of the automated water level sensing method tested here is
that TDR can be used for simultaneous recording of both water flow and transient
volumetric water content of soil (θ ) underneath the infiltrometer disc. Figure 2.4a
shows the cumulative infiltration obtained in our field infiltration experiment using
TDR and other methods for water level measurements and the change of θ
measured during the infiltration run. This is particularly useful when inferring soil
hydraulic properties using inverse parameter estimation techniques (Angulo-
Jaramillo et al., 2000; Schwartz and Evett, 2002) that require not only accurate
measurements of either transient or steady-state water flow but also the initial (θ i)
and the final water content of soil (θ f) below the disc.
By using TDR to measure θi and θf, difficulties and errors associated to the
conventional method of collecting soil cores to obtain the dry bulk density needed
to convert gravimetric water contents into volumetric values are avoided. In our
field experiment, the TDR-measured values of θ i and θ f were 0.093 and 0.415 m3 m-
3, respectively (Fig. 2.4a). The θf value was consistent with the average figures
obtained in the infiltration tests performed on six locations under the same soil
surface conditions, in which no significant differences were found between θf
determined by TDR (θ f = 0.403 m3 m-3) and gravimetrically on undisturbed soil
cores (θ f = 0.423 m3 m-3).
Likewise, the proposed TDR method has proved to be satisfactory to estimate
soil hydraulic properties from transient water flow data. Thus, soil sorptivity (S) for
our field infiltration experiment (S = 0.641 mm s-0.5) was estimated using the
differentiated linearization method developed by Vandervaere et al. (1997) (Fig.
2.4b). According to this method, a saturated hydraulic conductivity (K) of 0.036

28 Capítulo 2
mm s-1 was calculated for our experimental soil from S and the TDR-measured
values of θi and θf (Fig. 2.4b).
The new TDR application would be particularly suitable in spatial and temporal
variability studies where both hydraulic and solute transport properties in
unsaturated soils are to be measured with tension disc infiltrometers at a large
number of sites in a short period of time. While one TDR-based disc infiltrometer is
automatically recording water flow at a site a new measuring site can be prepared.
Also, several TDR disc infiltrometers and TDR probes for measuring θ (t) below
the disc can be multiplexed and programmed to run simultaneously by using public
domain software for TDR system control such as WinTDR (Or et al., 1998) or
TACQ (Evett, 2000). Finally, the TDR disc infiltrometer can be run at different
tensions sequentially by refilling the water-supply reservoir with water or a tracer
solution without removal of the infiltrometer from the soil surface.
4. Conclusions
Three major conclusions can be drawn from the study. First, the TDR technique
developed for automated measurement of water level drop in Mariotte-type
reservoirs is simple to use, easy to implement and provides an accurate alternative
to visual or pressure transducer methods. Second, this technique can be used
successfully with tension disc infiltrometers to obtain reliable estimates of soil
hydraulic properties. Third, the new application allows for simultaneous TDR
recording of both water flow and the transient volumetric water content of soil
below the infiltrometer disc and the future possibility of integrating cumulative
infiltration and soil moisture measurements into a single TDR system.
References
Angulo-Jaramillo, R., Vandervaere, J.P., Roulier, S., Thony, J.L., Gaudet, J.P., Vauclin, M.,
2000. Field measurement of soil surface hydraulic properties by disc and ring

TDR disc infiltrometer 29
infiltrometers. A review and recent developments. Soil Tillage Res. 55, 1-29.
Ankeny, M.D., Kaspar, T.C., Horton, R., 1988. Design for an automated tension
infiltrometer. Soil Sci. Soc. Am. J. 52, 893-896.
Casey, F.X.M., Derby, N.E., 2002. Improved design for an automated tension infiltrometer.
Soil Sci. Soc. Am. J. 66, 64-67.
Dalton, F.N., 1992. Development of time-domain reflectometry for measuring soil water
content and bulk soil electrical conductivity. In: Topp, G.C., Reynolds, W.D., Green,
R.E. (Eds.), Advances in Measurement of Soil Physical Properties: Bringing Theory
into Practice. Special Publication No. 30, Soil Science Society of America, Madison,
WI. pp. 143-167.
Evett, S.R., 2000. The TACQ computer program for automatic time domain reflectometry
measurements: II. Waveform interpretation methods. Trans. ASAE 43, 1947-1956.
Ferré, P.A., Rudolph, D.L., Kachanoski, R.G., 1996. Spatial averaging of water content by
time domain reflectometry: implications for twin rod probes with and without
dielectric coatings. Water Resour. Res. 32, 271-279.
Heimovaara, T.J., 1993. Design of triple-wire time domain reflectometry probes in practice
and theory. Soil Sci. Soc. Am. J. 57, 1410-1417.
Jones, S.B, Wraith, J.M., and Or, D., 2002. Time domain reflectometry measurement and
applications. Hydrol. Process. 16, 141-153.
O’Connor, K.M., Dowding, C.H., 1999. Geomeasurements by Pulsing TDR Cables and
Probes. CRC Press, Boca Raton, FL.
Or, D., Fisher, B., Hubscher, R.A., Wraith, J., 1998. WinTDR 98 V.4.0 –Users Guide-.
Department of Plants, Soil and Biometeorology, Utah State University, Logan, UT.
Perroux, K.M., White, I., 1988. Designs for disc permeameters. Soil Sci. Soc. Am. J. 52,
1205-1215.
Schwartz, R.C., Evett, S.R., 2002. Estimating hydraulic properties of a fine-textured soil
using a disc infiltrometer. Soil Sci. Soc. Am. J. 66, 1409-1423.
Thomsen, A., Hansen, B., Schelde, K., 2000. Application of TDR to water level
measurement. J. Hydrol. 236, 252-258.
Topp, G.C., Davis, J.L., Annan, A.P., 1980. Electromagnetic determination of soil water
content: measurement in coaxial transmission lines. Water Resour. Res. 16, 574-582.

30 Capítulo 2
Vandervaere, J.P., Peugeot, C., Vauclin, M., Angulo-Jaramillo, R., Lebel, T., 1997.
Estimating hydraulic conductivity of crusted soils using disc infiltrometers and
minitensiometers. J. Hydrol. 188/189, 203-223.
Vogeler, I., Clothier, B.E., Green, S.R., Scotter, D.R., Tillman, R.W., 1996. Characterizing
water and solute movement by time domain infiltrometry and disk permeametry. Soil
Sci. Soc. Am. J. 60, 5-12.

Capítulo 3
Limitations of Tension Disc Infiltrometers for
Measuring Water Flow in Freshly Tilled Soil
D. Moret and J.L. Arrúe
Submitted to: Advances in Geoecology, CATENA-VERLAG Series


33
Limitations of Tension Disc Infiltrometers for Measuring
Water Flow in Freshly Tilled Soils
ABSTRACT
Knowledge of water transmission properties in fragile semiarid soils is crucial to
evaluate their physical response to sustainable land management practices. Tension
disc infiltrometers have become valuable tools for in situ estimates of soil surface
hydraulic properties in soil management and tillage studies, but when measurements
are made in loose soils near saturation supporting the weight of the infiltrometer with
a tripod or similar device has been suggested. This paper examines the influence that
the weight of the tension disk infiltrometer may have on the measurement of steady-
state flow (Q) in a cultivated loam soil under three field conditions: structured soil,
moldboard tilled soil, and rototilled soil. Infiltration tests were made using three disc
infiltrometer configurations providing a decreasing weight on the infiltration surface.
Results show that the weight of the infiltrometer affects Q only in freshly tilled soils.
Neither a reduction in the weight of the infiltrometer nor the use of a supporting device
alleviates the problem due to soil collapse under the infiltrometer at tensions close to
saturation. Tension disc infiltrometers should be used with caution for in situ
characterization of soil hydraulic properties in loose recently tilled soils.
1. Introduction
Physical degradation of dryland soils due to inadequate or intensive tillage in
arid and semiarid regions is largely dependent on the hydrodynamic processes
occurring at the soil surface (i.e. rainfall infiltration and runoff). Therefore, field
measurement of soil water transmission properties is important not only for
characterizing tillage-induced changes in soil structure, but also to evaluate
alternative management practices for soil and water conservation in fragile
agricultural lands.

34 Capítulo 3
Tension disc infiltrometers have become a standard tool for in situ estimates of
soil hydraulic properties (Angulo-Jaramillo et al, 2000). However, in most soil
tillage and management related studies tension infiltrometer measurements have
been made after the soil structure has to some extent stabilized (Ankeny et al.,
1990; Sauer et al., 1990; Coutadeur et al., 2002). Hence, the results cannot
completely reflect the water flow properties of the freshly tilled soil (Klute, 1982).
Actually, field measurement of soil surface hydraulic properties by disc
infiltrometry during the transient, unstable post-tillage condition may have
additional difficulties. For instance, when measurements in freshly cultivated soils
are made at supply water pressure heads (ψ) close to zero, the strength of the soil
may be not able to support the weight of the infiltrometer (White et al., 1992).
When this occurs, subsequent soil macrostructure collapse under the infiltrometer
can lead to negative values of hydraulic conductivity (K). In addition, inadequate or
changing hydraulic contact between the infiltrometer disc and the infiltration
surface may also result in unreliable low steady-state flow rates (Q). To alleviate
this problem and that due to macrostructure collapse as well, supporting the weight
of the infiltrometer with a large tripod or other methods has been recommended
(Reynolds, 1993).
The objective of this work was to evaluate the influence that the weight of the
tension disk infiltrometer may have on the measurement of Q in a cultivated loam
soil under three different soil structural conditions. An alternative disk infiltrometer
design for determining near-saturated K(ψ) in recently tilled soils is proposed.
2. Materials and methods
2.1.Tension infiltration procedures
Basically, a tension infiltrometer consists of three elements: a disc, a water
supply reservoir, and a bubbling tower with a moveable air-entry tube and a second
tube to supply air to the water reservoir. The pressure head (ho) is the difference of
Limitations of disc infiltrometer 35
height h2-h1, where h2 is the height from the base of the disc to the air-entry plane in
the water supply reservoir and h1 is the height between the bottom of the air-entry
tube and the water level in the bubble tower (Angulo-Jaramillo et al., 2000).
Normally, these three elements are integrated into a single configuration, but some
commercial infiltrometers (based in the design of Ankeny et al., 1988), in which air
flows directly from the bubbling tower to the water reservoir, can work with the
disc separated from the water supply tower. This option substantially reduces the
weight of the disc infiltrometer.
Three types of tension infiltrometers, home made following the design of
Perroux and White (1988) and providing three different weights on the infiltration
surface, were used in our experimentation. Their basic characteristics and the
experimental procedure that we choose were the following.
i) Mode 1. A compact 0.25-m tension disc infiltrometer in which the drop of
water level in the water supply reservoir is automatically registered using a
three-rod time domain reflectometry (TDR) probe placed in the centre of
the water reservoir and connected to a TDR pulser as described by Moret et
al. (2002) (Capítulo 2, Fig. 2.1). This infiltrometer has a total weight of 2.56
kg when the supply reservoir is empty and 4.35 kg when the reservoir is full
of water.
ii) Mode 2. To reduce the weight on the infiltration surface, the TDR-based
disc infiltrometer used in Mode 1 was modified to work with both the water
supply reservoir and bubbling tower separated from the infiltrometer disc
(Fig. 3.1). This new prototype consists of a triple mariotte system in which
h2 is kept constant and fully independent of the disc base position with
respect to the water supply reservoir. In this case, the weight of the
infiltration element (disc plus mariotte tube) is 0.93 kg when the mariotte
tube is empty and 1.29 kg when this reservoir is full of water. Thus, the
weight on the infiltration surface was reduced by about 70% as compared to

36 Capítulo 3
AirWater
Moveable air-entry tube
Bubble towerWater reservoir
Disc
Shut-off valve
Mariottecolumn
Three-rodTDR probe
Water level
To TDR cable tester
50 coaxial cable
Ω
Air outlet
Water inlet
h2
Figure 3.1. Schematic diagram of a tension disc infiltrometer with the water supply reservoir and the bubbling tower separated from the infiltrometer disc (Mode 2).

Limitations of disc infiltrometer 37
Mode 1.
iii) Mode 3. In order to eliminate entirely the weight on the infiltration surface,
measurements were made with the infiltrometer shown in Fig. 3.1 (Mode 2)
but placing beneath the infiltrometer disc a supporting element consisting of
a 28 x 60 cm piece of a rigid thin wire mesh with rectangular openings of 2
x 4 cm. This template was actually placed between the base of the disc and
the thin layer of sand (80-160 µm grain size) poured at the soil surface to
ensure hydraulic contact between the disc and the soil.
2.2.Field measurements
The study was conducted at the Estación Experimental de Aula Dei (CSIC)
dryland research farm located in Peñaflor, in semiarid Central Aragón (NE Spain)
(41º44’N, 0º46’W). Infiltration tests were made on a 30 x 80 m experimental field
on the surface of a loam soil (fine-loamy, mixed thermic Xerollic Calciorthid).
More details on the experimental site and soil can be found in López et al. (1996).
Q measurements were performed using the three infiltrometers above described
under three different soil structural conditions:
i) Soil structured and consolidated eight months after the harvest of a barley
crop grown under cereal-fallow rotation; mean dry bulk density (ρb) for the
topsoil (0-5 cm depth) was 1.24 g cm-3.
ii) Soil disturbed after a pass with a moldboard plough (ρb = 1.18 g cm-3).
iii) Soil loose and highly pulverized after a pass with a rototiller (ρb = 0.87 g
cm-3).
For each soil condition and infiltration mode, Q measurements were made at six
points randomly selected across the corresponding sampling area. At each sampling
point, the infiltration tests were conducted on three spots successively 20 cm apart
along the tillage direction. Each infiltrometer was run to steady state at four
tensions (nominally -14, -4, -1 and 0 cm, applied in that order and at the same

38 Capítulo 3
place) and K estimated according to Reynolds and Elrick (1991). The initial soil
bulk density at the surface (0-5 cm depth) was measured nearby on 5 cm diameter
(98.2 cm3) undisturbed cores.
3. Results and dicussion
Figure 3.2 presents the variation of steady-state flow rate (Q) as a function of
pressure water head (ψ) obtained with the different tension infiltrometers under the
three soil strength conditions considered in our study.
When the soil is somewhat structured the three measurement techniques yield
similar values of Q (Fig. 3.2a). Although slightly higher values are obtained at all
tensions when Mode 3 (zero weight) is used, it appears that tension infiltrometer
measurements are not affected by the weight of the infiltration element in this
particular soil condition. Whatever infiltration procedure is used, Q(ψ) follows an
exponential curve similar to the piecewise exponential relationship described by
Reynolds and Elrick (1991) for estimating K(ψ ). As discussed by these authors,
K(ψ) depends on yx,α , which is the slope of the piecewise linear plot of the natural
log of the steady-state flow rate (lnQ) versus the pressure water head (ψ) on the
infiltration surface [ yx,α = ln(Qx/Qy) / (ψx -ψy), where x = 1, 2, 3, ... and y = x +1].
On the other hand, yx,α is the average value of α over the relevant ranges of ψ,
and α is a soil texture/structure parameter measuring the relative importance of the
gravity and capillarity forces during water flow in unsaturated soil (Reynolds and
Elrick, 1991). Therefore, the performance of the different infiltration devices can be
tested by analyzing the behaviour of yx,α (Table 3.1). Thus, for all the infiltration
runs conducted in the consolidated soil, yx,α increases as the tension decreases as
required by the theory.
On the contrary, in a freshly mouldboard plowed soil, with large clods and a
more weak structure, the effect of the weight of the infiltrometer on Q

Limitations of disc infiltrometer 39
Fig
ure
3.2.
Rel
atio
nshi
p be
twee
n st
eady
-sta
te f
low
rat
e (
Q)
and
pr
essu
re
pote
ntia
l (
ψ)
obt
aine
d o
n th
e su
rfac
e of
a
loam
soi
l w
ith i
nitia
l dr
y bu
lk d
ensi
ty (
ρ b)
valu
es o
f 1.
24 (a
), 1
.18
(b),
and
0.
87 g
cm
-3 (
c),
by u
sing
thr
ee t
ensi
on d
isc
infi
ltrom
eter
s (
Mod
e 1,
êê;
Mod
e 2,
cc ;
and
Mod
e 3,
ΟΟ).
Bar
s re
pres
ent
LSD
(P
< 0
.05)
fo
r co
mpa
riso
n am
ong
disc
in
filtr
omet
ers
at t
he s
ame
tens
ion
and
soil
con
diti
on ,
whe
re
sign
ific
ant
dif
fere
nces
w
ere
fou
nd
usin
g t
he
Dun
can´
s m
ultip
le r
ange
test
.
-15
-10
-50
-15
-10
-50
02e-3
4e-3
6e-3
8e-3
-15
-10
-50
ab
c
ψ (
cm)
ψ (
cm)
ψ (
cm)
Q (cm s)3-1

40 Capítulo 3
T
able
3.1
. Ave
rage
val
ues
of th
e pi
ecew
ise
line
ar s
lope
(
x,y
α )
betw
een
adja
cent
(ψ
,Q)
data
pai
rs (
Fig.
3.2
) an
d K
(ψ)† c
alcu
late
d ac
cord
ing
to R
eyno
lds
and
Elr
ick
(199
1) f
or t
he t
ensi
on d
isc
infi
ltro
met
ers
and
soil
con
diti
ons
used
in th
is s
tudy
.
Soil
Ten
sio
n d
isc
infi
ltro
met
er‡
4,14
1,4
α
0,1
K1
4
K4
K
1
K0
m-1
mm
h-1
M
ode
1
12.6
42
.6
84.8
2
.1b§
11.4
b
52.2
a 1
15.2
a
Mod
e 2
12
.2
41.5
93
.8
2.3
b 11
.8b
50
.4a
126
.0a
Stru
ctur
ed s
oil
(ρb
= 1.
24 g
cm
-3)
Mod
e 3
12
.1
43.6
69
.5
3.2
a 18
.0a
64
.8a
133
.2a
Mod
e 1
15
.4
23.4
21
.1
8.6
b 43
.2a
84
.1b
108
.0b
M
ode
2
16.5
21
.9
15.9
7
.2b
46.8
a
82.8
b
97.2
b
Dis
turb
ed s
oil
(mou
ldbo
ard
)
( ρb
= 1.
18 g
cm
-3)
Mod
e 3
13
.9
23.6
28
.7
1
0.8a
54
.0a
115
.2a
151
.2a
Mod
e 1
15
.6
31.8
28
.8
3.6
b 28
.8b
75
.6b
104
.4a
M
ode
2
15.7
40
.9
33.6
4
.8b
32.4
b 1
00.8
b 1
47.6
a
Stru
ctur
eles
s so
il (r
otot
illed
)
(ρb
= 0.
89 g
cm
-3)
Mod
e 3
16
.2
41.5
11
.2
7.2
a 43
.2a
212
.4a
115
.2a
αα
plou
ghed
† H
ydra
ulic
con
duct
ivity
mea
sure
d at
pre
ssur
e he
ad v
alue
s of
0, -
1, -
4, a
nd –
14 c
m (
deno
ted
K0,
K1,
K4,
and
K14
).
‡ T
he th
ree
disc
infi
ltrom
eter
con
figu
ratio
ns u
sed
prov
ided
a d
ecre
asin
g w
eigh
t on
the
infi
ltrat
ion
surf
ace
(Mod
e: 4
.35
kg; M
ode
2: 1
.29
kg; M
ode
3: 0
kg)
; see
Mat
eria
l and
Met
hods
for
det
ails
§
Val
ues
in th
e sa
me
colu
mn
follo
wed
by
the
sam
e le
tter
are
not s
igni
fica
ntly
dif
fere
nt a
t P<
0.05
(D
unca
n’s
test
).

Limitations of disc infiltrometer 41
measurements near saturation is clearly shown in Fig. 3.2b. The mean value of Q
obtained with zero weight on the soil surface (Mode 3) at tensions of –1 and 0 cm
was significantly higher as compared to Mode 1 and Mode 2 infiltrometers. The
exponential form of the Q(ψ) relationship is present only in Mode 3, in which yx ,α
increases with a decreasing ψ. For Modes 1 and 2, in contrast, yx ,α decreases for the
step between ψ = -1 cm and ψ = 0 cm. This anomalous behaviour can be explained
by a soil macrostructure collapse under the infiltrometer disc caused by the weight
of the infiltrometer, even though this weight is low as in the case the bubble tower
and the water supply reservoir are separated from the infiltrometer disc (Mode 2).
This fact is much more evident when measurements are made in a structureless soil
like our experimental highly pulverised rototilled soil (Fig. 3.2c). In this loose soil
condition Q values were in general lower than those for the mouldboard tilled soil.
At tensions close to zero, Q decreases as the weight of the infiltrometer increases
and again yx ,α decreases rather to increase. However, the variation of Q vs.ψ is
markedly different for Mode 3 (zero weight) infiltrations: Q barely increases
between ψ = -1cm and ψ = 0 cm (Fig. 3.2c), which determines the abrupt decline of
yx ,α as soil becomes saturated (Table 3.1). This conduct is due to the subsidence of
soil under the supporting mesh during the infiltration as it was clearly observed in
the field after removing the infiltrometer at the end of the infiltration run. This
natural phenomenon is illustrated by the example of cumulative infiltration shown
in Fig. 3.3. The inflection point after about three minutes of infiltration determines
the moment at which the soil naturally collapses and the hydraulic contact between
the soil surface and the disk is partially broken down, thus leading to unreliable low
values of Q. Figure 3.4. shows an example of soil collapse during (Fig. 3.4a) and at
the end (Fig. 3.4b) of infiltration at saturation with disc infiltrometer Mode 3 on a
structureless soil. Consequently, inconsistent estimates of K(ψ) can be obtained. In
our study, for instance, the values of hydraulic conductivity at saturation (K0) in

42 Capítulo 3
Time (s)0 100 200 300 400 500
Cum
ulat
ive
infil
tratio
n (m
m)
0
100
200
300
400
500
600
700
800Steady state-flow
Soil collapse
Figure 3.3. Cumulative infiltration at saturation (ψ = 0) on a structureless rototilled loam soil measured by using the tension disc infiltrometer shown in Fig. 3.1 with a supporting wire mesh beneath the disc (Mode 3).
Figure 3.4. Soil collapse during (a) and at the end (b) of infiltration at saturation with disc infiltrometer Mode 3 on a structureless soil.
Limitations of disc infiltrometer 43
freshly tilled soil are equal or even lower than those calculated for a consolidated
soil (Table 3.1). Although the tension infiltrometers tested in our study did not
provide a satisfactory performance in recently tilled soils, the use of an infiltrometer
with the bubbling tower and the supply reservoir separated from the disc (Mode 2)
can be more reliable under certain circumstances. In this new design, the
experimental errors arising from an inadequate setting of the tension (ho),
particularly near saturation, are eliminated. The height h1 is fixed at the bubbling
tower without any manipulation on the infiltrometer disc and h2 is constant
regardless the position of the disc with respect to the water supply reservoir (Fig.
3.1).
In conclusion, the results of this study demonstrate that tension disc
infiltrometers should be used with caution for in situ characterization of soil
hydraulic properties in recently tilled soils. Neither a reduction in the weight of the
infiltrometer nor the use of a supporting device, as previously suggested, overcomes
the problem due to soil collapse under the infiltrometer when measurements are
made at tensions close to saturation. Our results show how this factor leads to an of
the steady-state water flow (Q) and, correspondingly, to inaccurate estimates of K
and related hydraulic parameters. Further research aimed to the development of new
simple and accurate methods for field characterization of hydraulic properties in
freshly tilled soils is needed.
References
Angulo-Jaramillo, R., Vandervaere, J.P., Roulier, S., Thony, J.L., Gaudet, J.P., Vauclin, M.,
2000. Field measurement of soil surface hydraulic properties by disc and ring
infiltrometers. A review and recent developments. Soil Till. Res. 55, 1-29.
Ankeny, M.D., Kaspar, T.C., Horton, R., 1988. Design for an automated tension
infiltrometer. Soil Sci. Soc. Am. J. 52, 893-896.
Ankeny, M.D., Kaspat, T.C., Horton, R., 1990. Characterization of tillage and traffic effects
on unconfined infiltration methods. Soil Sci. Soc. Am. J. 54, 837-840.

44 Capítulo 3
Coutadeur, C., Coquet, Y., Roger-Strade, J., 2002. Variation of hydraulic conductivity in a
tilled soil. Eur. J. Soil Sci. 53, 619-628.
Klute, A., 1982. Tillage effects on the hydraulic properties of soil: a review. In: Unger, P.W.
and Van Doren, D.M. Jr. (Eds), Predicting Tillage Effects on Soil Physical Properties
and Processes. ASA Special Publication No. 44, pp. 29-43.
López, M.V., Arrúe, J.L., Sánchez-Girón, V., 1996. A comparison between seasonal
changes in soil water storage and penetration resistance under conventional and
conservation tillage systems in Aragon, Soil Till. Res. 37, 251-271.
Moret, D., López, M.V., Arrúe, J.L., 2002. Application of TDR to water flow measurements
using tension disc infiltrometers. In: Villalobos, F.J. and Testi, L. (Eds.), Proc. VII
Congress of the European Society for Agronomy, 15-18 July 2002, Córdoba, Spain.
Junta de Andalucía, Servicio de Publicaciones y Divulgación, pp. 389-390.
Perroux, K.M., White, I., 1988. Designs for disc permeameters. Soil Sci. Soc. Am. J. 52,
1205-1215.
Reynolds, W.D., 1993. Unsaturated hydraulic conductivity: field measurement. In: Carter,
M.R. (Ed.), Soil Sampling and Methods of Analysis. Lewis Publishers, pp. 633 - 644.
Reynolds, W.D., Elrick, D.E., 1991. Determination of hydraulic conductivity using a tension
infiltrometer. Soil Sci. Soc. Am. J. 55, 633-639.
Sauer, T.J., Clothier, B.E., Daniel, T.C., 1990. Surface measurements of the hydraulic
properties of a tilled and untilled soil. Soil Till. Res. 15, 359-369.
White, I., Sully, M.J., Perroux, K.M., 1992. Measurement of surface-soil hydraulic
properties: disk permeameters, tension infiltrometers, and other techniques. In: Topp,
G.C., Reynolds W.D., and Green R.E. (Eds.), Advances in Measurement of Soil
Physical Properties: Bringing Theory into Practice. SSSA Special Publication No. 30,
Soil Science Society of America, Madison, WI. USA, pp. 69-103.

Capítulo 4
Dynamics of Soil Hydrophysical Properties During
Fallow as Affected by Conventional and Conservation
Tillage Systems
D. Moret and J.L. Arrúe
To be submitted to: Soil Science Society of America Journal


47
Dynamics of Soil Hydrophysical Properties During Fallow as
Affected by Conventional and Conservation Tillage Systems
ABSTRACT
There is limited information on the effects of conservation tillage practices on soil
hydraulic property changes during long-fallowing (16-18 months) in rainfed cereal-
fallow cropping systems of semiarid central Aragon (NE Spain). Reduced tillage with
chisel ploughing (RT) and no-tillage (NT), were compared with conventional
mouldboard ploughing (CT) on a fallow loam soil (Xerollic Calciorthid) over three
long fallow periods. After 8-10 years of trial in a long-term tillage experiment,
measurements of hydrophysical properties were taken before and immediately after
primary tillage, after post-tillage rains and at the end of fallow. Soil bulk density, ρρb,
soil water retention curve, θθ(ψψ), and soil hydraulic conductivity, K(ψψ), at –14, -4, -1 and
0 cm pressure head and related hydraulic parameters were measured at 2 and 40 cm
depth. Compared with CT and RT, NT plots presented more compacted topsoil, which
resulted in a lower water content at saturation and a lower available water-holding
capacity. Regardless of tillage, soil water flow at 2 cm depth was mainly regulated by
macropores, despite this pore fraction represents a small fraction of total porosity.
Athough a larger macropore size was observed under NT, K under this treatment was
significantly lower than under CT and RT due to a lower number of water
transmitting pores per unit area. Overall, no significant differences in hydraulic
properties were found between CT and RT. The lower K at 40 cm depth in these
treatments agreed with corresponding higher ρρb values at that depth. In the short
term, soil loosening by tillage increased the aeration porosity (pores > 300 µµm) and

48 Capítulo 4
decreased available water retention micropores (30-0.2 µµm pores). Tillage also
increased the number of water conducting mesopores, which increased K. Soil
reconsolidation following post-tillage rains decreased total porosity, with a reduction
of large pore-size fractions and K. These changes, which tended to restore pre-tillage
soil structural conditions, increased with the intensity of rainfall events. Inconsistencies
in estimating hydraulically active pore characteristics were analysed and an
alternative pore index proposed. The use of this index to calculate the concentration of
water transmitting pores and effective porosity showed an overestimation of these
parameters when using the capillary rise approach.
1. Introduction
Soil water conservation is a critical issue for the sustainability of agricultural
systems in semiarid dryland grain-growing areas in Central Aragon (NE Spain),
where farmers traditionally rely on the cereal-fallow rotation to capture out-of-
season rainfall during a 16-18 month period of fallow to supplement that of the
growing season. However, in rainfed farming areas soil water balance and its
components (i.e., evaporation, transpiration, water storage and drainage) during
fallow depend not only on the soil type and rainfall pattern, but also on the water
retention and transmission properties of soil (Lampurlanés et al., 2002). Tillage and
rainfall events alter the structure of the topsoil layers and consequently their
hydrophysical properties thus modifying the soil water regime. Thus, in order to
define sustainable management practices for maintaining a favourable soil water
budget for optimal crop growth and development, surface measurements of
hydraulic properties under field conditions appear to be of paramount importance. It
is precisely at the soil surface and in the few centimeters below where the soil
hydrophysical conditions play an important role in partitioning incident water into
either runoff or infiltration. For the latter, the absorption and transmission properties
of the surface soil dictate the pattern of water entry and storage into the soil
(Vauclin et al. 1994).

Dynamics of soil hydrophysical properties 49
With regard to tillage effects on soil hydrophysical properties under well-
structured soil conditions, a higher compaction in soil managed under no-tillage,
compared with tilled soil, has been observed in a large number of tillage
comparison studies (Pikul, et al., 1993; López et al., 1996; Moreno et al., 1997;
Evett et al., 1999; Arvidsson, 1998). This compaction reduces the fractions of large
pores and makes the water retention curves under no-tillage to present a more
gradual reduction in water content as tension increases and lower water contents
close to saturation (Azooz et al., 1996; Evett et al., 1999; Schwartz et al., 2003). In
other studies conducted to evaluate the impact of different tillage systems on soil
water transmission properties, results for the different tillage treatments are not
always consistent across locations, soils and experiment designs (Green et al.,
2003). Thus, whereas Chan and Heenan (1993) and McGarry et al. (2000), among
others, reported higher infiltration rates under no-tillage relative to tilled treatments,
due to a greater number of macropores (Logdson et al., 1990), increased fauna
activity and accumulated organic matter forming a litter of residues (Logdson and
Kaspar, 1995), other researchers found similar (Sauer et al., 1990) or lower (Miller
et al., 1998; Evett et al., 1999) values of K under no-tillage. Similarly, in other
studies where reduced tillage was compared with mouldboard ploughing (Logsdon
et al., 1993; Moreno et al., 1997), minimum tillage provided the highest values of
K, due to a different pore size distribution in the surface layer rather to total
porosity (Moreno et al., 1997). However, the characterisation of water transmitting
pore size fractions by examining the relative increase of K over a decreasing range
of soil water tension (ψ) (Reynolds et al., 1995), indicates that, in general,
macropores in structured soils have a large influence upon water flow despite the
fact they occupy a very small fraction of total porosity (Sauer et al., 1990; Reynolds
et al., 1995; Angulo-Jaramillo et al., 1997; Cameira et al., 2003). On the other hand,
differences in K have been observed along the soil profile (Moreno et al., 1999;
Cameira et al., 2003).
50 Capítulo 4
In spite of the large number of field studies conducted to evaluate tillage effects
on hydraulic functioning of structured soils, these studies have been generally
performed over the crop growing season. On the contrary, the information available
in the literature about short-term tillage-induced effects on hydrophysical properties
of agricultural soils and their dynamics over the fallow period is very scarce (Green
et al., 2003). Results from studies on this subject have shown that loosening of
surface soil by tillage operations increases the total soil porosity (Logsdon et al.,
1999; Miller et al, 1998; Green et al., 2003) through both an increase in the pore
volume at the wet end of the soil water retention curve (Mapa et al., 1986; Ahuja et
al, 1998) and a decrease in the pore fractions corresponding to small pressure heads
(Mapa et al., 1986). On the other hand, although a destruction of macropores and
macropore continuity is probable after tillage (Malone et al., 2003), an increase of K
has been commonly observed in recently tilled soils (Messing and Jarvis, 1993),
probably as a consequence of an increase in the number of active mesopores.
Tillage operations, however, have a transitory effect on soil physical characteristics
because of rain impact on the freshly tilled soil, which promotes a steady
breakdown of soil structure (Green et al., 2003). Thus, soil structural changes in
recently tilled soil by precipitation and associated wetting and drying cycles lead to
a destruction of the largest pores while keeping constant and sometimes even
increasing the frequency of smallest ones (Rousseva et al., 2002). A decrease in K
following rainfall after tillage has also been observed (Cameira et al., 2003;
Schwartz et al., 2003). This can be attributed to a reduction in the fraction of
conductive mesopores (Messing and Jarvis, 1993), in agreement with a concomitant
increase in bulk density (Mellis et al., 1996). However, as recently reviewed by
Green et al. (2003), further research is needed to improve current knowledge on
tillage influence on soil hydrophysical properties of freshly tilled soils.
The present work is part of a long-term conservation tillage experiment initiated
in 1989 to assess soil and crop responses under different tillage systems in a dryland

Dynamics of soil hydrophysical properties 51
semiarid cereal-growing area of Central Aragon. The study was aimed: i) to
evaluate the effect of conventional and conservation tillage systems on soil bulk
density, water retention and hydraulic conductivity after 8-10 years of trial; and ii)
to quantify the dynamics of those soil hydrophysical properties over three long-
fallow periods.
2. Materials and methods
2.1. Experimental site and procedures
The site is located at the dryland research farm of the Estación Experimental de
Aula Dei (CSIC) in the Zaragoza province (latitude 41º 44’N; longitude 0º 46’W;
altitude 270 m). The climate is semiarid with an average annual precipitation of 390
mm and an average annual air temperature of 14.5 ºC. Soil at the research site is a
loam (fine-loamy, mixed thermic Xerollic Calciorthid) according to the USDA soil
classification (Soil Survey Staff, 1975). Particle size distribution for the plough
layer (0-40 cm) averages 25% clay, 47% silt and 28% sand. Selected soil physical
and chemical properties for that layer were given in López et al. (1996).
The study was conducted on two adjacent large blocks of plots, which were set
up on an area nearly level in 1991 (Field 1) and 1992 (Field 2) within a long-term
conservation tillage experiment initiated in 1989. The two fields were in a winter
barley (Hordeum vulgare L.)-fallow rotation, with each field cropped in alternate
years. This study was conducted when both fields were in the long-fallow phase of
this rotation, which extends from harvest (June-July) to sowing (November-
December) on the following year. Field measurements were made during three
fallow seasons: 1999-2000 and 2001-2002 fallows in Field 2, after 8 and 10 years of
the trial, and 2000-2001 fallow in Field 1, after 10 years of the trial (Fig. 4.1a).
Three different fallow management treatments were examined: conventional
tillage (CT), reduced tillage (RT) and no-tillage (NT). The CT treatment consisted
of mouldboard ploughing of fallow plots to a depth of 30-40 cm in late winter or

52 Capítulo 4
020406080 01/1
1/99
01
/03/
00
01/0
7/00
01
/11/
00
01/0
3/01
01
/07/
01
01/1
1/01
01
/03/
02
01/0
7/02
01
/11/
02
0.0
0.1
0.2
0.3
T
M
T
m
tt
t
m rM
*I
a b
Mm
Fal
low
199
9-20
00 (
Fie
ld 2
)F
allo
w 2
000-
2001
(F
ield
1)
Fal
low
200
1-20
02 (
Fie
ld 2
)
0-20
cm N
TR
TC
T
M*
M*
I MM R
M*
R*
M*
R*
M R I M
T
Rainfall (mm) θ(m m)3-3
Fig
ure
4.1.
a)
Tim
ing
of r
ainf
all
and
till
age
prac
tice
s (T
, pri
mar
y til
lage
; t,
sec
onda
ry t
illa
ge)
in r
elat
ion
to s
oil
prop
erty
m
easu
rem
ent
date
s un
der
conv
enti
onal
til
lage
(C
T),
red
uced
til
lage
(R
T)
and
no-t
illag
e (N
T)
trea
tmen
ts d
urin
g th
ree
fallo
w s
easo
ns (
M,
infi
ltra
tion
and
bul
k de
nsit
y m
easu
rem
ents
at
2 cm
dep
th;
m,
ibid
. at
40
cm d
epth
; I,
infi
ltra
tion
m
easu
rem
ents
at s
atur
atio
n on
sur
face
-cru
sted
soi
l; R
, wat
er r
eten
tion
cur
ve d
eter
min
atio
n at
5 c
m d
epth
; r, i
bid.
at 4
5cm
; * , m
easu
rem
ents
tak
en o
nly
unde
r C
T a
nd R
T).
b)
Tim
e co
urse
of
volu
met
ric
wat
er c
onte
nt i
n th
e su
rfac
e so
il (
0-20
cm
) un
der
CT
, R
T a
nd N
T t
reat
men
ts.
Bar
s re
pres
ent
LSD
(P
< 0
.05)
for
com
pari
son
amon
g ti
llag
e tr
eatm
ents
whe
re
sign
ific
ant d
iffe
renc
es w
ere
foun
d.

Dynamics of soil hydrophysical properties 53
early spring, followed by secondary tillage with a sweep cultivator to a depth of 10-
15 cm in late spring. In the RT treatment, primary tillage was chisel plowing to a
depth of 25-30 cm (non-inverting action), followed, as in CT, by a pass of sweep
cultivator in late spring. Dates of both primary and secondary tillage operations,
that were the same for the CT and RT treatments, corresponded with 25 April 2000,
10 April 2001 and 13 March 2002 for primary tillage and 29 May 2000, 6 June
2001 and 11 June 2002 for secondary tillage for the 1999-2000, 2000-2001and
2001-2002 fallow period, respectively (Fig. 4.1a). NT used exclusively herbicides
(glyphosate) for weed control throughout the fallow season.
Tillage treatments were arranged in an incomplete block design based on
geostatistical concepts, with three replications for the RT and NT treatments and
four for the CT treatment to ensure a balanced design (López and Arrúe, 1995). The
size of the elemental plot was 33.5 m x 10 m, with a separation of 1 m between
plots. Within each incomplete block a 7 m x 7 m region was delimited for either
sampling or in situ measurement of the different soil properties considered in the
study. Two observation points exist in each region, one per treatment. The distance
between points was 5 m for all regions (López and Arrúe, 1995). With this
sampling scheme, a total of 18 measurements (6 per treatment) were made on each
fallow field per soil property, sampling depth and observation date. To compare the
effects of tillage treatments, analysis of variance (ANOVA) for the incomplete
block design was used (López and Arrúe, 1995). To compare the temporal effect of
tillage practices along the fallow a simple analysis of variance (ANOVA) for each
tillage treatment was used.
2.2. Experimental measurements
Field measurements of hydrophysical properties were made at four dates during
the second year of the fallow period: (a) before primary tillage implemented in
January-February (this set of measurements will be called pre-tillage); (b) after

54 Capítulo 4
primary tillage but before any post-tillage rainfall events had occurred (this set of
measurements made in freshly tilled soil in March-April will be called post-tillage);
(c) after primary tillage but following a period of intermittent rainfall events in
April-May (post-tillage+rain); and (d) during the last phase of the fallow period
after secondary tillage practices, at the end of August (late fallow). The schedule of
main soil property measurements in relation to tillage operations and rainfall events
is shown in Fig. 4.1a. For the 1999-2000 fallow season, field measurements in
freshly tilled soil were not possible due to a rain of 25 mm received on 26-27 April
2000, immediately after primary tillage (Fig. 4.1a). For each observation region and
treatment, all the measurements were concentrated in a small area of ≈ 1 m2.
Daily rainfall data were continuously registered with a datalogger (model CR10,
Campbell Scientific Inc.) from an automatic weather station located at the
experimental site.
2.2.1. Bulk density and moisture content
Soil dry bulk density (ρb) was determined by the core method (Grossman and
Reinsch, 2002), with core dimensions of 50 mm in diameter by 50 mm height. Core
samples were taken at 2 and 40 cm depth nearby the hydrophysical property (i.e.
infiltration and water content-matric potential relationship) measurement locations.
This sampling was made on the same day as infiltration measurements in order to
determine the antecedent soil bulk density and moisture. The volumetric water
content (θ ) was determined from gravimetric soil moisture (oven drying the soil at
105ºC) and bulk density values. Total soil porosity (ξ) was calculated from
measured bulk density (ρb) and particle density (ρs) (ρs = 2.65 g cm-3) as: ξ = 1-
(ρb/ρs). The bulk density of the surface crust (0 - 1 cm depth) was also measured at
the end of the 2001-2002 fallow (November) by the clod method (Grossman and
Reinsch, 2002) using paraffin wax as coating agent.

Dynamics of soil hydrophysical properties 55
During the three experimental fallow periods, the volumetric water content in
the 0-20 cm soil layer was continuously monitored by Time Domain
Reflectometry (TDR). We used probes of two parallel stainless steel rods
(diameter: 4 mm; length: 250 mm; spacing between rod centers: 50 mm), which
were inserted vertically into the soil to a depth of 20 cm (Ferré and Topp, 2002).
The protruding TDR electrode pair were connected to a cable tester (model
1502C, Tektronix) by means of a quick disconnect type interface housing a 50-
200 Ω impedance matching pulse transformer (Dalton, 1992). Waveforms were
transferred to a laptop with a SP232 serial communication module and analysed
using the software WinTDR’98 (Or et al., 1998). The volumetric water content
was obtained using the model proposed by Topp et al. (1980), which proved to be
suitable for our soil in a previous laboratory calibration experiment.
2.2.2. Soil water retention
The water content-matric potential relationship, θ (ψ ), was determined during
draining at 5 and 45 cm depth during the 2001-2002 fallow period on Field 2. For
the 0 to –50 kPa range, simultaneous field measurements of θ and ψ were taken at
four dates (Fig. 4.1a). Three-rod probes (diameter: 4 mm; length: 100 mm; spacing
for the outermost rods: 30 mm) were used to measure θ by TDR as described above.
The matric potential ψ was measured using microtensiometers (model SMS
2030S3, SDEC) 30 cm long, having a porous ceramic cup 30 mm long with an
external diameter of 12 mm. The tensiometers, with a bubbling pressure of -150
kPa, were previously calibrated in the laboratory and read in the field using pressure
transducers (model 26PCDFA6D, Microswitch, Honeywell) with an upper range
limit of 207 kPa.
After appropriate trenching to prepare the measurement area at each location
(Bruce and Luxmoore, 1986), both sensors were inserted horizontally at the
measurement depth, with a separation of 5 cm to avoid measurement interference.

56 Capítulo 4
A plastic 12 x 16 cm plastic frame was driven into the soil to a depth of about 1 cm
to serve as a dike and to allow ponding of water over the surface and wetting a soil
volume enough to include the sphere of influence of both sensors. Water was then
added until a thorough saturation of soil to the desired depth was achieved, which
was indicated by constancy in tensiometer readings. After a first simultaneous
measurement of θ and ψ under this initial saturation condition, water application
was ceased and free drainage allowed. Readings of θ and ψ were frequently taken
during early drainage (i.e. first 20 minutes) and then after 6, 24, 32 and 48 hours of
drainage.
Additionally, soil water retention at – 100, -500 and –1500 kPa was measured in
the laboratory on 2 mm sieved soil samples using a pressure membrane extractor
(model 1000, Soilmoisture Equipment Corp.). The gravimetric water content values
were converted to volume basis using the bulk density values obtained for the same
depth at the different measurement dates. Finally, soil water retention curves were
obtained by fitting the observed data to the van Genuchten (1980) model. Pore-size
distributions were inferred from the soil water retention data using the capillary
theory and pore size categories defined by De Leenheer (cited by Cresswell et al.,
1993).
2.2.3. Soil hydraulic properties
Field soil hydraulic property characterization was achieved at each observation
point using a modified Perroux and White (1988) tension disc infiltrometer with a
base radius of 125 mm as described by Moret et al. (200x) for structured soils
(Capítulo 2) and Moret and Arrúe (200x) for freshly tilled soils (Capítulo 3).
Infiltration measurements on the soil surface were done on areas cleared of large
clods, crop residue and surface crust when formed, and brushed smooth enough to
ensure a good hydraulic contact between the disc and the soil. To this end, a thin
layer of commercial sand (80-160 µm grain size) was also poured at the soil

Dynamics of soil hydrophysical properties 57
surface. On average, surface measurements were taken at 2 cm depth. Infiltration
measurements below the plough layer were taken at 40 cm depth (Fig. 4.1a). The
base of the disc was covered with a nylon cloth of 20-µm mesh. Infiltration runs
were performed at four ψ values (namely, -14, -4, -1, and 0 cm, applied in that order
and at the same place). Flow monitoring continued until attainment of steady-state
flow from the disc. Flow readings were automatically recorded every 30 seconds
from the water level drop on the water supply reservoir of the infiltrometer using
the TDR application and procedure developed by Moret et al. (200x) (Capítulo 2).
For each sampling date, infiltration runs at the 18 sampling points were
accomplished in 2 days by working simultaneously with two tension disc
infiltrometers connected to a multiplexer (model SDMX50, Campbell Scientific
Inc.).
The soil hydraulic conductivity, K, at the different water pressure heads (K14, K4,
K1, and K0) was obtained from cumulative infiltration using the multiple-head
method (Ankeny, 1992) based on Wooding’s (1968) equation for steady-state
asymptotic flux. Sorptivity at saturation, So, was determined following the approach
of White and Sully (1987). The hydraulic conductivity of the surface crust (Kc) was
determined at saturation according to the Vandervaere et al. (1997) procedure for
crusted soils.
The representative mean pore radius, λψ, which represents an effective
“equivalent mean” pore radius that conducts water when infiltration occurs at a
given value of ψ (White and Sully, 1987), was calculated according to Ankeny
(1992)
( ) ( )φρσλψ gK /= (4.1)
where σ (g s-2) is the surface tension of water, ρ (g cm-3) is the density of water, g
(cm s-2) is the acceleration due to gravity and φ is the matric flux potential. The

58 Capítulo 4
number of λψ pores per unit area of infiltration surface, Nψ, required to produce the
measured K was estimated using the Poiseuille’s law for flow in a capillary tube
( ) ( )4/8 ψψ πλρµ gKN = (4.2)
where µ (g cm-1 s-1) is the dynamic viscosity of water (Reynolds et al., 1995).
In order to determine the contribution of each pore class to flow, we have
defined the “representative mean pore radius for two consecutive soil water
tensions”, λ∆ψ, as
)(
)(
1
1
−
−∆ −
−=
ii
ii
g
KK
φφρσ
λ ψ i = 1, 2, …n (4.3)
where n is the number of measurements performed in a sequence. Therefore, the
number of effective λ∆ψ pores per unit area, N∆ψ, was calculated according to
Watson and Luxmoore (1986)
[ ] ( )[ ]4
1 /)(8 ψψ λπρµ ∆−∆ −= gKKN ii i = 1, 2, …n (4.4)
The effective porosity for two consecutive soil water tensions, θξ, is then given
by the expression
2)( ψψξ λπθ ∆∆= N (4.5)
According to classical capillary rise theory, the maximum pore radius, C0, that
will remain full of water under a given applied pore water pressure ψ is calculated
(Reynolds et al., 1995) as
( ) ( )ψρσ gC /20 −= ψ < 0 (4.6)
In our study we have defined macropores as those pores that drain at ψ >- 4 cm
(C0 > 0.375 mm; Clothier and White, 1981) and mesopores as those pores draining
for ψ between - 4 and –14 cm (0.375 > C0 > 0.107 mm). The contribution of both
macropores and mesopores to the total saturated water flux, ϕ, was calculated from

Dynamics of soil hydrophysical properties 59
K14, K4, and K0 (Watson and Luxmoore, 1986; Cameira et al., 2003) according to the
expression
100(%)0
1 xK
KK iii
−−=ϕ i = 1, 2, …, n (4.7)
where n is the number of measurements performed in a sequence, Ki and Ki-1 the
hydraulic conductivity for two consecutive tensions and K0 the saturated hydraulic
conductivity.
The volumetric water content of soil beneath the infiltrating surface was
determined just at the end of the infiltration measurement (steady-state flow at ψ =
0 cm) by TDR using the same TDR set-up described above. For this purpose, and
prior to the infiltration run, a three-rod TDR probe (diameter: 2 mm; length: 100
mm; spacing for the outermost rods: 25 mm) was installed horizontally into the soil
at 3-4 cm below the infiltrometer disc.
3. Results and discussion
3.1. Weather conditions and dynamics of soil water content
Precipitation records over the 3-yr experimental period show a high variability in
the rainfall pattern for the different fallow periods and, particularly, around the
tillage application dates (Fig. 4.1a). Thus, total precipitation between primary and
secondary tillage practices was in general high and effective (effective rainfall is
here defined as rainfall > 10 mm day-1). Effective rainfall between primary tillage
and the post-tillage + rainfall sampling was 49, 33, and 61 mm for the 1999-2000,
2000-2001 and 2001-2002 fallow periods, respectively. It is worth to note the
intense rainfall event after primary tillage in the 2001-2002 fallow period (40 mm in
24 h on 16 March 2002). Rainfall from secondary tillage to late fallow sampling
was low and less effective.
Figure 4.1b shows the time course of volumetric soil water content (θ ) in the
upper 20 cm measured over the three experimental fallow periods under the CT, RT

60 Capítulo 4
and NT treatments. Overall, while there were no differences in soil moisture
between CT and RT before primary tillage, when the soil was consolidated, θ
under NT was on average 0.03-0.04 m3 m-3 higher than in tilled systems. These
differences, however, were even larger after primary tillage (0.06-0.08 m3 m-3) as
it can be observed for the rainy period after the 1999-2000 primary tillage practices
as compared with the water recharge period at the beginning of the 2000-2001
fallow before tillage.
3.2. Soil bulk density
Table 4.1 presents the field bulk density (ρb) and corresponding θ values
measured in the 2-7 cm soil layer at the time of the infiltration measurements under
the different fallow management treatments during the three experimental fallow
seasons. Overall, pre-tillage values of topsoil ρb after 8-10 years under continuous
NT were greater than under CT and RT treatments. A greater soil compaction under
NT has been observed in other long-term experiments (Logsdon et al., 1990; Evett
et al., 1999; Hernanz et al., 2002; Schwartz et al., 2003; Lampurlanés and Cantero-
Martínez, 2003). This fact is commonly associated with the gradual consolidation of
the soil matrix over time owing to rainfall and absence of annual tillage-induced
loosening. On the other hand, the lower ρb values found 7-8 months after harvest of
a barley crop under RT compared with CT can be related to a greater persistence of
the soil loosening after chisel ploughing compared with mouldboard ploughing
(Lopez et al., 1996).
As observed by several authors (Sauer et al., 1990; Logsdon et al., 1999; Miller
et al, 1998; Mellis et al., 1996; Green et al., 2003), soil loosening of the plough
layer after primary tillage decreased ρb in the 2-7 cm layer (Table 4.1; post-tillage).
Soil reconsolidation due to post-tillage rainfall events and associated wetting and
drying cycles (Mellis et al., 1996; Green et al., 2003) increased ρb in tilled plots
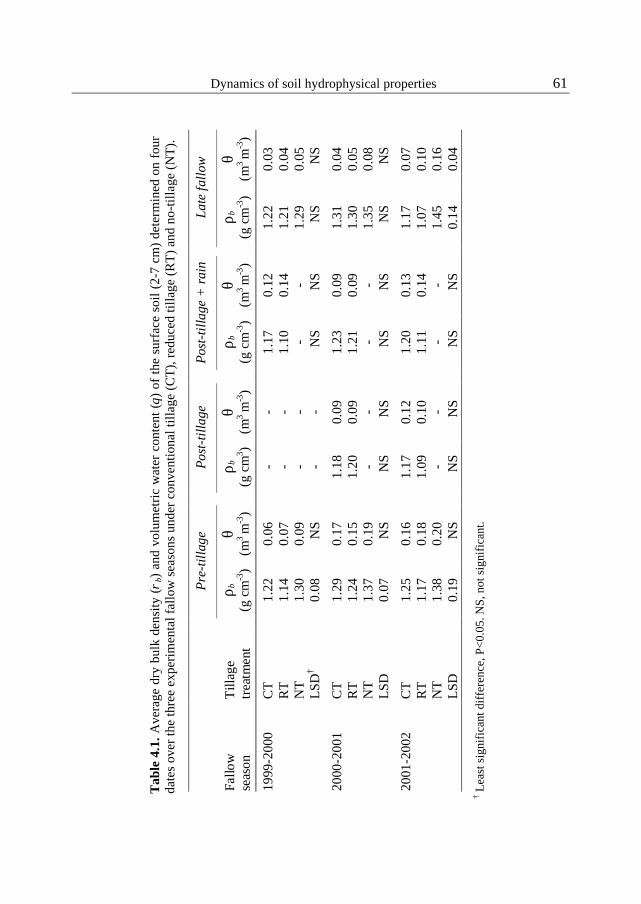
Dynamics of soil hydrophysical properties 61
Tab
le 4
.1. A
vera
ge d
ry b
ulk
dens
ity (
ρ b)
and
volu
met
ric
wat
er c
onte
nt (
θ) o
f th
e su
rfac
e so
il (2
-7 c
m)
dete
rmin
ed o
n fo
ur
date
s ov
er th
e th
ree
expe
rim
enta
l fal
low
sea
sons
und
er c
onve
ntio
nal t
illag
e (C
T),
red
uced
tilla
ge (
RT
) an
d no
-til
lage
(N
T).
Pre
-till
age
Pos
t-til
lage
Pos
t-til
lage
+ r
ain
Late
fallo
w
Fallo
w
seas
on
Till
age
trea
tmen
t
ρ b
(g
cm
-3)
θ (m
3 m
-3)
ρ b
(g
cm
3 ) θ
(m3
m-3
)
ρ b
(g
cm
-3)
θ (m
3 m
-3)
ρ b
(g
cm
-3)
θ (m
3 m
-3)
1999
-200
0 C
T
RT
N
T
LSD
†
1.
22
1.14
1.
30
0.08
0.06
0.
07
0.09
N
S
- - - -
- - - -
1.
17
1.10
-
NS
0.12
0.
14
- N
S
1.
22
1.21
1.
29
NS
0.03
0.
04
0.05
N
S
2000
-200
1 C
T
RT
N
T
LSD
1.
29
1.24
1.
37
0.07
0.17
0.
15
0.19
N
S
1.
18
1.20
-
NS
0.09
0.
09
- N
S
1.
23
1.21
-
NS
0.09
0.
09
- N
S
1.
31
1.30
1.
35
NS
0.04
0.
05
0.08
N
S
2001
-200
2 C
T
RT
N
T
LSD
1.
25
1.17
1.
38
0.19
0.16
0.
18
0.20
N
S
1.
17
1.09
-
NS
0.12
0.
10
- N
S
1.
20
1.11
-
NS
0.13
0.
14
- N
S
1.
17
1.07
1.
45
0.14
0.07
0.
10
0.16
0.
04
†
Lea
st s
igni
fica
nt d
iffe
renc
e, P
<0.
05. N
S, n
ot s
igni
fica
nt.

62 Capítulo 4
(Table 4.1; post-tillage + rain). At this stage, the higher values of ρb observed
under CT can be related as above mentioned with a more unstable topsoil structure
induced by mouldboard ploughing. At the end of fallow, and following secondary
tillage and additional rainfall events, the soil tends to recover the pre-tillage values
of ρb (Table 4.1).
In the 40-45 cm soil layer, no significant differences in ρb were observed
between tillage treatments at the end of the three fallow periods (data not shown).
Regardless of tillage treatment, average values of ρb in this layer were higher (1.32,
1.54, and 1.38 g cm-3 in 2000, 2001 and 2002, respectively) than in the 2-7 cm layer
(1.24, 1.32, and 1.23 g cm-3). However, while ρb under NT presented comparable
values in both layers, ρb under CT and RT was higher at 40 cm depth as expected in
tilled soils (Moreno et al., 1999; Hernanz et al., 2002).
The bulk density of the surface crust, ρc, measured at the end of the 2001-2002
fallow period showed an average value of 1.28 g cm-3, within the range of ρc values
obtained by Roth (1997). No significant differences in ρc were found between
tillage treatments. Crust thickness was similar in all plots (8 mm on average).
3.3. Soil water retention and pore-size distribution
The water retention curves, θ (ψ), estimated at 5 cm depth during the 2001-2002
fallow period are presented in Fig. 4.2. The fit of the van Genuchten’s (1980)
retention function to retention data showed marked differences between tillage
treatments under consolidated soil conditions after 10 years of trial (Fig. 4.2a).
Compared with CT and RT, NT water retention curves were characterised by a
more gradual reduction in θ as ψ increases and by greater values of θ at ψ > -7
kPa. In addition, whereas fitted values of water content at saturation,θsat, were 8%
lower under NT than under CT and RT, water retention at field capacity, θFC (ψ = -
10 kPa) and permanent wilting point, θPWP (ψ = -1500 kPa) was 2% and 3%

Dynamics of soil hydrophysical properties 63
Volumetric water content,θ (m3 m-3)
0.0 0.1 0.2 0.3 0.4 0.5 0.6
So
il p
ress
ure
he
ad
,ψ (
-kP
a)
0.1
1
10
100
1000
10000
0.0 0.1 0.2 0.3 0.4 0.5 0.6
0.1
1
10
100
1000
10000
c
10 kPa
1500 kPa
10 kPa
b
1500 kPa
10 kPa
10 kPa
d
1500 kPa
a
1500 kPa
CT Fitted
CT Data
NT Fitted
NT Data
RT Fitted
RT Data
Figure 4.2. Soil water retention curves for conventional tillage (CT), reduced tillage (RT) and no-tillage (NT) at 5 cm depth on four dates over the 2001-2002 fallow period (Field 2): (a) before primary tillage (pre-tillage); (b) after primary tillage but before any rainfall event (post-tillage); (c) after primary tillage but following a period of intermittent rainfall events (post-tillage+rain); and (d) during the last phase of the fallow period (late fallow). Fitted curves for CT and RT in (b), (c) and (d) plots were obtained using total porosity, ξ, data as soil water content at saturation.

64 Capítulo 4
greater, respectively, under NT than under CT and RT. Similar results were found
by Evett et al. (1999) on a clay loam soil after 12 years of trial. In contrast, Azooz et
al.. (1996) found at the end of 13 years in a silt loam and four years in a sandy loam
that soil under NT retained more water than under CT (i.e. chiselling) in the 0-7.5
cm depth of both soils along a soil matric pressure gradient (from -2 to - 400 kPa).
After 8 years of trial, Hill et al. (1985) reported that the water retention of a loam
soil at the surface (5-12.5 cm depth) was greater under NT than under CT
(mouldboard ploughing) at any matric potential with the exception of 0 kPa. Other
studies have reported greater water retention under NT than under mouldboard
ploughing in the Ap horizon of silt loam soils for soil water potentials values from 0
to –40 kPa (Datiri and Lowery, 1991) and less than -10 kPa (Wu et al., 1992), but
not in a clay loam soil (Wu et al., 1992) as found by Evett et al. (1999). The
differences in θ (ψ) between tillage treatments near the soil surface have been
associated to significant rearrangements of pore fractions (Azooz et al., 1996). In
our study, an analysis of selected pore-size fractions showed that the structured
topsoil (pre-tillage sampling) in the more dense NT plots presented the lowest
values of aeration porosity (pores > 300 µm equivalent pore diameter, EDP),
transmission porosity (pores between 30 and 300 µm EDP) and available water-
holding capacity (AWHC) porosity (pores between 0.2 and 30 µm EDP) (Table
4.2).
Given that field measurements of θ near saturation were inconsistent not only in
loose, freshly tilled soils (post-tillage sampling) but also following a period of
rainfalls (post-tillage + rain) and at the end of fallow (late fallow), soil water
retention curves for CT and RT plots at those sampling dates were estimated from
total porosity ξ (calculated from soil particle and bulk densities) and θ
measurements at ψ < -10 kPa (Fig. 4.2b, c and d). Post-tillage results showed that
the increase in porosity observed after soil loosening by tillage is mostly associated

Dynamics of soil hydrophysical properties 65
Table 4.2. Total pore volume and selected pore-size fractions† in the surface soil (2-10 cm depth) estimated from soil water retention curves (Fig. 4.2) at four times during the 2001-2002 fallow period under conventional tillage (CT), reduced tillage (RT) and no-tillage (NT).
Fallow samplings date
Tillage treatment
Total pore volume
Aeration porosity
Transmission porosity
AWHC
%
Pre-tillage CT RT NT LSD‡
48.3 47.9 40.2 4.6
3.0 1.9 0.5 1.3
15.2 14.9 8.2 2.1
18.0 18.9 16.0 1.2
Post-tillage CT RT NT LSD
55.8 58.9
- NS
17.8 17.3
- NS
13.9 14.5
- NS
13.7 14.1
- NS
Post-tillage + rain CT RT NT LSD
54.7 58.1
- NS
13.6 16.3
- NS
13.0 14.2
- NS
14.6 15.0
- NS
Late fallow
CT RT NT LSD
55.8 59.6 41.8 9.4
11.8 17.2 1.7 2.7
14.0 14.6 9.4 2.1
15.7 15.0 13.8 NS
† Aeration porosity refers to pores > 300 µm equivalent pore diameter (EDP); transmission porosity refers to pores between 30 and 300 µm EDP; and AWHC is the available water-holding capacity or pores between 0.2 and 30 µm EDP.
‡ Least significant difference, P<0.05. NS, not significant.
with an increase in the soil water retention at the wet end of the θ (ψ) curve. This
result is in agreement with findings reported by Hamblin and Tennant (1981) and
Lindstrom and Onstad (1984), cited by Ahuja et al. (1998), which showed that, in
general, most of the increase in porosity is associated with the increase in number or
volume fraction of the larger pores (i.e. pores corresponding with ψ > - 6 kPa).
Thus, compared with pre-tillage pore-size distribution, aeration porosity increased

66 Capítulo 4
by about 15%, transmission porosity did not change, and AWHC porosity decreased
about 4% (Table 4.2).
In general, the post-tillage rainfall events modify θ (ψ) and pore-size distribution
of freshly tilled soils through slaking and dispersion of soil aggregates during
associated cycles of wetting and drying (Ahuja et al., 1998). In our study, this
natural soil reconsolidation process slightly reduced the post-tillage total pore
volume and changed pore-size distribution by destroying the largest pores, as
indicated by a lower aeration porosity, and increasing the AWHC porosity (Fig.
4.2c; Table 4.2). These results agree with those found by Rousseva et al. (2002),
who observed by image analysis of thin sections that after a series of simulated
rainfalls, the macroporosity of a loam soil at the surface layers showed a strong
decrease in the frequency of the larger pores, while the frequency of the smaller
either increased or remained almost constant. In late fallow, soil water retention
curves measured under CT and RT were similar to those estimated after primary
tillage (Fig. 4.2b and d) because the scarce rainfall events recorded to the last fallow
sampling were not enough to reconsolidate a loose tilled soil after secondary tillage
implementation.
At 45 cm depth, the soil water retention curves were similar for the three tillage
management systems, with average values of θsat, θFC , and θPWP of 0.42, 0.23 and
0.13 m3 m-3, respectively. However, whereas θ (ψ) curves under NT did not differ
from those measured at 5 cm depth, θ(ψ) curves under CT and RT showed lower
θsat and greater θFC and θPWP values than at 5 cm depth.
3.4. Soil hydraulic properties
3.4.1. Soil hydraulic conductivity (K) and sorptivity (S).
K measurements at 2 cm depth for the different fallow periods and sampling
dates, ψ values, and tillage treatments are summarised in Fig. 4.3. For structured,
consolidated soil conditions (Fig. 4.3a), NT soil presented, after 8-10 years of

Dynamics of soil hydrophysical properties 67
log
K (
cm s
-1)
1e-5
1e-4
1e-3
1e-2**
*
1e-5
1e-4
1e-3
1e-2**
*
*
***
*
1999-2000
***
a b c d
-16 -12 -8 -4 0
1e-5
1e-4
1e-3
1e-2*
*
*
*
-16 -12 -8 -4 0 -16 -12 -8 -4 0 -16 -12 -8 -4 0
***
*
2001-2002
CT RTNT
ψ (cm)
2000-2001
Figure 4.3. Soil hydraulic conductivity (K) versus pressure head (ψ) relationships for conventional tillage (CT), reduced tillage (RT) and no-tillage (NT) at 2 cm depth on four dates over the 1999-2000 (Field 2), 2000-2001 (Field 1) and 2001-2002 (Field 2) fallow periods: (a) before primary tillage (pre-tillage); (b) after primary tillage but before any rainfall event (post-tillage); (c) after primary tillage but following a period of intermittent rainfall events (post-tillage+rain); and (d) during the last phase of the fallow period (late fallow). * Significant difference among tillage treatments at P < 0.05.
68 Capítulo 4
continuous no-tillage management, and for the entire range of applied soil water
pressure heads, K values significantly lower than those observed in CT and RT
soils. However, no differences in K were found between CT and RT treatments.
These results are similar to those found in other studies (Sauer et al., 1990; Moreno
et al., 1997; Miller et al., 1998; Evett et al., 1999), but deviate from the general
tendency in the long-term for NT soil to increase its near-saturated K as compared
with CT practices (Green et al., 2003). Regardless of the fallow periods, as ψ
decreased from –14 to 0 cm, overall K was found to increase by 1.3, 1.5, and 1.3
orders of magnitude for CT, RT and NT, respectively. Mean Ko and K1 values under
CT and RT were significantly greater in 2002 than in 2000 and 2001, which might
reflect an important inter-annual variability in the process of soil consolidation
during fallow and crop growing season. However, K under NT kept constant values
throughout the three experimental fallow periods, which indicates a greater stability
in soil water transmission properties in this treatment.
Primary tillage operations in CT and RT plots increased K14, K4 and K1 (Fig.
4.3b) compared with pre-tillage values. This result is in agreement agrees with
findings in other studies (Sauer et al., 1990; Messing and Jarvis, 1993; Cameira et
al., 2003), in which greater infiltration rates were measured after tillage due to an
increase in soil porosity. Unreliable post-tillage infiltration measurements at ψ = 0
cm, probably due to soil macrostructure collapsing below the infiltrometer (Moret
and Arrúe, 200x; Capítulo 3), were discarded from the analysis. No differences in K
were observed between CT and RT treatments.
Rainfalls following primary tillage affected K under CT and RT, as a
consequence of soil structural changes caused by subsequent wetting and drying
cycles (Angulo-Jaramillo et al., 1997). In general, a decrease of K14 and K4 was
observed, which is in agreement with the concomitant slight increase in bulk
density (Table 4.1). On the other hand, the change in K was directly proportional to
rainfall intensity, which controlled soil aggregate breakdown and, consequently, the

Dynamics of soil hydrophysical properties 69
rate of soil reconsolidation. This was the case of the 2001-2002 fallow period,
where high effective rainfall events received after primary tillage (61 mm) resulted
in a higher decrease in K14 and K4 , compared with the 2000-2001 fallow, with only
33 mm of effective precipitation (Fig. 4.1a). Overall, the high values of K in late
fallow (Fig. 4.3d), 2-3 months after secondary tillage (Fig. 4.1a) can be explained
by the scarce rainfall events recorded in that period, which did not allow a complete
soil reconsolidation. Ko for CT and RT in the 2000-2001 fallow are not shown in
Fig. 4.3d due to inconsistent soil water flow values as explained above.
At 40 cm depth, no significant differences in K were observed between tillage
systems over the three experimental fallow years. K14, K4, K1, and K0 showed an
average value of 1.4 x 10⁻³, 0.7 x 10⁻³, 0.3 x 10⁻³ and 0.1 x 10⁻³ cm s-1, respectively.
This result indicates that neither mouldboard nor chisel management disturbed the
soil below the depth of ploughing (Logsdon et al., 1999). Compared with K values
at 2 cm depth, whereas no differences in K were observed under NT, tilled
treatments showed lower K values at 40 cm depth. A similar result was obtained in
a clayey soil by Moreno et al. (1999), who suggested that differences in K between
the soil surface and a depth of 30 cm in tilled soils may be associated with a larger
number of macropores and fissures near the surface.
The average values of K at saturation for the surface crust (Kc) under CT, RT,
and NT were 1.7 x 10⁻³, 1.3 x 10⁻³, and 1.1 x 10⁻³ cm s-1, respectively, with no
significant differences between tillage treatments and years. These figures are
within the range of Kc values reported by Chartres (1992) for rain-impact crusts
developed following cultivation in Australian Alfisols also with loamy textured A
horizons. On the other hand, Kc under CT and RT was from 1/3 to 1/6 the
underlying soil K0, as observed in previous crust studies by Tackett and Pearson
(1965) and Vandervaere et al. (1997). No differences between Kc and K0 at 2 cm
depth were observed under NT.

70 Capítulo 4
Table 4.3. Sorptivity of the soil surface (2 cm) at 0 cm tension measured on three occasions within three experimental fallow seasons under three management treatments (CT, conventional tillage; RT, reduced tillage; NT, no-tillage).
Fallow period Tillage treatment
Pre- tillage
Post-tillage + rain
Late fallow
mm s-0.5
1999-2000 CT RT NT LSD†
0.732 0.633 0.345 0.161
0.724 0.553
- 0.121
1.255 1.147 0.371 0.121
2000-2001 CT RT NT LSD
0.449 0.421 0.304 0.106
1.100 0.826
- NS
1.433 1.196 0.488 0.301
2001-2002 CT RT NT LSD
0.460 0.471 0.261 NS
0.596 0.466
- NS
0.986 1.064 0.278 0.212
† Least significant difference, P<0.05. NS, not significant.
Soil sorptivity at saturation, So, measured at 2 cm depth is presented in Table
4.3. After 8-10 years of trial, So under NT was significantly lower than under CT
and RT treatments, for which no differences in So were observed. These results,
which were comparable to those obtained by Sauer et al. (1990), agree with the
lower porosity measured under NT (Table 4.2). Average pre-tillage So at 2 cm
depth (0.45 mm s-0.5) was within the same order of magnitude of the So measured by
López and Arrúe (1997) at 20 cm depth in the same soil after harvest (0.62 mm s-0.5)
using a Guelph permeameter. The increase in So under CT and RT at the post-tillage
+ rain and late fallow sampling dates should be related with an increment in total
soil porosity and number of conductive mesopores induced by the tillage (Cresswell

Dynamics of soil hydrophysical properties 71
et al., 1993; Logsdon et al., 1993). There were no differences in So among tillage
treatments at 40 cm depth, where the average value of So was 0.36 mm s-0.5.
3.4.2. K, λψ and Nψ relationships
Regardless of tillage treatment, the λψ and Nψ vs. K relationships at 2 cm depth
for structured soil conditions (Fig. 4.4a) were similar to those reported by Reynolds
et al. (1995). On one hand, λψ was relatively constant at its minimum value of about
0.1 mm for small K, but then increased with increasing K when K became large.
This behaviour could be the result of constrictions (e.g. pore necks, entrapped air
bubbles) and discontinuous pores within the ψ range where λψ is constant (Reynolds
et al., 1995). On the other hand, Nψ , which is inversely related to λψ (Fig. 4.4a),
increases when K decreases. Thus, for a given K, small values of λψ were
compensated by larger Nψ values and vice versa. For instance, whereas K1
and Ko for the 2000-2001 fallow period were defined by large Nψ and small λψ
values, in the 2001-2002 fallow period lower Nψ values were compensated by an
increase in λψ (Fig. 4.4a). The Nψ vs λψ relationship in the 2000-2001 fallow season
under CT and RT presented, as found by Reynolds et al. (1995), a maximum Nψ in
the vicinity of λψ = 0.1-0.2 mm. In the other cases, the maximum Nψ occurred for
λψ < 0.1 mm. For the three tillage treatments, and throughout the entire range of ψ,
λψ varied between 0.1 and 0.9 mm, as reported by other researchers (Sauer et al.,
1990; Reynolds et al., 1995; Angulo-Jaramillo et al., 1997). Likewise, Nψ values for
the three tillage systems varied between 20 and 17000 pores per m2 for ψ = 0 cm
and ψ = –14 cm, respectively.
For sampling before primary tillage implementation (Fig. 4.4a), both λψ and Nψ
were also affected by the different tillage treatments. Thus, for K14, λψ and Nψ were
smaller and greater, respectively, under NT than under CT and RT. These results
are consistent with the lower porosity found under NT (Table 4.2), as a

72 Capítulo 4
0.0
0.2
0.4
0.6
0.8
1.0
0.0
0.2
0.4
0.6
0.8
1.0
101
102
103
104
105
2000-2001
1e-6 1e-5 1e-4 1e-3 1e-6 1e-5 1e-4 1e-3 1e-6 1e-5 1e-4 1e-3
2001-2002
1e-6 1e-5 1e-4 1e-3
101
102
103
104
105
a b c d
logK (cm s-1
)
CT RT NT
Nψ (
pore
s m
-2)
λ ψ(m
m)
Nψ (
pore
s m
-2)
λ ψ(m
m)
Figure 4.4. Number of effective water transmitting macropores per unit area (Nψ) and representative mean pore radius (λψ) versus soil hydraulic conductivity (K) at 2 cm depth under conventional tillage (CT), reduced tillage (RT) and no-tillage (NT) at four dates over the 2000-2001 (Field 1) and 2001-2002 (Field 2) fallow periods: (a) before primary tillage (pre-tillage); (b) after primary tillage but before any rainfall event (post-tillage); (c) after primary tillage but following a period of intermittent rainfall events (post-tillage+rain); and (d) during the last phase of the fallow period (late fallow). Bars represent LSD (P < 0.05) for comparison among tillage treatments where significant differences were found.

Dynamics of soil hydrophysical properties 73
consequence of the gradual consolidation of the soil matrix over time due to rainfall
and absence of annual tillage-induced loosening (Reynolds et al., 1995).
Primary tillage strongly modified the configuration of the water transmitting
pores within the soil matrix in the CT and RT plots. Although, in general, an
increase in Nψ and a reduction of λψ were observed in these treatments over the K1
to K14 range, these changes were more important at K1 (average increase of 65% for
Nψ and average decrease of 70% for λψ ) (Fig. 4.4b). This behaviour may be the
result of soil pulverisation at the soil surface due to ploughing (Sauer et al., 1990),
which destroys active macropores thus increasing the number of smaller pores
(Malone et al., 2003). For the K measurement range, average values of λψ and Nψ
varied between 0.1 and 0.2 mm in the first case and between 3500 and 24000 pores
per m2 in the second. There were no significant differences in λψ and Nψ between
CT and RT treatments (Fig. 4.4b).
Post-tillage rainfalls during the 2000-2001 and 2001-2002 fallow periods
increased λψ and reduced Nψ at K1, but slightly modified these parameters at K14
and K4. These changes, which depend on the amount and intensity of rainfall events
recorded after primary tillage, were more dramatic in the 2001-2002 fallow period
characterised by a high effective precipitation (Fig. 4.4c). In late fallow, the λψ and
Nψ vs Kψ relationships under CT and RT (Fig. 4.4d) were similar to those obtained
after primary tillage (Fig. 4.4b). This was due to both the effect of secondary tillage
that loosened the upper 15 cm of soil and the low rainfall received from secondary
tillage date to late fallow sampling (Fig. 4.1a).
No significant differences in λψ and Nψ were observed among tillage systems at
40 cm depth. The average values of λψ for Ko, K1, K4 and K14 were 0.36, 0.18, 0.09
and 0.07 mm, respectively. Similarly, average Nψ for Ko, K1, K4 and K14 was 2300,
3600, 16000 and 22000 pores per m2, respectively.

74 Capítulo 4
3.4.3. Contribution of macropores and mesopores to water flow
The large increase in K over the small increase in ψ at 2 cm depth (Fig. 4.3a)
indicates, as suggested by Sauer et al. (1990) and Reynolds et al. (1995), that
extensive macropores networks exist in the three tillage treatments near saturation
under consolidated soil conditions. For convenience we have defined macropores
and mesopores as those pores delimited by values of ψ between - 4 and 0 cm and
between - 4 and -14 cm, respectively. For these pore classes, the representative
mean pore radius, λ∆ψ, and the concentration of λ∆ψ pores, N∆ψ, are presented in
Table 4.4. On average, and regardless of tillage system, macropores have a greater
λ∆ψ (1.3 mm) than mesopores (0.2 mm) and a lower N∆ψ (65 pores x m-2) than
mesopores (1400 pores x m-2). This results in a lower effective porosity, θξ, of
macropores (Eq. 4.5) than that calculated for mesopores (Table 4.5). However, the
higher θξ observed for mesopores did not denote a higher contribution of these
pores to the flux, ϕ (Table 4.5). Results indicate that macropores have a larger
influence upon water flow than mesopores despite the fact that they occupy a much
smaller fraction of total soil porosity, as observed by Messing and Jarvis (1993) and
Cameira et al. (2003).
Pre-tillage values of λ∆ψ and N∆ψ (Table 4.4) and θξ (Table 4.5) measured at 2
cm depth were affected by the tillage treatments. Thus, NT macropores have a
lower N∆ψ (3.9 pores x m-2) and a lower θξ (0.0003%) but a greater λ∆ψ (2.09 mm)
than CT and RT macropores (on average, N∆ψ = 96 pores x m-2, θξ = 0.0039%, and
λ∆ψ = 0.97 mm). On the contrary, whereas no differences in λ∆ψ for mesopores were
detected between tillage treatments, CT and RT showed a significantly greater N∆ψ
and θξ than NT. These results suggest, as proposed by Sauer et al. (1990), that
different soil structural conditions existed for the three tillage treatments. On the
other hand, despite the differences found in soil water transmitting pore
characteristics among tillage systems, the water flux was mainly dominated by

Dynamics of soil hydrophysical properties 75
Tab
le 4
.4.
Rep
rese
ntat
ive
pore
siz
e, λ
∆ψ (
mm
) an
d nu
mbe
r of
λ∆
ψ p
ores
per
uni
t of
are
a (p
ores
per
m2 ),
N∆
ψ,
for
soil
m
acro
pore
s (0
<ψ
<4
cm)† a
nd m
esop
ores
(4<
ψ<
14 c
m)‡ m
easu
red
at 2
cm
dep
th o
n fo
ur d
ates
dur
ing
the
expe
rim
enta
l fal
low
se
ason
s un
der
diff
eren
t man
agem
ent t
reat
men
ts (
CT
, con
vent
iona
l till
age;
RT
, red
uced
tilla
ge; N
T, n
o-ti
llag
e).
P
re-t
illag
e
Pos
t-til
lage
Pos
t-til
lage
+ra
in
La
te fa
llow
M
acro
pore
s
Mes
opor
es
M
acro
pore
s
Mes
opor
es
M
acro
pore
s
Mes
opor
es
M
acro
pore
s
Mes
opor
es
Fal
low
se
aso
n
Til
lage
tr
eatm
ent
λ ∆
ψ
N∆
ψ
λ ∆
ψ
N∆
ψ
λ ∆
ψ
N∆
ψ
λ ∆
ψ
N∆
ψ
λ ∆
ψ
N∆
ψ
λ ∆
ψ
N∆
ψ
λ ∆
ψ
N∆
ψ
λ ∆
ψ
N∆
ψ
1999
-200
0
CT
0.8
8
166
0.13
52
00
-
-
- -
0
.42
27
4
0.1
8 11
50
0
.32
1666
0.16
63
92
R
T
0
.66
33
7
0.
27
2400
- -
-
-
0.9
4
132
0
.21
533
0.4
1 24
59
0.
18
2162
NT
2.4
4
3.7
0.29
11
8
-
-
- -
-
-
- -
2
.34
1.0
0.23
72
57
L
SD
§
N
S
NS
NS
20
90
-
-
- -
N
S
NS
N
S N
S
0
.93
789
NS
NS
2000
-200
1
CT
1.0
2
45
0.
14
2781
- -
0.
09
7680
4
0
.45
12
236
0
.13
1047
0
-
-
0.07
63
872
RT
0.9
6
11
0.
16
871
- -
0.
09
1528
2
0
.41
86
0
0.1
4 69
17
-
-
0.06
58
068
NT
1.9
6
0.4
0.25
53
6
-
-
- -
-
-
- -
1
.59
0.4
0.16
90
6
L
SD
0.6
2
NS
NS
N
S
-
-
NS
N
S
N
S
NS
N
S N
S
0.04
26
8
2001
-200
2
CT
1.0
8
12
0.
20
367
- -
0.
15
1461
9
0
.97
58
0.2
2 47
6
0
.46
9137
0.15
45
36
R
T
1
.25
7
.0
0.
21
199
- -
0.
14
2663
4
1
.01
91
0.2
1 54
8
0
.28
1428
4
0.19
21
75
N
T
1
.89
7
.1
0.
19
165
- -
-
-
- -
-
-
1.9
8 0
.2
0.
15
1864
LS
D
N
S
NS
NS
N
S
-
-
NS
N
S
N
S
NS
N
S N
S
0
.44
1304
NS
NS
† Pre
ssur
e he
ad r
ange
def
inin
g m
acro
pore
s (p
ore
radi
us >
0.3
75 m
m)
acco
rdin
g to
the
capi
llary
ris
e th
eory
. ‡ Pr
essu
re h
ead
rang
e de
fini
ng la
rge
mes
opor
es (
pore
rad
ius
betw
een
0.37
5 an
d 0.
107
mm
) ac
cord
ing
to th
e ca
pilla
ry r
ise
theo
ry.
§ L
east
sig
nifi
cant
dif
fere
nce
(P<
0.05
). N
S, n
ot s
igni
fica
nt.

76 Capítulo 4
Tab
le 4
.5.
Eff
ectiv
e po
rosi
ty (
θ å)
and
cont
ribu
tion
to f
low
(ϕ)
of
soil
mac
ropo
res
(0<
ψ<
4 cm
)† and
mes
opor
es (
4<ψ
<14
cm)‡
mea
sure
d at
2 c
m d
epth
on
four
dat
es d
urin
g th
e ex
peri
men
tal
fall
ow s
easo
ns u
nder
dif
fere
nt m
anag
emen
t tr
eatm
ents
(C
T,
conv
enti
onal
till
age;
RT
, red
uced
till
age;
NT
, no-
till
age)
.
P
re-t
illag
e
Pos
t-til
lage
Pos
t-ti
llage
+ra
in
La
te fa
llow
M
acro
pore
s
Mes
opor
es
M
acro
pore
s
Mes
opor
es
M
acro
pore
s
Mes
opor
es
M
acro
pore
s
Mes
opor
es
Fall
ow
seas
on
Til
lage
tr
eatm
ent
θ ε
ϕ
θ ε
ϕ
θ ε
ϕ
θ ε
ϕ
θ ε
ϕ
θ ε
ϕ
θ ε
ϕ
θ ε
ϕ
%
1999
-200
0 C
T
0.
0066
69
0.02
28
21
-
-
- -
0.
0121
80
0.01
13
15
0.
0395
71
0.04
01
23
R
T
0.
0079
77
0.01
28
15
-
-
- -
0.
0052
86
0.00
56
9
0.05
01
76
0.
0205
18
NT
0.00
06
79
0.
0012
13
- -
-
-
-
-
-
-
0.00
01
77
0.
0095
14
LS
D§
N
S
11
0.
0085
7
-
-
- -
N
S
NS
NS
N
S
0.
0101
N
S
0.
0265
7
2000
-200
1 C
T
0.
0027
78
0.01
39
16
-
-
0.07
31
-
0.04
85
57
0.
0477
32
- 39
0.01
26
-
RT
0.00
13
83
0.
0071
14
- -
0.
0042
-
0.
0186
72
0.03
14
22
-
54
0.
0104
-
N
T
0.
0003
83
0.00
39
16
-
-
- -
-
-
- -
0.
0018
78
0.00
56
14
L
SD
NS
N
S
0.
0072
N
S
-
-
NS
-
N
S
NS
NS
N
S
-
37
0.
0030
-
2001
-200
2 C
T
0.
0029
91
0.00
41
7
- -
0.
0488
-
0.
0062
89
0.00
62
8
0.05
83
69
0.
0321
24
RT
0.00
22
94
0.
0027
4
-
-
0.03
51
-
0.00
79
89
0.
0072
9
0.
0766
75
0.02
15
20
N
T
0.
0001
88
0.00
16
8
- -
-
-
- -
-
-
0.00
01
76
0.
0052
12
LS
D
0.
0032
N
S
0.
0016
N
S
-
-
NS
-
N
S
NS
NS
N
S
0.
0662
5
0.
0093
4
† Pr
essu
re h
ead
rang
e de
fini
ng m
acro
pore
s (p
ore
radi
us >
0.3
75 m
m)
acco
rdin
g to
the
capi
llary
ris
e th
eory
. ‡ Pr
essu
re h
ead
rang
e de
fini
ng la
rge
mes
opor
es (
pore
rad
ius
betw
een
0.37
5 an
d 0.
107
mm
) ac
cord
ing
to th
e ca
pilla
ry r
ise
theo
ry.
§ L
east
sig
nifi
cant
dif
fere
nce
(P<
0.05
). N
S, n
ot s
igni
fica
nt.

Dynamics of soil hydrophysical properties 77
macropores (Table 4.5). In agreement with Miller et al. (1998), it can be concluded
that the lower K values under NT are related to a lower number of large pores,
which is consistent with the significantly greater values of ρb under NT (Table 4.1).
Data available for mesopores after primary tillage showed a significant reduction
in λ∆ψ and increase in N∆ψ (Table 4.4) and θξ (Table 4.5), which indicates, as
suggested by Sauer et al. (1990) and Malone et al. (2003), that tillage destroys
macropores and changes their characteristics (tortuosity, continuity, etc.).
Later,wetting and drying cycles associated with intermittent rainfall events after
primary tillage contributed to rearrange the soil pore configuration towards the
initial pre-tillage conditions, as indicated by an increase in λ∆ψ and a decrease in
N∆ψ and θξ for mesopores (Tables 4.4 and 4.5). These results agree with Messing
and Jarvis (1993), who observed a decrease in the mesopores fraction (for ψ
between –6 and –11 cm) after post-tillage rainfalls. In our case, these changes
varied for the different long-fallow periods as a function of the amount and intensity
of effective rains after tillage. Thus, in the 2000-2001 fallow, a low effective
rainfall after primary tillage helped to maintain the large number of small pores
created by tillage (Table 4.4) and increase ϕ for mesopores compared with the pre-
tillage situation (Table 4.5). In contrast, in the 1999-2000 and 2001-2002 fallow
periods, where a strong soil reconsolidation following intensive rains after tillage,
macro- and mesopores characteristics and contribution to flow were closer to those
measured under pre-tillage soil conditions.
Mesopore characteristics in late fallow under CT and RT in the 2000-2001 and
2001-2002 fallow periods were rather similar to those obtained after primary tillage
cultivation (Tables 4.4 and 4.5). Soil loosening by secondary tillage, along with a
low precipitation after this cultivation (Fig. 4.1a), increased N∆ψ and θξ and
decreased λ∆ψ for both macro- and mesopores. Likewise, an increase of ϕ for
mesopores was observed in relation to a pre-tillage situation.

78 Capítulo 4
No significant differences in λ∆ψ and N∆ψ were observed for both macro- and
mesopores between tillage systems and fallow periods at 40 cm depth. For this
layer, average values of λ∆ψ for macropores and mesopores were 0.98 and 0.10 mm,
respectively. The average N∆ψ for macro- and mesopores was 7 and 13290 pores
per m2, respectively. Although NT presented a similar number of effective
macropores at both 2 and 40 cm depth, these macropores decrease with depth in
tilled plots as observed by Trojan and Linden (1998).
3.4.4. Validity of λ∆ψ as a pore index
Malone et al. (2003) have recently reviewed the literature on the use of tension
infiltrometer measurements to quantify soil surface and subsurface macropores as
affected by tillage. Normally, total “hydraulically active” macroporosity is
determined from tension infiltrometer data according to the procedure proposed by
Watson and Luxmoore (1986). The minimum equivalent pore radius, C0, calculated
from the capillary equation (Eq. 4.6) for a give tension range is used to compute the
maximum number of effective pores per unit area, NWL, using the Poiseuille’s law
[ ] ( )[ ]401 /)(8 CgKKN iiWL πρµ −−= i = 1, 2, …n (4.8)
The effective porosity,θWL, is computed from C0 and NWL (Watson and
Luxmoore, 1986)
20 )(CNWLWL πθ = (4.9)
However, as pointed out by Reynolds et al. (1995), this approach introduces an
inconsistency because K in (Eq. 4.8) is related to the range of pore size participating
in water transmission and C0 relates the maximum pore size of water storage for a
given tension under static conditions. For this reason, we propose to compute both
the number of conductive pores and effective porosity for each pore-size class using
an alternative pore index, λ∆ψ (Eq. 4.3), that defines the representative mean pore
Dynamics of soil hydrophysical properties 79
radius for two consecutive soil water tensions relevant to dynamic conditions
(Reynolds et al., 1995). In theory, λ∆ψ for a given tension range cannot be higher
than the maximum corresponding C0 radius. The fact that λ∆ψ for ψ between – 4
and – 14 cm (Table 4.4) was in all cases less than the maximum C0 for that ψ range
(0.375 mm), demonstrates the consistency of λ∆ψ as a pore index.
If the number of water transmitting pores, NWL (Eq. 4.8), under consolidated soil
conditions is compared with N∆ψ (Eq. 4.3), results show that the procedure of
Watson and Luxmoore (1986) overestimates the number of both macropores (N∆ψ =
0.20 NWL + 0.013; R2 = 0.04) and mesopores (N∆ψ = 0.02 NWL - 0.004; R2 = 0.34).
This finding is explained by the fact that the minimum C0 for macropores (0.375
mm) and mesopores (0.107 mm) considered in (Eq. 4.8) is in most cases smaller
than λ∆ψ (Table 4.4). Consequently, θWL (Eq. 4.9) is greater than θξ (Eq. 4.4) for
macropores (θξ = 0.15θWL + 0.0001; R2 = 0.42) and mesopores (θξ = 0.62θWL –
0.0001; R2 = 0.58).
4. Conclusions
Results show that the type of fallow tillage management in the cereal-fallow
rotation significantly affects soil hydrophysical properties in both the long- and the
short-term. Thus, after 8-10 years of trial in a long-term tillage experiment in
Central Aragon, soil under no-tillage (NT) presented more compacted topsoil than
under conventional (CT) and reduced tillage (RT). Likewise, soil water retention
characteristics showed significant differences between NT and tilled treatments.
Compared with CT and RT, the more dense NT soil resulted in retention curves
exhibiting a more gradual reduction in water content as tension increased, with
lower water content near saturation and a lower available water-holding capacity.
Regardless of tillage system, soil water flow at the soil surface was mainly
regulated by macropores, despite the fact this pore fraction occupies a very small
fraction of total soil porosity. However, although a bigger macropore size was
80 Capítulo 4
observed under NT, soil hydraulic conductivity (K) near saturation under this
treatment was significantly lower than under CT and RT due to a lower number of
water transmitting macro- and mesopores per m2. Overall, no significant differences
in hydraulic properties were found between CT and RT. On the other hand, and
compared with values found at the soil surface, lower K values were observed at 40
cm depth under CT and RT in agreement with greater soil bulk density values at
that layer.
In the short-term, soil hydrophysical properties under CT and RT changed over
the fallow period as a function of soil structure modification by tillage operations
and subsequent rainfall events. Surface soil loosening by tillage increased the
aeration porosity (pores > 300 µm) and decreased the available water retention
micropores (pores between 30 and 0.2 µm). Likewise, tillage significantly increased
the number of water conducting mesopores, which determined a significant increase
of K. However, a decrease of total soil porosity occurred as a consequence of soil
reconsolidation by post-tillage rains and associated wetting and drying cycles. This
implied a reduction of the larger pore-size fractions and, consequently, a decline of
K. The magnitude of these soil structural changes, which tended to restore pre-
tillage conditions, increased with the intensity of post-tillage rainfall events.
Inconsistencies arising from the application of classical capillary rise theory to
calculate the effective radius of hydraulically active pores and related parameters
(Reynolds et al., 1995) were analysed and an alternative pore index proposed. The
soundness of this new index, which is relevant to dynamic conditions and represents
the mean equivalent pore radius for two consecutive soil water tensions, was
verified. The use of this index to calculate the number of water transmitting pores
per unit area of infiltration surface and corresponding effective porosity has shown
how the use of capillary rise approach may overestimate these parameters.

Dynamics of soil hydrophysical properties 81
References
Ahuja, L.R., Fiedler, F., Dunn, G. H., Benjamin, J. G., Garrison, A., 1998. Changes in soil
water retention curves due to tillage and natural reconsolidation. Soil Sci. Soc. Am. J.
62, 1228-1233.
Angulo-Jaramillo, R., Moreno, F., Clothier, B.E., Thony, J.L., Vachaud, G., Fernández-Boy,
E., Cayuela, J.A., 1997. Seasonal variation of hydraulic properties of soils measured
using a tension disk infiltrometer. Soil Sci. Soc. Am. J. 61, 27-32.
Ankeny, M.D. 1992. Methods and theory for unconfined infiltration measurements. In:
Topp, G.C., Reynolds, W.D., Green, R.E. (Eds.), Advances in Measurement of Soil
Physical Properties: Bringing Theory into Practice. Special Publication No. 30, SSSA,
Madison, WI, pp. 123-141.
Arvidsson, J., 1998. Effects of cultivation depth in reduced tillage on soil physical
properties, crop yield and plant pathogens. Eur. J. Agron. 9, 79-85.
Azooz, R.H., Arshad, M.A., Franzluebbers, A.J., 1996. Pore size distribution and hydraulic
conductivity affected by tillage in northwestern Canada. Soil Sci. Soc. Am. J. 60,
1197-1201.
Bruce, R.R., Luxmoore, R.J., 1986. Water retention: field methods. In: A. Klute (Editor).
Methods of soil analysis, Part 1. Physical and mineralogical methods. ASA, Madison,
WI, pp. 667-672.
Cameira, M.R., Fernando, R.M., Pereira, L.S., 2003. Soil macropore dynamics affected by
tillage and irrigation for a silty loam alluvial soil in southern Portugal. Soil Till. Res.
70, 131-140.
Chan, K.Y., Heenan, D.P., 1993. Surface hydraulic properties of a red earth under
continuous cropping with different management practices. Aust. J. Soil Res. 31, 13-24.
Chartres, C.J., 1992. Soil crusting in Australia. In: Sumner, M.E., Stewart, B.A. (Eds.), Soil
Crusting: Chemical and Physical Processes, Lewis Publishers, Boca Raton, Florida, pp.
339-365.
Clothier, B.E., White, I., 1981. Measurement of sorptivity and soil water diffusivity in the
field. Soil Sci. Soc, Am. J. 45, 241-245.
Cresswell, H.P., Painter, D.J., Cameron, K.C., 1993. Tillage and water content effects on
surface soil hydraulic and shortwave albedo. Soil Sci. Soc. A. J., 57: 816-824.

82 Capítulo 4
Dalton, F.N., 1992. Development of time-domain reflectometry for measuring soil water
content and bulk soil electrical conductivity. In: Topp, G.C., Reynolds, W.D., Green,
R.E. (Eds.), Advances in Measurement of Soil Physical Properties: Bringing Theory
into Practice. Special Publication No. 30, SSSA, Madison, WI, pp. 143-167.
Datiri, B.C., Lowery, B., 1991. Effects of conservation tillage on hydraulic properties of a
Griswold silt loam soil. Soil Till. Res. 21, 257-271.
Evett, S.R., Peters, F.H., Jones, O.R., Unger, P.W., 1999. Soil hydraulic conductivity and
retention curves from tension infiltrometer and laboratory data. In: van Genuchten, M.
T., Leij, F.J., Wu, L. (Eds.), Characterization and Measurement of the Hydraulic
Properties of Unsaturated Porous Media. Part 1, USDA, Riverside, California, pp. 541-
551.
Ferré, P.A., Topp, G.C., 2002. Time Domain Reflectometry. In: Dane, J.H., Topp, G.C.
(Eds). Methods of Soil Analysis. Part 4-Physical Methods, SSSA Book Series No. 5,
Madison, WI, USA, pp. 434-446.
Green, R.T., Ahuja, L. R.; Benjamin, J. G., 2003. Advances and challenges in predicting
agricultural management effects on soil hydraulic properties. Geoderma 116, 3-27.
Grossman, R.B., Reinsch, T.G., 2002. Bulk density and linear extensibility. In: Dane, J.H.,
Topp, G.C. (Eds). Methods of Soil Analysis. Part 4-Physical Methods, SSSA Book
Series No. 5, Madison, WI, USA, pp. 201-228.
Hernanz, J.L., López, R., Navarrete, L., Sánchez-Girón, V., 2002. Long-term effects of
tillage systems and rotations on soil structural stability and organic carbon
stratification in semiarid central Spain. Soil Till. Res. 66, 129-141.
Hill, R.L., Horton, R., Cruse, R.M., 1985. Tillage effects on soil water retention and pore
size distribution of two Mollisols. Soil Sci. Soc. Am. J. 49, 1264-1270.
Lampurlanés, J, Cantero-Martínez, C., 2003. Soil bulk density and penetration resistance
under different tillage and crop management systems and their relationships with
barley root growth. Agron. J. 95, 526-536.
Lampurlanés, J., Angás, P., Cantero-Martínez, C., 2002. Tillage effects on water storage
during fallow, and on barley root growth and yield in two contrasting soils of the semi-
arid Segarra region in Spain. Soil Till. Res. 65, 207-220.
Logsdon, S.D., Kaspar, T.C., 1995. Tillage influences as measured by ponded and tension

Dynamics of soil hydrophysical properties 83
infiltration. J. Soil Water Cons. 50, 571-575.
Logsdon, S.D., Jordahl, J., Karlen, D.L., 1993. Tillage and crop effects on ponded and
tension infiltration rates. Soil Till. Res. 28, 179-189.
Logsdon, S.D., Kaspar, T.C., Cambardella, C.A., 1999. Depth-incremental soil properties
under no-till or chisel management. Soil Sci. Soc. Am. J. 63, 197-200.
Logsdon, S.D., Allmaras, R.R, Wu, L., Swan, J.B., Randall, G.W., 1990. Macroporosity and
its relation to saturated hydraulic conductivity under different tillage practices. Soil
Sci. Soc. Am. J. 54, 1096-1101.
López, M.V., Arrúe, J.L., 1995. Efficiency of an incomplete block design based on
geostatistics for tillage experiments. Soil Sci. Soc. Am. J. 59, 1104-1111.
López, M.V., Arrúe, J.L., Sánchez-Girón, V., 1996. A comparison between seasonal
changes in soil water storage and penetration resistance under conventional and
conservation tillage systems in Aragón. Soil Till. Res. 37, 251-271.
López, M.V., Arrúe, J.L., 1997. Efectos del laboreo de conservación en el estado de
agregación y en la infiltración de agua en suelos francos de Aragón. En: L. García-
Torres y P. González (Eds.), Actas del Congreso Nacional sobre Agricultura de
Conservación y Medidas Agroambientales, AELC/SV, Burgos, p. 189-195 (in
Spanish).
Mapa, R. B., Green, R. E., Santo, L., 1986. Temporal variability of soil hydraulic properties
with wetting and drying subsequent to tillage. Soil Sci. Soc. Am. J. 50, 1133-1138.
Malone, R. W., Logsdon, S., Shipitalo, M. J., Weatherington-Rice, J., Ahuja, L., Ma,. L.,
2003. Tillage effect on macroporosity and herbicide transport in percolate. Geoderma
116, 191-215.
McGarry, D., Bridge, B.J., Radford, B.J., 2000. Contrasting soil physical properties after
zero and traditional tillage of an alluvial soil in the semi-arid subtropics. Soil Till. Res.
53, 105-115.
Mellis, D. A., Bruneau, P. M. C., Twomlow, S. J., Morgan, R. P. C., 1996. Field assessment
of crusting on a tilled sandy clay loam. Soil Use Manag. 12, 72-75.
Messing, I., Jarvis, N. J., 1993. Temporal variation in the hydraulic conductivity of a tilled
clay soil as mesured by tension infiltrometers. J. Soil Sci. 44, 11-24.

84 Capítulo 4
Miller, J.J., Sweetland, N.J., Larney, F.J. Volkmar, K.M., 1998. Unsaturated hydraulic
conductivity of conventional and conservation tillage soils in southern Alberta. Can. J.
Soil Sci. 78, 643-648.
Moreno, F., Pelegrín, F., Fernández, J.E., Murillo, J. M., 1997. Soil physical properties,
water depletion and crop development under traditional and conservation tillage in
southern Spain. Soil Till. Res. 41, 25-42.
Moreno, F., Andreu, L., Fernández, J.E., Pelegrín, F., 1999. Measurements of soil hydraulic
properties with a tension disc infiltrometer. In: van Genuchten, M. T., Leij, F.J., Wu,
L. (Eds.), Characterization and Measurement of the Hydraulic Properties of
Unsaturated Porous Media. Part 1, USDA, Riverside, California, pp. 587-591.
Moret, D., López, M.V., Arrúe, J.L., 200x. TDR application for automated water level
measurement from mariotte reservoirs in tension disc infiltrometers. J. Hydrol.
(submitted) (Capítulo 2).
Moret, D., Arrúe, J.L., 200x. Limitations of disk infiltrometers for measuring water flow in
freshly tilled soils. Advances in Geoecology No. 37, Special Issue on “Sustainable Use
and Management of Soils-Arid and Semiarid Regions”, Catena-Verlag (submitted)
(Capítulo 3).
Or, D., Fisher, B., Hubscher, R.A., Wraith, J., 1998. WinTDR 98 V.4.0 –Users Guide-.
Department of Plants, Soil & Biometeorology, Utah State University, Logan, UT.
Perroux, K.M., White, I., 1988. Designs for disc permeameters. Soil Sci. Soc. Am. J. 52,
1205-1215.
Pikul, J.L., Raming, R.E., Wilkins, D.E., 1993. Soil properties and crop yield among four
tillage systems in a wheat-pea rotation. Soil Till. Res. 26, 151-162.
Reynolds, W.D., Gregorich, E.G., Curnoe, W.E., 1995. Characterization of water
transmission properties in tilled and untilled soils using tension infiltrometers. Soil
Till. Res. 33, 117-131.
Rousseva, S., Torri, D., Pagliai, M., 2002. Effect of rain on the macroporosity at the soil
surface. Eur. J. Soil Sci. 53, 83-94.
Roth, C., 1997. Bulk density of surface crusts: depth functions and relationships to texture.
Catena 29, 223-237.

Dynamics of soil hydrophysical properties 85
Sauer, T.J., Clothier, B.E., Daniel, T.C., 1990. Surface measurements of the hydraulic
properties of a tilled and untilled soil. Soil Till. Res. 15, 359-369.
Schwatrz, R. C., Evett, S. R., Unger, P. W., 2003. Soil hydraulic properties of cropland
compared with reestablished and native grassland. Geoderma 116, 47-60.
Soil Survey Staff, 1975. Soil taxonomy: a basic system of soil classification for making and
interpreting soil surveys. USDA-SCS Agric. Handbook 436. US Gov. Print. Office,
Washington, D.C.
Tackett, J.L., Pearson, R.W., 1965. Some characteristics of soil crusts formed by simulated
rainfall. Soil Sci. 99, 407-413.
Topp, G.C., Davis, J.L., Annan, A.P., 1980. Electromagnetic determination of soil water
content: measurement in coaxial transmission lines. Water Resour. Res. 16, 574-582.
Trojan, M. D., Linden, D. R., 1998. Macroporosity and hydraulic properties of
Earthworm-affected soils as influenced by tillage residue management. Soil Sci. Soc.
Am J. 62, 1687-1692.
van Genuchten, M.T., 1980. A close-form equation for predicting the hydraulic properties
of unsaturated soils. Soil Sci. Soc. Am J. 44, 892-898.
Vandervaere, J.P., Peugeot, C., Vauclin, M., Angulo-Jaramillo, R., Lebel, T., 1997.
Estimating hydraulic conductivity of crusted soils using disc infiltrometers and
minitensiometers. J. Hydrol. 188-189, 203-223.
Vauclin, M., Elrick, D.E., Thony, J.L., Vachaud, G., Revol, Ph., Ruelle, P., 1994. Hydraulic
conductivity measurements of the spatial variability of a loamy soil. Soil Technol. 7,
181-195.
Watson, K.W., Luxmoore, R. J., 1986. Estimating macroporosity in a forest watershed by
use of a tension infiltrometer. Soil Sci. Soc. Am. J. 50, 578-582.
White, I., Sully, M.J., 1997. Macroscopic and microscopic capillary length and time scales
from field infiltration. Water Resour. Res. 23, 1514-1522.
Wooding, R. A., 1968. Steady infiltration from a shallow circular pond. Water Resour. Res.
4, 1259-1273.

86 Capítulo 4
Wu, L., Swan, J.B., Paulson, W.H., Randall, G.W., 1992. Tillage effects on measured soil
hydraulic properties. Soil Till. Res. 25, 17-33.

Capítulo 5
Influence of Fallowing Practices on Soil Water and
Precipitation Storage Efficiency in Semiarid Aragon
(NE Spain)
D. Moret, J.L Arrúe and M.V. López
To be submitted to: Agricultural Water Management


89
Influence of Fallowing Practices on Soil Water and
Precipitation Storage Efficiency in Semiarid Aragon (NE
Spain)
ABSTRACT
In semiarid drylands of Central Aragon, the cereal-fallow rotation, with
mouldboard ploughing as main cultivation, is the most traditional farming system, in
which a weed-free long fallow period (16-18 months) is used to increase soil water
storage and water available for the next crop. However, the ability of long fallow to
store water has been questioned in several semiarid regions. This research was aimed
to quantify soil water losses (E), soil water storage (SWS) and precipitation storage
efficiency (PSE) of long fallow under three management systems (conventional tillage,
CT; reduced tillage, RT; no-tillage, NT). The PSE of long fallow relative to short
fallow (5-6 months) was also evaluated. Over three experimental years (1999-2002), soil
water balance for both short and long fallow periods was calculated from fallow
seasonal precipitation and volumetric soil water content (0-70 cm depth). During long
fallowing, primary tillage implemented in CT and RT plots induced significant E losses
from the plough layer for the first 24 h after tillage. However, secondary tillage under
CT and RT appeared to have a positive effect on soil water conservation at the end of
fallow. Despite a different soil water dynamics among treatments, total E at the end of
fallow was similar for the three fallow management systems. The partitioning of long
fallow into three sub-periods showed that the early phase (July-November) was the
most efficient in terms of SWS, having the lowest average daily evaporation rate (Er)
per day (0.65 mm day-1). The overwinter period (December-May) and the late period
(June-November) had greater Er values (0.93 and 1.09 mm day-1, respectively) and
variable SWS as a function of rainfall pattern in those periods. In general, PSE, either
for each fallow phase or the entire fallow period , increased when most of seasonal

90 Capítulo 5
effective rainfalls ( ≥ 10 mm day-1) were received in the last two months of each period
regardless of total rainfall. Overall, long fallow PSE was small (11% on average).
Neither SWS nor PSE were significantly affected by the tillage system. The average
additional soil water at sowing with long fallow compared with short fallow was 22
mm. Correspondingly, the average precipitation storage efficiency of long fallow
relative to short fallow was only 5.2%. As a conclusion, long fallowing as an agronomic
practice to enhance soil water storage for the subsequent crop is not enough justified
on the study area.
1. Introduction
Water is the main limiting factor for grain production in rainfed farming systems
of many semiarid dryland regions. Cereal crops are frequently grown under a crop-
fallow system (one crop every two years), which generally involves a long-fallow
period used to increase soil water storage and thus the amount of water available to
the succeeding crop. With this widespread practice, no crop is grown during the
fallow, weeds are controlled by repeated tillage or chemicals, and, in general, the
soil water recharge occurs during the overwinter fallow period when temperatures
and evaporative demand are low and the precipitation is high. However,
contradictory judgements of fallow use to increase soil water storage are found in
the literature. Thus, whereas Bonfil et al. (1999) observed, working in a semiarid
region of Israel, that the fallow year was beneficial in terms of water storage,
Farahani et al. (1998b) questioned this practice in semiarid Great Plains of USA
since only about 20% of fallow precipitation was stored as soil water.
Regarding soil management during fallow in semiarid dryland zones,
conventional tillage management, with mouldboard ploughing as primary tillage
followed by repeated shallow ploughing, has been found inefficient for soil water
conservation (Aase and Siddoway, 1982; Dao, 1993) and soil protection against
wind and water erosion (Pannkuk et al., 1997). Thus, adoption of conservation
tillage systems has been proposed as an alternative to the traditional fallow tillage

Fallow water storage efficiency 91
management (Schillinger, 2001). However, the agronomic advantages of
conservation tillage have been also questioned when soil water storage efficiency
during and at the end of the fallow period is analysed. Whereas some authors
(Incerti et al., 1993; Dalrymple et al., 1993; Unger, 1994; Pannkuk et al., 1997; and
Tanaka and Anderson, 1997) did not observe differences in soil water storage
between conventional and conservation tillage, other researchers (Schillinger and
Bolton, 1993; O’Leary and Connor; 1997; Jones and Popham, 1997) reported that
no-tillage increases the fallow precipitation storage efficiency. Although this
efficiency has substantially increased under the modern no-till and residue
management techniques, it is evident that even under these conservation practices,
the original criticism of fallow still remains, and fallow precipitationstorage
efficiency remains low (Farahani et al., 1998a).
In the cereal growing areas of Central Aragon, a semiarid region in the Ebro
River valley of Spain with an average annual precipitation less than 400 mm,
rainfall is sporadic and highly variable from year to year during both the fallow
period and the growing season. The fallow period extends from harvest (June-July)
and continues for 16 to 18 months until sowing (November-December) in the
following year. Farmers traditionally use mouldboard ploughing plus repeated
secondary tillage cultivations for weed control during the long-fallow period.
Despite the significance of fallowing for dryland cereal agriculture in Central
Aragon and other semiarid areas of the Ebro River valley, the number of field
measurements of water stored during the long-fallow period and its corresponding
storage efficiency is rather limited. López et al. (1996) reported that fallowing in the
cereal-fallow rotation, with either traditional or conservation tillage management,
appears to be an inefficient practice for improving soil water storage when
compared with continuous cropping. Lampurlanés et al. (2002) found no
differences in soil water storage between conventional and conservation tillage
systems at the end of the long-fallow period.

92 Capítulo 5
The objectives of this study, which is included in a long-term field experiment
aimed to evaluate the feasibility of conservation tillage systems in a dryland cereal-
growing area of Central Aragon, were to quantify and compare the efficiency of
conventional tillage vs. conservation tillage (reduced tillage and no-tillage) to
conserve water over three 16-18 month fallow periods. In addition, soil water losses
by evaporation immediately after primary and secondary tillage implementation
were evaluated. Finally, the precipitation storage efficiency of long-fallow under
the three fallow tillage management systems was compared with the efficiency of
the short-fallow (5-6 month long) in the continuous cropping system.
2. Material and methods
2.1. Site, fallow tillage systems and experimental design
The research was conducted at the dryland research farm of the Estación
Experimental de Aula Dei (CSIC) in Peñaflor, Zaragoza province (latitude 41º
44’N; longitude 0º 46’W; altitude 270 m). The climate is semiarid with an average
annual precipitation of 390 mm and an average annual air temperature of 14.5 ºC.
Soil at the research site is a loam (fine-loamy, mixed thermic Xerollic Calciorthid)
according to the USDA soil classification (Soil Survey Staff, 1975). Additional
information on the site and soil characteristics can be found elsewhere (López et al.,
1996).
The study was conducted on three adjacent large blocks of plots, which were set
up on a nearly level area in 1990 (Field 1), 1991 (Field 2) and 1992 (Field 3), within
a long-term conservation tillage experiment. Winter barley (Hordeum vulgare L.)
was cultivated as continuous cropping (CC) in Field 1 (hereafter called CC1), and
under the traditional cereal–fallow rotation (CF) in Fields 2 (CF2) and 3 (CF3). The
study was carried out when the three fields were in the fallow phase of their
respective cropping system, which extends from harvest (June-July) to sowing
(November-December) on the following year in the CF rotation (16-18 month long

Fallow water storage efficiency 93
fallow) and on the same year in the CC system (5-6 month short fallow). Field
measurements were made from harvest in June 1999 to sowing in November 2002
and comprised three consecutive long fallow seasons (1999-2000 season in field
CF3, 2000-2001season in field CF2 and 2001-2002 season again in field CF3) and
three short fallow periods in field CC1 (Table 5.1). At the beginning of this study
the tillage comparison experiment was in its 10th year of trial. The long-fallow
season was split into three well-differentiated phases or sub-periods: the first one
from harvest to late fall (HF), the second from late fall to early summer (FS) and
the third one from early summer to sowing (SS).
Three fallow management treatments were compared: conventional tillage (CT),
reduced tillage (RT) and no-tillage (NT). The CT treatment consisted of
mouldboard ploughing of fallow plots to a depth of 30-40 cm in late winter or early
spring, followed by secondary tillage with a sweep cultivator to a depth of 10-15 cm
in late spring. In the RT treatment, primary tillage was chisel ploughing to a depth
of 25-30 cm (non-inverting action), followed, as in CT, by a pass of sweep
cultivator in late spring. Dates of both primary and secondary tillage operations
were the same for the CT and RT treatments (Table 5.1). NT used exclusively
herbicides (glyphosate) for weed control throughout the fallow season.
Tillage treatments were arranged in an incomplete block design based on
geostatistical concepts, with three replications for the RT and NT treatments and
four for the CT treatment (López and Arrúe, 1995). The three large blocks of ten
plots were arranged according to a split block design with tillage as the main plot
and cropping system as the subplot. The size of the elemental plot was 33.5 m x 10
m, with a separation of 1 m between plots. Within each incomplete block a 7 m x 7
m region was delimited for soil measurements at two observation points (one per
treatment) separated by a distance of 5 m. To compare the effects of tillage
treatments within each cropping system, analysis of variance (ANOVA) for
incomplete block design was used (López and Arrúe, 1995). Duncan’s multiple

94 Capítulo 5
Tab
le 5
.1. S
tart
ing
and
endi
ng d
ates
for
the
expe
rim
enta
l fal
low
per
iods
and
sub
-per
iods
and
tim
ing
of ti
llage
pra
ctic
es.
Fall
ow
peri
od
Fiel
d†
Fal
low
‡ ph
ase
Sta
rtin
g da
te
(h
arve
st)
End
ing
date
(so
win
g)
Dur
atio
n
(day
s)
Pri
mar
y til
lage
da
te
Sec
ond
ary
tilla
ge
date
Lon
g fa
llow
per
iod
(17-
18 m
ont
hs)
1999
-200
0 C
F3
H
F 26
Jun
e 19
99
30 N
ov. 1
999
158
25 A
pril
200
0 29
May
200
0
F
S 1
Dec
. 199
9
31 M
ay 2
000
182
SS
1 J
une
2000
13
Dec
. 200
0 19
6
2000
-200
1 C
F2
H
F 20
Jun
e 20
00
30 N
ov. 2
000
164
10 A
pril
200
1 6
Jun
e 20
01
FS
1 D
ec. 2
000
31
May
200
1 18
2
S
S 1
Jun
e 20
01
23 N
ov. 2
001
176
2001
-200
2 C
F3
H
F 29
Jun
e 20
01
30 N
ov. 2
001
155
13 M
arch
200
2
11 J
une
2002
F
S 1
Dec
. 200
1
31 M
ay 2
002
182
SS
1 J
une
2002
19
Nov
. 200
2 17
2
Shor
t fal
low
per
iod
(5-6
mo
nths
)
2000
C
C1
20
Jun
e 20
00
13 D
ec. 2
000
177
22 N
ov. 2
000
12 D
ec. 2
000
2001
C
C1
29
Jun
e 20
01
23 N
ov. 2
001
148
1 N
ov.
200
1 22
Nov
. 200
1
2002
CC
1
19 J
une
2002
19
Nov
. 200
2 15
4 2
No
v. 2
002
18 N
ov. 2
002
† CC
1: f
ield
1 u
nder
con
tinuo
us c
ropp
ing;
CF2
, CF3
: fie
lds
2 an
d 3
unde
r cr
op-f
allo
w r
otat
ion.
‡ H
F: h
arve
st to
late
fal
l; FS
: lat
e fa
ll to
ear
ly s
prin
g; S
S: e
arly
spr
ing
to s
owin
g.

Fallow water storage efficiency 95
range test was used to compare between treatment means.
2.2. Field measurements and calculations
2.2.1. Weather
Daily meteorological observations were made at the experimental site over the
whole experimental period using an automated weather station. Precipitation was
measured at 1.5 m with a tipping bucket rain gauge (model ARG100, Campbell
Scientific Inc.), air temperature and relative humidity were measured at 1.8 m with
a combined sensor (model HMP35AC, Vaisala), wind speed and direction were
measured at 2 m with a combined sensor (model 05103-5, Young) and solar
radiation at 2 m with a pyranometer (model SP1110, Skye). All sensors were
connected to a data logger (model CR10, Campbell Scientific Inc.), which
continuously recorded 60-min averages of data acquired at intervals of 10 s. As a
measure of the natural atmospheric evaporative demand of the climate during the
different phases of the fallow period, reference evapotranspiration (ETo) was
calculated with the FAO Penman-Monteith equation from daily meteorological data
(Allen et al., 1998). Since only actual evapotranspiration values were required, ETo
calculations were made without correction of weather data observed to reference,
well-watered conditions (Allen et al., 1998).
2.2.2. Soil moisture measurements
During the experimental period, the volumetric soil water content (θ) content in
the 0-10, 0-20, 0-40 and 0-70 cm soil layers was continuously monitored, on a
weekly basis or as a function of rainfall events, by Time Domain Reflectometry
(TDR). For this purpose, four probes of two parallel stainless steel rods (diameter: 4
mm; length: 150, 250, 450 and 750 mm; spacing between rod centers: 50 mm) were
inserted vertically into the soil at the observation point to a depth of 10, 20, 40 and
70 cm (Ferré and Topp, 2002). According to Dalton (1992), the protruding TDR
96 Capítulo 5
electrode pair were connected to a cable tester (model 1502C, Tektronix) by means
of a quick disconnect type interface housing a 50-200 Ω impedance matching pulse
transformer. Waveforms were transferred to a laptop with a SP232 serial
communication module and analysed using the software WinTDR’98 (Or et al.,
1998). The model proposed by Topp et al. (1980), which proved to be suitable for
our soil in a previous laboratory calibration experiment, was used to estimate θ for
each soil depth. The multiple length probe method described by Miyamoto et al.
(2001) was used afterwards to calculate θ for the 0-10, 10-20, 20-40 and 40-70 cm
soil profile layers. Specifically soil moisture measurements were taken just before
and 24 h after primary and secondary tillage operations implemented in the CT and
RT plots. The incomplete block design described before implied a total of 18
measurements of θ (6 per treatment) on each fallow field per soil depth and
observation date.
2.3. Soil water balance and precipitation storage efficiency
Given the flat condition of the three experimental fields, runoff can be neglected.
Thus at a good first approximation, the soil water budget for a given fallow period
or sub-period simplifies to:
P = E + SWS (5.1)
where P (mm) is the rainfall recorded over the time period in question, E (mm) is
the sum of all water losses mainly by evaporation from the soil surface and
drainage, and SWS (mm) is the soil water storage in the soil profile (0-70 cm depth)
calculated from the profile soil water at the end minus the profile soil water at the
beginning of the fallow period.
The fallow precipitation storage efficiency (PSE) for specific or entire fallow
periods was calculated as the percentage of precipitation that is stored as soil water
(Farahani et al., 1998a) as:

Fallow water storage efficiency 97
PSE = (SWS / P) x 100 (5.2)
The water storage efficiency of long fallow in the CF rotation with respect to the
CC system (RPSE) was calculated using the equation
RPSE = (∆SWS / PTS) x 100 (5.3)
where ∆SWS is the additional soil water (0-70 cm) at sowing with a long fallow
compared with a short fallow and PTS the rainfall received from the date of primary
tillage in the CC system in autumn to sowing in both cropping systems on the
following year (López et al., 1996).
3. Results and discussion
3.1. Weather conditions
The experimental (26 June 1999-19 November 2002) period was drier than
normal. Total precipitation received during the first (1999-2000), second (2000-
2001) and third (2001-2002) long-fallow periods was 4, 13, and 10%, respectively,
below the long-term average. Rainfall patterns were also contrasted among the three
fallow periods and, particularly, among fallow sub-periods (Table 5.2). The
precipitation in the early fallow sub-period, HF (July-November), was 20% and
39% below normal in the 1999-2000 and 2001-2002 fallows and 28% above normal
in the 2000-2001 fallow. In the second sub-period, FS (December-May), rainfall
below long-term average in the 2001-2002 fallow. On the other hand, while the
contribution of SS rainfall to total seasonal precipitation was high in the 1999-2000
(48%) and 2001-2002 (43%) fallows, in the 2000-2001 fallow this fraction was
much lower (23%).
Over the entire experimental period, about 50% of total precipitation was
received in rainfalls of less than 10 mm. As can be seen in Table 5.2, the effective
rainfall (here defined as the fraction of monthly precipitation received in days with
a rainfall ≥ 10 mm) can be very low or even nil in almost every month. These

98 Capítulo 5
Tab
le
5.2.
M
onth
ly
rain
fall
to
tals
du
ring
th
e 19
99-2
000,
20
00-2
001
and
2001
-200
2 lo
ng-f
allo
w
seas
ons,
w
ith
corr
espo
ndin
g lo
ng-t
erm
ave
rage
s (1
954
- 20
02),
and
mea
n m
onth
ly r
efer
ence
eva
pora
tion
(E
T 0)
for
the
1999
-200
2 pe
riod
at
Peñ
aflo
r ex
peri
men
tal s
ite.
Pre
cipi
tati
on
E
T0†
1999
-200
0
20
00-2
001
2001
-200
2
Mo
nth
T
ota
l E
R‡
NE
R§
Tota
l E
R
NE
R
Tot
al
ER
N
ER
1954
- 2
002
av
erag
e
1999
-200
2
aver
age
m
m
m
m d
ay-1
July
27
0
27
4
0
4
3
0
3
17
6.6
A
ugus
t
9
0
9
7
0
7
2
0
2
24
6.3
Se
ptem
ber
46
21
25
9
0
9
60
58
2
41
4
.2
Oct
obe
r
33
0
33
12
2
90
32
25
0
25
40
2
.4
No
vem
ber
15
13
2
66
39
27
10
0
10
41
1
.9
Dec
embe
r
7
0
7
36
0
36
3
0
3
28
1.0
Ja
nuar
y
14
13
1
44
19
23
22
0
22
27
1.0
Fe
brua
ry
1
0
1
4
0
4
6
0
6
23
2
.1
Mar
ch
25
20
5
21
0
21
48
40
8
28
2
.9
Apr
il
62
27
35
5
0
5
27
20
7
36
3
.9
May
40
11
30
54
25
29
76
49
27
50
4.8
Ju
ne
48
28
20
9
0
9
40
25
15
36
6
.5
July
4
0
4
3
0
3
17
0
17
17
6.6
A
ugus
t
7
0
7
2
0
2
9
0
9
24
6.3
Se
ptem
ber
9
0
9
60
58
2
60
53
7
41
4
.2
Oct
obe
r
122
90
32
25
0
25
54
31
13
40
2
.4
No
vem
ber
66
39
27
10
0
10
35
0
35
41
1
.9
17-m
o to
tal
53
5
48
1
49
7
55
4
†
Ref
eren
ce e
vapo
tran
spir
atio
n ca
lcul
ated
with
the
FAO
Pen
man
-Mon
teith
equ
atio
n (A
llen
et a
l., 1
998)
. ‡
ER
: eff
ectiv
e ra
infa
ll (f
ract
ion
of m
onth
ly p
reci
pita
tion
rece
ived
in d
ays
with
a p
reci
pita
tion
>10
mm
).
§ N
ER
: non
-eff
ectiv
e ra
infa
ll (f
ract
ion
of m
onth
ly p
reci
pita
tion
rece
ived
in d
ays
wit
h a
prec
ipita
tion
<10
mm
).

Fallow water storage efficiency 99
features are consistent with those reported by McAneney and Arrúe (1993)
analysing a 35-yr time series of monthly rainfall data from a location within the
study area. The small rainfall events during fallow tend to evaporate rapidly without
making a significant contribution to soil water storage (SWS), which limits how
much precipitation storage efficiency (PSE) can be improved in this harsh semiarid
environment.
Rainfall registered during the CC1 short fallow (July-November) was 28 and 7%
above normal for the years 2000 and 2002, respectively and 39% below normal in
2001.
3.2. Soil water balance during fallow
Table 5.3 summarises the soil water loss (E), soil water storage (SWS) and
precipitation storage efficiency (PSE) for the three experimental fallow periods. As
discusses below, tillage management and rainfall pattern during the three periods in
which the fallow was partitioned differently affect these fallow characteristics.
3.2.1. Soil water losses
Overall, during the first phase of fallow, HF, from harvest to late fall, soil water
loss (E) was small compared with the second an third fallow phases in the three
fallow periods (Table 5.3). Even though in the first part of HF (July-September)
potential evaporation is high (6.5 mm day-1) (Table 5.2), the reasons for a low E in
the entire HF phase can be related with: i) a higher crop residue on soil surface
(López et al., 2003), which reduces the evaporation by reflecting solar radiation and
slowing the connective transport of vapour from the surface when the soil surface is
wet (Pannkuk et al., 1997; O’Leary and Connor, 1997); ii) the presence of a dry and
compacted layer at the soil surface with a variable thickness (i.e. soil crust), which
actes as a surface resistance to soil evaporation (van de Griend and Owe, 1994); and
iii) a low θ and rainfall after harvest (July-August), when ET0 is high, and a low

100 Capítulo 5
Tab
le 5
.3.
Soil
wat
er l
oss
(E),
soi
l w
ater
sto
rage
(SW
S) a
nd p
reci
pita
tion
stor
age
effi
cien
cy (
PSE
) du
ring
spe
cifi
c ph
ases
of
the
1999
-200
0, 2
000-
2001
and
200
1-20
02 l
ong
fallo
w s
easo
ns u
nder
con
vent
iona
l til
lage
(C
T),
red
uced
till
age
(RT
) an
d no
-til
lage
(N
T).
H
arve
st to
late
fal
l
Lat
e fa
ll to
late
spr
ing
L
ate
sprin
g to
sow
ing
E
ntire
fal
low
Fallo
w
seas
on
T
illag
e tr
eatm
ent
E†
(mm
) SW
S‡ (m
m)
% o
f tot
al
SWS
PSE
§
(%)
E
(m
m)
SW
S (m
m)
% o
f to
tal
SWS
PSE
(%
)
E
(mm
) S
WS
(mm
) %
of
tota
l SW
S P
SE
(%)
E
(m
m)
SWS
(mm
) P
SE
(%)
1999
-200
0
CT
97
35
3
7 27
151
-2
-2
-1
20
3 62
6
5 23
451
95
17
RT
99
33
3
1 25
136
13
12
9
205
60
57
22
44
0 10
6 19
N
T
94
38
39
29
12
9 20
2
0 13
224
40
41
15
44
8 98
18
L
SD¶
NS
NS
N
S
15
15
N
S
NS
NS
N
S
NS
NS
NS
2000
-200
1
CT
12
6 87
27
2 4
21
0 -4
6 -1
44
-28
11
8 -9
-2
8 -9
454
32
7
R
T
153
60
250
28
19
3 -2
9 -1
21
-18
11
6 -7
-2
9 -7
462
24
5
N
T
151
62
327
29
19
7 -3
3 -1
74
-20
11
9 -1
0 -5
3 -9
467
19
4
L
SD
18
18
8
N
S N
S
NS
N
S N
S
NS
N
S N
S N
S
2001
-200
2
CT
79
21
4
6 21
144
35
76
19
19
4 -1
0 -2
2 -5
417
46
10
RT
84
16
3
7 16
134
45
105
25
20
2 -1
8 -4
2 -1
0
420
43
9
N
T
84
16
41
16
14
1 38
9
7 21
199
-15
-38
-8
42
4 39
8
LSD
N
S N
S
NS
N
S N
S
NS
N
S N
S
NS
N
S N
S N
S
†
E. (
for
a gi
ven
fallo
w p
erio
d) =
sum
of
wat
er lo
sses
fro
m th
e so
il pr
ofile
(0-
70 c
m)
by e
vapo
ratio
n an
d dr
aina
ge.
‡ SW
S (f
or a
giv
en f
allo
w p
erio
d) =
pro
file
soi
l w
ater
at
the
end
min
us t
he p
rofi
le s
oil
wat
er a
t th
e be
ginn
ing
of t
he f
allo
w p
erio
d. P
erce
ntag
e of
SW
S =
(SW
Sdur
ing
a gi
ven
fallo
w p
erio
d di
vide
d by
tota
l sto
red
wat
er d
urin
g th
e en
tire
fallo
w)
x 10
0
§
PSE
(fo
r a
give
n fa
llow
per
iod)
= (
SWS
divi
ded
by p
reci
pita
tion
duri
ng th
at p
erio
d) x
100
¶ L
east
sig
nifi
cant
dif
fere
nce,
P <
0.0
5. N
S, n
ot s
igni
fica
nt

Fallow water storage efficiency 101
evaporative demand at the end of the sub-period (Table 5.2). Over the three fallow
periods, E was positively correlated with the precipitation, P, received in the HF
period (E = 0.54 P + 26.82; R2 = 0.92). On the other hand, E was significantly
affected by the tillage treatment only in the 2000-2001 fallow period, where a lower
initial soil water stored under CT determined a lower soil water loss for this
treatment.
Primary tillage implementation in the CT and RT plots during the second fallow
phase, FS (late fall to late spring), induced significant changes in soil water content
for the 0-40 cm layer (Fig. 5.1). Short-term tillage-induced effects on soil water flux
under CT and RT resulted in soil water evaporation losses significantly larger than
under NT (Fig. 5.2a). This important soil water losses immediately after tillage, also
reported by Reicosky et al. (1999), may be related with an increment in soil surface
roughness (Fig. 5.3), which reduces the albedo and increases the potential
evaporation by concentrating heat in the surface (Linden, 1982). In addition, soil
roughness also increases the surface area of soil exposed to the atmosphere thus
allowing greater penetration of wind, which favours soil water evaporation from
tilled soil (Jalota and Prihar, 1998). For instance, primary tillage implementation on
10 April 2001 in the 2000-2001 fallow was coincident with a WNW cierzo wind
event that showed a mean daily wind speed of 5.3 and 7.8 m s-1 on 10 and 11 April
2001, respectively. Mean daily wind speed on the secondary tillage day (6 June
2001) in that fallow season was also significant (4.3 m s-1). Overall, mouldboard
ploughing with soil inversion up to 35-40 cm depth in the CT plots induced a higher
E than vertical chisel ploughing in RT (Fig. 5.2a). Over the three experimental
years, the hourly soil water evaporation rate for the first 24 hours after tillage (Eh)
averaged 0.59 and 0.46 mm h-1 for CT and RT, respectively, compared with the
0.05 mm h-1 measured under NT. For the 2000-2001 and 2001-2002 fallow periods,
Eh under RT (0.34 and 0.37 mm h-1, respectively) was similar to the Eh reported by
Reicosky et al. (1999) (≈ 0.35 mm h-1). The highest Eh during the 1999-2000 fallow

102 Capítulo 5
Water content, θ (m3 m-3)
0.0 0.1 0.2
De
pth
(cm
)
0.0 0.1 0.2 0.0 0.1 0.2 0.3
2001
2002
2000
40-70 -
0-10 -
10-20 -
20-40 -
40-70 -
0-10 -
10-20 -
20-40 -
40-70 -
0-10 -
10-20 -
20-40 -
-
-
-
-
-
-
-
-
-
-
-
-
-
-
-
-
-
-
-
-
-
-
-
-
CTRTNT
Figure 5.1. Soil water content profile measured under conventional tillage (CT), reduced tillage (RT) and no-tillage (NT) treatments before (continuous line) and after (broken line) primary tillage implementation on CT and RT plots in the 1999-2000, 2000-2001 and 2001-2002 fallow periods. Horizontal bars represent LSD (P<0.05) for comparison among tillage treatments, where significant differences were found.

Fallow water storage efficiency 103
0
5
10
15
20a
a a
b
cb
a a aa
a a a
a
a ba
2000 2001 2002 2000 2001 2002
bc
b
RT NT
CT
Cu
mul
ativ
e ev
apo
ratio
n (m
m)
Figure 5.2. Cumulative water loss by evaporation under conventional tillage (CT), reduced tillage (RT) and no-tillage (NT) for the first 24 hours after tillage implementation on CT and RT plots in the 1999-2000, 2000-2001 and 2001-2002 fallow periods: (a) from the 0-40 cm soil layer after primary tillage; and (b) from the 0-20 cm soil layer after secondary tillage. Different letters above bars indicate significant differences at P<0.05.
ba
Figure 5.3. Soil surface roughness following mouldboard ploughing (a) and chiselling (b) at the experimental site.

104 Capítulo 5
period (Fig. 5.2a) could be explained by a higher θ in the plough layer at the time of
tillage as a consequence of the rainfall (32 mm) received in the 20-day period
before tillage (Fig 5.4a) that favoured soil water loss immediately after tillage. The
constancy of the differences in θ between tillage systems for a certain period after
primary tillage (Fig. 5.4) proves the reliability of the measured water losses by TDR
24 hours after tillage in the CT and RT plots. The contribution of the different soil
layers in the upper 40 cm to these water losses differed between CT and RT.
Overall, whereas under CT (mouldboard ploughing) soil water los from the 0-10,
10-20 and 20-40 cm represented, respectively, 18, 31 and 51% of the total E, soil
water lost from the 0-40 cm depth under RT (chiselling) was more homogeneously
distributed with depth (32, 30 and 38% of E from the 0-10, 10-20 and 20-40 cm
layers, respectively) (Fig. 5.1). Primary tillage operations appear to have a
cumulative effect on E also in the medium-term after tillage. In general, cumulative
E varied in the order CT > RT > NT. For instance, in the 2000-2001 fallow period,
the cumulative E for the 23-day period after primary tillage was higher under CT
(29 mm) than under RT (20 mm) and NT (16 mm) (Fig. 5.5a). These water losses
mainly occurred, as explained above, on the first day after tillage. Afterwards, and
compared with NT, a higher decrease in the daily evaporation rate, Er, is observed
under CT and RT due to a higher water depletion in the plough layer immediately
after tillage in these treatments. Thus, the average Er under CT and RT for the 22-
day period elapsed from DOY 107, 24 hours after tillage implementation, and DOY
129 was lower (0.57 and 0.59 mm day-1 for CT and RT, respectively) than under
NT (0.67 mm day-1). Globally, results also showed that mouldboard ploughing has
amore sustained effect on soil water evaporation, which was reflected at the end of
the FS phase in the three fallow periods by higher E values under CT (Table 5.3).
During the late fallow phase, SS (late spring to barley sowing), secondary tillage
induced additional soil water loss under CT and RT, which mainly occurred from
the upper 20 cm of soil. Overall, the average E for the first 24 hours after
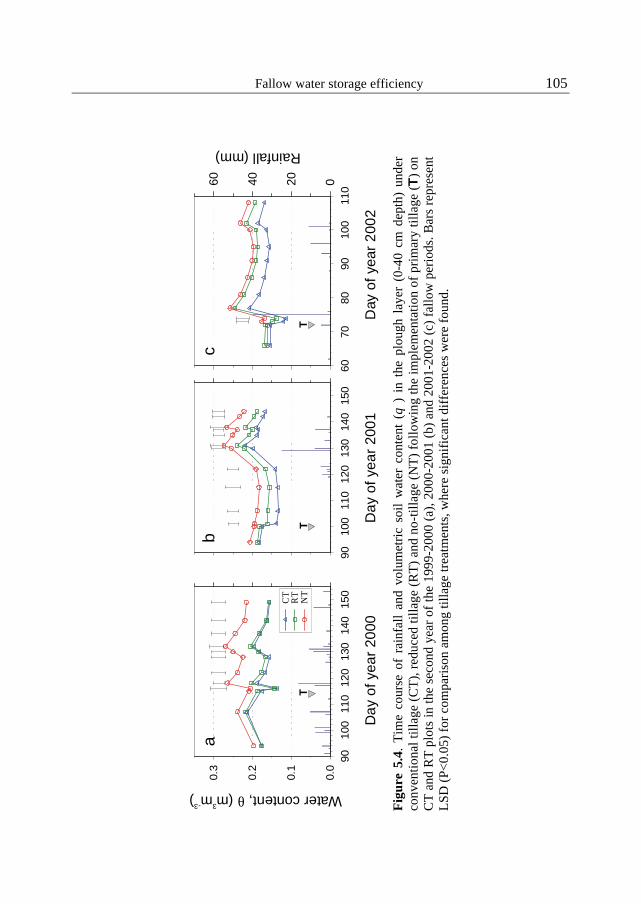
Fallow water storage efficiency 105
Water content, (mm) θ3-3
Rainfall (mm)
Da
y o
f ye
ar
20
00
90
100
110
120
130
140
150
0.0
0.1
0.2
0.3
CT
a
60
7080
90
100
110
0204060
Day
of
year
200
2D
ay
of
yea
r 200
1
90
100
110
120
130
140
150
cb
RT
NT
TT
T
Fig
ure
5.4.
Tim
e co
urse
of
rain
fall
and
volu
met
ric
soil
wat
er c
onte
nt (
θ )
in t
he p
loug
h la
yer
(0-4
0 cm
dep
th)
unde
r co
nven
tion
al ti
llag
e (C
T),
red
uced
till
age
(RT
) an
d no
-til
lage
(N
T)
foll
owin
g th
e im
plem
enta
tion
of
prim
ary
till
age
(T)
on
CT
and
RT
plo
ts in
the
seco
nd y
ear
of th
e 19
99-2
000
(a),
200
0-20
01 (
b) a
nd 2
001-
2002
(c)
fal
low
per
iods
. Bar
s re
pres
ent
LSD
(P<
0.05
) fo
r co
mpa
riso
n am
ong
tilla
ge tr
eatm
ents
, whe
re s
igni
fica
nt d
iffe
renc
es w
ere
foun
d.
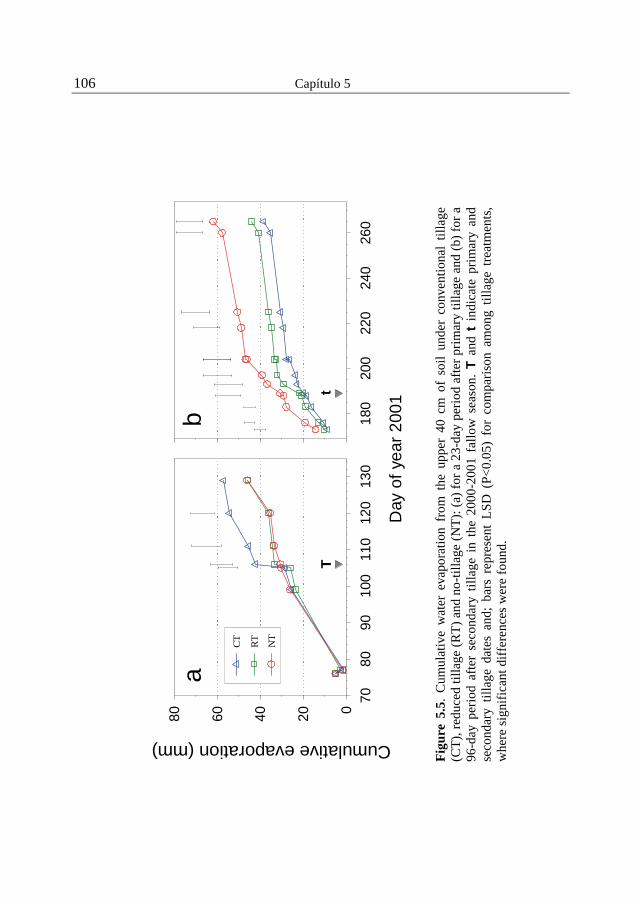
106 Capítulo 5
Cumulative evaporation (mm)
180
200
220
240
260
Day
of
year
20
01
708
090
100
110
120
130
0
20
40
60
80
ab
tT
RT
NT
CT
Fig
ure
5.5.
Cum
ulat
ive
wat
er e
vapo
ratio
n fr
om t
he u
pper
40
cm o
f so
il un
der
conv
entio
nal
tilla
ge
(CT
), r
educ
ed ti
llag
e (R
T)
and
no-t
illa
ge (
NT
): (
a) f
or a
23-
day
peri
od a
fter
pri
mar
y ti
llag
e an
d (b
) fo
r a
96-d
ay p
erio
d af
ter
seco
ndar
y ti
llag
e in
the
200
0-20
01 f
allo
w s
easo
n. T
and
t i
ndic
ate
prim
ary
and
seco
ndar
y til
lage
dat
es a
nd;
bars
rep
rese
nt L
SD (
P<0.
05)
for
com
pari
son
amon
g til
lage
tre
atm
ents
, w
here
sig
nifi
cant
dif
fere
nces
wer
e fo
und.

Fallow water storage efficiency 107
secondary tillage application was again greater under CT (4.2 mm) and RT (4.1
mm) than under NT (1.6 mm) (Fig. 5.2b). Hatfield et al. (2001) reported soil water
evaporation fluxes from 10 to 12 mm for a 3-d period following a pass with a
cultivator in spring and < 2 mm under NT over the same period. Although lower
than the water losses occurred immediately after primary tillage, E after secondary
tillage can be also associated with an increment of both soil surface area and
roughness (Jalota and Prihar, 1998). However, secondary tillage appears to have a
positive effect on soil water conservation in the medium-term. For instance, in the
2000-2001 fallow period, Er 96 days after secondary tillage application was the
lowest for CT and RT (0.40, 0.46 and 0.64 mm day-1 for CT, RT and NT,
respectively) (Fig. 5.5b). These results are in agreement with Jalota and Prihar
(1998), who reported that while a short time after tillage Er from tilled soil exceeds
that from the untilled soil, after a certain time, following the formation of a dry
layer because of accelerated drying of the tilled surface soil, Er from tilled soil lags
behind Er from untilled soil. This change in Er can be explained by the breaking of
capillary channels continuity from the subsoil to the soil surface after sweep plough
tillage (Schillinger and Bolton, 1993; Jalota and Prihar, 1998). Since this cultivation
was applied at the end of spring (Table 5.1), a loose structure and dryness of fine
tilled soil could also have contributed to reduce Er by providing thermal insulation
in the topsoil that decreased thermally-induced upward both liquid and vapour flow
from the subsoil (Papendick, 1987). Even though secondary tillage alters the
dynamics of Er, this field operation did not induced significant differences among
tillage systems in E at the end of the SS period (Table 5.3).
Overall, the early HF period had the lowest Er (0.65 mm day-1), followed by the
overwinter FS and late SS periods with 0.93 and 1.09 mm day-1, respectively. For
the entire log-fallow period, E was not significantly affected by the fallow tillage
system (Table 5.3). Although it has been showed that tillage implementation
increases E in the short-term, this effect is not reflected at the end of fallow. It

108 Capítulo 5
appears that the rapid water depletion in the soil profile after tillage determines in
long-term a reduction of Er in the tilled plots relative to untilled system, which leads
to similar total E in the three tillage treatments.
3.2.2. Soil water storage and efficiency
Effects of seasonal fallow precipitation
Figure 5.6 shows the dynamics of the water stored in the 0-70 cm soil profile
(SWS) over the three experimental long-fallow periods computed in reference to the
start of each fallow period. In general, the variation of SWS and PSE for a given
fallow phase can be, in principle, related to the potential evaporation, but sometimes
such variation can be more closely related to the rainfall received either at the
beginning or at the end of the preceding phase (French, 1978; Jones and Popham,
1997). For instance, negative values of SWS and PSE for the FS phase of the 2000-
2001 fallow period and the SS phase of the 2000-2001 and 2001-2002 fallows
(Table 5.3) occurred when initial SWS was high and/or most of the sub-period
precipitation was concentrated at the beginning of the phase (Fig. 5.6). In contrast,
positive values of SWS and PSE occurred when the soil profile was dry early in the
sub-period and most of the rainfall was collected at the end, thus reducing soil water
evaporation (i.e. SS phase in the 1999-2000 fallow and FS phase in the 2001-2002
fallow) (Fig. 5.6). Only the HF phase presented positive SWS values in the three
experimental fallow seasons. The positive relationship between SWS and P for this
phase (SWS = 0.45 P + 26.82; R2 = 0.89) is explained by a dry profile at the
beginning and both a relatively high number of rainy days and a low evaporative
demand at the end (Table 5.2). This result is in good agreement with the positive
correlation between P and simulated SWS to a depth of 100 cm found by Austin et
al. (1998a) for the same fallow sub-period in the study area.
On the other hand, even though the FS phase in the 1999-2000 and 2001-2002
fallow periods was characterised by a comparable water storage at the beginning

Fallow water storage efficiency 109
Fig
ure
5.6.
(a)
Dai
ly p
reci
pita
tion
(co
lum
ns)
and
refe
renc
e ev
apot
rans
pira
tion
(E
T 0)
(con
tinu
ous
line
) du
ring
the
1999
-20
00, 2
000-
2001
and
200
1-20
02 f
allo
w p
erio
ds. (
b) T
ime
cour
se o
f w
ater
sto
red
in th
e so
il p
rofi
le (
0-70
cm
) (S
WS)
for
th
e sa
me
fallo
w p
erio
ds u
nder
con
vent
iona
l til
lage
(C
T),
red
uced
till
age
(RT
) an
d no
-till
age
(NT
) tr
eatm
ents
. T
and
t
indi
cate
pri
mar
y an
d se
cond
ary
tilla
ge d
ates
; ba
rs r
epre
sent
LSD
(P<
0.05
) fo
r co
mpa
riso
n am
ong
tilla
ge t
reat
men
ts,
whe
re s
igni
fica
nt d
iffe
renc
es w
ere
foun
d. S
WS
valu
es a
re c
ompu
ted
in r
efer
ence
to th
e st
art o
f ea
ch f
allo
w p
erio
d. H
F:
harv
est t
o la
te f
all;
FS: l
ate
fall
to la
te s
prin
g; S
S: la
te s
prin
g to
sow
ing.
19
99
2
000
200
0
20
01
20
01
2
002
Rainfall (mm) Soil water storage (mm)
ET (mm day) 0
-1
-500
50
100
1500
20
40
60
0246810
t
ba
J J
A S
O N
D
J F
M A
M
J J
A S
O N
D J
J A
S O
N D
J F
M A
M J
J
A S
O N
D J
J A
S O
N D
J F
M A
M
J J
A S
O N
D
tT
T
T
t
SSH
FFS
RT
CT
NT

110 Capítulo 5
and a similar rainfall at the end (102 mm and 103 mm in April-May, respectively),
SWS and PSE for this phase in the 2001-2002 fallow period were approximately
two times greater than in the 1999-2000 fallow (Table 5.3). This difference is due to
a greater effective precipitation ( ≥ 10 mm day-1) in April-May in the 2001-
2002period (67%) compared to the 1999-2000 period (32%) (Table 5.2).
With regard to the entire fallow period, the greatest SWS and PSE values were
observed in the 1999-2000 fallow season (Table 5.3) with the greatest effective
seasonal-fallow precipitation in the last two months of fallow (Table 5.2). This
result indicates that the rainfall received at the beginning and during mid-fallow has
no effect on soil water storage at sowing, in agreement with Austin et al (1998a),
who found that rainfall during the last months of the fallow is the principal
determinant of the amount of water stored in the profile in Central Aragon.
However, French (1978) found in semiarid south Australia, that fine-textured soils
stored much additional water when rain occurs at the beginning of a 8-10 months
fallow period. The SWS values were within the range measured by López et al.
(1996) and estimated by Austin et al (1998a) in the Ebro River valley. In summary,
the 16-18 month fallow period was characterised by an efficient early fallow phase
for soil water storage (31-310% of the total SWS) and a variable SWS in the
overwinter and late phases (Table 5.3). As observed in semiarid fallow regions of
Northern Great Plains (Farahani et al., 1998b) and Pacific Northwestern
(Schillinger, 2001) of the USA, soil water storage efficiency, computed in reference
to the start of fallow, decreased over the long fallow period (Fig. 5.7). At the end of
fallow (sowing time), average PSE values were small (11%) (Table 5.3) but similar
to those reported in previous studies conducted in semiarid fallow regions (French,
1978; López et al., 1996; Tanaka and Anderson, 1997; Pannkuk et al., 1997;
Lampurlanés et al., 2002; Latta and O’Leary, 2003). The amount of water stored in
the soil profile (0-70 cm) for the following crop averaged 181, 128 and 137 mm for
the 1999-2000, 2000-2001 and 2001-2002 fallow periods, respectively.

Fallow water storage efficiency 111
2000
2001
2002
Sto
rag
e e
ffici
en
cy (
%)
1999
0
10
20
30
40
50
60
O N D J F M A M J J A S O N D J F M A M J J A S O N D J F M A M J J A S O N D
CT
RT
NT
Figure 5.7. Soil water storage efficiency during the 1999-2000, 2000-2001 and 2001-2002 fallow periods under conventional tillage (CT), reduced tillage (RT) and no-tillage (NT) treatments. Bars represent LSD (P<0.05) for comparison among tillage treatments, where significant differences were found. (The efficiency values are computed in reference to the start of each fallow period).
Effects of fallow tillage management
The distribution of water stored in the soil profile during fallow varied with the
tillage treatments. Figure 5.4 shows that in general, water content in the plough
layer (0-40 cm depth) was greater under NT than under CT and RT. This fact may
be due to a higher soil water retention capacity measured at the topsoil under NT
(Moret and Arrúe, 2004; Capítulo 4). On average, while water stored under NT in
the 0-20, 20-40 and 40-70 cm soil layers represented the 29, 30 and 41%,
respectively, of total soil water storage, under CT and RT these percentages were
21, 30 and 49%. These results agree with those obtained by Nyborg and Malhi
(1989) in semiarid north-central Alberta and Chan and Heenan (1996) in Australia,
but differ from findings by Lampurlanés et al. (2002) in a semiarid area of Ebro
River valley. These authors found that the amount of water stored by a loamy soil in

112 Capítulo 5
the deeper soil layers was greater under NT than under subsoil tillage and minimum
tillage.
Despite this different soil water content distribution with depth between tilled
and untilled soils, in general, no significant differences in SWS (Fig 5.6) and PSE
(Fig 5.7) among tillage systems were observed for the entire fallow, in agreement
with findings by other researchers (Tanaka and Anderson, 1997; Schillinger, 2001;
Lampurlanés et al., 2002; Latta and O’Leary, 2003). O’Leary and Connor (1997)
indicated that a proper crop residue cover would favour soil water storage at the end
of fallow. In our study area, however, crop residue cover, which is very low even
under NT over the whole fallow period (López et al., 2003) would not be an
influential factor in water conservation.
The additional soil water at sowing with a long fallow (16-18 months) compared
with a short fallow (5-6 months) averaged for four years (1999-2002) and the three
tillage systems 22 mm (Table 5.4). This figure is within the range of values (11-33
mm) given Latta and O’Leary (2003) for a semiarid region of south-eastern
Australia and comparable to the 19 and 27 mm predicted by Austin et al. (1998a,
1998b) for different locations in the Ebro River valley and the 28 mm measured by
French (1978) in south Australia or the 12 mm given by López et al. (1996) in
Central Aragón. Accordingly, the average precipitation storage efficiency of long
fallow relative to short fallow (RPSE) was 5.2%, close to the mean value of
2.5%found by López et al. (1996) in Central Aragon and within the range of values
obtained by Latta and O’Leary (2003) in south-eastern Australia (1-26%) using a
comparable index of relative water storage efficiency. Although the influence of
tillage treatment on the additional water storage at the end of fallow is nor clear, RT
appears to be the most efficient system to increase the water storage (Table 5.4).

Fallow water storage efficiency 113
Table 5.4. Precipitation storage efficiency of long fallow relative to short fallow (RPSE) for the 1998-1999, 1999-2000, 2000-2001 and 2001-2002 long fallow seasons as affected by conventional tillage (CT), reduced tillage (RT) and no-tillage (NT).
Fallow season
Tillage treatment
Rainfall (mm) †
Additional water stored in CF (mm)‡
RPSE§
(%)
1998-1999 CT 351 22 6.2 RT 31 8.8 NT 7 2.0
1999-2000 CT 494 28 5.7 RT 29 5.9 NT 18 3.6
2000-2001 CT 301 6 2.0 RT 37 12.3 NT 25 8.3
2001-2002 CT 413 18 4.4 RT 23 5.6 NT 12 2.9 † Rainfall received during the long fallow period in the crop-fallow rotation (CF) from the
time of primary tillage in the continuous cropping (CC) system in late fall to sowing in both systems on the following year (PTS).
‡ Difference in soil water storage (0-70 cm) between the CF and the CC systems at sowing (∆SWS).
§ RPSE = (∆SWS / PTS) x 100
4. Conclusions
Results show that in semiarid Central Aragon the type of fallow management in
the cereal-fallow rotation may have a significant effect on the dynamics of soil
water content during the long (16-18 months) fallow period. Primary tillage
implemented under conventional tillage (CT) and reduced tillage (RT) in late winter
or early spring determines significant soil water losses from the plough layer
immediately after tillage compared with no-tillage (NT). However, secondary
tillage in the tilled treatments appears to have a positive effect on soil water
conservation during the last fallow phase. This shallower cultivation would break

114 Capítulo 5
the continuity of capillary channels from the subsoil to the soil surface thus
reducing soil water evaporation. Despite tillage operations imply in the short-time a
substantial and rapid water loss from the plough layers, total water lost measured
for the entire fallow period was similar for CR, RT and NT. This results indicates
that neither conventional tillage nor conservation tillage are able to improve soil
water conservation in the crop-fallow rotation.
The partitioning of long fallow into three periods has shown that the early phase,
from harvest of the preceding barley crop to late fall, is in general the most efficient
in terms of soil water storage (SWS), showing the lowest average daily evaporation
rate (0.65 mm day-1). The second period (late fall to early summer) and the third
period (late spring to sowing), have grater daily evaporation rates (0.93 and 1.09
mm day-1, respectively) and variable soil water storage as a function of the rainfall
regime in those periods. Precipitation storage efficiency (PSE) for each fallow
phase, and also for the entire fallow period, increases when most of seasonal
effective rainfalls ( ≥ 10 mm day-1) are received in the last two months of each
fallow period. Although a gain in water storage is achieved by fallowing, small PSE
values (11% on average) indicate that this traditional practice is not efficient
enough to substantially increase the amount of water available to the following
crop.
Overall, neither SWS nor PSE of long fallowing was significantly affected by the
tillage system. This would imply that conservation tillage systems could replace
conventional tillage for soil management during fallow without adverse effects on
soil water conservation. The average additional soil water at sowing after a long-
fallow (16-18 months) period compared with short-fallow (5-6 months) was 22 mm.
Correspondingly, the average precipitation storage efficiency of long fallow relative
to short fallow was only 5.2%. In conlusion, above results indicate that the benefits
of long fallowing in terms of soil water storage are quite small. To improve the
productivity and sustainability of dryland agrosystems in semiarid Aragon, further

Fallow water storage efficiency 115
research is required to evaluate alternative fallow management practices either to
improve fallow precipitation storage efficiency (i.e. delaying primary tillage till late
fallow) or to benefit from the water currently being lost during fallow by
evaporation through new crop rotations (i.e. use of a cover or pasture crop during
the overwinter fallow phase).
References
Aase, J.K., Siddoway, F.H., 1982. Evaporative flux from wheat and fallow in a semiarid
climate. Soil Sci. Soc. A. J. 46, 619-626.
Allen, R.G., Pereira, L.S., Raes, D., Smith, M., 1998. Crop evapotranspiration. Guidelines
for computing crop water requirements. FAO Irrigation And Drainage Paper 56,
Rome, 300 pp.
Austin, R.B., Playán, E., Gimeno, J., 1998a. Water storage in soils during the fallow:
prediction of the effects of rainfall pattern and soil conditions in the Ebro valley of
Spain. Agric Water Manag. 8, 239-248.
Austin, R.B., Cantero-Martínez, C., Arrúe, J.L., Playán, E., Cano-Marcellán, P., 1998b.
Yield-rainfall relationships in cereal cropping systems in the Ebro river valley of
Spain. Eur. J. Agron. 8, 239-248.
Bonfil, D.J., Mufradi, I., Klitman, S., Asido, S., 1999. Wheat grain yield and soil profile
water distribution in a no-till arid environment. Agron. J. 91, 368-373.
Chan, K.Y., Heenan, D.P., 1996. Effect of tillage and stubble management on soil water
storage, crop growth and yield in a wheat-lupin rotation in southern NSW. Aust. J.
Agric. Res. 47, 479-488.
Dalrymple, A.W., Miller, S.D., Fornstrom, K.J., 1993. Soil water conservation and winter
wheat yield in three fallow systems. J. Soil Water Cons. 48, 53-57.
Dalton, F.N., 1992. Development of time-domain reflectometry for measuring soil water
content and bulk soil electrical conductivity. In: Topp, G.C., Reynolds, W.D., Green,
R.E. (Eds.), Green advances in measurement of soil physical properties: bringing
theory into practice. Special Publication No. 30, SSSA, Madison, WI, pp. 143-167.
Dao, T.H., 1993. Tillage and winter wheat residue management effects on water infiltration
116 Capítulo 5
and storage. Soil Sci. Soc. A. J. 57, 1586-1595.
Farahani, H.J., Peterson, G.A., Westfall, D.G., 1998a. Dryland cropping intensification: a
fundamental solution to efficient use of precipitation. Adv. Agronomy 64, 197-223.
Farahani, H.J., Peterson, G.A., Westfall, D.G., Sherrod, L.A., Ahuja, L.R., 1998b. Soil water
storage in dryland cropping systems: The significance of cropping intensification. Soil
Sci. Soc. A. J. 62, 984-991.
Ferré, P.A., Topp, G.C., 2002. Time Domain Reflectometry. In: Dane, J.H., Topp, G.C.
(Eds). Methods of Soil Analysis. Part 4-Physical Methods, SSSA Book Series No. 5,
Madison, WI, USA, pp. 434-446.
French, R.J., 1978. The effect of fallowing on yield of wheat. I. The effect on soil water
storage and nitrate supply. Aust. J. Agric. Res. 29, 653-668.
Hatfield, J.L., Sauer, T.J., Prueger, J.H., 2001. Managing soils to achieve greater water use
efficiency: a review. Agron. J. 93, 271-280.
Incerti, M., Sale, P.W.G., O’Leary, G.J., 1993. Cropping practices in the Victorian Mallee.
2. Effect of long fallows on the water economy and the yield of wheat. Aust. J. Exp.
Agric. 33, 885-894.
Jalota, S.K., Prihar, S.S., 1998. Reducing soil water evaporation with tillage and straw
mulching. Iowa State University Press, Ames, Iowa, 142 pp.
Jones, O.R., Popham, T.W., 1997. Cropping and tillage systems for dryland grain
production in the southern high plains. Soil Sci. Soc. A. J. 89, 222-232.
Latta, J., O’Leary, G.J.. 2003. Long-term comparison of rotation and fallow tillage systems
of wheat in Australia. Field Crop Res. 83, 176-190.
Lampurlanés, J., Angás, P., Cantero-Martínez, C., 2002. Tillage effects on water storage
during fallow, and on barley root growth and yield in two contrasting soils of the semi-
arid Segarra region in Spain. Soil Tillage Res. 65, 207-220.
López, M.V., Arrúe, J.L., 1995. Efficiency of an incomplete block design based on
geostatistics for tillage experiments. Soil Sci. Soc. A. J. 59, 1104-1111.
López, M.V., Arrúe, J.L., Sánchez-Girón, V., 1996. A comparison between seasonal
changes in soil water storage and penetration resistance under conventional and
conservation tillage systems in Aragón. Soil Tillage Res. 37, 251-271.

Fallow water storage efficiency 117
López, M.V., Moret, D., Gracia, R. and Arrúe, J.L., 2003. Tillage effect on barley residue
cover during fallow in semiarid Aragón. Soil Till. Res. 72, 53-64.
Linden, D.R., 1982. Predicting tillage effects on evaporation from the soil. In: Unger, P.W:,
Van Doren, Jr.D.M. (Eds.), Predicting Tillage Effects on Soil Physical Properties an
Processes. ASA Special Publication, No. 44, Madison, WI, USA, pp. 117-132.
McAneney, K.J., Arrúe, J.L., 1993. A wheat-fallow rotation in northeastern Spain: water
balance-yield considerations. Agronomie 13, 481-490.
Miyamoto, T., Kobayashi, R., Annaka, T., Chikushi, J., 2001. Applicability of multiple
length TDR probes to measure water distribution in an Andisol under different tillage
systems in Japan. Soil Tillage Res. 60, 91-99.
Moret, D, Arrúe, J.L., 2004. Dynamics of soil hydrophysical properties during fallow as
affected by conventional and conservation tillage systems (Capítulo 4).
Nyborg, M., Malhi, S.S., 1989. Effect of zero and conventional tillage on barley yield and
nitrogen content, moisture and temperature of soil in North-Central Alberta. Soil
Tillage Res. 15, 1-9.
O’Leary, G.J., Connor, D.J., 1997. Stubble retention and tillage in a semi-arid
environment:1. Soil water accumulation during fallow. Field Crops Res. 52, 209-219.
Or, D., Fisher, B., Hubscher, R.A., Wraith, J., 1998. WinTDR 98 V.4.0 –Users Guide-.
Department of Plants, Soil & Biometeorology, Utah State University, Logan, UT.
Papendick, R.I., 1987. Tillage and water conservation: experience in the Pacific
Northwest. Soil Use Manag. 3, 69-74.
Pannkuk, C. D., Papendick, R. I., Saxton, K. E., 1997. Fallow management effects on soil
water storage and wheat yields in the Pacific northwest. Agron. J. 89, 386-391.
Reicosky, D.C., Reeves, D.W., Prior, S.A., Runion, G.B., Rogers, H.H., Raper, R.L., 1999.
Effects of residue management and controlled traffic on carbon dioxide and water loss.
Soil Tillage Res. 52, 153-165.
Schillinger, W.F., 2001. Minimum and delayed conservation tillage for wheat-fallow
farming. Soil Sci. Soc. A. J. 65, 1203-1209.
Schillinger, W.F., Bolton, F.E., 1993. Fallow water storage in tilled vs. untilled soils in the
Pacific northwest. J. Production Agriculture 6, 267-269.

118 Capítulo 5
Soil Survey Staff, 1975. Soil taxonomy: a basic system of soil classification for making and
interpreting soil surveys. USDA-SCS Agric. Handbook 436. US Gov. Print. Office,
Washington, D.C.
Tanaka, D.L., Anderson, R.L., 1997. Soil water storage and precipitation storage efficiency
of conservation tillage systems. J. Soil Water Cons. 52, 363-367.

Capítulo 6
Water Balance Simulation of a Dryland Soil during
Fallow under Conventional and Conservation Tillage
in Semiarid Aragón (NE Spain)
D. Moret, I. Braud and J.L Arrúe
To be submitted to: Soil and Tillage Research


121
Water Balance Simulation of a Dryland Soil during Fallow
under Conventional and Conservation Tillage in Semiarid
Aragón (NE Spain)
ABSTRACT
In Central Aragon, winter cereal is sown in the autumn (November-December),
commonly after a 16-18 month fallow period to conserve soil water. In order to predict
the effect of long fallowing under three tillage management systems (conventional
tillage, CT; reduced tillage, RT; and no-tillage NT) on available soil water at sowing,
the Simple-Soil-Plant-Atmosphere Transfer (SiSPAT) model was used. The model was
calibrated and satisfactorily validated using data from three long-fallow seasons over
the period 1999-2002 of a long-term tillage experiment. The capability of the model to
simulate the soil water balance and its components over long fallowing was
demonstrated. Both fallow rainfall pattern and tillage management system affected the
soil water budget and components estimated by the model. On the assumption that soil
properties measured under the three tillage treatments do not change over the whole
fallow period, the model estimated that about 80% of fallow seasonal precipitation is
lost by evaporation in long-fallow periods with both a dry autumn in the first year of
fallow and a rainfall above normal in spring. On the contrary, when the fallow season
is characterised by a wet autumn during the first year of fallow the model predicted a
decrease in soil water evaporation and an increase in water storage and deep drainage
components. In this case, the estimated water lost by evaporation was higher under NT
(70%) than under RT (48%) and CT (49%). The comparison between observed and
estimated soil water storage at the end of a wet-autumn fallow showed that fallow
water storage efficiency measured under CT and RT was about half of the efficiency
predicted by the model. Postponing mouldboard and chisel ploughing to the last phase
of the fallow period could substantially improve fallow water storage efficiency

122 Capítulo 6
1. Introduction
In rainfed arable land of Central Aragon (NE Spain), the most common
cropping system is the traditional cereal/fallow rotation (one crop in 2 yr), which
extends over about 430,000 ha, in areas with an average annual precipitation of
less than 400 mm, and involves a long-fallow period of about 16 to 18 months
(López et al., 2003). The traditional practice of long-fallowing is aimed, among
other issues, to increase total stored water at the time of sowing for efficient use by
the succeeding crop. However, the low rainfall regime, with a high between-year
variability, along with a high evaporative demand (Herrero and Snyder, 1997)
imposes significant constraints on agricultural production in Central Aragon
(McAneney and Arrúe, 1993). Though mouldboard ploughing, followed by
repeated shallow tillage operations, remains the commonest form of fallow
management to control weeds during the fallow period, this traditional tillage
practice is being slowly replaced by conservation tillage systems due to the lower
labour, fuel, and machinery costs of these systems. However, and regardless of
tillage practices, field measurements by López et al. (1996) and calculations by
Austin et al. (1998), suggest that benefits from water storage during fallow are
quite small.
Although the implementation of field experiments has been the traditional
approach in many semiarid rainfed farming regions to evaluate the influence of
fallowing practices on soil water storage during the fallow period, few of them have
long enough duration to take into account long-term effects of treatments that
change slowly with time. Field data, however, can be used in conjunction with
model simulation data to achieve a better understanding of the processes controlling
soil water balance and storage during fallow.
As reviewed by Conolly (1998), many simulation models have been used to
simulate the water balance in soil-crop systems, but few of them have been applied
to study specifically soil water changes during the fallow period. To this respect,

Water balance simulation 123
Fischer et al. (1990) used a simulation model to predict the effect of fallow and of
new tillage systems on total available soil water at sowing in New South Wales,
Australia. In Spain, Austin et al. (1998) developed a functional, physically based
simulation model to estimate water storage in the soil profile during fallow in
Central Aragon, similar to that proposed by López and Giráldez (1992) for the
climatic conditions of southern Spain. The mechanistic SiSPAT (Simple-Soil-Plant-
Atmosphere Transfer) model (Braud et al., 1995), which gives a physically based
representation of the processes involved in the soil-plant-atmosphere continuum,
has been successfully used to study the mechanisms of soil water evaporation on
fallow land in arid Niger (Braud et al., 1997) and semiarid Central Spain (Boulet et
al., 1997).
The objective of this study was to further evaluate the applicability of the
SiSPAT model to simulate the soil water balance during the long fallow phase of
the traditional cereal-fallow cropping system in Central Aragon and understand the
effects of different tillage management systems on fallow water storage efficiency.
The performance of the model was tested on the long-term basis using data sets
from three contrasting fallow seasons of a long-term tillage experiment in which
conventional tillage, with mouldboard ploughing as primary tillage, is compared
with alternative conservation tillage practices, namely, reduced tillage, with chisel
ploughing as main cultivation, and no-tillage.
2. Material and methods
2.1. Model description
This study was conducted using the original Simple-Soil-Plant-Atmosphere
Transfer (SiSPAT) model (Braud et al., 1995). A detailed description of the model
can be found in Braud (2000) and only a brief summary is presented here. SiSPAT
is a vertical 1D model of heat and water exchanges within the soil-plant-atmosphere
continuum, forced at a reference level with a series of measured climatic data. We
124 Capítulo 6
used here the bare soil version of the model. Coupled heat and water transfer
equations are solved in the soil for both the liquid and vapour phase (Milly, 1982).
The model deals with vertically heterogeneous soils. Initial and boundary
conditions must be provided for the soil temperature and matrix potential profiles.
We used gravitational mass flux and sinusoidal temperature for the bottom
boundary condition. The soil–atmosphere interface is modelled using an electrical
analogy and allows the derivation of the surface fluxes of heat and water using a
two equations system (surface energy balance and continuity of the mass flux at the
soil surface).
At the experimental site and regardless of the type of fallow management
system, soil cover by cereal crop residues was very low (< 30-40%) during the
specific fallow periods considered in the study (López et al., 2003). Consequently,
possible mulch effects on the water and energy budget of the field were not
considered in the experimental set up. On this assumption, the original version of
SiSPAT was used instead of the SiSPAT-mulch version (González-Sosa et al.,
1999), which takes explicitly into account heat and water transfers within a plant-
residue mulch layer.
2.2. Field data set
2.2.1. Experimental site and fallow management systems
The site is located at the dryland research farm of the Estación Experimental de
Aula Dei (CSIC) in the Zaragoza province (latitude 41º 44’N; longitude 0º 46’W;
altitude 270 m). The climate is semiarid with an annual precipitation of 390 mm and
an average annual air temperature of 14.5 ºC. Soil at the research site is a loam
(fine-loamy, mixed thermic Xerollic Calciorthid). A more detailed description of
soil and crop management is given by López et al. (1996). Field research was
carried out on two adjacent large blocks of ten plots, which were set up on a nearly
level area in 1991 (Field 1) and 1992 (Field 2) as part of a long-term conservation
Water balance simulation 125
tillage experiment initiated in 1989. Both fields have a loam texture in the top 70
cm of soil, with the exception of Field 2 where a textural heterogeneity is present
below 40 cm, with some plots showing a sandy loam texture in the 40-70 cm layer.
The study was conducted when the fields were in the fallow phase of a winter
barley (Hordeum vulgare L.)-fallow rotation, which extends from harvest (June-
July) to sowing (November-December) on the following year. Field measurements
were made during the three fallow seasons: 1999-2000 (26 June 1999-13 December
2000) and 2001-2002 (29 June 2001-19 November 2002) in Field 2, after 8 and 10
years of trial, and 2000-2001 (20 June 2000-23 November 2001) in Field 1, after 10
years of trial.
Three different fallow management treatments were compared: conventional
tillage (CT), reduced tillage (RT) and no tillage (NT). The CT treatment consisted
of mouldboard ploughing to a depth of 30-40 cm in late winter or early spring,
followed by secondary tillage with a sweep cultivator to a depth of 10-15 cm in
early summer. In the RT treatment, primary tillage was chisel ploughing to a depth
of 25-30 cm (non-inverting action), followed, as in CT, by a pass of sweep
cultivator in early summer. Primary tillage operations in CT and RT plots were
implemented on 25 April 2000, 10 April 2001 and 13 March 2002, and secondary
tillage on 26 May 2000, 5 June 2001 and 11 June 2002. No tillage operations were
used in the NT treatment, in which weeds were controlled with herbicides.
Tillage treatments were arranged in an incomplete block design, with three
replications for the RT and NT treatments and four for the CT treatment (López and
Arrúe, 1995). The size of the elemental plot was 33.5 m x 10 m, with a separation
of 1 m between plots.
2.2.2. Climatic variables
Hourly meteorological observations were made at the experimental site over the
entire experimental periods using an automatic weather station. Air temperature and

126 Capítulo 6
humidity measured at 1.8 m and wind speed at 2 m were used for the forcing of the
model. A tipping bucket rain gauge was used to measure rainfall. Incoming short-
wave solar radiation was measured using a pyranometer sensor at 2 m height.
During the third fallow period, net short-wave radiation (Rn) was recorded at 1 m
above the soil surface on a NT plot using a net radiometer. All sensors were
connected to a data-logger, which continuously recorded 60-min averages of data
acquired at intervals of 10s. The long-wave incoming radiation was calculated by
the expression proposed by Brutsaert (1975) (cited by Braud et al., 1995) for clear
sky conditions.
Overall, the 1999-2002 experimental period was drier than normal. Total
precipitation received during the first (1999-2000), second (2000-2001) and third
(2001-2002) long-fallow periods was 3, 13, and 10%, respectively, below the long-
term average. Rainfall patterns were contrasted among the three fallow periods,
with monthly totals irregularly distributed over each fallow period (Table 6.1). The
2000-2001 fallow was characterised by a high precipitation (62% above normal) in
the autumn (September-November) of the first year of fallow, which represented
almost half of the total fallow season precipitation, and a dry spring (30% below
normal) concentrating in the March-May period only 17% of fallow rainfall. In
contrast, the 1999-2000 and 2001-2002 fallows had a low precipitation (about 22%
below normal in both cases) in autumn (19% of total fallow precipitation) and a
precipitation 11 and 33% above normal, respectively, in spring (24 and 30% of total
fallow precipitation) (Table 6.1).
2.2.3. Soil parameters
For the initialisation and validation of the model, soil temperature (Tsoil) was
measured using thermistors horizontally inserted at 2, 6 and 10 cm depth on one per
tillage treatment during the three fallow periods. Soil temperature was additionally
measured at 20 cm during the 2000-2001 fallow period and at 20, 50 and 70 cm

Water balance simulation 127
Table 6.1. Monthly precipitation (mm) during the 1999-2000, 2000-2001 and 2001-2002 long-fallow seasons compared with long-term monthly totals (1954-2002 average) at Peñaflor experimental site.
Month 1999-2000 2000-2001 2001-2002 49-yr avg.
July 27 4 3 17 August 9 7 2 24 September 46 9 60 41 October 33 122 25 40 November 15 66 10 41 December 7 36 3 28 January 14 44 22 27 February 1 4 6 23 March 25 21 48 28 April 62 5 27 36 May 40 54 76 50 June 48 9 40 36 July 4 3 17 17 August 7 2 9 24 September 9 60 60 41 October 122 25 54 40 November 66 10 35 41
17-mo total 535 481 497 554
during the 2001-2002 fallow period. Soil thermistors were connected to a
datalogger and data signals acquired every 10 s and averaged over 60-min intervals.
Soil temperature measurements gathered during periods with slow changes in soil
water content were used to calculate the soil heat flux at the surface (G) for the
three fallow seasons and tillage systems by using the “zero flux method” or
calorimetric method (Sauer, 2002).
The volumetric water content of soil (θ) in the top 70 cm was monitored on a
daily basis or as a function of rainfall events over the three experimental fallow
periods using the Time Domain Reflectometry (TDR) technique. Probes of two
parallel stainless steel rods were vertically inserted into the soil to a depth of 10, 20,
40 and 70 cm, and connected to a TDR cable tester (model 1502C, Tektronix) to
calculate θ using the model proposed by Topp et al. (1980). Two measurements of θ

128 Capítulo 6
were made per experimental plot, which according to the incomplete block design
used gave a total of 18 measurements (6 per tillage treatment) on each fallow field
per sampling depth and observation date.
Fallow tillage management affected soil water dynamics during the three fallow
periods. Figure 6.1 provides an example of the variation of θ for the 0-10, 10-20,
20-40 and 40-70 cm layers measured by TDR in Field 2 under CT, RT and NT
treatments from 21 September 1999 to 25 April 2000 (first long-fallow period). As
compared to CT and RT, soil water stored under NT tends to be higher in the
surface horizons and lower in the deeper ones. This behaviour is more marked
during rainy periods, as it occurred at the beginning and the end of the period (Fig.
6.1) reflecting the rainfall events in September-November 1999 and March-April
2000, respectively (Table 6.1).
Soil dry bulk density (ρb), hydraulic conductivity (K), and water retention curve
were measured in situ on the 1-10 cm and 40-50 cm soil layers for the different
tillage systems. ρb was determined by the core method and K using a tension disc
infiltrometer (Perroux and White, 1988). Infiltration runs were made at four
pressure head (h) values (namely, -14, -4, -1, and 0 cm, applied in that order and at
the same place). K was calculated according to the multiple-head method (Ankeny
et al., 1991). The volumetric water content of soil beneath the infiltrometer disc was
determined just at the end of each infiltration measurement by TDR. For this
purpose, and prior to the infiltration measurements, a three-rod TDR probe was
installed horizontally into the soil at 3-4 cm depth. The drying water content-matric
potential relationship, θ(h), was determined during the 2001-2002 fallow period on
Field 2. For the 0 to –30 kPa range, simultaneous field measurements of θ, using
three-rod TDR probes, and h, using microtensiometers, were performed.
Additionally, soil water retention at – 100, -500 and –1500 kPa was measured in the
laboratory on 2 mm sieved soil samples using a pressure membrane extractor
Likewise, the hydraulic conductivity of the surface crust (Kc) (0-1 cm depth) was.

Water balance simulation 129
01/09/99 01/11/99 01/01/00 01/03/00 01/05/00 0.0
0.1
0.2
0.0
0.1
0.2
0.0
0.1
0.2
0.3
Vo
lum
etri
c so
il w
ater
co
nte
nt,
θθ (
m3 m
-3) 0.0
0.1
0.2
0.3
0.40-10 cm
40-70 cm
20-40 cm
10-20 cm
CT RT NT
Figure 6.1. Time course of the volumetric soil water content (θ ) in the the 0-10 cm, 10-20 cm, 20-40 cm and 40-70 cm layers measured in Field 2 under conventional tillage (CT), reduced tillage (RT) and no-tillage (NT) during the 1999-2000 fallow season from 21 September 1999 to 25 April 2000.

130 Capítulo 6
determined at saturation (h = 0 cm) according to Vandervaere et al. (1997). The
bulk density of the surface crust was measured by the clod method (Grossman and
Reinsch, 2002) using paraffin wax as coating agent. All the soil hydrophysical
property measurements were made between January and March, before the
implementation of primary tillage operations in the CT and RT treatments.
2.2.4. Field water balance
Assuming a negligible runoff from the nearly level experimental plots at both
Field 1 and Field 2, soil water budget for a given fallow period simplifies to:
SEP ∆=− (6.1)
where P (mm) is the rainfall recorded over the time period in question, E (mm) is
the sum of all water losses by evaporation from the soil surface and deep
percolation and ∆S is the change in soil water storage (0-70 cm depth) calculated
using the volumetric moisture content profiles.
2.2.5. Modelling strategy
Soil and climate measured parameters were directly introduced into the model.
For the soil horizons that were characterised in the field (0-1 cm; 1-10 cm; and 40-
50 cm), the total soil porosity, ξ, was calculated from the soil dry bulk density ρb
and soil particle density ρs (ρs = 2.65 g cm-1), through ( )sb ρρξ /1−= . The soil
water retention curve was obtained by fitting the measured (h, θ) values to the van
Genuchten (1980) model mn
grsat
r
hh
−
+=
−−
1θθ
θθ (6.2)
where n is the shape factor and m = 1-(2/n) (Braud, 2000). In this equation, θsat and
θr are the saturated and residual volumetric water contents, respectively, and hg is

Water balance simulation 131
the scale factor. In our case, θr was fixed as the water content measured in the field
on a very dry soil (van Genuchten, 1980) (Table 6.2).
The hydraulic conductivity curve K(θ ) was fitted using the Brooks and Corey
(1964) model:
( ) ( )βθθθ satsatKK /= (6.3)
where Ksat is the saturated hydraulic conductivity, b a shape factor deduced from the
field measured K(h) relationship, θ is the soil water content below the infiltrometer
disc at the end of each tension infiltration measurement, and θ sat is the water
content below the infiltrometer disc at the end of the infiltration measurements at
saturation.
The values for all above soil parameters are given in Table 6.2. Soil depth was
fixed at 0.7 m and, according to tillage management (e.g. ploughing depth) and soil
crusting characteristics, divided in five horizons (0-1 cm; 1-10 cm; 10-20 cm; 20-40
cm; and 40-70 cm). Values of soil parameters measured at the 1-10 and 40-50 cm
layers were extended to the 10-20 and 40-70 cm horizons, respectively.
Intermediate calibrated values were taken for the 20-40 cm horizon (data not
shown).
Since the SiSPAT model also requires the specification of the thermal
conductivity λ, this parameter was derived using the Van de Griend and O’Neil
model (Braud, 2000), as the most appropriate option to our experimental set up
where only soil texture is known and no soil thermal properties measurements are
available. Other non-measured surface parameters that must be prescribed are the
bare soil albedo, α, and the roughness length for the momentum, zom. The
relationship of Passerat de Silans (Braud, 2000), calibrated for a loam soil was used
to calculate α and zom was set to 0.004 m (M.V. López, personal communication).
November 2001 to 19 November 2002 during the 2001-2002 fallow period were
used to calibrate the model. Similarly, the measurements of θ, Tsoil and G from 21

132 Capítulo 6
T
able
6.2
. A
vera
ge v
alue
s of
soi
l pa
ram
eter
s† mea
sure
d in
the
sur
face
cru
st (
0-1
cm),
and
the
1-1
0 an
d 40
-50
cm s
oil
hori
zons
in F
ield
2 u
nder
con
vent
iona
l till
age
(CT
), r
educ
ed ti
llage
(R
T)
and
no ti
llage
(N
T)
trea
tmen
ts.
ρ b
ξ
θ s
at
θ r
h g
n
K
sat
β
Soi
l lay
er
Til
lage
tr
eatm
ent
(k
g m
-3)
(m
3 m
-3)
(m
3 m
-3)
(m
)
(m
s-1
)
Hor
izon
1 (
0-1
cm)
CT
/RT
/NT
1.28
0.52
-
-
-
-
1.0
x 1
0-5
-
C
T
1.
24
(1.2
9)‡
0.
53
(0.5
1)
0.
49
(0.4
9)
0.
04
-0
.08
2.
25
2
.8 x
10-5
(2
.4 x
10-5
)
13 (16)
Hor
izon
2 (
1-10
cm
)
RT
(1.1
5)
1.24
0.56
0.
53
0.
49
(0.4
9)
0.
04
-0
.10
2.
25
2.
8 x
10-5
(2
.2 x
10-5
)
13
(16)
N
T
1.
34
(1.3
7)
0.49
(0
.48)
0.42
(0
.42)
0.06
-0.2
7
2.22
1.1
x 10
-5
19
(19)
C
T
1.
38
(1.3
7)
0.
48
(0.4
8)
0.
40
(0.4
1)
0.
04
-0
.15
2.
26
1
.9 x
10-5
(1.7
x 1
0-5)
14
(1
4)
Hor
izon
3 (
40-5
0 cm
)
RT
1.36
(1
.37)
0.48
(0
.48)
0.40
(0
.42)
0.04
-0.1
3
2.28
1.8
x 1
0-5
(1.4
x 1
0-5)
14
(1
4)
N
T
1.
37
(1.3
7)
0.
48
(0.4
8)
0.
40
(0.3
9)
0.0
4
-0
.14
2.
28
2
.3 x
10-5
(1.6
x 1
0-5)
13
(1
6)
† ρ b
, soi
l dry
bul
k de
nsity
; ξ, t
otal
soi
l por
osity
; θsa
t, sa
tura
ted
soil
volu
met
ric
wat
er c
onte
nt; θ
r, re
sidu
al w
ater
con
tent
; hg
and
n ar
e th
e sc
ale
and
shap
e fa
ctor
s in
the
van
Gen
ucht
en (
1980
) m
odel
for
the
wat
er r
eten
tion
curv
e; K
sat,
satu
rate
d hy
drau
lic c
ondu
ctiv
ity; β
; sha
pe f
acto
r in
the
Bro
oks
and
Cor
ey (
1964
) m
odel
for
the
hydr
aulic
con
duct
ivity
cur
ve.
‡ Fi
gure
s in
par
enth
esis
are
val
ues
for
Fiel
d 1

Water balance simulation 133
September 1999 to 13 December 2000 (1999-2000 fallow season) and from 7
October 2000 to 23 November 2001 (2000-2001 fallow season) were used to
validate the model. Whereas the complete data sets were used for calibration and
validation of SiSPAT under NT conditions, only data subsets until the primary
tillage dates (e.g. 25 April 2000, 10 April 2001 and 13 March 2002) were
considered for CT and RT treatments. Finally, modelling of soil water balance
under the three fallow management systems was made for the measurement periods
with available soil and climate and data sets on the assumption that soil parameters
measured under CT and RT before primary tillage remained unchanged until the
end of the fallow season.
For the comparison between observed, Var(obs), and model calculated variables,
Var(mod), regressions of the form Var(mod) = Slope x Var(obs) + Intercept were
performed. The root mean square error (RMSE) was also calculated by
( ) ( )( )2/1
1
2mod1
−= ∑
=
N
iii obsVarVar
NRMSE (6.4)
where N is the number of pairs available.
3. Results and discussion
3.1. Model performance
The results gathered during the calibration phase are summarised in Table 6.3.
Overall, there is a satisfactory agreement between measured and modelled soil and
surface fluxes variables. The statistics (R2, slope, intercept and root mean square
error) for the regressions between observed and modelled values of soil temperature
(Tsoil), volumetric soil water content (θ), net radiation (Rn) and soil heat flux (G) are
within the order of magnitude found for these variables in previous SiSPAT
assessment studies (Braud et al., 1997; Boulet et al., 1997; Gonzalez-Sosa et al.,
1999; Gonzalez-Sosa et al., 2001). As a whole, the determination coefficient (R2)
and slope of the regressions for the different fallow tillage management systems are

134 Capítulo 6
Tab
le 6
.3. C
oeff
icie
nt o
f de
term
inat
ion
R2 , s
lope
and
int
erce
pt o
f th
e re
gres
sion
s V
ar(m
od)
= S
lope
x V
ar(o
bs)
+ I
nter
cept
and
R
MSE
obt
aine
d du
ring
mod
el c
alib
ratio
n un
der
conv
entio
nal
tilla
ge (
CT
), r
educ
ed t
illag
e (R
T)
and
no t
illag
e (N
T)
trea
tmen
ts
duri
ng th
e 20
01-2
002
fall
ow p
erio
d.
C
T
RT
NT
Mod
el
vari
able
N†
R2
Slo
pe
Inte
rcep
t ‡
RM
SE ‡
N
R
2
Slo
pe
Inte
rcep
t R
MS
E
N
R
2
Slo
pe
Inte
rcep
t R
MS
E
T soi
l 2 c
m
14
80 0
.94
1.17
-4.
6
3.9
1480
0.
97
1.09
-2.
8
4.
2
7514
0.
97
1.11
-3.
7
2.
5
T soi
l 6 c
m
14
80 0
.96
1.09
-3.
0
3.8
1480
0.
95
0.98
-0.
6
3.
3
7514
0.
96
1.01
-1.
6
1.
9
T soi
l 10
cm
14
80 0
.96
1.15
-3.
8
3.3
1480
0.
96
1.13
-3.
7
2.
7
7514
0.
97
1.07
-2.
8
2.
0
T soi
l 20
cm
14
80 0
.97
1.18
-4.
4
3.7
1480
0.
97
1.07
-2.
4
2.
2
7514
0.
97
1.06
-2.
1
1.
7
T soi
l 50
cm
14
80 0
.94
0.89
1.9
5.1
1480
0.
98
0.98
-0.
2
1.
0
7514
0.
94
0.83
3.3
1.1
T s
oil 7
0 cm
1480
0.9
7 0.
92
1
.2
4.
7
14
80
0.97
0.
83
3.2
1.1
75
14
0.93
0.
88
2
.5
1.
4
θ 0-1
0 cm
22 0
.89
0.71
0.
057
0.03
2
22
0.86
0.
62
0.0
54
0.03
9
85
0.75
0.
66
0.08
4
0.02
7 θ 0
-20
cm
22
0.8
5 0.
72
0.06
1 0.
034
22
0.
88
0.65
0
.068
0.
033
85
0.
77
0.72
0.
064
0.
018
θ 0-4
0 cm
22 0
.86
0.97
0.
006
0.03
4
22
0.93
1.
01
0.0
02
0.03
6
85
0.79
0.
83
0.03
7
0.01
2 θ 0
-70
cm
22
0.7
6 1.
00
0.00
7 0.
034
22
0.
68
0.90
0
.014
0.
036
85
0.
85
0.80
0.
032
0.
013
Rn
7514
0.
96
1.00
-3
7.2
5
2.2
G
430
0.78
0.
93
-2.
0
36.
7
43
0 0.
80
1.00
-
3.6
5
5.1
21
50
0.90
0.
88
14.
1 4
1.8
† N
umbe
r of
pai
rs a
vaila
ble.
‡
Int
erce
pt a
nd R
MSE
are
giv
en i
n ºC
for
soi
l te
mpe
ratu
re (
T soi
l), i
n m
3 m-3
for
vol
umet
ric
soil
wat
er c
onte
nt (
θ) a
nd i
n W
m-2
for
soi
l he
at f
lux
(G)
and
net r
adia
tion
(Rn)
.

Water balance simulation 135
in most cases close to one with intercept values relatively small. Soil temperature at
different depths is well predicted by the model, with an average RMSE value of 2.7
ºC. This relatively high value could be due to an overestimation of the thermal
amplitude by the model. The small RMSE found for θ at all soil depths indicates
that the model predicts reasonably well the soil water dynamics. For the soil heat
flux G, the deviation between observed and predicted values can be related in this
case to an overestimation of observed values of G during night-time. However,
given the limitations and uncertainties associated to the calorimetric method used to
calculate G (Sauer, 2002), the RMSE values obtained for this variable (average of
44.5 W m-2) could be considered as acceptable.
Table 6.4 summarises, for the different tillage systems, the comparison between
predicted and measured values of Tsoil, θ and G used to validate the model during
the 1999-2000 and 2000-2001 fallow periods. Globally, the model tends to
underestimate the soil temperature as shown by the negative values of the
regression intercept. However, the difference of about 1 ºC observed can be
considered as very small. As an example, Fig. 6.2 shows the time course of soil
temperature at 6 cm depth measured in CT, RT and NT plots on Field 2 on the 7-9
November 1999 and that calculated by SiSPAT. For the soil moisture, and except
for θ 0-70 cm under CT and RT in the 1999-2000 fallow period, the model was able to
simulate satisfactorily the dynamics of the soil water content in the soil profile (0-
70 cm depth). As an example of the agreement between model and observation, Fig.
6.3 compares the time evolution of measured and modelled θ for the plough layer
(0-40 cm depth) under the CT, RT and NT treatments from 21 September 1999 to
23 November 2000, during the first fallow season. As it can be observed, the
excellent agreement between measured and simulated θ under NT for the entire
period worsens under the CT and RT treatments, particularly under CT, from the
date of primary tillage implementation (shaded area). G values predicted by the
model agree fairly well with observed values, as high determination coefficients,

136 Capítulo 6
Tab
le 6
.4. C
oeff
icie
nt o
f de
term
inat
ion
R2 , s
lope
and
inte
rcep
t of
the
regr
essi
ons
Var
(mod
) =
Slo
pe x
Var
(obs
) +
Int
erce
pt a
nd
RM
SE o
btai
ned
duri
ng m
odel
val
idat
ion
unde
r co
nven
tiona
l til
lage
(C
T),
red
uced
till
age
(RT
) an
d no
till
age
(NT
) tr
eatm
ents
du
ring
the
1999
-200
0 an
d 20
00-2
001
fall
ow p
erio
ds
C
T
R
T
NT
Mo
del
vari
able
N†
R2
Slo
pe
Inte
rcep
t ‡
RM
SE ‡
N
R2
S
lope
In
terc
ept
RM
SE
N
R2
Slo
pe
Inte
rcep
t R
MS
E
1999
-200
0 fa
llow
T so
il 2
cm
52
00 0
.92
0.97
-0.6
4
.0
52
00
0.92
1
.00
-1
.9
2.
9
1013
0 0.
98
1.0
1 -
1.2
1.9
T s
oil
6 cm
5200
0.7
8 0.
91
-0
.6
4
.5
52
00
0.81
0
.98
-1
.5
3.
3
1013
0 0.
89
0.8
8
1.1
2.5
T s
oil
10 c
m
11
00 0
.67
0.94
-0.5
4.3
1100
0.
66
0.8
6
-0.6
2.6
60
05
0.86
0
.96
0
.1
2.3
θ 0
-10
cm
51
0.8
5 0.
68
0.05
1 0
.025
51
0.84
0
.74
0.05
4
0.03
0
106
0.89
0
.75
0.05
6 0
.016
θ 0-2
0 cm
51 0
.87
0.73
0.
045
0.0
22
51
0.
84
0.7
8 0.
047
0.
026
10
6 0.
85
0.7
3 0.
060
0.0
15
θ 0-4
0 cm
51 0
.76
0.74
0.
040
0.0
23
51
0.
66
0.6
3 0.
065
0.
026
10
6 0.
87
0.7
1 0.
054
0.0
13
θ 0-7
0 cm
51 0
.60
0.53
0.
074
0.0
23
51
0.
65
0.4
8 0.
081
0.
026
10
6 0.
88
0.7
6 0.
045
0.0
10
G
15
0 0
.96
0.89
-
4.6
2
3.5
150
0.85
0
.96
5
.7
40.
2
2260
0.
94
0.7
7 1
1.7
48
.2
2000
-200
1 fa
llow
T so
il 2
cm
43
50 0
.88
1.21
-2.9
2.6
4350
0.
92
1.1
3
-3.6
2.9
81
57
0.98
1
.05
-
2.2
2
.0
T so
il 6
cm
43
50 0
.68
0.90
-0.6
2.9
4350
0.
70
0.8
6
-0.5
3.3
81
57
0.89
0
.91
0.2
3.0
T s
oil
10 c
m
43
50 0
.86
1.17
-2.1
2.1
4350
0.
80
1.0
5
-2.2
2.9
81
57
0.94
1
.03
-
1.8
2.6
T s
oil
20 c
m
43
50 0
.79
1.00
0.3
1.9
4350
0.
86
1.0
5
-1.8
2.4
81
57
0.97
0
.97
-
0.7
1.9
θ 0
-10
cm
42
0.9
0 0.
90
0.0
19
0.0
35
42
0.
90
0.9
2 0.
026
0.
048
86
0.
95
0.8
1 0
.041
0
.018
θ 0
-20
cm
42
0.8
8 0.
83
0.0
35
0.0
37
42
0.
88
0.8
4 0.
042
0.
040
86
0.
96
0.8
6 0
.031
0
.013
θ 0
-40
cm
42
0.8
9 0.
84
0.0
33
0.0
38
42
0.
92
0.9
1 0.
026
0.
038
86
0.
94
0.8
8 0
.016
0
.017
θ 0
-70
cm
42
0.9
5 1.
00
0.0
24
0.0
33
42
0.
94
0.9
7 0.
008
0.
036
86
0.
90
0.9
4 0
.012
0
.011
G
900
0.8
3 1.
03
6.
96
44
.6
80
0 0.
88
0.8
6
4.2
4
8.5
43
50
0.86
0
.75
7
.5
55
.5
† Num
ber
of p
airs
ava
ilabl
e.
‡ Int
erce
pt a
nd R
MSE
are
giv
en in
ºC
for
soi
l tem
pera
ture
(T s
oil),
in m
3 m-3
for
vol
umet
ric
soil
wat
er c
onte
nt (
θ) a
nd in
Wm
-2 f
or s
oil h
eat f
lux
(G).

Water balance simulation 137
Time (hours)
0 12 24 36 480
5
10
15
20
0
5
10
15
20
0
5
10
15
20
25
RT
NT
So
il te
mp
era
ture
at 6
cm
de
pth
(ºC
)
CTObserved
Simulated
Observed
Simulated
Observed
Simulated
Figure 6.2. Simulated (continuous line) and measured (symbols) soil temperature at 6 cm depth in Field 2 under conventional tillage (CT), reduced tillage (RT) and no-tillage (NT) for 7-9 November 1999.

138 Capítulo 6
Figure 6.3. Comparison of simulated (continuous line) soil volumetric water content (θ) for the 0-40 cm horizon with observations (symbols) from TDR measurements in Field 2 under conventional tillage (CT), reduced tillage (RT) and no-tillage (NT) during the 1999-2000 fallow season from 21 September 1999 to 13 December 2000 (T, primary tillage; t, secondary tillage).
01/09/99 01/01/00 01/05/00 01/09/00 01/01/01
0.0
0.1
0.2
0.3
NT
Vo
lum
etr
ic s
oil
wa
ter
con
ten
t, θ
(m3 m
-3)
0.0
0.1
0.2
0.3
RT0.0
0.1
0.2
0.3
0.4CT
T t
tT
ObservedSimulated
Observed
Simulated
Observed
Simulated

Water balance simulation 139
slopes close to one and small intercepts indicate (Table 6.4). An example of this
satisfactory agreement for G is given in Fig.6.4.
3.2. Simulation of soil water balance and components during fallow
Figure 6.5 presents in a summarised way the water balance predicted by SiSPAT
for the three experimental fallow periods and distinct tillage management systems
on the assumption that the soil parameters used to run the model for the CT and RT
treatments remain constant along the whole fallow period. The results show that the
soil water budget components for each fallow season were influenced by the fallow
rainfall pattern. On average, soil water evaporation and deep drainage estimated by
the model for the 1999-2000, 2000-2001 and 2001-2002 fallow periods represented
70, 56 and 91% of the total precipitation, respectively, in the first case and 18, 35
Time (hours)
0 12 24 36 48
Soi
l hea
t flu
x, G
(W
m-2
)
-400
-200
0
200
400
ObservedSimulated
Figure 6.4. Comparison of simulated (continuous line) and observed (dotted line) soil heat
flux under no-tillage (NT) in Field 2 on 25-27 June 1999.

140 Capítulo 6
1/9/01 1/12/01 1/3/02 1/6/02 1/9/02 1/12/02
1/9/99 1/12/99 1/3/00 1/6/00 1/9/00 1/12/00
0
100
200
300
400
500
1/9/99 1/12/99 1/3/00 1/6/00 1/9/00 1/12/00
1999-2000
1/9/99 1/12/99 1/3/00 1/6/00 1/9/00 1/12/00
1/9/01 1/12/01 1/3/02 1/6/02 1/9/02 1/12/02
0
100
200
300
400
500
1/9/01 1/12/01 1/3/02 1/6/02 1/9/02 1/12/02
2001-2002
1/9/00 1/12/00 1/3/01 1/6/01 1/9/01 1/12/01
Cum
ula
tive r
ain
fall,
eva
pora
tion a
nd d
eep d
rain
age (
mm
)
0
100
200
300
400
500
1/9/00 1/12/00 1/3/01 1/6/01 1/9/01 1/12/01
2000-2001
1/9/00 1/12/00 1/3/01 1/6/01 1/9/01 1/12/01
CT RT NT
Rainfall Deep drainage Evaporation + deep drainageEvaporation
Figure 6.5. Cumulative precipitation received during the 1999-2000, 2000-2001 and 2001-2002 long-fallow periods and corresponding cumulative water losses from the soil profile (0-70 cm depth) by evaporation and deep drainage predicted by SiSPAT under conventional tillage (CT), reduced tillage (RT) and no-tillage (NT).

Water balance simulation 141
and 5%, respectively, in the second case. These results, along with the time course
of the cumulative precipitation (Fig. 6.5), indicate that rains received during the
autumn-winter period of the first year of fallow play a crucial role to offset soil
water losses due to evaporation. If most of the fallow season precipitation is
received during that fallow phase, when the evaporative demand is low, water
storage in the soil profile is possible even below its maximum useful depth (70 cm
in our case). As a result, water stored deep in the soil is kept protected against
evaporation during late spring and summer when the atmospheric evaporative
demand is higher. From the agronomic point of view, these differences in fallow
soil water balance could partially explain the crop response during the growing
season that follows the fallow period. Thus, whereas the amount of water lost by
evaporation is no longer available for the subsequent winter cereal crop, soil water
accumulated in deep layers might be still partially used by the crop. As shown by
Lampurlanés et et al. (2002), in a study conducted in a semiarid area of the Ebro
River valley, in northeastern Spain, the root system of winter cereal crops can
extract water up to 1 m depth.
On the other hand, the model simulation also showed that long-fallow periods
characterised by a dry winter and a wet spring have no significant effects on soil
water storage and percolation. Thus, the large precipitation events registered in the
spring of the 1999-2000 and 2001-2002 fallow periods was mostly lost by
evaporation from the soil surface, probably due to a concurrent high evaporative
demand that prevented water to flow to deep soil layers.
The soil water balance components estimated by SiSPAT varied also with the
fallow tillage treatment. This effect was more evident in the 2000-2001 fallow
period, with a rainfall above normal in the autumn of the first year of fallow. For
this period, the estimated soil water losses by evaporation under NT (70%) were
higher than those estimated under CT and RT (49 and 48%, respectively). On the
contrary, model estimates of the drainage component showed that 25, 40 and 41%
142 Capítulo 6
of the total precipitation received during the 2000-2001 fallow period drained below
70 cm depth under NT, CT and RT, respectively. These differences in water
balance components among tillage systems could be related to both differences in
soil hydrophysical properties and a low atmospheric evaporative demand during the
fall-winter phase of the first year of fallow, which, as mentioned before, favours
water flow to deep soil layers in the CT and RT plots. Thus, a high topsoil water
content under NT (Fig. 6.1), could have enhanced soil water evaporation during the
following spring and summer fallow periods in that treatment. In contrast, a lower
water content under CT and RT at the surface horizons just after a rainfall event
(Fig. 6.1) would be indicative of a higher amount of water flowing to deeper soil
layers, thus promoting drainage and reducing soil water evaporation.
In fallow seasons with a dry autumns in the first year of fallow and a wet springs
(e.g. the 1999-2000 and 2001-2002 fallows), no significant differences in the soil
water balance components were observed among tillage systems. In those fallow
seasons, the evaporative demand during a rainy spring period appears to be the
main factor regulating the soil water fluxes. On the other hand, the slightly higher
drainage under NT compared to CT and RT predicted by the model for the 1999-
2000 and 2001-2002 fallows (Fig. 6.5) could be related to the coarser texture
observed on the NT plots in Field 2, and, correspondingly, to the higher hydraulic
conductivity measured in the 40-50 cm layer under NT (Table 6.2).
The comparison between measured and simulated soil water storage at the time
of sowing allowed us to quantify the influence of tillage on fallow precipitation
storage efficiency (WSE). This index is here defined as the percentage of the fallow
season precipitation stored in the soil profile (0-70 cm depth) at the end of fallow.
Table 6.5 shows the efficiencies measured (WSEM) and estimated by SiSPAT
(WSES) for the three experimental fallow seasons. The absence of significant
differences between both efficiencies (WSES / WSEM ≈ 1) under NT, without any
soil disturbance due to tillage, demonstrates the robustness and suitability of the

Water balance simulation 143
Table 6.5. Fallow precipitation storage efficiency† measured (WSEM) and simulated by SiPSAT (WSES) under conventional tillage (CT), reduced tillage (RT) and no tillage (NT) treatments during the 1999-2000, 2000-2001 and 2001-2002 fallow periods.
Fallow period
Tillage treatment
Rainfall (mm)
WSES WSEM WSES / WSEM
%
1999-2000 CT 545 16.2 17.2 0.94 RT 16.3 19.4 0.84 NT 17.3 18.0 0.96
2000-2001 CT 486 12.1 6.3 1.91 RT 8.6 4.9 1.77
NT 4.5 4.2 1.07
2001-2002 CT 463 10.0 10.6 0.94 RT 7.1 9.2 0.77 NT 8.9 8.3 1.07
† Precipitation storage efficiency = (SWS / P) x 100, where SWS is the soil water storage defined as the profile soil water measured or simulated at the end of fallow minus the profile soil water measured at the beginning of fallow, and P is the total fallow seasonal precipitation.
SiSPAT model to simulate soil water balance during fallow in our semiarid rainfed
farming conditions. In tilled treatments, however, some differences between WSEM
and WSES were observed among fallow periods. While for the 1999-2000 and 2001-
2002 fallows both efficiencies were very similar, WSES under both CT and RT for
the 2000-2001 fallow period was almost twice as big as WSEM (Table 6.5). This fact
would indicate a negative influence of both mouldboard and chisel ploughing on
soil water conservation in fallow periods with a very wet autumn during the first
year of fallow. Thus, during the 2000-2001 fallow season, a substantial portion of
the water stored in October-November 2000 in deep soil layers due to the abundant
and effective precipitation registered in that period (approximately 68% of total
precipitation was received in rainfall events > 10 mm) could have been evaporated

144 Capítulo 6
as a consequence of an increase in soil hydraulic conductivity after primary tillage
operations (Chapter 4) as observed by Sillon et al. (2003) in a similar experiment.
However, this would not have occurred in the absence of tillage operations as
predicted by SiSPAT for the CT and RT treatments. From these considerations it
can be concluded that eliminating or postponing primary tillage operations towards
the end of the fallow period, when the evaporative demand is low, could be
beneficial for soil water conservation, particularly in long-fallows characterised by
a high soil water recharge during the autumn of the first year of fallow. On the
contrary, in long-fallow periods with a low soil water recharge in autumn (e.g.
1999-2000 and 2001-2002 experimental fallows), soil water is basically stored in
the surface horizons from which is more easily and continuously evaporated
throughout the second year of fallow whether the soil is tilled or not. This would
explain the similarity between WSEM and WSES found for these fallow seasons
(Table 6.5).
In order to investigate the short-term effects of tillage on soil water evaporation,
the SiSPAT model was applied to simulate the evaporation losses following
primary and secondary tillage implemented during the three experimental fallow
seasons. The evaporation losses calculated by the model for specific post-tillage
time periods assuming constant soil water transfer properties over the entire
simulation period, were compared with experimental values obtained from the soil
water balance. This comparison is better illustrated by the results of the 2000-2001
fallow season since a relatively long dry period followed both primary tillage on
DAY 100 (Fig. 6.6a) and secondary tillage on DAY 157 (Fig. 6.6b). As it can be
seen, SiSPAT correctly simulated the cumulative evaporation losses under NT for
both post-tillage periods. On the contrary, there were clear differences in the tilled
treatments between observed and calculated evaporation losses just immediately
after tillage, especially after primary tillage under CT (Fig. 6.6a). This discrepancy
is due to the fact that the model does not take into account the soil loosening caused

Water balance simulation 145
by tillage and its effects on the water transmission properties at the soil surface.
This modification determines the time course of evaporation from tilled soil differs
from that of untilled soil (Jalota and Prihar, 1990). As reviewed by these authors,
soil loosening increases surface roughness, which increases potential evaporation
by concentrating heat in the surface layers. Similarly, roughness increases the
surface area of soil exposed to the atmosphere and allows greater wind penetration.
In our experimental conditions, soil loosening up to 40 and 30 cm by mouldboard
and chisel ploughing, respectively, with soil inversion in the first case, and,
concurrently, strong WNW cierzo wind at the time of tillage (average daily wind
speed values of 5.3 and 7.8 m s-1 were recorded on DOY 100 and DOY 101,
respectively) could have been major responsible factors for the high evaporation
rates measured just one day after primary tillage (12.7 and 8.3 mm day-1 under CT
and RT, respectively) (Fig. 6.6a).
The time course of cumulative evaporation from the top 10 cm of soil following
secondary tillage in the 2000-2001 fallow season (Fig. 6.6b) shows how for a short
time after tillage water is rapidly lost in the CT and RT plots (DOY 157-165). This
fact, which is due to soil loosening and surface crust breaking by tillage, makes on a
short-term the evaporation rate in the tilled plots to exceed that from untilled plots.
However, as soon as a dry layer is formed by the accelerating drying of the tilled
surface (e.g. 15 days after tillage in our case), evaporation from tilled soil decreases,
thus the differences between cumulative evaporation measured and simulated by
SiSPAT. This reduction in the rate of evaporation loss in tilled plots is due not only
to a depletion of water in the surface tilled layer but also to the breaking of
capillaries by tillage at the interface of tilled and untilled layers, which decreases
the hydraulic conductivity of the loosened layer and, consequently, retards upward
water flow from untilled layers (Jalota and Prihar, 1990). Regardless of tillage
treatment, the model is also able to simulate the evaporation increase observed
shortly after either a single rainfall, for instance the 9 mm rain received on DOY

146 Capítulo 6
(b)
(a)
150 160 170 180 190
0
5
10
15
20
Day of year 2001
150 160 170 180 190
90 100 110 120 130 140
Cum
ulat
ive
evap
orat
ion
(mm
)
0
20
40
60
80
90 100 110 120 130 140
150 160 170 180 190 200
Rai
nfal
l (m
m)
0
5
10
15
20
90 100 110 120 130 140 150
Rai
nfal
l (m
m)
0
20
40
60
80
NTRTCT
CT RT NT
T T
tt
Figure 6.6. Cumulative evaporation measured (symbols) and predicted by SiSPAT (continuous line) under conventional tillage (CT), reduced tillage (RT) and no-tillage (NT) during the 2000-2001 fallow period: (a) from the upper 40 cm of soil following primary tillage (T) and (b) from the upper 10 cm of soil following secondary tillage (t). Bars indicate rainfall events.
161, five days after secondary tillage (Fig. 6.6b), or a rainy period as that occurred
between DOY 120 and DOY 123 following a 20-day drying period after primary
tillage (Fig. 6.6a).
4. Conclusions
The SiSPAT (Simple-Soil-Plant-Atmosphere Transfer) model was satisfactorily
applied to simulate on a long-term basis the water budget of a loamy dryland soil
during the fallow period of a semiarid rainfed winter barley-fallow rotation
managed with three different tillage systems (conventional tillage, CT; reduced

Water balance simulation 147
tillage, RT; and no-tillage, NT). Model performance was evaluated by comparing
numerical results and field data covering specific sub-periods of three 17-18 month
fallow seasons. Most of the soil hydrodynamic and thermal parameters were
measured in situ and directly introduced into the model without the need of any
adjustment or calibration. The model calibration was performed on a 356-day
period within the 2002-2002 fallow season and the validation on two periods of 450
and 413 days within the 1999-2000 and 2000-2001 fallow seasons, respectively. For
the different fallow management practices, the model has shown a good agreement
between measured and predicted soil parameters (soil temperature and volumetric
water content at different depths) and surface fluxes (soil heat flux and net
radiation). Both fallow rainfall pattern and tillage management system affect the
soil water budget and components estimated by the model. On the assumption that
measured soil hydraulic properties affecting the soil water balance do not change
over the whole fallow period under the three tillage systems, the model estimated
that about 80% of fallow seasonal precipitation is lost by evaporation from the soil
surface in fallow periods having both a dry autumn in the first year of fallow and a
wet spring. In contrast, if the long-fallow period is characterised by a wet autumn
during the first year of fallow the model predicted an increase in the water storage
and deep drainage components and a decrease in soil water evaporation. In this
case, soil water evaporation under NT was about 20% higher than that estimated
under CT and RT. The comparison between measured and estimated soil water
storage at the end of fallow allowed to evaluate the potential total soil water losses
due to tillage practices in dryland semiarid zones of Central Aragon (NE Spain).
Our results show that mouldboard and chisel ploughing may have a negative effect
on soil water conservation in long-fallow seasons with a wet autumn during the first
year of fallow. In this case, the simulation appears to indicate that postponing
primary tillage operations to the last phase of the fallow period, when the
evaporative demand is low, could double the fallow water storage efficiency by

148 Capítulo 6
eliminating evaporation losses after primary tillage normally implemented in late
winter or early spring.
References
Ankeny, M.D., Ahmed, M., Kaspar, T.C., Horton, R., 1991. Simple field method for
determining unsaturated hydraulic conductivity. Soil Sci. Soc. A . J. 55, 467-470.
Austin, R.B., Playán, E., Gimeno, J., 1998. Water storage in soils during the fallow:
prediction of the effects of rainfall pattern and soil conditions in the Ebro valley of
Spain. Agric Water Manag. 8, 239-248.
Braud, I., 2000. SiSPAT user’s manual. Version 3.0. Laboratorie d’estude des transferts en
hydrologie et environnment, Grenoble, France
Braud, I., Dantas-Antonino, A.C., Vaculin, M., Thony, J.L., Rulle, P., 1995. A Simple soil-
plant-atmosphere transfer model (SiSPAT) development and field verification. J.
Hydrol.166, 213-250.
Braud, I., Bessemoulin, P., Monteny, B., Sicot, M., Vandervaere, J.P., Vauclin, M., 1997.
Unidimensional modelling of a fallow savannah during the HAPEX-Sahel experiment
using the SiSPAT model. J. Hydrol. 188-189, 912-945.
Boulet, G., Braud, I., Vauclin, M., 1997. Study of the mechanisms of evaporation under
semiarid conditions using a detailed model of soil-atmosphere continuum. Application
to EFEDA I experiment. J. Hydrol. 193, 114-141.
Brooks, R.H., Corey, A.T., 1964. Hydraulic properties of porous media. Hydrology paper, 3.
Colorado State University, Fort Collins.
Connolly, R.D., 1998. Modelling effects of soil structure on the water balance of soil-crop
systems: a review. Soil Tillage Res. 48, 1-19.
Fischer, R.A., Armstrong, J.S., Stapper, M., 1990. Simulation of soil water storage and
sowing day probabilities with fallow and no-fallow in sourthern New South Wales: I.
Model and long term mean effects. Agric. System, 33, 215-240.
Gonzalez-Sosa, E., Braud, I., Thony, J.L., Vauclin, M., Bessemoulin, P., 1999. Modelling
heat and water exchanges of fallow land covered with plant-residues mulch. Agric.
For. Meteorol. 97, 151-169

Water balance simulation 149
Gonzalez-Sosa, E., Braud, I., Thony, J.L., Vauclin, M., Calvet, J.C., 2001. Heat and water
exchanges of fallow land covered with a plant-residues mulch layer: a modelling study
using the three year MUREX data set. J. Hydrol. 244, 119-136.
Grossman, R.B., Reinsch, T.G., 2002. Bulk density and linear extensibility. In: Dane, J.H.,
Topp, G.C. (Eds). Methods of Soil Analysis. Part 4-Physical Methods, SSSA Book
Series No. 5, Madison, WI, USA, pp. 201-228.
Herrero, J., Snyder, R.L., 1997. Aridity and irrigation in Aragón, Spain. J. Arid Environ. 35,
535-547.
Jalota, S.K., Prihar, S.S., 1990. Bare soil evaporation in relation to tillage. Adv. Soil Sci. 12,
187-216.
Lampurlanés, J., Angás, P., Cantero-Martínez, C., 2002. Tillage effects on water storage
during fallow, and on barley root growth and yield in two contrasting soils of the semi-
arid Segarra region in Spain. Soil Tillage Res. 65, 207-220.
López, M.V., Arrúe, J.L., 1995. Efficiency of an incomplete block design based on
geostatistics for tillage experiments. Soil Sci. Soc. A. J. 59, 1104-1111.
López, J.J., Giráldez, J.V., 1992. ¿Es el barbecho necesario? Análisis de la eficiencia del
barbecho mediante un modelo de la evolución de la humedad del suelo. Inv. Agric,
Prod. Prot. Veg. 3, 327-343.
López, M.V., Arrúe, J.L., Sánchez-Girón, V., 1996. A comparison between seasonal
changes in soil water storage and penetration resistance under conventional and
conservation tillage systems in Aragón. Soil Tillage Res. 37, 251-271.
López, M.V., Moret, D., Gracia, R. and Arrúe, J.L., 2003. Tillage effect on barley residue
cover during fallow in semiarid Aragón. Soil Till. Res. 72, 53-64.
McAneney, K. J., Arrúe, J. L., 1993. A wheat-fallow rotation in northeastern Spain: water
balance-yield considerations. Agronomie 13, 481-490.
Milly, P.C.D., 1982. Moisture and heat transport in hysteretic, inhomogeneous porous
media: a matric head-based formulation and a numerical model. Water Resour. Res.
18, 498-498.
Perroux, K.M., White, I., 1988. Designs for disc permeameters. Soil Sci. Soc. Am. J. 52,
1205-1215.

150 Capítulo 6
Sauer, T.J., 2002. Heat flux density. In: Dane, J.H., Topp, G.C. (Eds). Methods of Soil
Analysis. Part 4-Physical Methods, SSSA Book Series No. 5, Madison, WI, USA, pp.
1233-1248.
Sillon, J.F., Richard, G., Cousin, I., 2003. Tillage and traffic effects on soil hydraulic
properties and evaporation. Geoderma 116, 26-49.
Topp, G.C., Davis, J.L., Annan, A.P., 1980. Electromagnetic determination of soil water
content: measurement in coaxial transmission lines. Water Resour. Res. 16, 574-582.
van Genuchten, M.T., 1980. A close-form equation for predicting the hydraulic properties of
unsaturated soils. Soil Sci. Soc. Am J. 44, 892-898.
Vandervaere, J.P., Peugeot, C., Vauclin, M., Angulo-Jaramillo, R., Lebel, T., 1997.
Estimating hydraulic conductivity of crusted soils using disc infiltrometers and
minitensiometers. J. Hydrol. 188-189, 203-223.

Capítulo 7
Winter Barley Performance under different Cropping
and Tillage Systems in Semiarid Aragón (NE Spain)
D. Moret, J.L Arrúe, M.V. López and R. Gracia
To be submitted to: European Journal of Agronomy

153
Winter Barley Performance under different Cropping and
Tillage Systems in Semiarid Aragón (NE Spain)
ABSTRACT
Barley is the winter cereal grown in most of semiarid dryland of central Aragón
(NE Spain), where it is traditionally cultivated under a crop-fallow rotation. In this
study we compared, under both a continuous cropping (CC) (5-6 months fallow) and a
crop-fallow rotation (CF) (16-18 months fallow), the effects of three fallow
management treatments (conventional tillage, CT; reduced tillage, RT; and no-tillage,
NT) on winter barley growth and yield and water use efficiency (WUE) during three
consecutive growing seasons (1999-2000, 2000-2001 and 2001-2002). Daily precipitation
and monthly measurements of soil water storage to a depth of 0.7 m were used to
calculate crop water use (ET) and its components. The average growing season
precipitation was 195 mm. Above-ground dry matter (DM) and corresponding WUE
were high in years with high effective rainfalls (>10 mm day-1) either in autumn or
spring. However, the highest values of WUE for grain yield were mainly determined by
effective rainfalls from stem elongation to harvest. Despite the similarity in ET for the
three tillage treatments, NT provided the lowest DM production, in agreement with a
higher soil water loss by evaporation and a lower crop transpiration (T), as showed by
the lowest T/ET ratio values found under NT. No clear differences in crop yield were
observed among tillage treatments in the study period. These findings suggest that
conventional tillage can be substituted by conservation tillage for fallow management
in semiarid dryland cereal production areas in central Aragon. On average, and
regardless of tillage, CF provided the highest values of DM and WUE and yielded 49%
more grain than CC. These differences between crop systems increased when water-
limiting conditions occurred in the early crop growth stages, probably due to the
additional soil water storage under CF at sowing time. Although no significant

154 Capítulo 7
differences in precipitation use efficiency (PUE) were observed between CC and CF,
PUE was higher under the CC system, which yielded 34% more grain than the CF
rotation when yields were adjusted to an annual basis including the length of fallow.
Crop yield under CF was not dependent on the increase in soil water storage at the end
of long fallow.
1. Introduction
In semiarid rainfed cereal-growing areas, bare long fallowing enables two
seasons’ rainfall to be conserved for growing a single crop. With this practice, soil
nitrogen and water storage at sowing time and water use efficiency are increased
and weed and disease control improved in comparison with continuous cropping
(Unger, 1994; Aase and Pikul, 2000). However, long fallowing has been
controversial because of inefficiency on soil water storage and water- and wind-
erosion (Amir et al., 1991; Farahani et al., 1998). When adjusting the grain
production to an annual basis including fallow time the continuous cropping system
shows to be more efficient at using seasonal precipitation (Jones and Popham,
1997).
In the same way, in semiarid dryland cereal agriculture, conventional
mouldboard ploughing as primary tillage to control weeds during fallow results in
many cases an inefficient practice for soil water conservation (Singh et al., 1998).
That is the reason why conservation tillage systems (i,.e., reduced tillage and no-
tillage) have been proposed as an alternative to the traditional soil management.
However, although conservation tillage practices have shown to improve soil
properties, save time and energy, and help to control water and wind erosion,
different and contradictory results have been obtained in semiarid dryland areas
when both crop growth and grain yields are compared under conventional and
conservation tillage treatments. Thus, whereas some authors (Unger, 1994:
Schillinger, 2001) obtained no differences in cereal production among tillage
systems, other researchers (Lawrence et al., 1994; Johnston et al., 1995; Singh et

Winter barley performance in semiarid Aragón 155
al., 1998; Bonfil et al., 1999) have observed a greater soil water storage under no-
tillage and thus better crop yields and water use efficiencies.
In Aragon, agricultural land accounts for 38% of the total surface of this region
(47,700 km2), where about 760,000 ha within the rainfed arable land (1.38 million
ha) are cultivated with herbaceous crops (80% grown to wheat and barley) and
about 460,000 ha are fallowed every year (López et al., 2001). In central Aragon,
rainfed cropland is located in areas with an average annual rainfall of < 400 mm. In
these areas, the most common cropping system is the traditional cereal-fallow
rotation, which extends over about 430,000 ha and involves a long-fallow period of
16-18 months, running from harvest (June-July) to sowing (November-December)
in the following year. Although the main purpose of long fallowing is to increase
soil water storage and the water available for the next crop, the cereal-fallow
rotation does not always result in improving water economy of cereals (López and
Arrúe, 1997; Lampurlanés et al., 2002). Based on barley yield / rainfall regressions
for data from a dry area in the Ebro valley, Austin et al. (1998a) estimated that the
annual yields from a crop-fallow system would be 15% greater than those obtained
with continuous cropping and stated that for fallowing to be economic, grain yields
in the traditional cereal-fallow would need to be at least twice those obtained with
annual cropping. These findings and calculations suggest that the benefits from
water storage during the long-fallow period are quite small and that, consequently,
the sustainability of long fallowing, a characteristic feature of dryland cereal
agriculture in central Aragon and other semiarid areas in the Ebro River valley can
still be seriously questioned.
On the other hand, mouldboard ploughing, which is the traditional fallow tillage
management in the cereal cropping systems in the region, is being slowly replaced
by conservation tillage practices. However, knowledge available on cereal crop
response to conservation tillage as alternative fallow tillage management in
semiarid Ebro River valley is still limited. López and Arrúe (1997) found in central

156 Capítulo 7
Aragon a 53% reduction in grain yield with no-tillage compared to conventional
tillage. On the contrary, Angás (2001) and Lampurlanés et al. (2002) found in the
eastern Ebro River valley that no-tillage fallow appears to be the best management
system for barley production.
The aim of this paper was to compare the effects of three fallow management
treatments (conventional tillage, CT; reduced tillage, RT; and no-tillage, NT) on
winter barley growth and yield and water use efficiency during three consecutive
growing seasons under both continuous cropping (CC) and a crop-fallow rotation
(CF) in a dryland cereal-growing area of central Aragon.
2. Material and methods
2.1. Site, tillage, crop management and experimental design
The site is located at the dryland research farm of the Estación Experimental de
Aula Dei (CSIC) in the Zaragoza province (latitude 41º 44’N; longitude 0º 46’W;
altitude 270 m). The climate is semiarid with an average annual precipitation of 390
mm and an average annual air temperature of 14.5 ºC. Soil at the research site is a
loam (fine-loamy, mixed thermic Xerollic Calciorthid) according to the USDA soil
classification (Soil Survey Staff, 1975). Other selected soil physical and chemical
properties for that layer have been previously presented by López et al. (1996). The
study was conducted on three adjacent large blocks of plots, which were set up on a
nearly level area in 1990 (Field 1), 1991 (Field 2) and 1992 (Field 3) within a long-
term conservation tillage experiment. Winter barley (Hordeum vulgare L.) was
cultivated in Field 1 as continuous cropping (CC) (hereafter called CC1) after a 5-6
month fallow period, and under the traditional cereal–fallow rotation (CF) in Fields
2 (CF2) and 3 (CF3), after a long-fallow period 17-18 months long. Field soil and
crop measurements were taken from November 1999 to June 2002 and comprised
three consecutive growing seasons, which extended from 4 November 1999 to 20
June 2000 (in CC1 and CF3 fields), from 13 December 2000 to 29 June 2001 (in

Winter barley performance in semiarid Aragón 157
CC1 and CF2 fields) and from 23 November 2001 to 27 June 2002 (in CC1 and
CF3 fields). A schematic of the CC and CF cropping systems, including their
different phases and length and the main cultural practices is given in Fig. 7.1.
Three soil tillage systems, implemented during the fallow period as indicated in
Fig.7.1, were compared: conventional tillage (CT), consisting of mouldboard
ploughing to a depth of 30-40 cm in late winter or early spring, followed by
secondary tillage with a sweep cultivator to a depth of 10-15 cm in late spring. (10-
15 cm); reduced tillage (RT), similar to CT but using chisel ploughing to a depth of
25-30 cm as primary tillage practice; and no-tillage (NT), where weeds during
fallow were controlled with herbicides (glyphosate).
Whereas a conventional seeder was used to sow the CT and RT treatments, a
tine zero-till seeder was used to sow the NT plots. The average sowing rate for the
three growing seasons was 175 kg ha-1. Except for the NT treatment, which needed
one or two more herbicide applications, herbicides and fertilisers rates were the
same for all treatments.
Tillage treatments were arranged in an incomplete block design based on
geostatistical concepts, with three replications for the RT and NT treatments and
four for the CT treatment (López and Arrúe, 1995). The three large blocks of ten
plots were arranged according to a split block design with tillage as the main plot
and cropping system as the subplot. The size of the elemental plot was 33.5 m x 10
m, with a separation of 1 m between plots. Within each incomplete block a 7 m x 7
m region was delimited for field measurements at two observation points (one per
treatment) separated by a distance of 5 m. To compare the effects of the fallow
tillage treatments within each cropping system, analysis of variance (ANOVA) for
incomplete block design was used. To evaluate the cropping systems irrespective of
tillage treatment and tillage x cropping system interaction, ANOVA according to
the split block design with three replications was performed (López and Arrúe,
1995). Duncan’s multiple range test was used to compare between treatment means.

158 Capítulo 7
2-yr
bar
ley-
fallo
w r
otat
ion
(CF
)2-
yr c
onti
nuou
s ba
rley
cro
p ro
tati
on (
CC
)
OSAJJM
AM
F
N
J
DJ
FM
AMJJA
SO
ND
Har
vest
Sow
ing
Sow
ingPr
imar
y/se
cond
ary
tilla
ge
Pri
mar
y/se
cond
ary
tilla
ge
Bar
ley
D=
210
Bar
ley
D=2
10
Fallo
wD
=15
0
Fal
low
D=1
50
OSAJJ
MA
MF
N
J
DJ
FM
AMJJA
SO
ND
Sow
ing
Prim
ary
tilla
ge
Seco
ndar
ytil
lage
Fallo
wD
=450
Bar
ley
D=2
10
Har
vest
Bar
ley
D=2
10
Sec
onda
ryti
llag
e
Fig
ure
7.1.
Sch
emat
ic o
f dr
ylan
d cr
oppi
ng s
yste
ms
show
ing
phas
es, p
hase
leng
th in
day
s (D
) an
d ag
rono
mic
pra
ctic
es.

Winter barley performance in semiarid Aragón 159
Soil and crop parameters measured in CC1 in the three growing seasons were
compared with those obtained in CF2 in 1999-2000 and 2001-2002 and CF3 in
2000-2001.
2.2. Sampling and measurements
2.2.1. Weather
Daily meteorological observations were made at the experimental site over the
whole experimental period using an automated weather station. Precipitation was
measured at 1.5 m using a tipping bucket rain gauge (model ARG100, Campbell
Scientific Inc.), air temperature and relative humidity were measured at 1.8 m with
a combined sensor (model HMP35AC, Vaisala), wind speed and direction were
measured at 2 m with a combined sensor (model 05103-5, Young) and solar
radiation at 2 m with a pyranometer (model SP1110, Skye). The sensors were
connected to a data-logger (model CR10, Campbell Scientific Inc.), which
continuously recorded 60-min averages of data acquired at intervals of 10 s.
2.2.2. Soil water content
The volumetric soil water content (θ ) in the soil profile (0-70 cm depth) at each
observation point was monitored by Time Domain Reflectometry (TDR) using
probes of two parallel stainless steel rods (diameter: 4 mm; length: 150, 250, 450
and 750 mm; spacing between rod centers: 50 mm). TDR probes were inserted
vertically into the soil to a depth of 10, 20, 40 and 70 cm. The protruding TDR
electrode pair were connected to a cable tester (model 1502C, Tektronix) by means
of a quick disconnect type interface housing a 50-200 Ω impedance matching pulse
transformer (Dalton, 1992). Waveforms were transferred to a laptop with a SP232
serial communication module and analysed using the software WinTDR’98 (Or et
al., 1998). θ was estimated at 0-10, 10-20, 20-40 and 40-70 cm depth layers using
the model proposed by Topp et al. (1980), which proved to be suitable for our soil

160 Capítulo 7
in a previous calibration experiment, and the multiple length probe method
described by Miyamoto et al. (2001). Soil water profile was monitored on a
monthly basis in both CC and CF at two observation points per plot according to the
incomplete block design. With this sampling scheme, a total of 18 measurements (6
per treatment) were made on each field and observation date. The plant available
soil water (PASW) was calculated as the difference between θ in the soil profile (0-
70 cm) and θ at the permanent wilting point (ψ = –1500 kPa) previously
determined for the three tillage systems (Chapter 4).
2.2.3. Crop growth and yield
Crop establishment was determined as the percentage of seeds sown for which
seeding emerged. Seed depth was estimated by measuring the length of white stem
above the seed of 5 plants randomly sampled from each row (López and Arrúe,
1997). Crop growth was monitored from biomass samplings at selected growth
stages according to the Zadoks scale (Zadoks et al., 1974). During the 1999-2000
growing season, plant samplings were made at early seeding growth (ZGS 11-12),
flag leaf extending (ZGS 41), dough development (ZGS 80) and maturity (ZGS 99).
During the 2000-2001 and 2001-2002 seasons, samplings were made at early
seeding growth (ZGS 11-12), tillering (ZGS 22-28), anthesis (ZGS 60) and maturity
(ZGS 99). An additional sampling was made at stem elongation (ZGS 32-38) in the
2001-2002 season. The last sampling date corresponded to the harvest day. Four 0.5
m long rows per plot according to the incomplete blocks design were selected for
plant measurements at each sampling date. Dry weight of above-ground plant
material collected was determined after oven-drying at 65 °C for 48 h. Immediately
prior to harvest, total plants from each 0.5 m long row sampling were hand-
harvested to determine grain yield and yield components. The ears were counted
and, after oven drying, threshed to determine the number of grains per ear and mean
grain weight.

Winter barley performance in semiarid Aragón 161
2.2.4. Water use and water use efficiency
By assuming a negligible runoff and drainage below the root zone, crop water
use (ET), including crop transpiration (T) and soil water evaporation (E), was
calculated from seasonal rainfall (P) and the change in soil water content to a depth
of 70 cm (∆S) (i.e., ET = ∆S + P).
On the basis of the transpiration efficiency (TE) constancy for a cropping system
(Tanner and Sinclair, 1983), seasonal T was calculated directly from above-ground
dry matter (DM) as follows:
( ) keeDMT /* −= (7.1)
where (e* - e) is the mean daytime vapour pressure deficit and k is a crop-specific
efficiency coefficient. (e* - e) was calculated for the period of active dry-matter DM
accumulation (from ZGS 11-12 to ZGS 75-85) and k for barley was estimated to be
3.1 Pa (López and Arrúe, 1997). Then, soil water evaporation E was estimated by
subtracting T from ET for the period between ZGS 00-09 to ZGS 75-85 (López and
Arrúe, 1997).
Water use efficiency for both total DM produced at harvest (WUEb) and grain
yield (WUEg) were determined as the respective total biomass and yield weights
divided by total ET. The precipitation use efficiency index (PUE) , defined as grain
yield divided by harvest-to-harvest water use (Jones and Popham, 1997), was also
calculated for both CC and CF systems. Likewise, the fallow precipitation storage
efficiency (PSE), defined as the percentage of fallow-season precipitation that is
stored as soil water, was calculated for CF as
PSE = [(θf - θi)/PF ] x 100 (7.2)
where θf and θi are the volumetric water content in the soil profile (0-70 cm)
(expressed in mm) at the end and the beginning of the 16-18-mo fallow period,
respectively, and PF the precipitation during the fallow period.

162 Capítulo 7
3. Results and discussion
3.1. Seasonal rainfall and soil water storage
Average annual precipitation for the experimental period (1999-2002) was 362
mm, 7% lower than the long-term average (1954-2002) precipitation (390 mm).
Total precipitation recorded from crop sowing to harvest during the 1999-2000 (205
mm), 2000-2001 (164 mm) and 2001-2002 (216 mm) crop-season periods was 24,
28 and 5% below the long-term average, respectively (Fig. 7.2a). Rainfall patterns
were contrasted among growing seasons, with monthly totals irregularly distributed
over each crop cycle period. Thus, whereas the 1999-2000 and 2001-2002 seasons
showed a dry autumn-winter period (November-March) (62 and 89 mm,
respectively) and a wet spring (April-May) (107 and 95 mm, respectively), an
opposite pattern characterised the 2000-2001 season (171 mm from November to
March and 56 mm from April to May). Likewise, different amount of effective
rainfall ( ≥ 10 mm day-1) were also observed among the experimental growing
seasons. Thus, whereas the 2000-2001 season showed the highest effective rainfall
in the autumn-winter period, the effective rainfall in spring was significantly higher
in the 2001-2002 season than in the 1999-2000 and the 2000-2001 seasons (Fig.
7.2a).
As expected, the soil water content during the different crop growth phases was
influenced by seasonal rainfall pattern. Figures 7.2a, 7.2b and 7.2c show the
evolution of water content in the soil profile (0-70 cm) over the entire experimental
period for the different tillage and cropping systems. Whereas a dry autumn in 1999
and 2001 (Fig. 7.2a) determined a low soil water content at seeding (Figs. 7.2b and
7.2c), a wet autumn in 2000 allowed an important water recharge (Figs. 7.2b and
7.2d). Tillage and crop rotations also affected soil water content. Thus, on average,
the crop-fallow rotation (CF) stored at seeding 19, 32 and 17 mm more water than
the continuous cropping (CC) for the conventional tillage (CT), reduced tillage
(RT) and no-tillage (NT) treatments, respectively (Chapter 5, Table 5.4). Overall,

Winter barley performance in semiarid Aragón 163
Ra
infa
ll (m
m)
Soi
l wat
er
cont
ent (m
m)
1999 2000 2001 2002
0
40
80
120
0
50
100
150
200
0
50
100
150
200
0
50
100
150
200
b
c
d
HH
S S
S H
H H
O N D J F M A M J J A S O N D J F M A M J J A S O N D J F M A M J
Rainfall < 10 mm day-1
Avg. rainfall 1954-2002
CT NTRT
SSHS
Rainfall > 10 mm day-1
a
O N D J F M A M J J A S O N D J F M A M J J A S O N D J F M A M J
Figure. 7.2. Monthly rainfall for the experimental period (1999-2002) vs. long-term average (1954-2002) (a) and dynamics of soil water content (0-70 cm) for conventional tillage (CT), reduced tillage (RT) and no-tillage (NT) under continuous cropping (b) and crop-fallow rotation (c) and (d). S and H indicate sowing and harvest dates, respectively. Vertical bars indicate LSD (P < 0.05).

164 Capítulo 7
CT showed to be the most inefficient system to store water over the growing
season. At harvest, a substantial depletion of water content in the soil profile was
observed under both CC and CF systems (Fig. 7.3). The soil water profile was also
affected by the different tillage systems. In agreement with findings by
Lampurlanés et al. (2002) in eastern Ebro valley and Chan and Heenan (1996) in
southern Australia, soil water content in the upper 20 cm was generally higher
under NT than under CT and RT (Fig. 7.3) (Chapter 5).
3.2. Crop performance
3.2.1. Crop establishment and growth
Table 7.1 summarises the percentage of crop emergence and seed depth as
affected by tillage and crop systems for the three experimental growing seasons.
Firstly, results show that rainfall regime during the growing season had a significant
influence on emergence percentage. Favourable weather and soil conditions (high
water content at sowing) during the germination period in 2000-2001 (Fig. 7.3),
resulted in significantly higher percentages of crop emergence than in 1999-2000
and 2001-2002. Statistical differences in crop emergence were also observed at P <
0.1 between crop systems. The extra water stored at the end of the 16-18 month
fallow period in the CF rotation resulted in a slight decrease of crop failure in this
system, especially in seasons with a dry fall (1999-2000 and 2001-2002) (Austin et
al., 1998b). On the other hand, as Chan and Heenan (1996) observed, the greater
water content in the NT topsoil at sowing (Fig. 7.3) did not induce significant
differences in crop emergence among tillage systems. During the three experimental
years, the smallest seed depth was measured in NT plots. This shallow seed
placement should be associated with a more compacted soil surface under NT
(Chapter 4). No significant differences in seed depth were observed between
cropping systems (Table 7.1).
Figure 7.4 shows the seasonal changes in aboveground dry-matter (DM) and

Winter barley performance in semiarid Aragón 165
0.0 0.1 0.2 0.3
0-10 -
10-20 -
20-40 -
40-70 -
0.0 0.1 0.2 0.3 0.0 0.1 0.2 0.3
Sowing Harvest
De
pth
(cm
)
θ (m3 m-3)
Harvest Sowing
θ (m3 m-3)
1999-2000
2000-2001
2001-2002
0-10 -
10-20 -
20-40 -
40-70 -
0-10 -
10-20 -
20-40 -
40-70 -
-
-
-
-
-
-
-
-
-
-
-
-
0.0 0.1 0.2 0.3
-
-
-
-
-
-
-
-
-
-
-
-
-
-
-
-
-
-
-
-
-
-
-
-
CC CF
NT
CTRT
Figure 7.3. Soil water (θ) profiles at sowing and harvesting of barley as affected by tillage (CT, conventional tillage; RT, reduced tillage; and NT, no-tillage) under continuous cropping (CC) (left) and crop-fallow rotation (CF) (right) in the 1999-2000, 2000-2001 and 2001-2002 growing seasons. Horizontal bars indicate LSD (P < 0.05).

166 Capítulo 7
Table 7.1. Crop establishment of barley as affected by tillage (conventional tillage; CT, reduced tillage, RT; and no-tillage NT), and cropping system (CC, continuous cropping; CF, cereal-fallow rotation) in the 1999-2000, 2000-2001 and 2001-2002 growing seasons.
Growing season
Cropping system
Tillage treatment
Emergence (%)
Seed depth (cm)
1999-2000 CC1 CT RT NT LSD†
50.7 45.8 62.9 NS
5.1 4.4 3.5 1.1
CF3 CT RT NT LSD
67.1 67.1 66.8 NS
3.3 3.2 3.5 NS
2000-2001 CC1 CT RT NT LSD
79.5 83.3 82.3 NS
3.9 3.7 2.6 NS
CF2 CT RT NT LSD
79.1 81.9 93.3 NS
4.6 4.1 2.7 NS
2001-2002 CC1 CT RT NT LSD
47.5 55.9 65.2 NS
5.3 5.6 2.6 1.6
CF3 CT RT NT LSD
61.3 69.4 67.9 NS
5.8 4.4 1.8 1.4
† Least significant difference, P<0.05. NS, not significant.
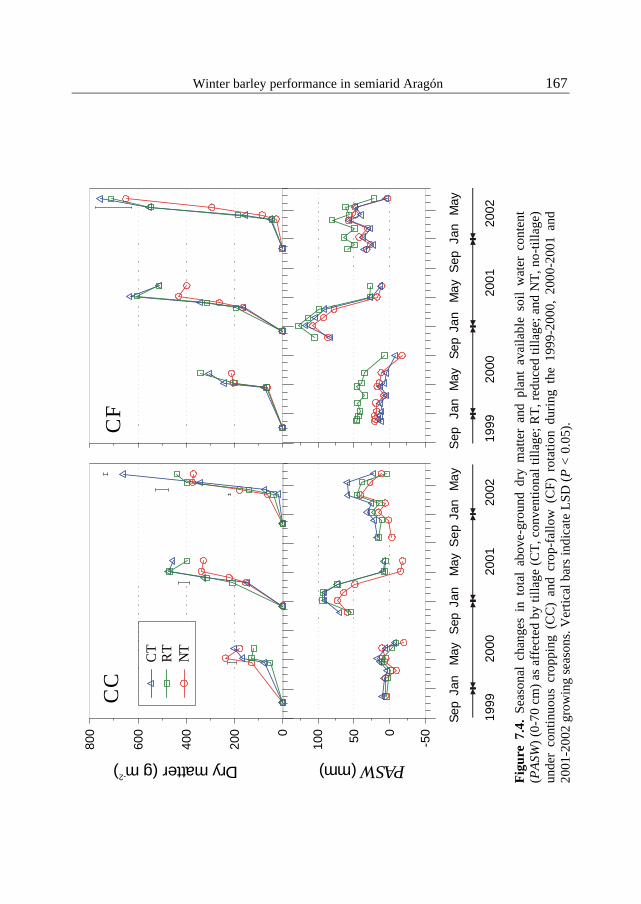
Winter barley performance in semiarid Aragón 167
1
999
20
00
20
01
20
02
Dry matter (g m)-2
PASW (mm)
CF
-500501000
200
400
600
800
CC
CT
RT
NT
Sep
Jan
M
ay
Sep
Jan
Sep
Jan
M
ay
Sep
Ja
n
May
S
ep J
an
Ma
y S
ep J
an
May
1
999
2
000
2
001
20
02
May
Fig
ure
7.4.
Sea
sona
l ch
ange
s in
tot
al a
bove
-gro
und
dry
mat
ter
and
plan
t av
aila
ble
soil
wat
er c
onte
nt
(PA
SW)
(0-7
0 cm
) as
aff
ecte
d by
till
age
(CT
, con
vent
iona
l til
lage
; RT
, red
uced
till
age;
and
NT
, no-
till
age)
un
der
cont
inuo
us c
ropp
ing
(CC
) an
d cr
op-f
allo
w (
CF)
rot
atio
n du
ring
the
199
9-20
00,
2000
-200
1 an
d 20
01-2
002
grow
ing
seas
ons.
Ver
tical
bar
s in
dica
te L
SD (
P <
0.0
5).
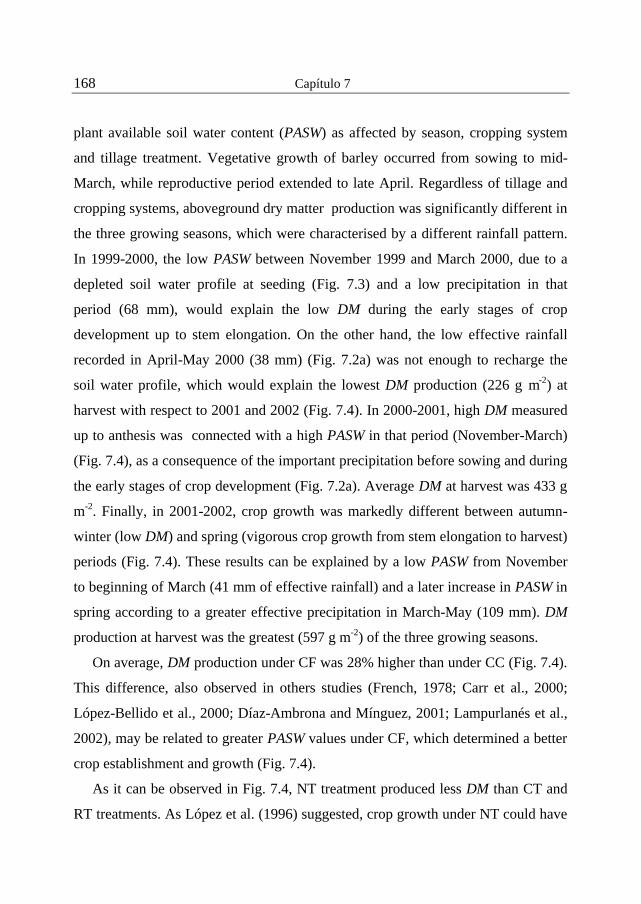
168 Capítulo 7
plant available soil water content (PASW) as affected by season, cropping system
and tillage treatment. Vegetative growth of barley occurred from sowing to mid-
March, while reproductive period extended to late April. Regardless of tillage and
cropping systems, aboveground dry matter production was significantly different in
the three growing seasons, which were characterised by a different rainfall pattern.
In 1999-2000, the low PASW between November 1999 and March 2000, due to a
depleted soil water profile at seeding (Fig. 7.3) and a low precipitation in that
period (68 mm), would explain the low DM during the early stages of crop
development up to stem elongation. On the other hand, the low effective rainfall
recorded in April-May 2000 (38 mm) (Fig. 7.2a) was not enough to recharge the
soil water profile, which would explain the lowest DM production (226 g m-2) at
harvest with respect to 2001 and 2002 (Fig. 7.4). In 2000-2001, high DM measured
up to anthesis was connected with a high PASW in that period (November-March)
(Fig. 7.4), as a consequence of the important precipitation before sowing and during
the early stages of crop development (Fig. 7.2a). Average DM at harvest was 433 g
m-2. Finally, in 2001-2002, crop growth was markedly different between autumn-
winter (low DM) and spring (vigorous crop growth from stem elongation to harvest)
periods (Fig. 7.4). These results can be explained by a low PASW from November
to beginning of March (41 mm of effective rainfall) and a later increase in PASW in
spring according to a greater effective precipitation in March-May (109 mm). DM
production at harvest was the greatest (597 g m-2) of the three growing seasons.
On average, DM production under CF was 28% higher than under CC (Fig. 7.4).
This difference, also observed in others studies (French, 1978; Carr et al., 2000;
López-Bellido et al., 2000; Díaz-Ambrona and Mínguez, 2001; Lampurlanés et al.,
2002), may be related to greater PASW values under CF, which determined a better
crop establishment and growth (Fig. 7.4).
As it can be observed in Fig. 7.4, NT treatment produced less DM than CT and
RT treatments. As López et al. (1996) suggested, crop growth under NT could have

Winter barley performance in semiarid Aragón 169
been limited by a more compacted NT topsoil that restricts root growth. Likewise, a
lower PASW under NT during the crop development (Fig. 7.4) could also explain
the poorer crop growth under NT. These results are similar to those reported by
Hamblin et al. (1982) in semiarid western Australia and López-Bellido et al. (2000)
in southern Spain, but differ from results obtained in semiarid Morroco by Mrabet
(2000), who found under NT the highest DM values. A significant cropping system
x tillage interaction was also observed for total DM production.
3.2.2. Crop yield
As found in previous studies (McAneney and Arrúe, 1993; Cantero-Martínez et
al., 1995; Austin et al., 1998b; Díaz-Ambrona and Mínguez, 2001), barley yields
(Table 7.2) were highly dependent on seasonal rainfall. However, in agreement with
findings by Smika (1970) in the semiarid Grain Plains of USA, crop yield was more
influenced by the rainfall distribution over the crop growing season than by the total
precipitation. Hence, and regardless of tillage and cropping systems, barley yield in
1999-2000 was 61% less than yield in 2001-2002 for a similar seasonal rainfall in
both growing seasons. The high yield in 2001-2002 (Table 7.2) can be related to a
large effective rainfall in March-May (109 mm), (Fig. 7.2a) that favoured ear and
grain development. In 1999-2000, low yields (Table 7.2) were associated to a low
effective rainfall during flowering (58 mm in March-May; Fig. 7.2a), which
determined a poor grain development through a lower number of ears x m-2 and
grain weight (Table 7.2). These results agree with those of Amir et al. (1991) and
Day et al. (1987) who found lower grain production when there is a water shortage
during the grain-filling period. In the 2000-2001growing season, characterised by a
contrasting seasonal rainfall distribution (wet fall and dry spring), barley yields
were also low. A low PASW in April-May (Fig. 7.4), due to a high soil water
consumption by the crop in the pre-anthesis period, along with a low precipitation
in those months (only 25 mm of effective rains), stressed the crop during ear

170 Capítulo 7
Table 7.2. Grain yield and yield components of barley as affected by tillage (conventional tillage, CT; reduced tillage, RT; and no-tillage NT), and cropping system (CC, continuous cropping; CF, cereal-fallow rotation) in the 1999-2000, 2000-2001 and 2001-2002 growing seasons.
Growing season
Cropping system
Tillage treatment
Grain yield (kg ha-1)
Ears per m2
Grains per ear
Grain weight (mg)
Harvest index
1999-2000 CC1 CT RT NT LSD†
859 484 633 165
183.4 122.6 145.0 NS
17.4 14.4 16.3 NS
27.8 27.5 27.8 NS
0.43 0.36 0.35 0.06
CF3 CT RT NT LSD
1442 1567 839 NS
255.9 239.2 210.8 NS
18.6 21.2 14.5 2.6
31.2 32.3 28.9 NS
0.50 0.49 0.36 NS
2000-2001 CC1 CT RT NT LSD
1409 1188 902 NS
246.6 236.8 148.7 NS
13.9 13.6 20.4 NS
37.5 35.2 31.5 NS
0.28 0.28 0.27 NS
CF2
CT RT NT LSD
1475 1347 1242 NS
284.6 224.5 236.1 NS
14.1 16.7 20.9 NS
44.8 33.4 26.7 NS
0.25 0.24 0.26 NS
2001-2002 CC1 CT RT NT LSD
2599 1782 1494 NS
457.7 350.5 263.0 NS
17.2 14.9 17.1 NS
33.6 33.2 28.1 NS
0.39 0.39 0.32 NS
CF3 CT RT NT LSD
3096 2751 3190 NS
528.2 374.8 570.7 NS
15.6 22.1 17.7 4.0
34.5 36.7 36.1 NS
0.40 0.43 0.56 0.11
† Least significant difference, P<0.05. NS, not significant.

Winter barley performance in semiarid Aragón 171
development, which resulted in a decrease in the number of ears per square meter
and, therefore, in low yields (Table 7.2). Comparable results were found in south
Australia by French (1978), who observed that yields were poorly correlated with
soil water content at sowing but highly influenced by rainfall during the growing
season. However, a higher amount of stored water at sowing in the 2000-2001
season provided some insurance against plant water stress in spring so that grain
production was higher than in the dry 1999-2000 season.
Overall, grain yield in the CF rotation (1883 kg ha-1) was 49 % greater than in
the CC system (1261 kg ha-1) (Table 7.2). This yield increase in CF is higher than
the 25% measured by López and Arrúe (1997) and the 15% estimated by Austin et
al. (1998a) in the study area, and the 24 and 31% reported by López-Bellido et al.
(2000) and French (1978) for wheat in south Spain and south Australia,
respectively, but lower than the 63% obtained by Díaz-Ambrona and Mínguez
(2001) in semiarid central Spain for barley in two contrasting years and the 105%
found by Amir et al. (1991) in semiarid Israel for wheat in years with below-
average rainfall. In our study, since the growing season rainfall was low (195 mm
on average), the yield gain in CF could be explained by the additional water stored
at sowing. French (1978) in south Australia and López and Arrúe (1997) in central
Aragón found that the yield response under CF was related positively to this extra
water. The mean yield gain in CF was 28 kg ha-1 per mm water conserved. This
grain yield increase is greater than the 11 or 8 kg ha-1 per mm water conserved
obtained by French (1978) and López and Arrúe (1997), respectively. In other
experiences, however, the yield gain after long fallowing has been attributed to an
increase in soil nitrogen availability and control of cereal root diseases and not to
any increase in soil water storage (Incerti et al., 1993; Amir et al., 1991). In our
water limiting conditions, where cereal crops might be more sensitive to soil
pathogens, the higher crop yield under CF could be related to an improvement in
soil sanitation.

172 Capítulo 7
On the other hand, an interaction between cropping system and rainfall
distribution during the growing season was observed. Differences in crop yield
were small (16%) in 2000-2001 (wet autumn and dry spring) and more significant
in 1999-2000 (95%) and 2001-2002 (54%) (dry autumn and wet spring in both
seasons). These results suggest, as Austin et al. (1998a) pointed out, that in years
with wet autumns (i.e. the 2000-2001 campaign), farmers could beneficially sow
without long-fallowing (i.e., after the minimum 5-month fallow). On the contrary,
in years with a dry autumn, where the risk of crop failure is high, fallowing for a
further year could result in additional root zone soil water at sowing and a better
crop establishment thus decreasing the risk of crop failure. In 2001-2002, the higher
yield under CF could be also explained by additional water stored at sowing below
70 cm depth due to deep percolation during the preceding overwinter fallow period
(Chapter 6 (Fig. 6.5). When grain production was adjusted to an annual basis
including fallow time, the CC system was more efficient at using precipitation,
producing, on average, 34% more grain than the CF rotation.
Although small differences in grain yield were observed among tillage systems
in the three experimental years, NT yielded 24 and 8 % less grain than CT and RT,
respectively, as a result of a smaller number of grains per unit of area (grains per ear
x ears per m2) (Table 7.2). A reduction of 53 and 43% in grain yield with NT
compared to CT and RT was found by López and Arrúe (1997) in central Aragon
after two years of trial. In principle, a lower grain production under NT could be
related to a greater soil compaction at the surface horizons in this treatment that
restricts root growth and access to water and nutrients in deeper layers (López et al.,
1996). These results are comparable to those obtained by López-Bellido et al (2000)
in southern Spain, but differ from those found by Mrabet (2000) in semiarid
Morocco and Lampurlanés et al. (2002) in northeastern Spain, who reported a
significant yield increase with NT compared to CT and RT treatments.

Winter barley performance in semiarid Aragón 173
The harvest index, which was not much affected by crop and tillage systems,
was relatively low in 2000-2001 (Table 7.2). As mentioned before, in this season,
an important vegetative growth during the early crop development stages, along
with a drought period during ear formation (Fig. 7.4), limited the amount of soil
water available for grain development, which resulted in low yield and harvest
index values. This result is in agreement Amir et al. (1991) who found that the
harvest index is strongly related to the post-anthesis water supply.
3.3. Crop water use
3.3.1. Total water use
Overall, 60% of total water use (ET) occurred by anthesis and 40% from
anthesis to maturity (Fig. 7.5). Over the three experimental years, dry matter
production (DM) was related to ET (DM = 68ET - 10597, R2 = 0.61). On the other
hand, although a poor relationship was found, grain yield tended to increase with
ET. A significant influence of both seasonal precipitation and cropping system on
ET was found. In 1999-2000, small differences between ET and seasonal rainfall
indicate that during the entire growing period the crop mostly used this rainfall.
Additionally, the low ET in 1999-2000 (on average, 16% lower than ET in 2000-
2002 and 2001-2002) would explain the poor crop growth and development in that
season. In contrast, in 2000-2001, ET up to anthesis (ZGS 60) was 40% higher than
the rainfall received in that period (Fig. 7.5). This result is consistent with the high
soil water content at seeding (Fig. 7.2) and would also explain the high DM
production during the vegetative period (Fig. 7.4). As high pre- to post-anthesis ET
ratio indicate, the rainfall collected during the last phases of crop development
(from anthesis to harvest) was not enough to satisfy the water needs of a well-
developed crop, which resulted in low yields. Cantero-Martínez et al. (1995) also
found that in dry years water is preferentially consumed in the pre-anthesis period.
In 2001-2002, ET up to tillering (ZGS 22) was about two times lower than the

174 Capítulo 7
0
60
120
180
240
0
60
120
180
240
0
60
120
180
240
mm
1999-00
2000-01
2001-02
CC CF
ZGS RainfallNTRTCTNTRTCT
22
32
60
99
22
60
4080
99
99
*
*
ET
Figure 7.5. Crop water use (ET) during different phases of barley growth as affected by tillage (CT, conventional tillage; RT, reduced tillage; and NT, no-tillage) under continuous crop (CC) and crop-fallow rotation (CF) and seasonal precipitation during the 1999-2000, 2000-2001 and 2001-2002 growing seasons. ZGS indicates Zadoks growth stages. An asterisk indicates significant differences among tillage treatments at P<0.05 for a given growth phase and crop system.

Winter barley performance in semiarid Aragón 175
corresponding rainfall (Fig. 7.5), which can be attributed also in this case to a poor
crop establishment and early growth (Table 7.1; Fig. 7.4). The extra soil water not
consumed by the crop by tillering was subsequently used, which would explain high
biomass production from tillering to harvest (Fig. 7.4) and high grain yields in the
2001-2002 season (Table 7.2).
Regardless of tillage treatment, the CF rotation used 15-26 mm more water than
the CC system. Although a consistent relationship between the extra water used by
the CF crop and the additional water content at sowing was not found, the average
ET is in agreement with the average 22 mm water gained at sowing by the CF
system (Chapter 5, Table 5.4). These results are comparable with those obtained by
French (1978) and Latta and O’Leary (2003) in south Australia. The difference in
ET between CF and CC was more important in seasons with a dry autumn (i.e.,
1999-2000 and 2001-2002).
There were no significant differences in ET among tillage treatments. This
unexpected result, also observed by Singh et al. (1998), is not consistent with the
lower yields measured under NT.
3.3.2. Crop transpiration and soil water evaporation
Estimates of T, its contribution to ET and the transpiration efficiency for grain
yield, TE, are shown in Table 7.3. The partitioning of ET into its components
showed that a large proportion of ET occurred as E. This would explain the
similarity in total ET for the three tillage treatments, despite the differences
observed in crop growth and yield. Overall, the contribution of E to ET showed a
significant variation among growing seasons, ranging from 31% of ET in 2001-
2002 (wet spring) to 69% of ET in 1999-2000 (dry spring). On the other hand, T
was significantly greater under the CF rotation than under the CC system. The
average T/ET ratio under CF (0.57) was 30% higher than under CC (0.44), similar
to the 39% obtained by Amir et al (1991) in arid Israel. These differences can be

176 Capítulo 7
Table 7.3. Crop transpiration (T), its contribution to water use (T/ET) and transpiration efficiency for grain yield (TE) of barley, estimated from vapour pressure deficit (e* - e) and above-ground dry matter (DM) for conventional tillage (CT), reduced tillage (RT) and no-tillage (NT) under continuous cropping (CC) and cereal-fallow (CF) rotation in the 1999-2000, 2000-2001 and 2001-2002 growing seasons.
Growing season
Cropping system
Tillage treatment
(e* - e) (Pa)
ET (mm)
DM (g m-2)
T (mm)
T/ET (%)
TE (kg ha-1 mm-1)
1999-2000 CC1 CT RT NT LSD†
850 187 190 178 NS
202 121 178 NS
56.0 33.1 48.7 8.8
28.6 16.6 26.0 4.8
15.7 13.3 12.9 2.3
CF3 CT RT NT LSD
850 199 202 200 NS
303 340 212 NS
86.0 93.1 58.0 NS
41.4 45.8 29.1 NS
17.8 17.7 13.1 NS
2000-2001 CC1 CT RT NT LSD
858 219 225 228 NS
453 398 329 NS
125.7 110.2 91.1 NS
57.2 48.7 40.0 8.7
10.1 10.0 9.8 NS
CF2
CT RT NT LSD
858 253 237 233 NS
510 512 397 NS
137.6 142.0 109.9 NS
58.9 59.6 47.8 NS
10.0 8.8
10.0 NS
2001-2002 CC1 CT RT NT LSD
805 214 223 206 13
661 440 370 151
171.7 114.3 96.0 NS
80.5 51.0 46.2 18.6
15.0 15.0 12.2 NS
CF3 CT RT NT LSD
805 235 243 241 NS
754 710 649 NS
196.0 184.4 169.2 NS
82.9 75.7 70.2 NS
15.2 16.4 21.7 4.1
† Least significant difference, P<0.05. NS, not significant.

Winter barley performance in semiarid Aragón 177
attributed to a lower crop biomass under CC, which favoured soil water
evaporation. Although no significant differences in T were observed among tillage
treatments, high E values under NT resulted in a low T/ET ratio (Table 7.3). This
could be attributed to a lower ground cover by the crop during crop growth (López
and Arrúe, 1997) and higher water content at the surface in the NT soil profile,
which may enhance soil water evaporation in this treatment. The average value of
TE computed over the three experimental years (13.6 kg ha-1 mm-1) was within the
range found by López and Arrúe (1997) for barley (7.4-23.8 kg ha-1 mm-1) and
below the potential ratio (16.7 kg ha-1 mm-1) estimated by McAneney and Arrúe
(1993) for wheat in central Aragon.
3.3.3. Quantitative indices of water use and precipitation use efficiency
Water use efficiency for above-ground biomass at harvest (WUEb) and grain
yield (WUEg) were affected by seasonal rainfall, tillage treatment and cropping
system (Fig 6). Overall, WUEb values ranged between 6.1 and 32.2 kg ha-1mm-1 and
were comparable to those found for wheat by other authors (French, 1978; French
and Schultz, 1984; Amir et al.,1991). Years with a wet autumn and a dry spring
(i.e., 2000-2001), but also with a dry autumn and effective rains in spring (i.e.,
2001-2002), showed high WUEb values. In 1999-2000, on the contrary, the lowest
values of WUEb could be related with a less effective precipitation recorded during
the entire crop growing season.
A different behaviour was observed in WUEg. Small WUEg values obtained in
1999-2000 and 2000-2001 (Fig. 7.6) were due to low PASW during the ear
formation phase (Fig. 7.4), which could have limited the translocation of the pre-
anthesis carbohydrate reserves to the grain (López and Arrúe, 1997). On the
contrary, higher PASW from March to May in 2001-2002 (Fig. 7.4) determined
higher WUEg values in this year (Fig. 7.6). WUEg varied from 2.3 to 14.9 kg ha-1
mm-1, being consistent with the range of values reported in the literature for cereal

178 Capítulo 7
0
20
40 0
20
19
99
-20
00 C
CC
CC
C
20
01
-20
02
20
00
-20
01
CT
RT
NT
CF
CF
CF
WU
Eb
W
UE
gW
UE
b
WU
Eg
WU
Eb
W
UE
g
Kg ha mm-1-1
Fig
ure
7.6.
Wat
er u
se e
ffic
ienc
y fo
r ab
ove-
grou
nd b
iom
ass
(WU
Eb)
mat
ter
(DM
) an
d gr
ain
(WU
Eg)
of
barl
ey a
s af
fect
ed b
y til
lage
(C
T, c
onve
ntio
nal
tilla
ge;
RT
, red
uced
till
age;
and
NT
, no
-til
lage
) un
der
crop
ping
sys
tem
(C
C,
cont
inuo
us c
ropp
ing;
CF,
cro
p-fa
llow
rot
atio
n) i
n th
e 19
99-2
000,
200
0-20
01 a
nd 2
001-
2002
gro
win
g se
ason
s. V
ertic
al b
ars
indi
cate
LSD
(P
< 0
.05)
.
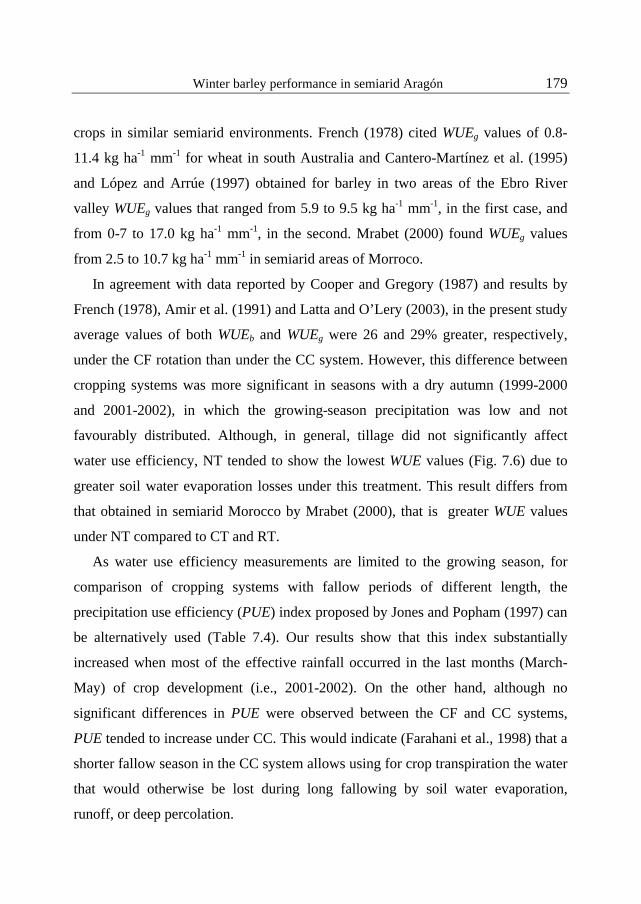
Winter barley performance in semiarid Aragón 179
crops in similar semiarid environments. French (1978) cited WUEg values of 0.8-
11.4 kg ha-1 mm-1 for wheat in south Australia and Cantero-Martínez et al. (1995)
and López and Arrúe (1997) obtained for barley in two areas of the Ebro River
valley WUEg values that ranged from 5.9 to 9.5 kg ha-1 mm-1, in the first case, and
from 0-7 to 17.0 kg ha-1 mm-1, in the second. Mrabet (2000) found WUEg values
from 2.5 to 10.7 kg ha-1 mm-1 in semiarid areas of Morroco.
In agreement with data reported by Cooper and Gregory (1987) and results by
French (1978), Amir et al. (1991) and Latta and O’Lery (2003), in the present study
average values of both WUEb and WUEg were 26 and 29% greater, respectively,
under the CF rotation than under the CC system. However, this difference between
cropping systems was more significant in seasons with a dry autumn (1999-2000
and 2001-2002), in which the growing-season precipitation was low and not
favourably distributed. Although, in general, tillage did not significantly affect
water use efficiency, NT tended to show the lowest WUE values (Fig. 7.6) due to
greater soil water evaporation losses under this treatment. This result differs from
that obtained in semiarid Morocco by Mrabet (2000), that is greater WUE values
under NT compared to CT and RT.
As water use efficiency measurements are limited to the growing season, for
comparison of cropping systems with fallow periods of different length, the
precipitation use efficiency (PUE) index proposed by Jones and Popham (1997) can
be alternatively used (Table 7.4). Our results show that this index substantially
increased when most of the effective rainfall occurred in the last months (March-
May) of crop development (i.e., 2001-2002). On the other hand, although no
significant differences in PUE were observed between the CF and CC systems,
PUE tended to increase under CC. This would indicate (Farahani et al., 1998) that a
shorter fallow season in the CC system allows using for crop transpiration the water
that would otherwise be lost during long fallowing by soil water evaporation,
runoff, or deep percolation.

180 Capítulo 7
Table 7.4. Precipitation use efficiency (PUE) of barley (grain yield divided by harvest-to-harvest crop water use) as affected by tillage (CT, conventional tillage; RT, reduced tillage; NT, no-tillage), and cropping system (CC, continuous cropping; CF, cereal-fallow rotation) in the 1999-2000, 2000-2001 and 2001-2002 growing seasons.
Growing season
Cropping system
Tillage treatment
Rainfall† (mm)
ET‡ (mm)
PUE (kg ha-1 mm-1)
1999-2000 CC1 CT 335 335 2.6 RT 360 1.3 NT 316 2.0 LSD§ 0.9
CF3 CT 620 619 2.3 RT 611 2.6 NT 611 1.4 LSD NS
2000-2001 CC1 CT 386 383 3.7 RT 378 3.1 NT 415 2.2 LSD NS
CF2 CT 721 723 2.0 RT 718 1.9 NT 716 1.7 LSD NS
2001-2002 CC1 CT 320 304 8.5 RT 321 5.6 NT 290 5.1 LSD NS
CF3 CT 706 708 4.4 RT 720 3.8 NT 715 4.5 LSD NS
† Harvest to harvest precipitation ‡ Harvest to harvest crop water use § Least significant difference (P<0.05). NS, not significant.

Winter barley performance in semiarid Aragón 181
Finally, the relationship between precipitation fallow storage efficiency (PSE) of
the CF rotation and crop yield was established for the three experimental years (Fig.
7.7). The lack of correlation between PSE and yield would indicate that under CF
grain yield is mainly related to the amount of effective rainfall during the last
months of crop development (March-May), rather than to the gain in soil water
storage at sowing after a long 16-18 month period of fallow.
PSE (%)
0 5 10 15 20
Gra
in y
ield
(kg
ha-1
)
0
1000
2000
3000
4000
y = -38.1x + 2293.7
R2
= 0.06
1999-00
2001-02
2000-01
CTRT
NT
Figure 7.7. Barley yield for the crop-fallow rotation in the 1999-2000, 2000-2001 and 2001-2002 growing seasons versus precipitation storage efficiency (PSE) (CT, conventional tillage; RT, reduced tillage; and NT, no-tillage).
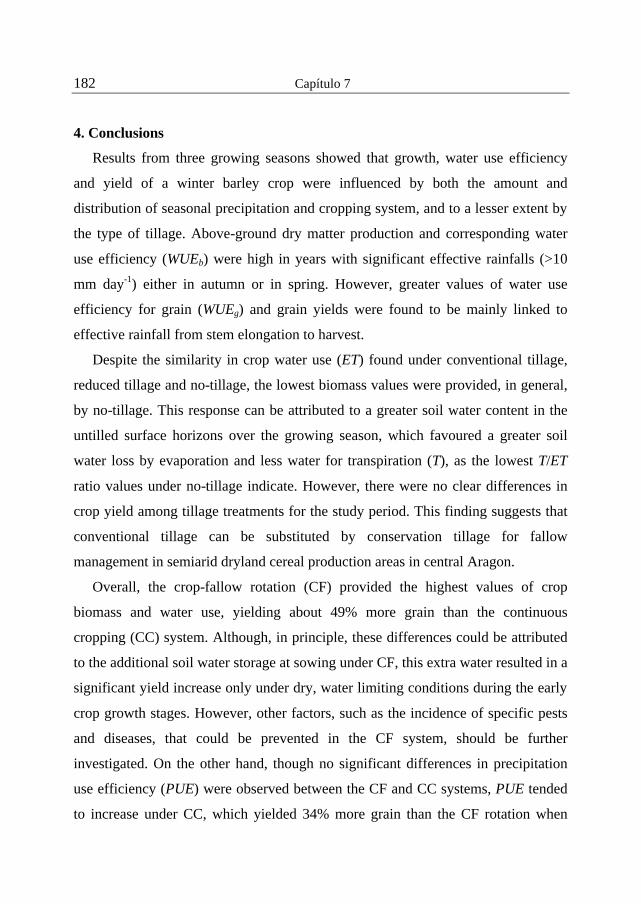
182 Capítulo 7
4. Conclusions
Results from three growing seasons showed that growth, water use efficiency
and yield of a winter barley crop were influenced by both the amount and
distribution of seasonal precipitation and cropping system, and to a lesser extent by
the type of tillage. Above-ground dry matter production and corresponding water
use efficiency (WUEb) were high in years with significant effective rainfalls (>10
mm day-1) either in autumn or in spring. However, greater values of water use
efficiency for grain (WUEg) and grain yields were found to be mainly linked to
effective rainfall from stem elongation to harvest.
Despite the similarity in crop water use (ET) found under conventional tillage,
reduced tillage and no-tillage, the lowest biomass values were provided, in general,
by no-tillage. This response can be attributed to a greater soil water content in the
untilled surface horizons over the growing season, which favoured a greater soil
water loss by evaporation and less water for transpiration (T), as the lowest T/ET
ratio values under no-tillage indicate. However, there were no clear differences in
crop yield among tillage treatments for the study period. This finding suggests that
conventional tillage can be substituted by conservation tillage for fallow
management in semiarid dryland cereal production areas in central Aragon.
Overall, the crop-fallow rotation (CF) provided the highest values of crop
biomass and water use, yielding about 49% more grain than the continuous
cropping (CC) system. Although, in principle, these differences could be attributed
to the additional soil water storage at sowing under CF, this extra water resulted in a
significant yield increase only under dry, water limiting conditions during the early
crop growth stages. However, other factors, such as the incidence of specific pests
and diseases, that could be prevented in the CF system, should be further
investigated. On the other hand, though no significant differences in precipitation
use efficiency (PUE) were observed between the CF and CC systems, PUE tended
to increase under CC, which yielded 34% more grain than the CF rotation when

Winter barley performance in semiarid Aragón 183
yields are adjusted to an annual basis. Results also showed that crop yields under
CF were not dependent on the soil water stored at sowing after a long 16-18 month
period of fallow. Further research on alternative crop rotations and cropping
intensification to improve the efficient use of precipitation is needed to the
sustainability of dryland agriculture in central Aragon.
References
Aase, J.K., Pikul, J.L., 2000. Water use in a modified summer fallow system on semiarid
northern Great Plains. Agric. Water Manag. 43, 345-357.
Angás, P., 2001. Análisis de la influencia de las técnicas de laboreo y fertilización
nitrogenada sobre la dinámica del agua y el nitrógeno del suelo en el cultivo de cebada
(Hordeum vulgare L.) en las zonas áridas y semiáridas del Valle del Ebro. Agronomía
y modelización. Tesis Doctoral, ETSEA, Universidad de Lleida.
Amir, J., Krikun, J., Orion,D., Putter, J., Klitman, S., 1991. Wheat production in an arid
environment. 1. Water-use efficiency, as affected by management practices. Field Crop
Res. 27, 351-364.0
Austin, R.B., Playán, E., Gimeno, J., 1998a. Water storage in soils during the fallow:
prediction of the effects of rainfall pattern and soil conditions in the Ebro valley of
Spain. Agric Water Manag. 8, 239-248.
Austin, R.B., Cantero-Martínez, C., Arrúe, J.L., Playán, E., Cano-Marcellán, P., 1998b.
Yield-rainfall relationships in cereal cropping systems in the Ebro river valley of
Spain. Eur. J. Agron. 8, 239-248.
Bonfil, D.J., Mufradi, I., Klitman, S., Asido, S., 1999. Wheat grain yield and soil profile
water distribution in a no-till arid environment. Agron. J. 91, 368-373.
Cantero-Martínez, C., Villar, J.M., Romagosa, I., Fereres, E., 1995. Growth and yield
responses of two contrasting barley cultivars in a Mediterranean environment. Eur. J.
Agron. 4, 317-326.
Carr, P.M., Martin, G.B., Poland, W.W., 2001. Yield and quality of hard red spring wheat
cultivars following fallow and wheat. Can. J. Plant Sci. 81, 399-404.
Chan, K.Y., Heenan, D.P., 1996. Effect of tillage and stubble management on soil water

184 Capítulo 7
storage, crop growth and yield in a wheat-lupin rotation in southern NSW. Aust. J.
Agric. Res. 47, 479-488.
Cooper, P.J.M., Gregory, P.J., 1987. Soil water management in the rain-fed farming systems
of the Mediterranean region. Soil Use Manag. 3, 57-62.
Dalton, F.N., 1992. Development of time-domain reflectometry for measuring soil water
content and bulk soil electrical conductivity. In: Topp, G.C., Reynolds, W.D., Green,
R.E. (Eds.), Green advances in measurement of soil physical properties: bringing
theory into practice. Special Publication No. 30, SSSA, Madison, WI, pp. 143-167.
Day, W., Lawlor, D.W., Day, A.T., 1987. The effect of drought on barley yield and water
use in two contrasting years. Irrig. Sci. 8, 115-130.
Díaz-Ambrona, C.H., Mínguez, M.I., 2001. Cereal-legume rotation in a Mediterranean
environment: biomass and yield production. Field Crop Res. 70, 139-151.
Farahani, H.J., Peterson, G.A., Westfall, D.G., Sherrod, L.A., Ahuja, L.R., 1998. Soil water
storage in dryland cropping systems: The significance of cropping intensification. Soil
Sci. Soc. A. J. 62, 984-991.
French, R.J., 1978. The effect of fallowing on yield of wheat. II. The effect on grain yield.
Aust. J. Agric. Res. 29, 669-684.
French, R.J., Schultz, J.E., 1984. Water use efficiency of wheat in a mediterranean-type
envitonment. I. The relation between yield, water use and climate. Aust. J. Agric. Res.
35, 743-764.
Hamblin, A.P., Tennant, D., Cochrane, H., 1982. Tillage and the growth of a wheat crop in a
loamy sand. Aust. J. Agric. Res. 33, 887-897.
Incerti, M., Sale, P.W.G., Oleary, G.J., 1993. Cropping practices in the Victorian Mallee. 2.
Effect of long fallows on the water economy and the yield of wheat. Aust. J. Exp.
Agric. 33, 885-894.
Johnston, A.M., Larney, F.J., Lindwall, C.W., 1995. Spring wheat and barley response to
long-term fallow management. J. Prod. Agric. 8, 264-268.
Jones, O.R., Popham, T.W., 1997. Cropping and tillage systems for dryland grain
production in the southern high plains. Soil Sci. Soc. A. J. 89, 222-232.
Lampurlanés, J., Angás, P., Cantero-Martínez, C., 2002. Tillage effects on water storage
during fallow, and on barley root growth and yield in two contrasting soils of the semi-

Winter barley performance in semiarid Aragón 185
arid Segarra region in Spain. Soil Tillage Res. 65, 207-220.
Latta, J., O’Leary, G.J. 2003. Long-term comparison of rotation and fallow tillage systems
of wheat in Australia. Field Crop Res. 83, 176-190.
Lawrence, P.A., Radford, B.J., Thomas, G.A., Sinclair, D.P., Key, A.J., 1994. Effect of
tillage practices on wheat performance in a semi-arid environment. Soil Tillage Res.
28, 347-364.
López, M.V., Arrúe, J.L., 1995. Efficiency of an incomplete block design based on
geostatistics for tillage experiments. Soil Sci. Soc. A. J. 59, 1104-1111.
López, M.V., Arrúe, J.L., 1997. Growth, yield and water use efficiency of winter barley in
response to conservation tillage in a semi-arid region of Spain. Soil Tillage Res. 44,
35-54.
López, M.V., Arrúe, J.L., Sánchez-Girón, V., 1996. A comparison between seasonal
changes in soil water storage and penetration resistance under conventional and
conservation tillage systems in Aragón. Soil Tillage Res. 37, 251-271.
López, M.V., Gracia, R., Arrúe, J.L., 2001. An evaluation of wind erosion hazard in fallow
lands of semiarid Aragon (NE Spain). J. Soil Water Conserv. 56, 212-219.
López-Bellido, L., López-Bellido, R.J., Castillo, J.E., López-Bellido, F.J., 2000. Effects of
tillage, crop rotation, and nitrogen fertilisation on wheat under rainfed Mediterranean
conditions. Agron. J. 92, 1054-1063.
McAneney, K.J., Arrúe, J.L., 1993. A wheat-fallow rotation in northeastern Spain: water
balance-yield considerations. Agronomie 13, 481-490.
Miyamoto, T., Kobayashi, R., Annaka, T., Chikushi, J., 2001. Applicability of multiple
lengths TDR probes to measure water distribution in an Andisol under different tillage
system in Japan. Soil Tillage Res., 60: 91-99.
Mrabet, R., 2000. Differential response of wheat to tillage management systems in a
semiarid area of Morocco. Field Crops Res. 66, 165-174.
Or, D., Fisher, B., Hubscher, R.A., Wraith, J., 1998. WinTDR 98 V.4.0 –Users Guide-.
Department of Plants, Soil & Biometeorology, Utah State University, Logan, UT.
Schillinger, W.F., 2001. Minimum and delayed conservation tillage for wheat-fallow
farming. Soil Sci. Soc. A. J. 65, 1203-1209.
Singh, B., Chanasyk, D.S., McGill, W.B., 1998. Soil water regime under barley with long-
186 Capítulo 7
term tillage-residue systems. Soil Tillage Res. 45, 59-74.
Smika,D.E., 1970. Summer fallow dryland winter wheat in the semiarid Great Plains.
Agron. J. 62, 15-17.
Soil Survey Staff, 1975. Soil taxonomy: a basic system of soil classification for making and
interpreting soil surveys. USDA-SCS Agric. Handbook 436. US Gov. Print. Office,
Washington, D.C.
Tanner, C.B., Sincalir, T.R., 1983. Efficient water use in crop production: Research or re-
search?. In: Taylor, H.M., Jordan, W.R., Sinclair, T.R. (Eds.), Limitations to Efficient
Water Use in Crop Production. ASA, Madison, WI, pp. 1-27.
Topp, G.C., Davis, J.L., Annan, A.P., 1980. Electromagnetic determination of soil water
content: measurement in coaxial transmission lines. Water Resour. Res. 16, 574-582.
Unger, P.W., 1994. Tillage effects on dryland wheat and sorghum production in the
southern Great Plains. Agron. J. 86, 310-314.
Zadoks, J.C., Chang, T.T., Konzak, C.F., 1974. A decimal code for the growth stages of
cereals. Weed Res. 14, 415-421.

Capítulo 8
Conclusiones generales


189
Conclusiones generales
Avances metodológicos en la medida de las propiedades hidráulicas del
suelo
1. El sistema desarrollado para la medida del nivel de agua en la columna de
Mariotte de alimentación de un infiltrómetro de disco, utilizando la técnica de
Reflectometría de Dominio Temporal (TDR), ha permitido:
i) automatizar las lecturas del flujo de infiltración facilitando, con ello, un
mejor registro de datos y eliminando los errores asociados al
procedimiento habitual de lectura manual;
ii) efectuar medidas simultáneas de infiltración y contenido de humedad del
suelo utilizando una misma técnica; y
iii) realizar determinaciones simultáneas de infiltración en varios puntos de
observación utilizando un sistema de mutliplexión.
2. El nuevo diseño de infiltrómetro de disco propuesto, con el depósito de
Mariotte alimentador de agua independiente del disco, supone un avance
metodológico con respecto a diseños similares ya que:
i) reduce sensiblemente el peso del infiltrómetro sobre la superficie de
infiltración; y
ii) permite fijar una tensión de infiltración constante con independencia de la
posición del disco con respecto al depósito de Mariotte de alimentación.
3. La aplicación de la técnica de infiltrometría de discos en suelos muy sueltos
(i.e. suelos recientemente labrados) ha permitido demostrar que el peso del

190 Capítulo 8
infiltrómetro colapsa la débil estructura del suelo en condiciones próximas a
saturación, afectando directamente a las medidas de infiltración. En estos casos,
ni la reducción del peso del infiltrómetro, ni su completa eliminación con la
ayuda de soportes han dado resultados satisfactorios. En conclusión, la
infiltrometría de discos no es una técnica adecuada para la caracterización de la
conductividad hidráulica en suelos recientemente labrados, ya que subestima el
flujo de infiltración en condiciones próximas a saturación.
4. El índice de poros propuesto para caracterizar la fracción de poros de transporte
de agua (número de poros efectivos y porosidad efectiva) a partir del tamaño de
poro representativo para dos tensiones consecutivas elimina la inconsistencia
asociada a la aplicación de la teoría de ascenso capilar para estimar el número
de poros transmisores de agua. Los resultados demuestran, tras verificar la
solidez de este nuevo índice, que el método del ascenso capilar subestima el
radio de los macroporos y sobrestima de número de poros y la porosidad
efectiva de los macro- y mesoporos del suelo.
Sistema de laboreo y propiedades hidrofísicas del suelo durante el periodo
barbecho
5. Tras 8-10 años de comparación de sistemas de laboreo, el horizonte superficial
del suelo (0-10 cm) bajo el sistema de siembra directa o no-laboreo (NT)
presenta, en comparación con los sistemas de laboreo convencional (CT) y
laboreo reducido (RT): i) una mayor densidad aparente; ii) curvas
características de retención de agua con menor contenido de humedad a
saturación y de agua disponible para las plantas y un mayor contenido de
humedad a capacidad de campo (-10 kPa) y punto de marchitez permanente (-
1500 kPa); y (iii) macroporos de mayor diámetro pero una menor

Conclusiones generales 191
conductividad hidráulica a tensiones próximas a saturación debido un menor
número de macroporos y mesoporos. No se observaron diferencias
significativas en propiedades hidrofísicas entre CT y RT.
6. Las labores primarias aplicadas en CT y RT: i) reducen la densidad aparente
del horizonte superficial del suelo; ii) incrementan la humedad a saturación y
la fracción de poros de aireación y reducen el agua disponible para las plantas;
y iii) reducen el tamaño de poro representativo y aumentan significativamente
el número de poros para el rango de tensiones entre –4 y –14 cm, lo que se
traduce en un aumento significativo en la conductividad hidráulica del suelo.
7. Las lluvias registradas tras las labores primarias en CT y RT reestructuran el
suelo: i) incrementando la densidad aparente en superficie; ii) reduciendo la
humedad a saturación y la porosidad de aireación; y iii) aumentando el tamaño
de poro representativo pero disminuyendo el número de poros para el rango de
tensiones comprendidas entre –4 y –14 cm, lo que lleva a una reducción de la
conductividad hidráulica del suelo para ese rango de tensiones. Estos cambios
son más pronunciados cuanto más intensas son las lluvias registradas tras las
labores.
8. A diferencia del suelo bajo NT, que presenta valores similares de propiedades
hidrofísicas en la superficie y a 40 cm de profundidad, el suelo bajo CT y RT
muestra un horizonte profundo más compacto, con menor porosidad de
aireación, menor contenido de humedad a saturación y menor conductividad
hidráulica.

192 Capítulo 8
9. En general, la distribución del contenido de agua en el perfil del suelo en NT
se caracterizó por presentar un mayor contenido de agua en superficie, frente
al suelo en CT y RT que tiende a acumular más agua en profundidad.
Manejo del suelo y balance de agua durante el periodo de barbecho
10. Las labores primarias aplicadas en CT y RT durante el periodo de barbecho en
la rotación cebada-barbecho favorecen las pérdidas de agua por evaporación a
corto plazo (24 horas después de las labores). El valor medio de estas pérdidas
bajo CT y RT, 14 y 11 mm, respectivamente, fue mayor al observado en NT (1
mm).
11. Las pérdidas medias de agua por evaporación durante las primeras 24 horas
tras las labores secundarias fueron menores (3.9 mm en CT y 3.8 mm en RT)
que las observadas tras las labores primarias. Sin embargo, las labores
secundarias en CT y RT favorecen la conservación del agua a medio plazo al
reducir la tasa de evaporación por debajo de los valores medidos en NT.
12. La eficiencia del barbecho para la acumulación de agua en el suelo (PSE) fue
baja en el periodo experimental (11 %) y claramente influida por el régimen
pluviométrico registrado en los distintos periodos de barbecho. Los mayores
valores de PSE coinciden con aquellos periodos en los que gran parte de la
lluvia se concentra en los dos últimos meses del barbecho.
13. El sistema de laboreo no tuvo efectos significativos sobre la eficiencia en el
almacenamiento de agua al final del barbecho.

Conclusiones generales 193
14. Como promedio, el sistema de cultivo de “año y vez” almacenó al final del
barbecho 22 mm más de agua que el sistema de cultivo continuo. Esto supone
que la eficiencia del barbecho largo (16-18 meses) con respecto al barbecho
corto (5-6 meses) es de tan sólo un 5.2%. Estos resultados cuestionan la
viabilidad del barbecho largo como práctica agronómica para acumular agua
para el cultivo siguiente.
15. La aplicación del modelo SiSPAT para simular el balance de agua durante el
periodo de barbecho resultó altamente satisfactoria. Los resultados muestran
que en ausencia de labores la evaporación acumulada al final del barbecho es
mayor bajo NT que bajo CT y RT, tratamientos que favorecen el drenaje
profundo.
16. La simulación también ha evidenciado que los valores más altos de PSE y de
drenaje profundo coinciden con aquellos periodos en los que las lluvias se
concentran principalmente en la primera fase del barbecho, con baja demanda
evaporativa. Por el contrario, los periodos de barbecho con una primavera muy
lluviosa presentan un valor de PSE inferior.
17. Tras comparar la PSE medida en campo con la estimada por el modelo
SiSPAT, en el supuesto de ausencia de alteración del suelo, se ha observado
cómo en años con una primera fase de barbecho muy lluviosa las labores
favorecen la evaporación del agua del suelo, reduciendo la PSE.
Manejo del barbecho y rendimiento del cultivo de cebada
18. La producción de biomasa y su correspondiente eficiencia en el uso de agua
incrementaron en años en los que las lluvias fueron abundantes tanto en otoño
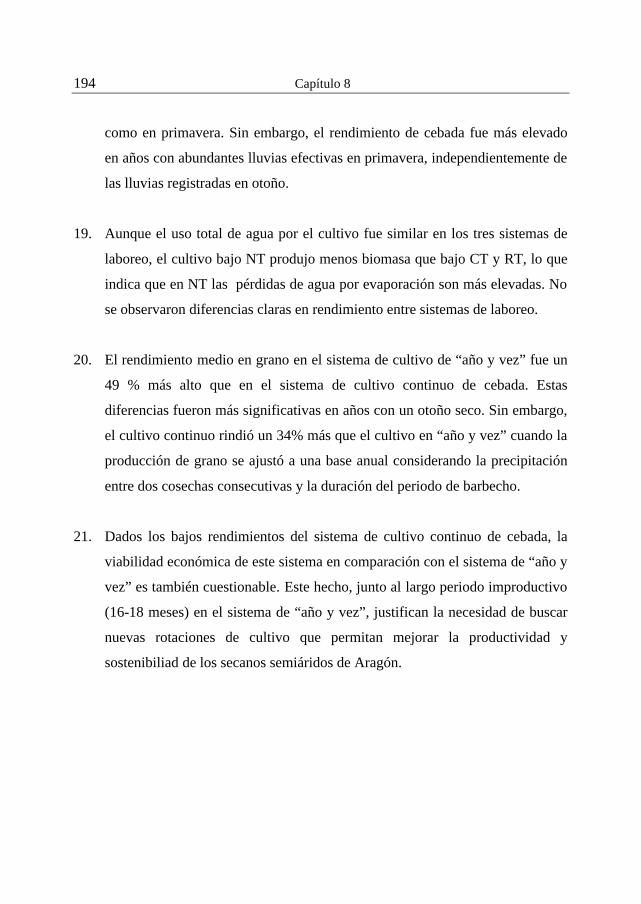
194 Capítulo 8
como en primavera. Sin embargo, el rendimiento de cebada fue más elevado
en años con abundantes lluvias efectivas en primavera, independientemente de
las lluvias registradas en otoño.
19. Aunque el uso total de agua por el cultivo fue similar en los tres sistemas de
laboreo, el cultivo bajo NT produjo menos biomasa que bajo CT y RT, lo que
indica que en NT las pérdidas de agua por evaporación son más elevadas. No
se observaron diferencias claras en rendimiento entre sistemas de laboreo.
20. El rendimiento medio en grano en el sistema de cultivo de “año y vez” fue un
49 % más alto que en el sistema de cultivo continuo de cebada. Estas
diferencias fueron más significativas en años con un otoño seco. Sin embargo,
el cultivo continuo rindió un 34% más que el cultivo en “año y vez” cuando la
producción de grano se ajustó a una base anual considerando la precipitación
entre dos cosechas consecutivas y la duración del periodo de barbecho.
21. Dados los bajos rendimientos del sistema de cultivo continuo de cebada, la
viabilidad económica de este sistema en comparación con el sistema de “año y
vez” es también cuestionable. Este hecho, junto al largo periodo improductivo
(16-18 meses) en el sistema de “año y vez”, justifican la necesidad de buscar
nuevas rotaciones de cultivo que permitan mejorar la productividad y
sostenibiliad de los secanos semiáridos de Aragón.
Recommended