8/8/2019 Investor Presentation July10
http://slidepdf.com/reader/full/investor-presentation-july10 1/36

8/8/2019 Investor Presentation July10
http://slidepdf.com/reader/full/investor-presentation-july10 2/36
8/8/2019 Investor Presentation July10
http://slidepdf.com/reader/full/investor-presentation-july10 3/36

8/8/2019 Investor Presentation July10
http://slidepdf.com/reader/full/investor-presentation-july10 4/36
8/8/2019 Investor Presentation July10
http://slidepdf.com/reader/full/investor-presentation-july10 5/36

8/8/2019 Investor Presentation July10
http://slidepdf.com/reader/full/investor-presentation-july10 6/36

8/8/2019 Investor Presentation July10
http://slidepdf.com/reader/full/investor-presentation-july10 7/36
7
Mobile Services Telemedia Services Enterprise Services
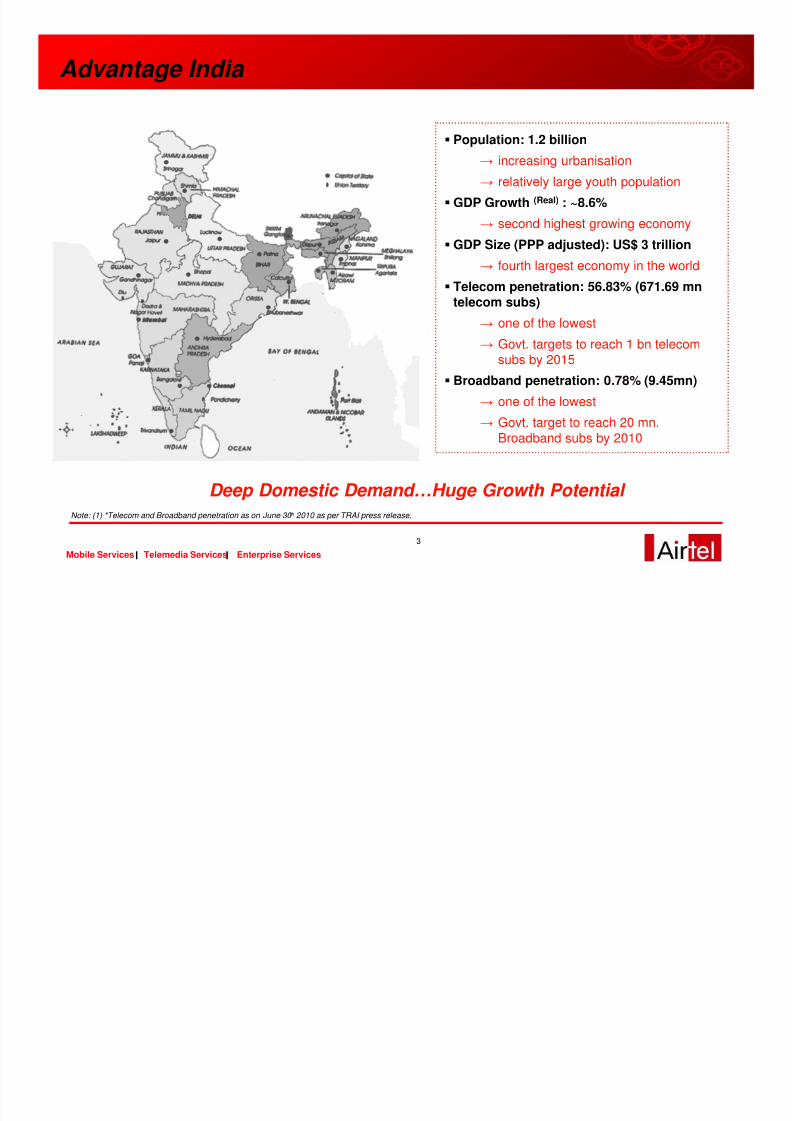
Segment contribution…Rev, EBITDA and Investment
REVENUE
82%8%
21%9% 2%
Mobile Services Telemedia ServicesEnterprise Services Passive Infrastructure Services
Others
EBITDA
63%
10%26%
12% -8%
Mobile Services Telemedia ServicesEnterprise Services Passive Infrastructure ServicesOthers
Note: (1) Revenue and EBITDA is gross of inter segment eliminations.
INVESTMENTS
51%
11%14%
22%3%
Mobile Services Telemedia ServicesEnterprise Services Passive Infrastructure ServicesOthers

8/8/2019 Investor Presentation July10
http://slidepdf.com/reader/full/investor-presentation-july10 8/36
8
Mobile Services Telemedia Services Enterprise Services
Performance dashboard - 3 line graph
Productivity Indicators = growing revenues + cost efficiencies + capital productivity
98,245 99,416 98,455 97,722100,557
34%37% 37% 38% 40%
70% 68% 64% 62% 61%
10%
20%
30%
40%
50%
60%
70%
80%
80,000
85,000
90,000
95,000
100,000
105,000
110,000
Q 4 F Y 0 9
Q 1 F Y 1 0
Q 2 F Y 1 0
Q 3 F Y 1 0
Q 4 F Y 1 0
A m o u
n t i n R s
. M n
Gross Revenue (Rs mn) LHS Opex to Gross Rev (RHS) Capital Productivity (RHS)

8/8/2019 Investor Presentation July10
http://slidepdf.com/reader/full/investor-presentation-july10 9/36
9
Mobile Services Telemedia Services Enterprise Services
Wireless Services

8/8/2019 Investor Presentation July10
http://slidepdf.com/reader/full/investor-presentation-july10 10/36
10
Mobile Services Telemedia Services Enterprise Services
Sub Base : 635.51 mn → second largest market
Wireless Penetration: 53.77% → lowest in the world
HHI Index: very high → one of the most competitive market
Prepaid Base: 96% → one of the highest in the world
Usage per sub per month:
Minutes: 381→ one of the highest
ARPU: ~ US$ 4.08 → one of the lowest
Rate per minute: ~ US$ 0.01→ one of the lowest in the world
VAS: ~ 11.8% → One of the lowest
Indian Wireless Market…KPIs
MUM
HP
DELHI
AP
CHN
MADHYA PRADESH`
TNKER
PB
DEL
UP(W)
MP
RAJUP(E)
KK
OR
HAR
JK
BH
WBGUJ
MAH
AS
NE
Metros
A Cat.
B Cat.
C Cat.
MUM
HP
DELHI
AP
CHN
MADHYA PRADESH`
TNKER
PB
DEL
UP(W)
MP
RAJUP(E)
KK
OR
HAR
JK
BH
WBGUJ
MAH
AS
NE
Metros
A Cat.
B Cat.
C Cat.
MUM
HP
DELHI
AP
CHN
MADHYA PRADESH`
TNKER
PB
DEL
UP(W)
MP
RAJUP(E)
KK
OR
HAR
JK
BH
WBGUJ
MAH
AS
NE
Metros
A Cat.
B Cat.
C Cat.
Metros
A Cat.
B Cat.
C Cat.
Kol
Note: (1) Subscriber numbers and wireless penetration numbers as on June 30, 2010 are as per TRAI release (2) Other indicators on the slide are based on Global Wireless Matrix 2Q10 dated 9 th July 10 by Merrill Lynch, and reflective of Industry numbers.

8/8/2019 Investor Presentation July10
http://slidepdf.com/reader/full/investor-presentation-july10 11/36
11
Mobile Services Telemedia Services Enterprise Services
Net Adds in Jun 18.0 Mn…greater than over last 2 months average run rate of 16.6 Mn S-curve triggered
Rapidly Growing Wireless Market
Note: (1) Actual Data as per Industry Association Releases and Industry Estimates.
Fastest Growing Market in the World
0%
10%
20%
30%
40%
50%
60%
70%
80%
90%
1999 2001 2003 2005 2007 2009 2011 2013 2015 2017 2019
-
100
200300
400
500
600
700800
-2468
10121416182022
Series2 Series1

8/8/2019 Investor Presentation July10
http://slidepdf.com/reader/full/investor-presentation-july10 12/36
12
Mobile Services Telemedia Services Enterprise Services
Wireless Market Structure
• Airtel continuously consolidating its market leadership position despite intense competition
• Airtel current monthly net adds at 3.04 million vs. 2.86 million a year ago• Airtel ranks 1& 2 in 17 circles in terms of number of subscribers• Over 59% of net adds coming from B&C circles (rural India)
Airtel Continues to lead on Revenue Market Share
Subscriber Trends Customer Market Share – CMS (%)
110.81 109.06
77.9168.89 72.53
59.69
34.25 31.19 32.6118.94 26.12
35.42 29.69
136.62
-
20.00
40.00
60.00
80.00
100.00
120.00
140.00
160.00
A i r t e l
R e l i a n c e
V o d a f o n e
B S N L +
M T N L
I d e a
T a t a
O t h e r s
( m n )
Jun-10 Jun-09 Net adds during the year
21.5%
17.4%
12.3%11.4%
9.4%
10.8%
17.2%
24.0%
18.6%17.9%
13.8%
10.0%8.7%
7.0%
5.0%
7.0%
9.0%
11.0%
13.0%
15.0%
17.0%
19.0%
21.0%
23.0%
25.0%
A i r t e l
R e l i a n c e
V o d a f o n e
B S N L +
M T N L
I d e a
T a t a
O t h e
r s
CMS(Jun'10) CMS(Jun'09)

8/8/2019 Investor Presentation July10
http://slidepdf.com/reader/full/investor-presentation-july10 13/36
13
Mobile Services Telemedia Services Enterprise Services
Company Highlights on Wireless Services

8/8/2019 Investor Presentation July10
http://slidepdf.com/reader/full/investor-presentation-july10 14/36
14
Mobile Services Telemedia Services Enterprise Services14
Hello Tunes(Ring Back
Tones)
Portfolio Manager(Stock Tracker)
Blackberry
Airtel Live (Portal)
First mover advantage / Product innovations
Life time validity product
ElectronicRecharge /
MicroPrepaid
focus on product innovations
Easy Music
Song Catcher
Call Home Service
Money Transfers
Music on Demand
Googlesearch
M Commerce
iPhone

8/8/2019 Investor Presentation July10
http://slidepdf.com/reader/full/investor-presentation-july10 15/36
15
Mobile Services Telemedia Services Enterprise Services
Performance Indicators - Financial
EBITDA (INR mn) & Margin (%) Revenues (INR mn)
23,969
21,218
24,178
25,860
27,183
22,009
24,963
25,860
20,000
21,000
22,000
23,000
24,000
25,000
26,000
27,000
28,000
Q109 Q209 Q309 Q409 Q110 Q210 Q310 Q410
30.7 30.2 31.4 31.5 33.0 31.9 30.4 29.2
81,97579,618
64,201
69,150 72,843
79,39282,216 82,285
80,994
50,000
55,000
60,000
65,000
70,000
75,000
80,000
85,000
Q408 Q109 Q209 Q309 Q409 Q110 Q210 Q310 Q410

8/8/2019 Investor Presentation July10
http://slidepdf.com/reader/full/investor-presentation-july10 16/36
16
Mobile Services Telemedia Services Enterprise Services
Performance Indicators - Operational
95.8%95.3%95.2%94.7%94.2%93.5%92.9%92.3%
91.6%91.0%
97.5%100 .4%
101.1%
100 .8%99.6%
98.4%95.4%96.3%
97.9%
101.70%
85%
90 %
95%
100 %
105%
Q308 Q408 Q109 Q209 Q309 Q409 Q110 Q210 Q310 Q410
Prepaid Subs Prepaid Net Adds
Customers & Market Share Prepaid/Postpaid
MoU/Sub/Month & MON ARPU & RPM
474 505507 534 526 485 478 450 446 468
123,626
115,834
105,21789,058
73,840
130,669140,713
143,680153,241
172,797
370
40 0
43 0
46 0
49 0
520
550
Q3 08 Q4 08 Q109 Q20 9 Q30 9 Q4 09 Q110 Q2 10 Q310 Q4 100
40,000
80,000
120,000
160,000
200,000
MoU/Sub (Min) Total minutes on Netw ork (Mn Min)
127.6118.969.462.0 77.5 85.7 93.9 102.4 110.5
24.0%
24.2%23.7%
23.4%
24.6%24.7%
24.0%
22.6%
21.80%
40.0
50.0
60.0
70.0
80.0
90.0
100.0
110.0
120.0
130.0
140.0
Q408 Q109 Q209 Q309 Q409 Q110 Q210 Q310 Q41020.0%
21.0%
22.0%
23.0%
24.0%
25.0%
26.0%
27.0%
28.0%
Customers (Mn) CMS (%)
0.63 0 .580.630.64 0.560.650.700.76 0.52 0.47
3 58 3 573 50
331 324
30 5
278
252
23 0
22 0
-
0.25
0.50
0.75
1.0 0
1.2 5
1.50
Q308 Q408 Q109 Q209 Q309 Q409 Q110 Q210 Q310 Q41020 0
23 0
26 0
29 0
32 0
350
38 0
RPM (Rs.) ARPU (INR)

8/8/2019 Investor Presentation July10
http://slidepdf.com/reader/full/investor-presentation-july10 17/36
17
Mobile Services Telemedia Services Enterprise Services
Current positioning and way forward…
Brand
Distribution
Churn lower than industry
Spectrum Mix (900/1800 MHz)
Improving cost efficiencies
Lowest cost GSM network
Revenue size ($ 9 Bn)
Revenue MarketShare
Increasing the usage through U&R drive
Wallet share
Driven by rural strategy
Changing face ofgrowth through M-Com,M-entertainment & 3G
Leadership Positioning Growth strategy and plans
Revenue
Non financial vitals
Cost
New Revenue Streams
Net Adds
Maximizing usage

8/8/2019 Investor Presentation July10
http://slidepdf.com/reader/full/investor-presentation-july10 18/36
18
Mobile Services Telemedia Services Enterprise Services
Telemedia Services

8/8/2019 Investor Presentation July10
http://slidepdf.com/reader/full/investor-presentation-july10 19/36
19
Mobile Services Telemedia Services Enterprise Services
A snapshot
Largest private operator having presence in the voice , broadband , IPTV and data.
Focus on SMB segment & Broadband at Homes
Key Performance Indicators
1. Voice (wire-line) and Data (DSL) Presence in 89 top cities of India.
2. Target Segment : Retail and Small and Medium Enterprises.
3. Customer base: 3.15 million (end June2010)
4. Broadband (DSL with speeds>256 kbps) penetration at 43.2% of customer base.
5. Average ARPU for Quarter ended Mar’10 $ 20.8 per month.
6. Segment contributing to 8% of overall revenues of the company.
7. EBITDA margin of over 43.5%.
Broadband revolution to follow wireless revolution in India
SMB opportunity across ICT stream

8/8/2019 Investor Presentation July10
http://slidepdf.com/reader/full/investor-presentation-july10 20/36
20
Mobile Services Telemedia Services Enterprise Services20
Telemedia Services
Business Units SMBs Homes
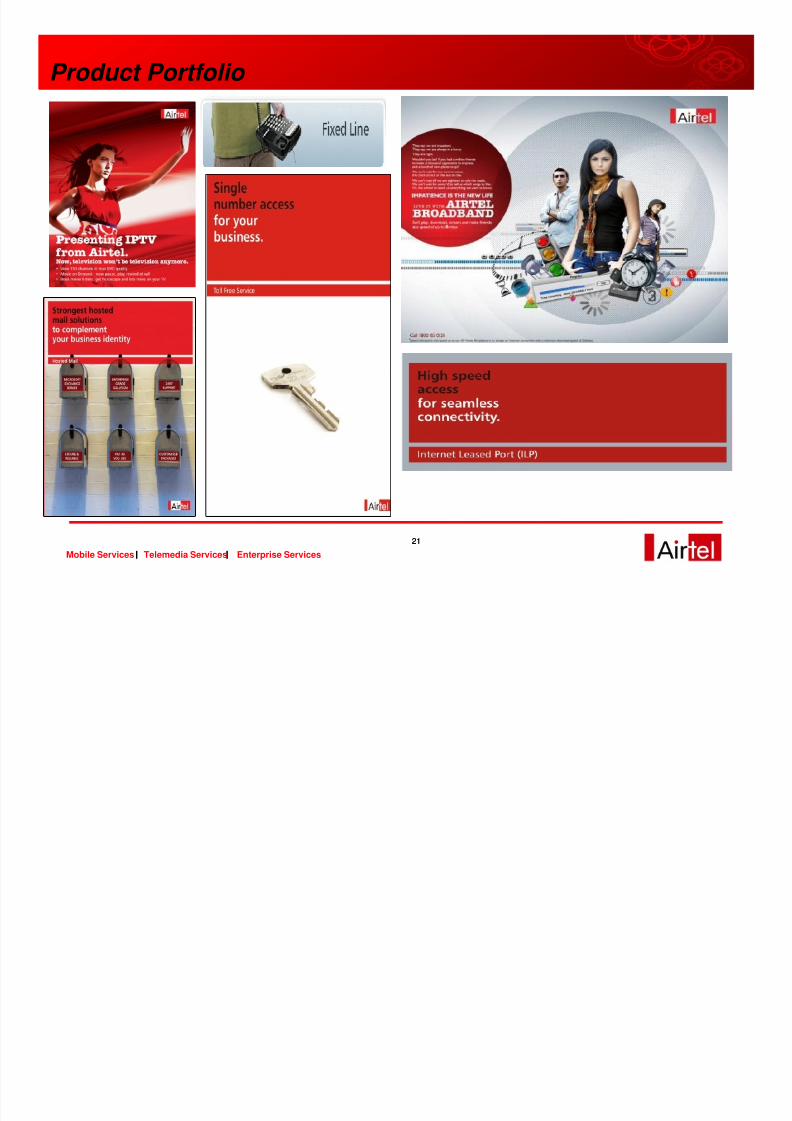
Products
• Voice• Data• Mobile Services• Applications
•SaaS
• Broadband• Voice• IPTV
Goal One-Stop Shop for All Airtel Servicesand Solutions to SMBs
Dominant Broadband & Fixed Voiceshare of the affluent in targeted 95cities
Strategies
• Data Products: Internet, MPLS etc.• Integrated Solutions to drive share of
wallet like hosted e mail, onlinedesktop etc.
• Strategic Alliances• Indirect Channel to Drive Penetration
• Deeper & Not Wider: 95 Cities• Enhancing Broadband experience :
Speed on Demand, Games onDemand & VAS
• Vertical & Not Horizontal: Hi-Rise• Drive Triple Play• Drive Higher spends for better
customer experience
8/8/2019 Investor Presentation July10
http://slidepdf.com/reader/full/investor-presentation-july10 21/36
21
Mobile Services Telemedia Services Enterprise Services21
Product Portfolio

8/8/2019 Investor Presentation July10
http://slidepdf.com/reader/full/investor-presentation-july10 22/36
22Mobile Services Telemedia Services Enterprise Services
Performance Indicators
30672,9892,9282,828
2,3942,509
2,6192,726
2,283 1,2971,2411,1871,1381,072992922853795
1,500
2,000
2,500
3,000
Q40 8 Q109 Q209 Q30 9 Q409 Q110 Q210 Q310 Q4100
500
1,000
1,500
2,000
Fixed Line Customers ('000) DSL Cust. ('000)
1,13 7 1,13 8 1,147
1,027
96 493 7
1,0981,071
98 9
80 0
850
90 0
950
1,000
1,050
1,100
1,150
1,200
Q408 Q109 Q209 Q309 Q409 Q110 Q210 Q310 Q410
3,702
3,344 3,367
3,696
3,5313,614
3,463
3,667
3,944
3,000.0
3,200.0
3,400.0
3,600.0
3,800.0
4,000.0
Q408 Q109 Q209 Q309 Q409 Q110 Q210 Q310 Q410
42.2 43.6 41.7 42.1 40.5 42.9 46.1 43.5
Customers (overall & DSL) ARPU (INR)
Revenues (INR mn) EBITDA (INR Mn) & Margin (%)
7,641
7,988
8,4868,585 8,550 8,544 8,550 8,510
8,458
7,000
7,300
7,600
7,900
8,200
8,500
8,800
9,100
Q4 08 Q10 9 Q2 09 Q3 09 Q4 09 Q110 Q2 10 Q3 10 Q4 10

8/8/2019 Investor Presentation July10
http://slidepdf.com/reader/full/investor-presentation-july10 23/36
23Mobile Services Telemedia Services Enterprise Services
Enterprise Services

8/8/2019 Investor Presentation July10
http://slidepdf.com/reader/full/investor-presentation-july10 24/36
24Mobile Services Telemedia Services Enterprise Services
A snapshot
Enterprise Services provides a broad portfolio of services to large Enterprise and Carrier customers
Corporates: Single point of contact for all telecommunication needs for Top 2500 corporate
customers, providing full suite of voice, data, and managed communications solutions
Carriers: Wholesale voice and data services to over 130 domestic and 450 international telecommunications carriers, as well as ILD and NLD carriage for Airtel’s own customers
Extensive national and international infrastructure
Pan-India network with 126,357 Route kms of optical fiber, over 4,150 MPLS and SDH POPs
Access network (terrestrial) in 89 cities, Wimax network in 143 cities, and over 1,500 local POIs
International network with 225,000 Route Kms, connecting over 50 countries.
Key Performance Indicators (Q4 ‘10)
NLD Minutes Carried: 15.9 Billion ; ILD Minutes Carried: 3.2 Billion Revenue: Rs.20,738 Million (21 % Segment Contribution Share)
EBITDA: Rs. 9,846 Million (47.5% EBITA Margin)
8/8/2019 Investor Presentation July10
http://slidepdf.com/reader/full/investor-presentation-july10 25/36
25Mobile Services Telemedia Services Enterprise Services
Highlights
# 1 Operator in India in terms of:
NLD Revenue (Voice & Data)ILD Revenue (Voice & Data)
Corporate Fixed Line Operator
Corporate Internet Provider
Corporate Mobility Provider
VSAT Provider (installed base)

8/8/2019 Investor Presentation July10
http://slidepdf.com/reader/full/investor-presentation-july10 26/36
26Mobile Services Telemedia Services Enterprise Services
Domestic Network
Fiber commissioned for over 126,357
Kms
Transmission Network (14,000+ SDH nodes)
High resilience via ring structure &
automatic switching
Tier-1 MPLS network (across 120
Cities)
Internet backbone capacity > 60 Gbps
Proactive 24 x 7 x 365 NOC 304 LDCAs & 1680 SDCAs covered

8/8/2019 Investor Presentation July10
http://slidepdf.com/reader/full/investor-presentation-july10 27/36
27Mobile Services Telemedia Services Enterprise Services
International Network 27
Infrastructure NGN with 4 Global Media Gateways
100% Ownership of i2i Cable system and landing station
Ownership of Sea Me We 4 cable and landing station
IRU capacity on TAT-14, Apollo, EAC, APCN2, JUCN, etc.
Trans- Pacific Connectivity Boost through Unity & AAG
Terrestrial connectivity to Nepal, Pakistan and Bhutan
Consortium partner in major cable systems under construction: IMEWE, EIG,AAG, Unity, EASSy
Coverage
TDM and IP Voice traffic termination in 230+ countries
5 Major International PoPs for carrier interconnect at Los Angeles, New York,
London, Hong Kong & Singapore
8 additional PoP’s under development in cl. Colombo, Tokyo, Paris, Bangkok and Kaula Lumpur
Far-East and Middle-East Connect Platform to cater to high growth markets
across Asia and the Pacific
Extensive MPLS Coverage across the globe - more than 70 countries, 700+
PoPs via carrier-grade NNI’s

8/8/2019 Investor Presentation July10
http://slidepdf.com/reader/full/investor-presentation-july10 28/36

8/8/2019 Investor Presentation July10
http://slidepdf.com/reader/full/investor-presentation-july10 29/36
29Mobile Services Telemedia Services Enterprise Services
Performance Indicators – Enterprise Services
Voice Minutes on Network
Revenues (INR mn) EBITDA (INR mn) & Margin (%)
16,340
19,572
21,874 21,808 21,62820,982 21,331
20,546 20,738
14,000
15,000
16,000
17,000
18,00019,000
20,000
21,000
22,000
Q4 08 Q10 9 Q2 09 Q3 09 Q4 09 Q110 Q2 10 Q3 10 Q4 10
8,655
9,369 9,7999,920 10,246
11,023
10,0359,846
4,000.0
5,000.0
6,000.0
7,000.0
8,000.0
9,000.0
10,00 0.0
11,000.0
Q109 Q209 Q309 Q409 Q110 Q210 Q310 Q410
44.2 42.8 44.9 45.9 48.8 51.7 48.8 47.5
10,32 211,349 11,609 11,6 90 11,78 1 12,417
13,94 4
3,100 3173
9,398
15875
3,1812,8692,7722,6032,2842,0481,850
0
2,000
4,000
6,000
8,000
10,00 0
12,00 0
14,00 0
16,00 0
Q4 08 Q10 9 Q2 09 Q3 09 Q4 09 Q110 Q2 10 Q3 10 Q4 10
NLD Minutes (mn) ILD Minutes (mn)

8/8/2019 Investor Presentation July10
http://slidepdf.com/reader/full/investor-presentation-july10 30/36
30Mobile Services Telemedia Services Enterprise Services
Passive Infrastructure Services

8/8/2019 Investor Presentation July10
http://slidepdf.com/reader/full/investor-presentation-july10 31/36
31Mobile Services Telemedia Services Enterprise Services
A snapshot
Bharti Infratel operates in 11 circles.Indus Tower operates in 16 circles.Standard Master Services Agreement with competitive rates already in place.Key focus areas:
To increase sharing factor (tenancy) from current levels of 1.62 for Infratel and 1.71 for Indus.Provide energy optimization solutions and other network management services.Evaluate other revenue streams.To reduce sharing revenue per sharing operator through increased sharing factor and efficiencies
Key performance Indicators (Infratel): Total Towers: 30,568 (nos)Sharing Factor: 1.62 Sharing Revenue per sharing operator per month at Rs. 36,878.EBITDA margin: 47.2%
Key performance Indicators (Indus): Total Towers: 102,938 (nos)Sharing Factor: 1.71
Aim to be the preferred choice of vendor for all existing and new operators

8/8/2019 Investor Presentation July10
http://slidepdf.com/reader/full/investor-presentation-july10 32/36
32Mobile Services Telemedia Services Enterprise Services
36,87838,107
36,69636,420
33,58632,17731,893 31,488
25,000
29,000
33,000
37,000
41,000
45,000
Q109 Q209 Q309 Q409 Q1 10 Q2 10 Q3 10 Q410
Sharing Revenue per Sharing Operato r per month
58,013 59,966
27,548 28,078 29,11229,806
61,355
30,568
1.22 1.261.34
1.34
1.431.49
1.571.62
-
10,000
20,000
30,000
40,000
50,000
60,000
70,000
Q109 Q209 Q309 Q409 Q1 10 Q2 10 Q3 10 Q4101.00
1.10
1.20
1.30
1.40
1.50
1.60
1.70
No of tow ers Sharing Factor
4,5074,269
3,8703,991
4,258
2,903
3,557
4,020
1,000
1,500
2,000
2,500
3,000
3,500
4,000
4,500
5,000
Q109 Q209 Q309 Q409 Q110 Q210 Q310 Q410
36.6 33.3 33.5 40.1 44.4 46.8 46.1 47.2
Performance Indicators - Bharti Infratel
10,563
11,98312,702
7,2418,020
8,5869,267 9,552
5,000
7,000
9,000
11,000
13,000
Q109 Q209 Q309 Q409 Q110 Q210 Q310 Q410
Revenues (INR mn) EBITDA (INR mn) & Margin (%)
Towers (nos) & Sharing Factor Sharing Revenue per Sharing
Operator per Month (Rs)
Note: Figures for revenue, EBITDA and number of towers for quarters ending 4Q09 and beyond have taken the impact of 35,066 towers transferred to Indus

8/8/2019 Investor Presentation July10
http://slidepdf.com/reader/full/investor-presentation-july10 33/36
33Mobile Services Telemedia Services Enterprise Services
Indus Towers
Roof Top Tower
Ground Based TowerFirst of its kind deal…Bharti (42%), Voda (42%) &Idea (16%)
Largest independent tower company in the world
~ 100,000 towers under its management
Benefits from captive tenancy as well as external tenants
Incremental investment in towers to come from new operators / subscriber growth / 3G
102 ,696 102,938
100,728
97,9251.71
1.611.61
1.55
93,000
95,000
97,000
99,000
101,000
103,000
Q110 Q210 Q310 Q4101.40
1.50
1.60
1.70
1.80
1.90
No of towers Sharing Factor

8/8/2019 Investor Presentation July10
http://slidepdf.com/reader/full/investor-presentation-july10 34/36
34Mobile Services Telemedia Services Enterprise Services
Recent Honours

8/8/2019 Investor Presentation July10
http://slidepdf.com/reader/full/investor-presentation-july10 35/36
35Mobile Services Telemedia Services Enterprise Services
Rated as the ‘ Powerful Brand’ in the Economic Times- Brand
Finance ‘Brand Power (the only corporate brand to be awarded the
AAA rating)
Rated as India's Best Enterprise Services
Provider for 2009 at the annual Users’ Choice Awards
instituted by PC Quest.
Bharti Airtel – Leadership in business Recent Honours
Bharti Airtel won tele.net Telecom Operator awards in 6 out of total
14 categories including Most Admired Company, Best National Mobile operator, Best Internet and
Broadband operator, Best Operator
in Rural Market, Best Enterprise Services
Sunil Bharti Mittal , Chairman & Group CEO •Honorary degree of Doctor of Laws by
University of Leeds (UK) in 2009 •T enth Lal Bahadur Shastri National Award by the Hon’ble President of India in 2009 Akhil Gupta , Deputy Group CEO & MD •CA Business Achiever Award by Institute of Chartered Accountants of
India .Manoj Kohli , CEO( International) &Joint MD
• Telecom Man of the year by Tele.net in Apr’10
Best Cellular Service Provider and Best VSAT &
NLD player Service Provider at the 2009 Voice & Data
100 Awards
Adjudged Wireless Service Provider of the Year 2009 - Frost & Sullivan Asia Pacific
ICT Awards ( in recognition of innovation, vision ,
strategy and profitability)
Best Global Wholesale Carrier for 2009 at the
Telecoms World Awards Middle East.
Voted as the India’s Most Innovative company in a survey conducted by Wall
Street Journal
Adjudged Most Preferred Cellular Service Provider Brand award at the 2010 CNBC Awaaz Consumer Awards
8/8/2019 Investor Presentation July10
http://slidepdf.com/reader/full/investor-presentation-july10 36/36
Recommended