Q1 2017 Results
Press Conference
April 26, 2017
Gisbert Rühl | CEO
No.2
Disclaimer
This presentation contains forward-looking statements which reflect the current views of the management of Klöckner & Co SE with respect to
future events. They generally are designated by the words “expect”, “assume”, “presume”, “intend”, “estimate”, “strive for”, “aim for”, “plan”,
“will”, “endeavor”, “outlook” and comparable expressions and generally contain information that relates to expectations or goals for economic
conditions, sales proceeds or other yardsticks for the success of the enterprise. Forward-looking statements are based on currently valid
plans, estimates and expectations. You therefore should view them with caution. Such statements are subject to risks and factors of
uncertainty, most of which are difficult to assess and which generally are outside of the control of Klöckner & Co SE. The relevant factors
include the effects of significant strategic and operational initiatives, including the acquisition or disposition of companies. If these or other
risks and factors of uncertainty occur or if the assumptions on which the statements are based turn out to be incorrect, the actual results of
Klöckner & Co SE can deviate significantly from those that are expressed or implied in these statements. Klöckner & Co SE cannot give any
guarantee that the expectations or goals will be attained. Klöckner & Co SE – notwithstanding existing obligations under laws pertaining to
capital markets – rejects any responsibility for updating the forward-looking statements through taking into consideration new information or
future events or other things.
In addition to the key data prepared in accordance with International Financial Reporting Standards, Klöckner & Co SE is presenting non-
GAAP key data such as EBITDA, EBIT, Net Working Capital and net financial liabilities that are not a component of the accounting
regulations. These key data are to be viewed as supplementary to, but not as a substitute for data prepared in accordance with International
Financial Reporting Standards. Non-GAAP key data are not subject to IFRS or any other generally applicable accounting regulations. Other
companies may base these concepts upon other definitions.
Q1 2017 Results | Press Conference | Klöckner & Co SE
No.3
1. Highlights and update on strategy
2. Outlook
3. Appendix
Agenda
Q1 2017 Results | Press Conference | Klöckner & Co SE
No.4
Highlights Q1 201701
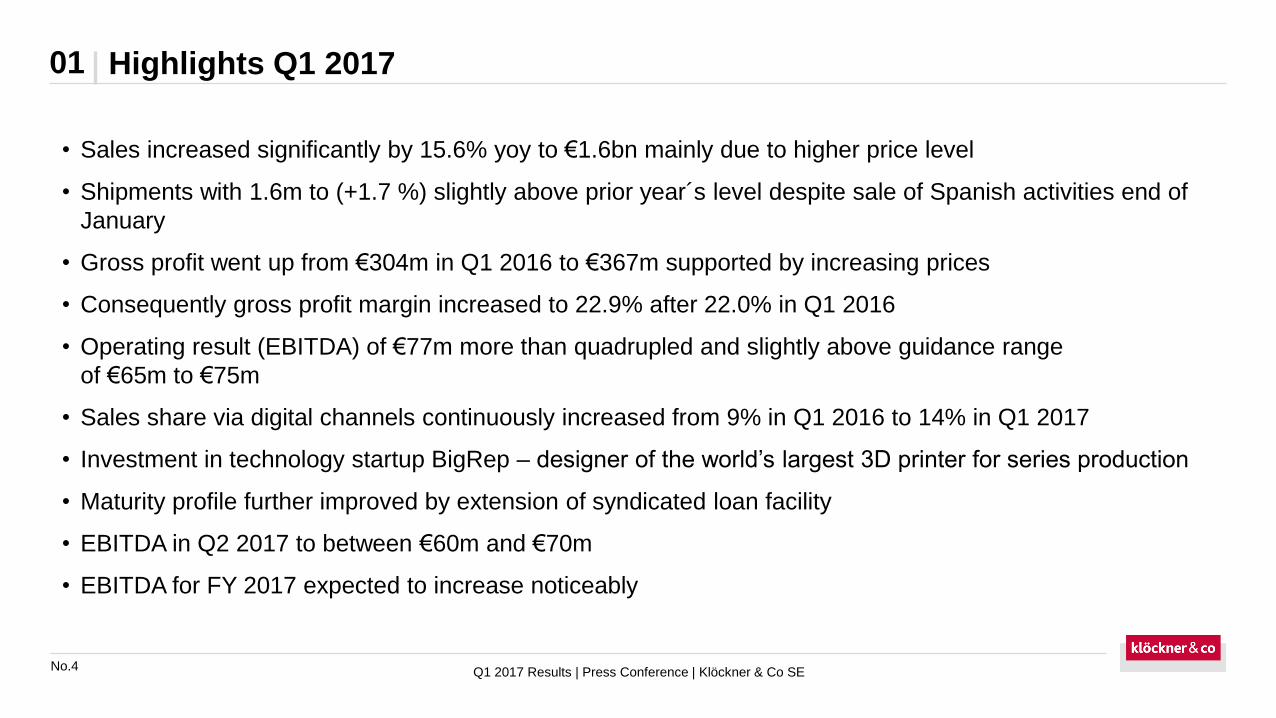
• Sales increased significantly by 15.6% yoy to €1.6bn mainly due to higher price level
• Shipments with 1.6m to (+1.7 %) slightly above prior year´s level despite sale of Spanish activities end of
January
• Gross profit went up from €304m in Q1 2016 to €367m supported by increasing prices
• Consequently gross profit margin increased to 22.9% after 22.0% in Q1 2016
• Operating result (EBITDA) of €77m more than quadrupled and slightly above guidance range
of €65m to €75m
• Sales share via digital channels continuously increased from 9% in Q1 2016 to 14% in Q1 2017
• Investment in technology startup BigRep – designer of the world’s largest 3D printer for series production
• Maturity profile further improved by extension of syndicated loan facility
• EBITDA in Q2 2017 to between €60m and €70m
• EBITDA for FY 2017 expected to increase noticeably
Q1 2017 Results | Press Conference | Klöckner & Co SE
No.5
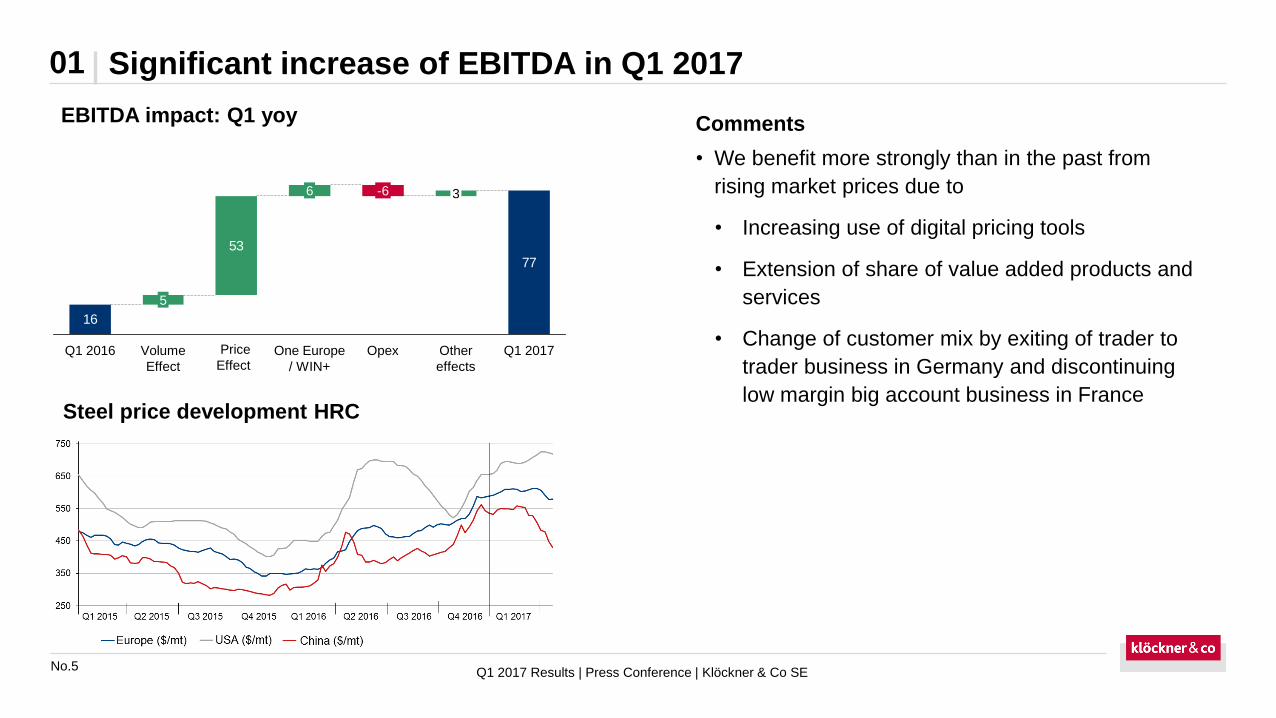
Significant increase of EBITDA in Q1 201701
EBITDA impact: Q1 yoy Comments
77
53
16
Other
effects
-6
One Europe
/ WIN+
Opex
6 3
Q1 2016
5
Volume
Effect
Q1 2017
Q1 2017 Results | Press Conference | Klöckner & Co SE
Price
Effect
Steel price development HRC
• We benefit more strongly than in the past from
rising market prices due to
• Increasing use of digital pricing tools
• Extension of share of value added products and
services
• Change of customer mix by exiting of trader to
trader business in Germany and discontinuing
low margin big account business in France
No.6
01
Q1 2017 Results | Press Conference | Klöckner & Co SE
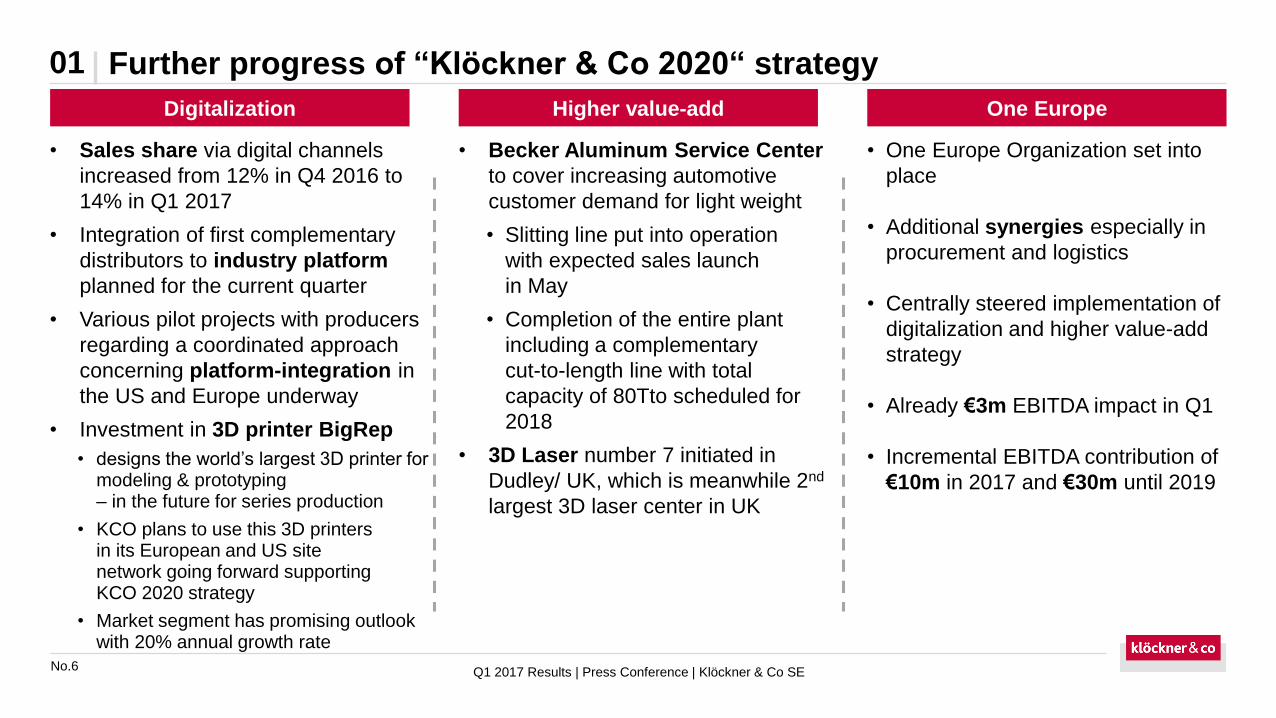
• Becker Aluminum Service Center
to cover increasing automotive
customer demand for light weight
• Slitting line put into operation
with expected sales launch
in May
• Completion of the entire plant
including a complementary
cut-to-length line with total
capacity of 80Tto scheduled for
2018
• 3D Laser number 7 initiated in
Dudley/ UK, which is meanwhile 2nd
largest 3D laser center in UK
• One Europe Organization set into
place
• Additional synergies especially in
procurement and logistics
• Centrally steered implementation of
digitalization and higher value-add
strategy
• Already €3m EBITDA impact in Q1
• Incremental EBITDA contribution of
€10m in 2017 and €30m until 2019
• Sales share via digital channels
increased from 12% in Q4 2016 to
14% in Q1 2017
• Integration of first complementary
distributors to industry platform
planned for the current quarter
• Various pilot projects with producers
regarding a coordinated approach
concerning platform-integration in
the US and Europe underway
• Investment in 3D printer BigRep
• designs the world’s largest 3D printer for modeling & prototyping – in the future for series production
• KCO plans to use this 3D printers in its European and US site network going forward supporting KCO 2020 strategy
• Market segment has promising outlook with 20% annual growth rate
Digitalization Higher value-add One Europe
Further progress of “Klöckner & Co 2020“ strategy
No.7
01
Q1 2017 Results | Press Conference | Klöckner & Co SE
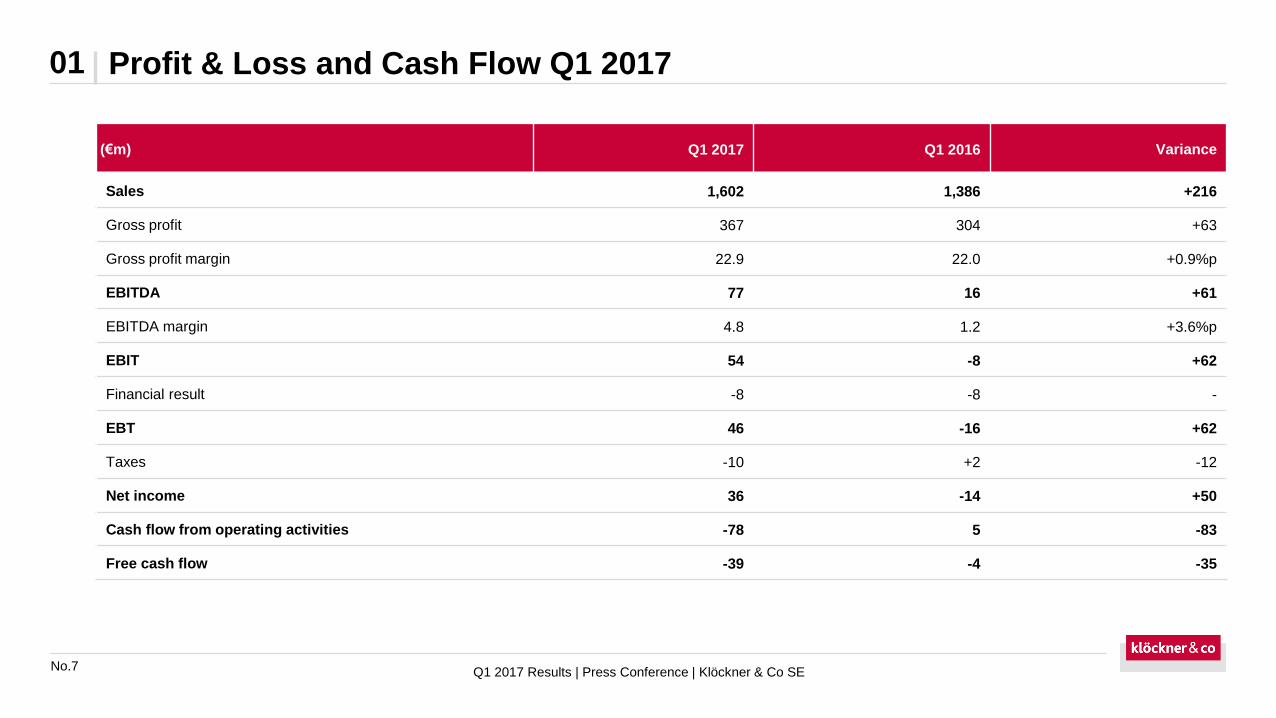
Profit & Loss and Cash Flow Q1 2017
(€m) Q1 2017 Q1 2016 Variance
Sales 1,602 1,386 +216
Gross profit 367 304 +63
Gross profit margin 22.9 22.0 +0.9%p
EBITDA 77 16 +61
EBITDA margin 4.8 1.2 +3.6%p
EBIT 54 -8 +62
Financial result -8 -8 -
EBT 46 -16 +62
Taxes -10 +2 -12
Net income 36 -14 +50
Cash flow from operating activities -78 5 -83
Free cash flow -39 -4 -35
No.8
1. Highlights and update on strategy
2. Outlook
3. Appendix
Agenda
Q1 2017 Results | Press Conference | Klöckner & Co SE
No.9
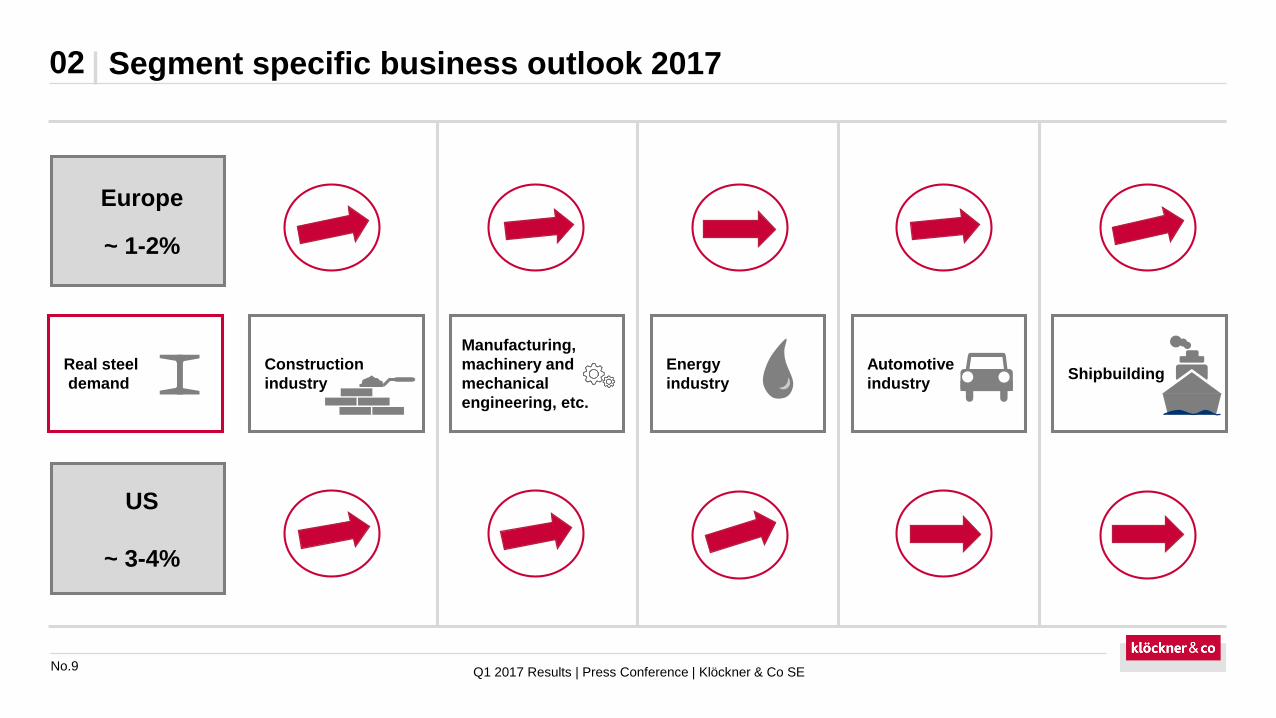
Shipbuilding
Segment specific business outlook 201702
Energy
industry
Real steel
demand
Europe
~ 1-2%
Construction
industry
Manufacturing,
machinery and
mechanical
engineering, etc.
Automotive
industry
US
~ 3-4%
Q1 2017 Results | Press Conference | Klöckner & Co SE
No.10
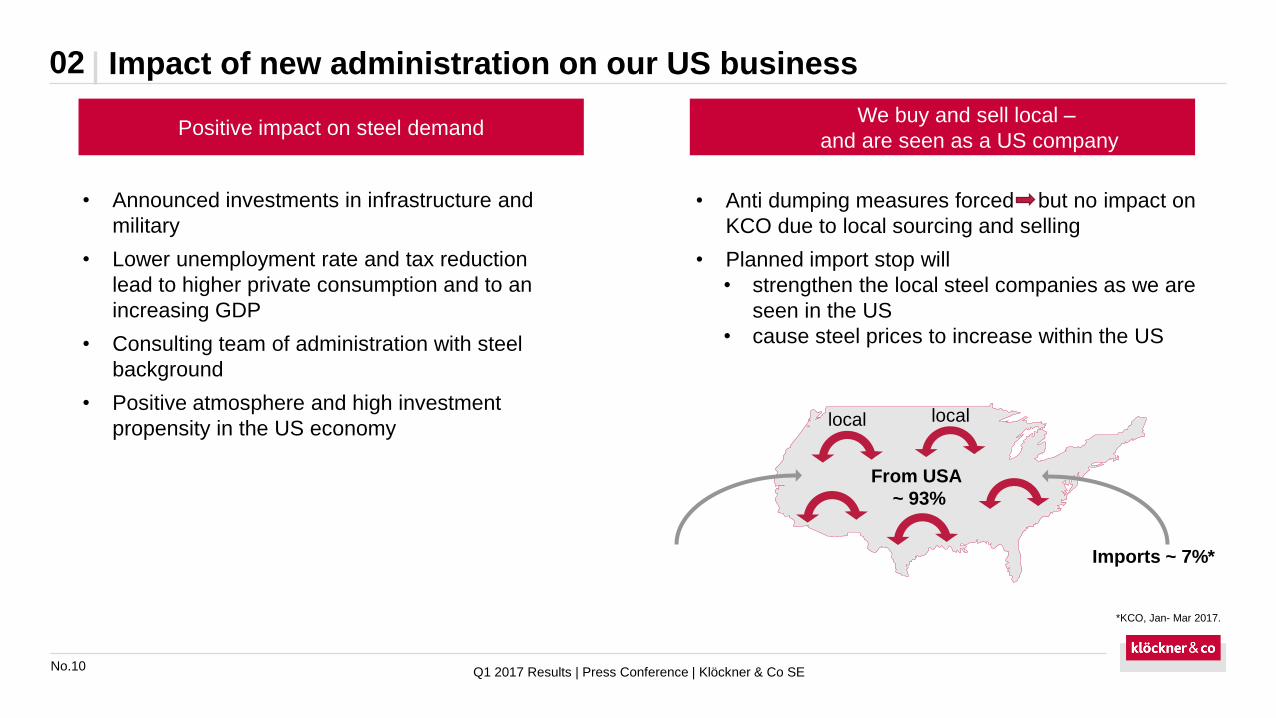
• Announced investments in infrastructure and
military
• Lower unemployment rate and tax reduction
lead to higher private consumption and to an
increasing GDP
• Consulting team of administration with steel
background
• Positive atmosphere and high investment
propensity in the US economy
Impact of new administration on our US business02
Q1 2017 Results | Press Conference | Klöckner & Co SE
Positive impact on steel demand
locallocal
From USA
~ 93%
Imports ~ 7%*
We buy and sell local –
and are seen as a US company
• Anti dumping measures forced but no impact on
KCO due to local sourcing and selling
• Planned import stop will
• strengthen the local steel companies as we are
seen in the US
• cause steel prices to increase within the US
*KCO, Jan- Mar 2017.
No.11
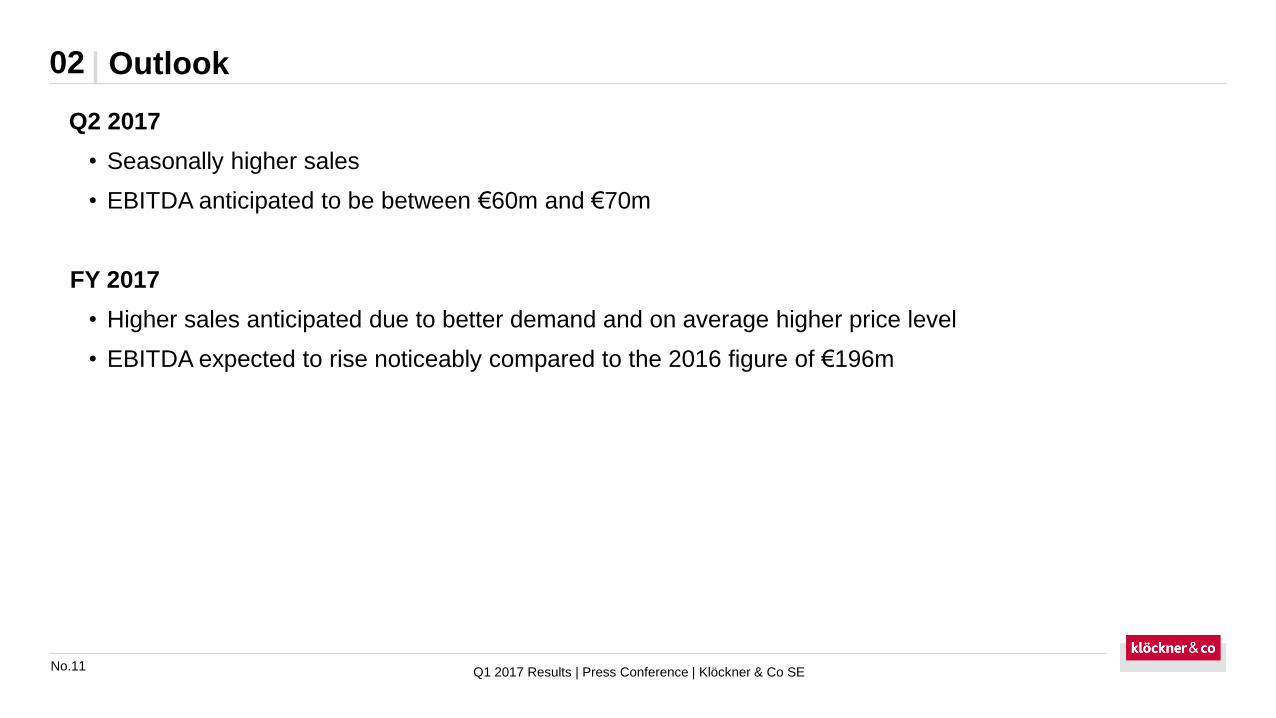
Outlook 02
Q2 2017
• Seasonally higher sales
• EBITDA anticipated to be between €60m and €70m
FY 2017
• Higher sales anticipated due to better demand and on average higher price level
• EBITDA expected to rise noticeably compared to the 2016 figure of €196m
Q1 2017 Results | Press Conference | Klöckner & Co SE
No.12
1. Highlights and update on strategy
2. Outlook
3. Appendix
Agenda
Q1 2017 Results | Press Conference | Klöckner & Co SE
No.13
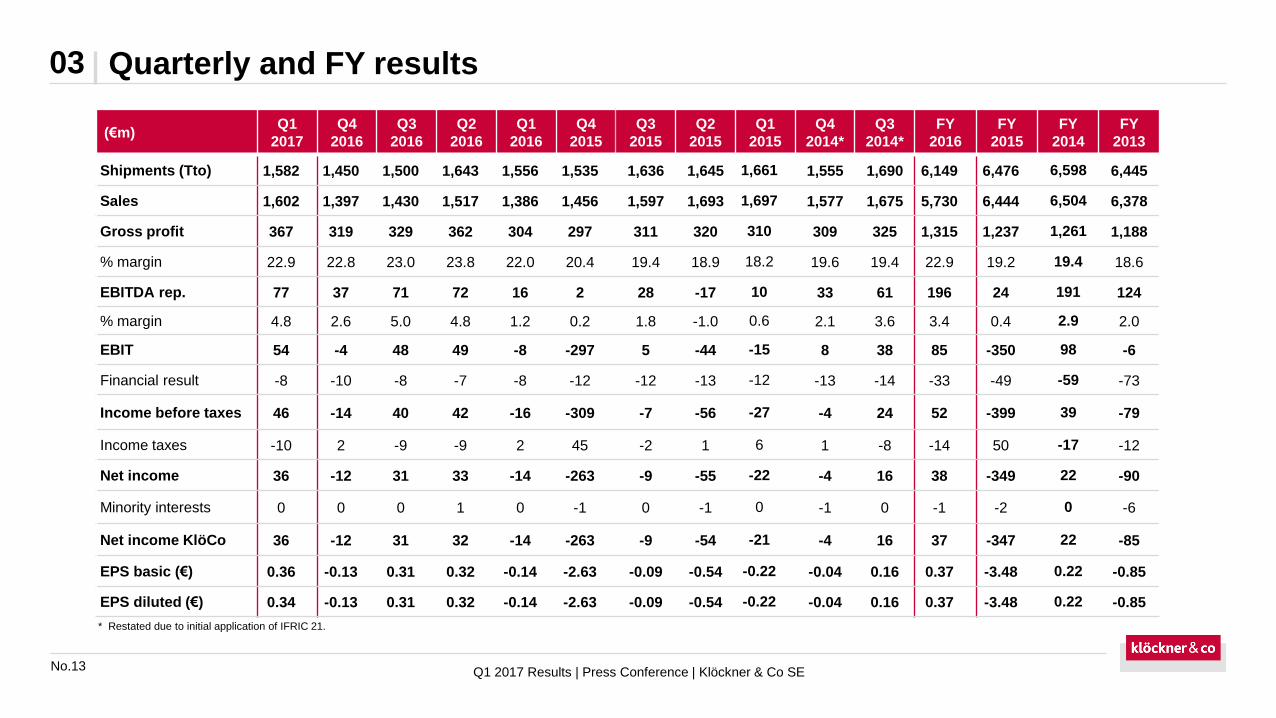
Quarterly and FY results03
(€m)Q1
2017
Q4
2016
Q3
2016
Q2
2016
Q1
2016
Q4
2015
Q3
2015
Q2
2015
Q1
2015
Q4
2014*
Q3
2014*
FY
2016
FY
2015
FY
2014
FY
2013
Shipments (Tto) 1,582 1,450 1,500 1,643 1,556 1,535 1,636 1,645 1,661 1,555 1,690 6,149 6,476 6,598 6,445
Sales 1,602 1,397 1,430 1,517 1,386 1,456 1,597 1,693 1,697 1,577 1,675 5,730 6,444 6,504 6,378
Gross profit 367 319 329 362 304 297 311 320 310 309 325 1,315 1,237 1,261 1,188
% margin 22.9 22.8 23.0 23.8 22.0 20.4 19.4 18.9 18.2 19.6 19.4 22.9 19.2 19.4 18.6
EBITDA rep. 77 37 71 72 16 2 28 -17 10 33 61 196 24 191 124
% margin 4.8 2.6 5.0 4.8 1.2 0.2 1.8 -1.0 0.6 2.1 3.6 3.4 0.4 2.9 2.0
EBIT 54 -4 48 49 -8 -297 5 -44 -15 8 38 85 -350 98 -6
Financial result -8 -10 -8 -7 -8 -12 -12 -13 -12 -13 -14 -33 -49 -59 -73
Income before taxes 46 -14 40 42 -16 -309 -7 -56 -27 -4 24 52 -399 39 -79
Income taxes -10 2 -9 -9 2 45 -2 1 6 1 -8 -14 50 -17 -12
Net income 36 -12 31 33 -14 -263 -9 -55 -22 -4 16 38 -349 22 -90
Minority interests 0 0 0 1 0 -1 0 -1 0 -1 0 -1 -2 0 -6
Net income KlöCo 36 -12 31 32 -14 -263 -9 -54 -21 -4 16 37 -347 22 -85
EPS basic (€) 0.36 -0.13 0.31 0.32 -0.14 -2.63 -0.09 -0.54 -0.22 -0.04 0.16 0.37 -3.48 0.22 -0.85
EPS diluted (€) 0.34 -0.13 0.31 0.32 -0.14 -2.63 -0.09 -0.54 -0.22 -0.04 0.16 0.37 -3.48 0.22 -0.85
* Restated due to initial application of IFRIC 21.
Q1 2017 Results | Press Conference | Klöckner & Co SE
No.14
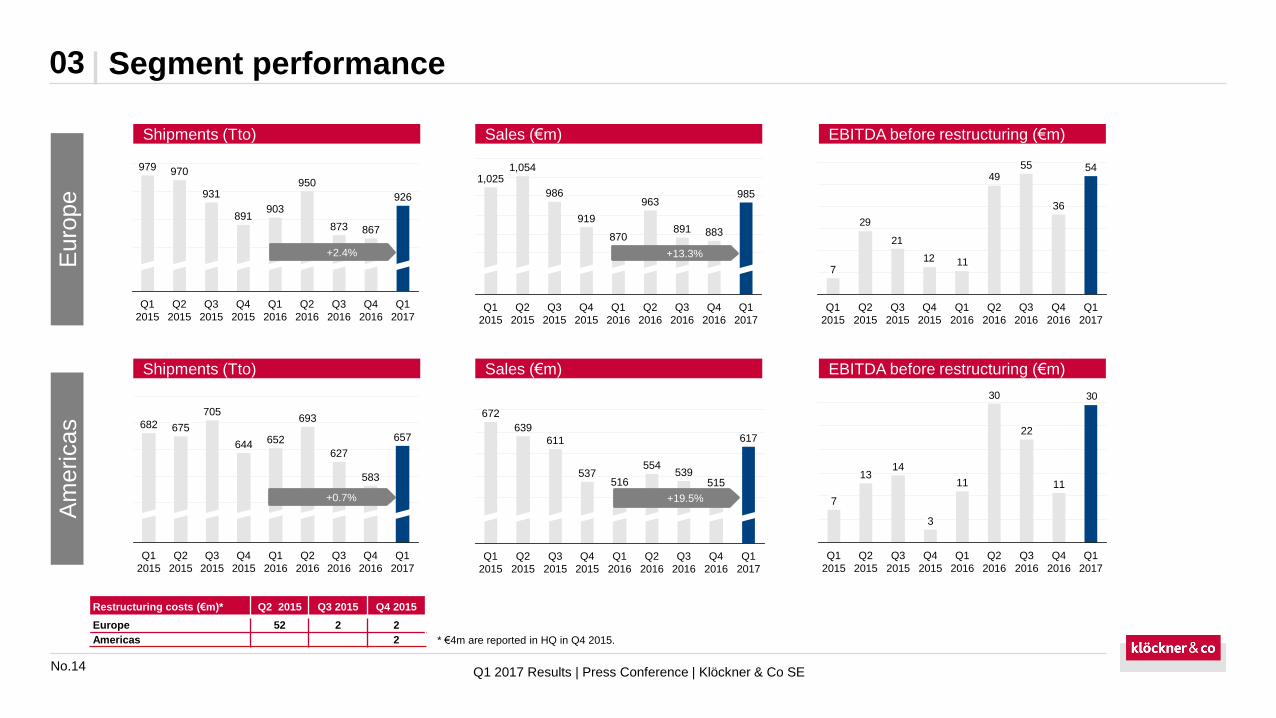
Segment performance03
926
Q4
2016
867
Q3
2016
873
Q1
2016
950
Q2
2016
903
Q4
2015
891
Q3
2015
931
Q2
2015
970
Q1
2015
979
Q1
2017
985
Q1
2017
Q4
2016
883
Q3
2016
891
Q2
2016
963
Q1
2016
870
Q4
2015
919
Q3
2015
986
Q2
2015
1,054
Q1
2015
1,025 49
1112
21
29
Q3
2015
Q2
2015
Q1
2015
7
36
Q3
2016
55
Q2
2016
Q1
2016
Q4
2015
Q1
2017
54
Q4
2016
627
Q2
2016
693
Q1
2016
652
Q4
2015
644
Q3
2015
Q1
2017
657
Q4
2016
583
Q3
2016
705
Q2
2015
675
Q1
2015
682
Q2
2016
554
Q1
2016
516
Q4
2015
537
Q4
2016
515
Q3
2016
539
617
Q1
2017
672
Q1
2015
639
Q2
2015
611
Q3
2015
3030
Q1
2015
7
Q1
2016
11
Q4
2015
3
Q3
2015
14
Q2
2015
13
22
11
Q2
2016
Q1
2017
Q4
2016
Q3
2016
+2.4%
+0.7%
+13.3%
+19.5%
Euro
pe
Am
ericas
Restructuring costs (€m)* Q2 2015 Q3 2015 Q4 2015
Europe 52 2 2
Americas 2
Shipments (Tto) Sales (€m) EBITDA before restructuring (€m)
Shipments (Tto) Sales (€m) EBITDA before restructuring (€m)
* €4m are reported in HQ in Q4 2015.
Q1 2017 Results | Press Conference | Klöckner & Co SE
No.15
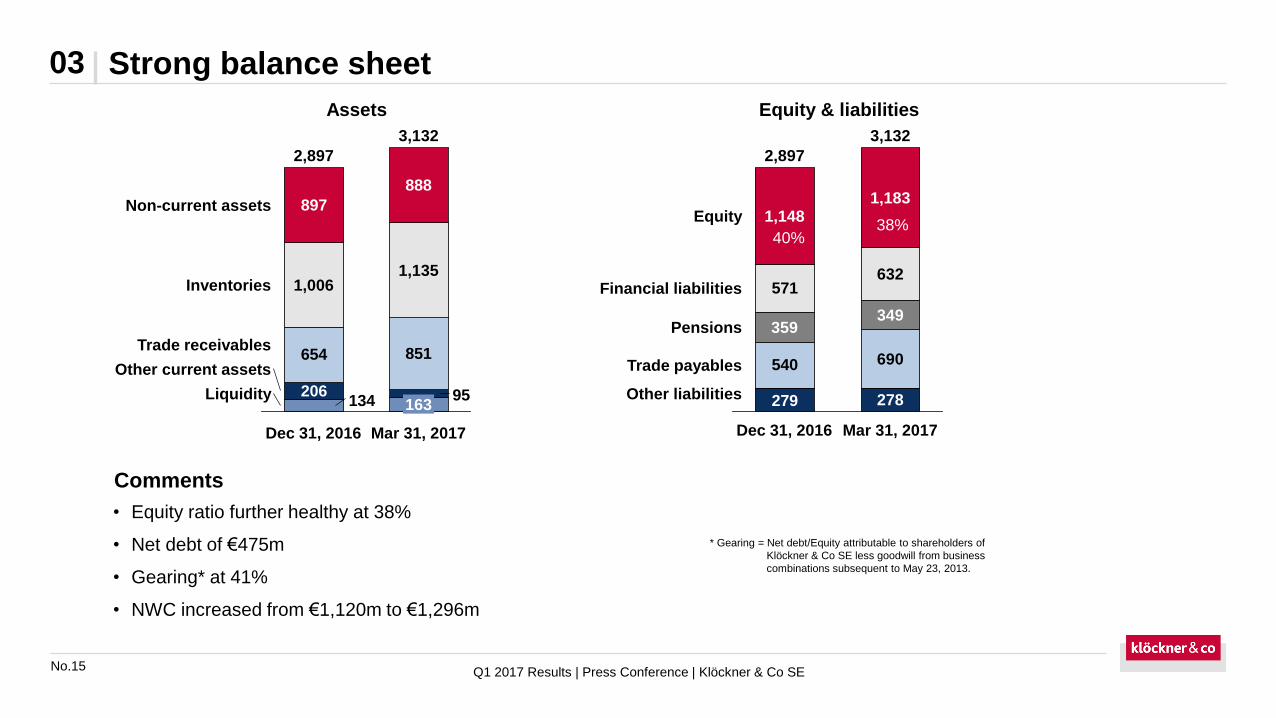
Strong balance sheet03
• Equity ratio further healthy at 38%
• Net debt of €475m
• Gearing* at 41%
• NWC increased from €1,120m to €1,296m
* Gearing = Net debt/Equity attributable to shareholders of
Klöckner & Co SE less goodwill from business
combinations subsequent to May 23, 2013.
Comments
Assets Equity & liabilities
39% 39%
654 851
134 95206
897
888
2,897
Dec 31, 2016
1,1351,006
Non-current assets
Mar 31, 2017
163
3,132
Trade receivables
Liquidity
Inventories
Other current assets
279
540
571
Equity 1,148
Financial liabilities
Pensions
Trade payables
Other liabilities
1,183
Dec 31, 2016
359
2,897
Mar 31, 2017
3,132
632
349
690
278
40%38%
Q1 2017 Results | Press Conference | Klöckner & Co SE
No.16
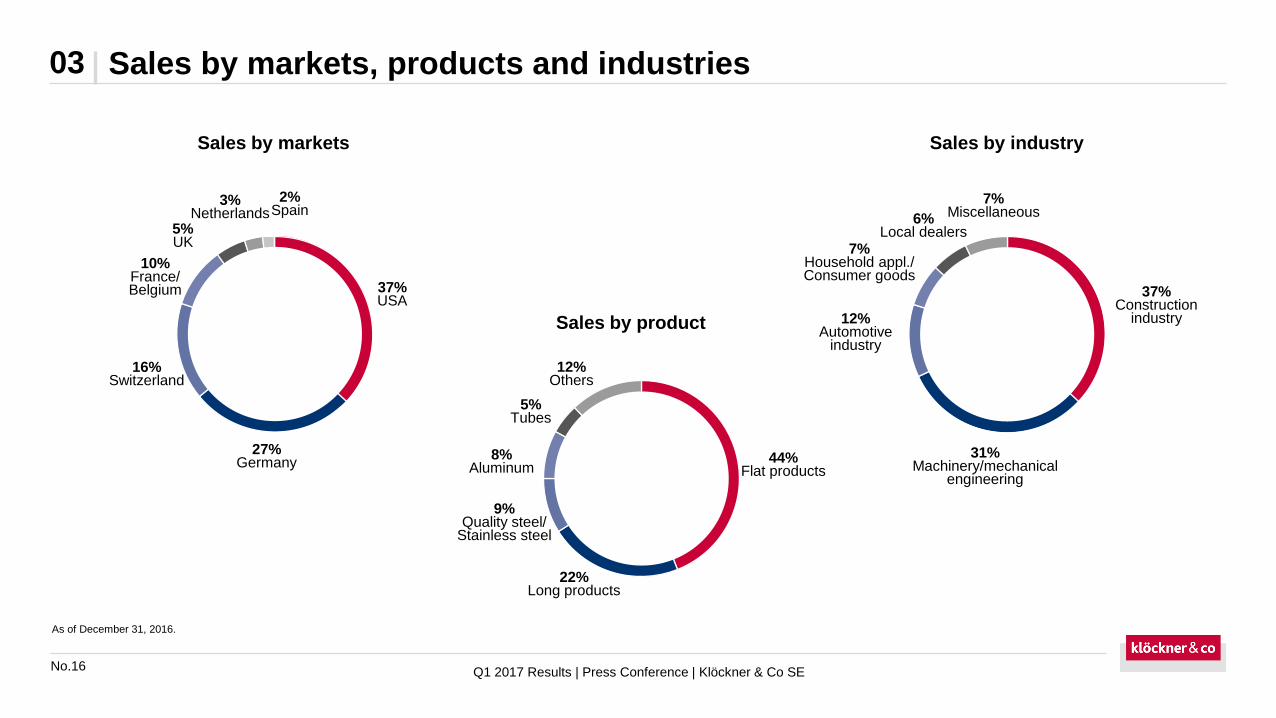
Sales by markets, products and industries03
As of December 31, 2016.
Sales by markets Sales by industry
Sales by product
5%UK
10%France/Belgium
16%Switzerland
27%Germany
37%USA
3%Netherlands
2%Spain
5%Tubes
8%Aluminum
9%Quality steel/
Stainless steel
22%Long products
44%Flat products
12%Others
12%Automotive
industry
7%Miscellaneous6%
Local dealers
31%Machinery/mechanical
engineering
37%Construction
industry
7%Household appl./Consumer goods
Q1 2017 Results | Press Conference | Klöckner & Co SE
No.17
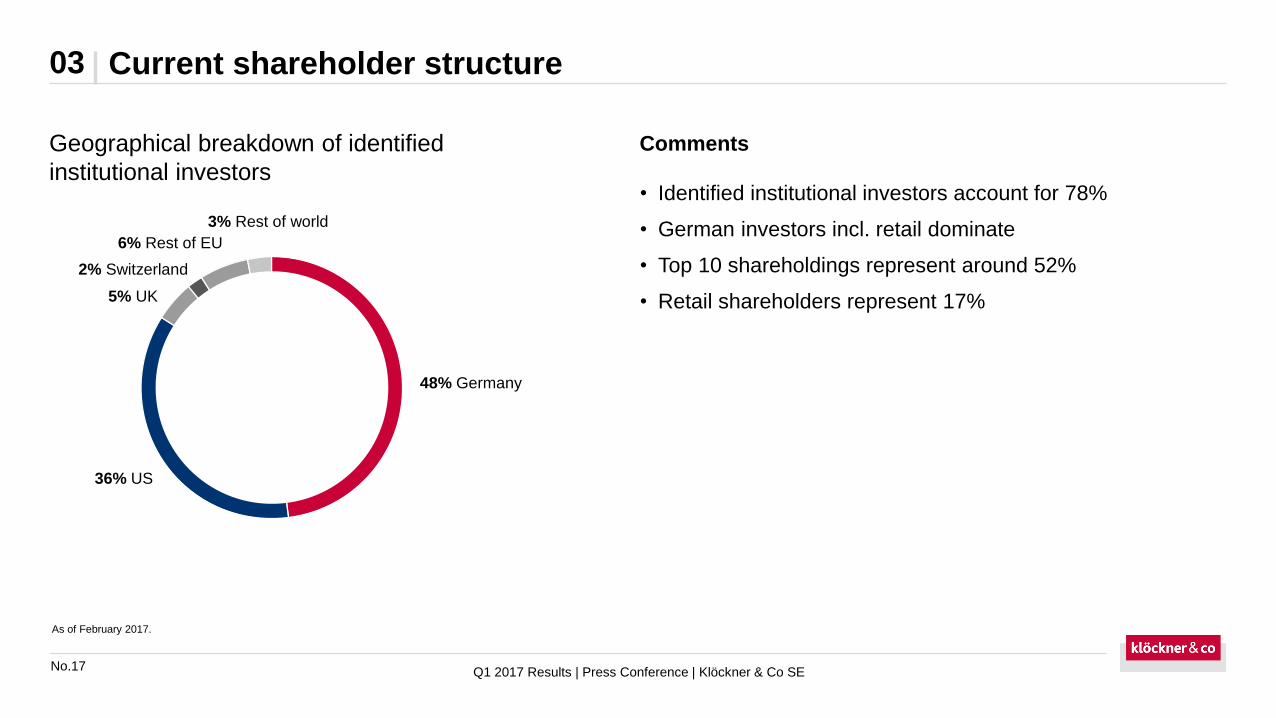
Current shareholder structure03
Geographical breakdown of identified
institutional investors• Identified institutional investors account for 78%
• German investors incl. retail dominate
• Top 10 shareholdings represent around 52%
• Retail shareholders represent 17%
Comments
As of February 2017.
6% Rest of EU
36% US
3% Rest of world
2% Switzerland
5% UK
48% Germany
Q1 2017 Results | Press Conference | Klöckner & Co SE
Financial calendar
Christian Pokropp
Head of Corporate Communications
Phone: +49 203 307 2050
Fax: +49 203 307 5025
Email: [email protected]
Internet: www.kloeckner.com
May 12, 2017 Annual General Meeting 2017, Düsseldorf
July 26, 2017 Q2 interim report 2017
October 25, 2017 Q3 interim statement 2017
Contact details
Recommended