Mean pulse profiles and Mean pulse profiles and spectra at the low spectra at the low frequenciesfrequencies
Malov O.I., Malofeev V.M.Malov O.I., Malofeev V.M.
Pushchino Radio Astronomy Observatory
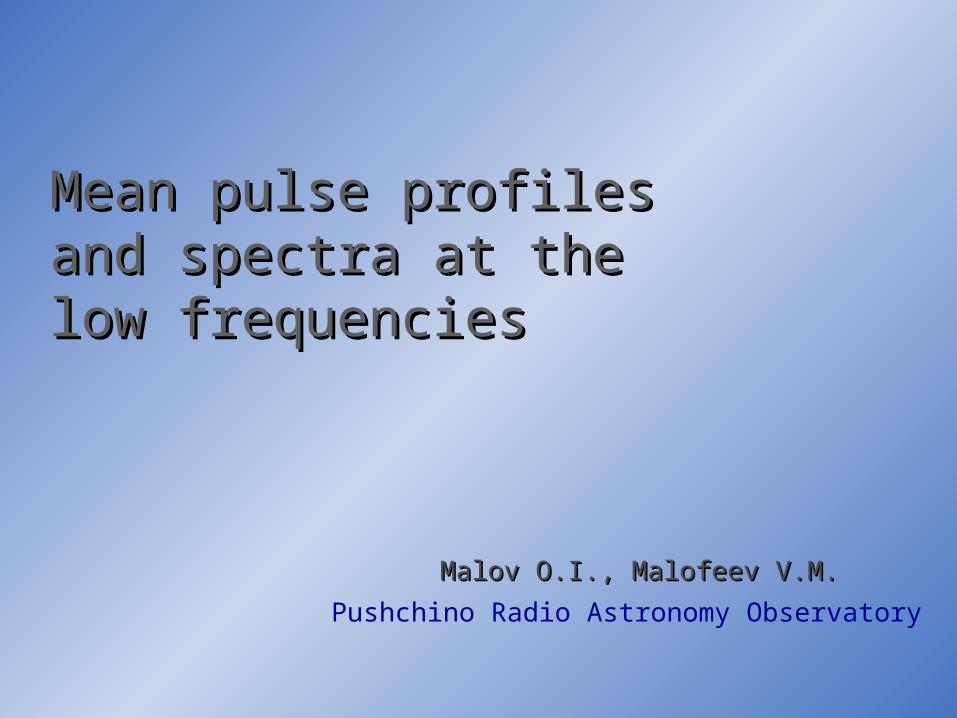
ObservationsObservations
LPA: 111.5 ± 1.5 МHz,
3.5 m / cos , Aef 3 104 cos-55 m2
Receivers: 128 20 kHz, 32 5 kHz, 128 1.25 kHz
t = 1.28 ms, 2.56 ms, 5.12 ms for normal PSRs
t = 0.3072 ms for millisecond PSRs
Calibration: discrete sources with known flux density
step of the noise generator 40 ms for normal PSRs
4 ms for millisecond ones
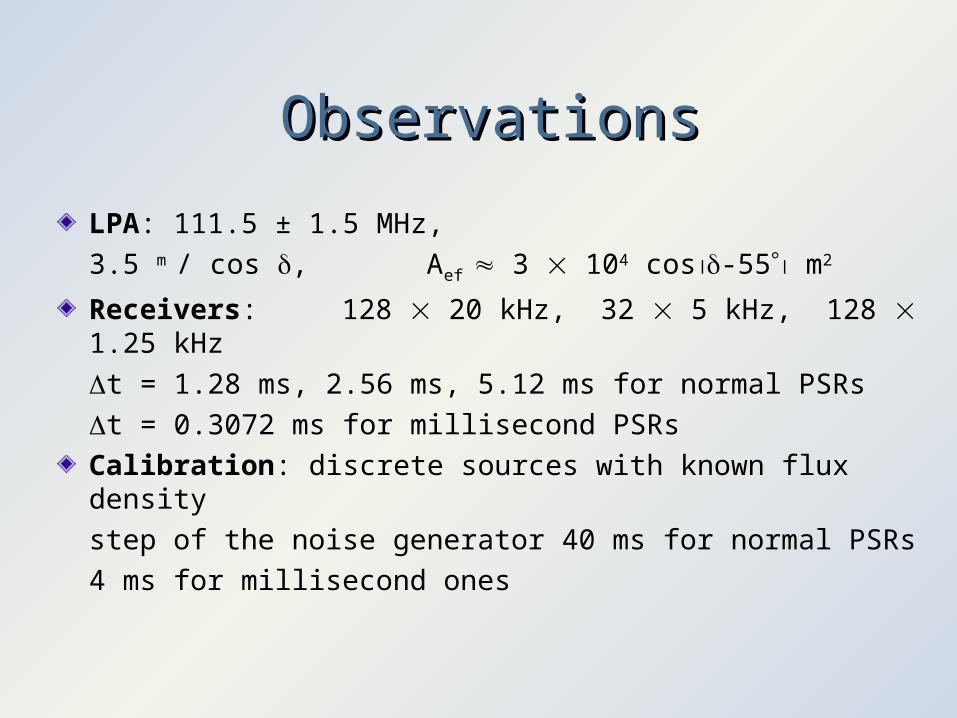
Receiver requirementsReceiver requirements
(d/dt)/t – instant bandwidth
scint – decorrelation bandwidth
< DM – dispersion broadening
F – Faraday effect

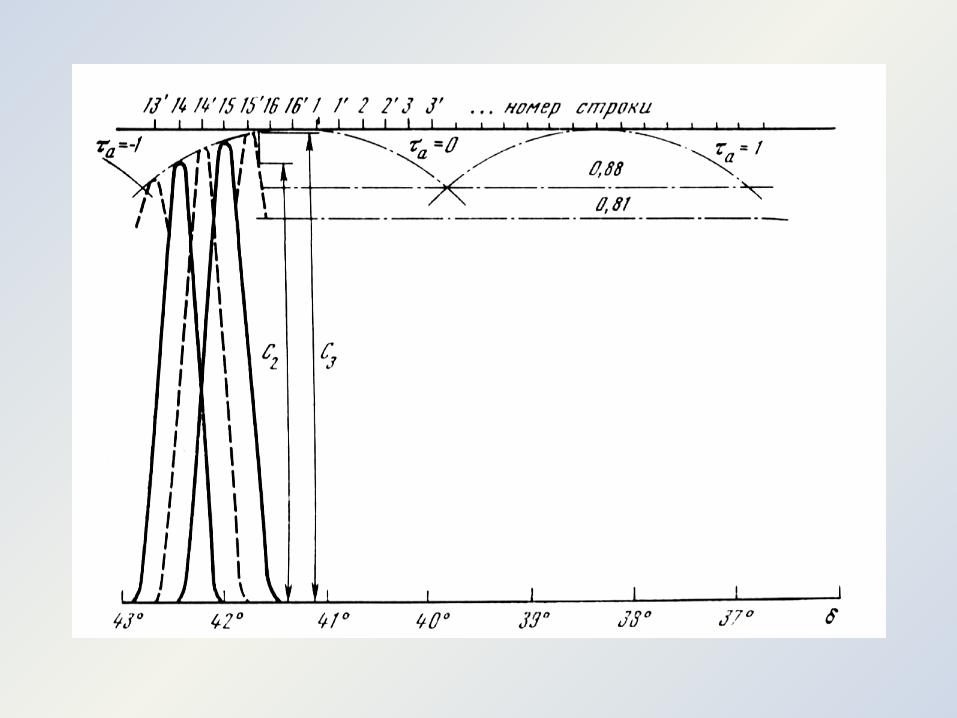
Large Phased ArrayLarge Phased Array
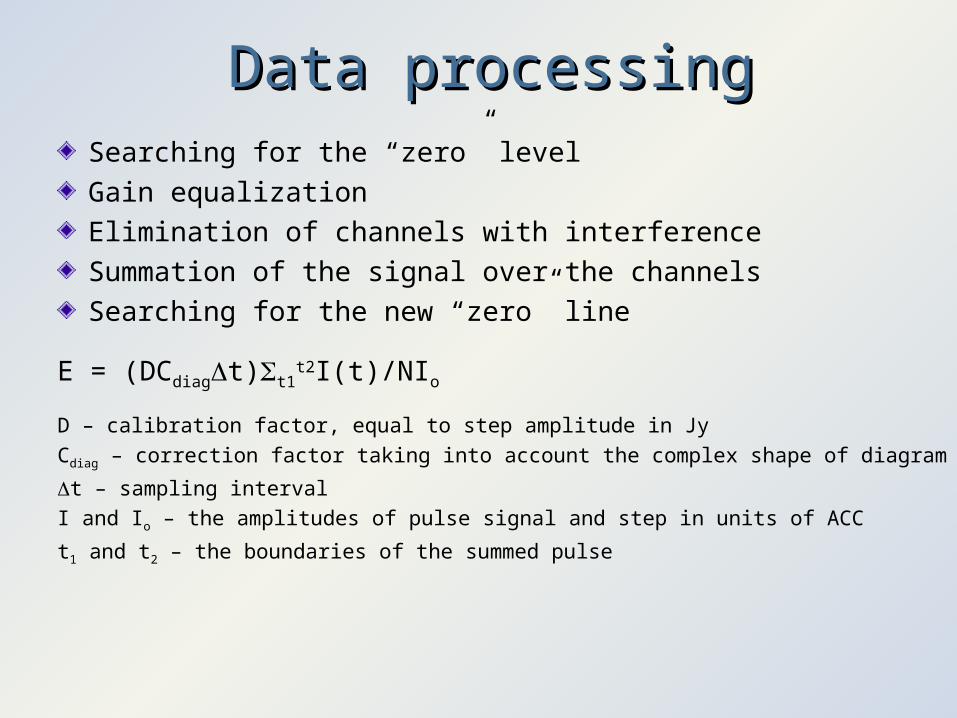
Data processingData processingSearching for the “zero” level
Gain equalization
Elimination of channels with interference
Summation of the signal over the channels
Searching for the new “zero” line
E = (DCdiagt)t1t2I(t)/NIo
D – calibration factor, equal to step amplitude in Jy
Cdiag – correction factor taking into account the complex shape of diagram
t – sampling interval
I and Io – the amplitudes of pulse signal and step in units of ACC
t1 and t2 – the boundaries of the summed pulse
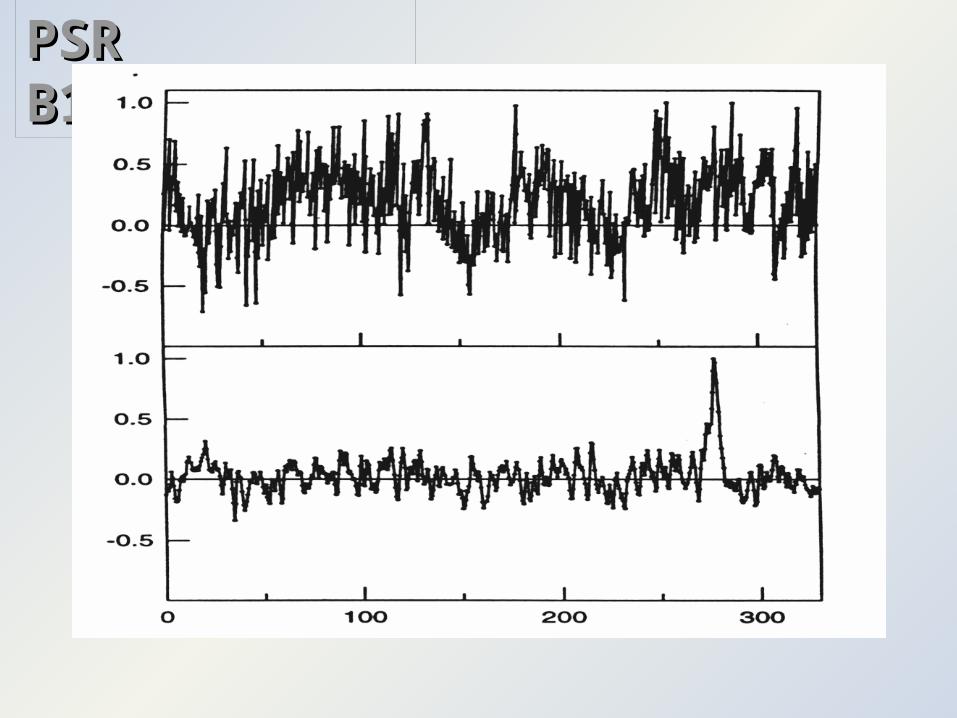
PSR B1112+50PSR B1112+50
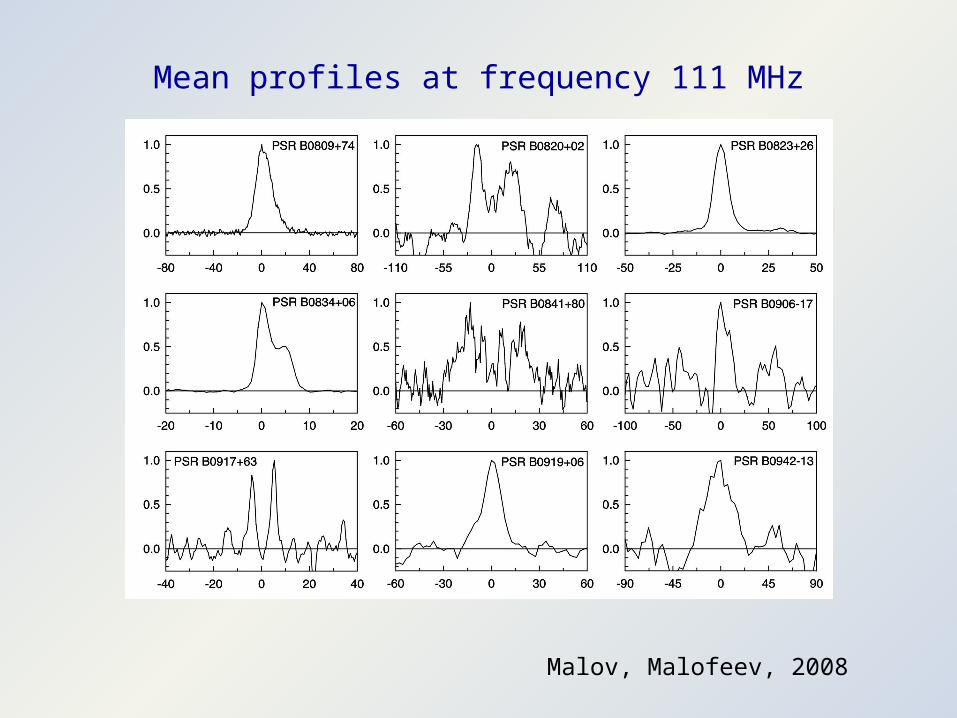
Mean profiles at frequency 111 MHz
Malov, Malofeev, 2008
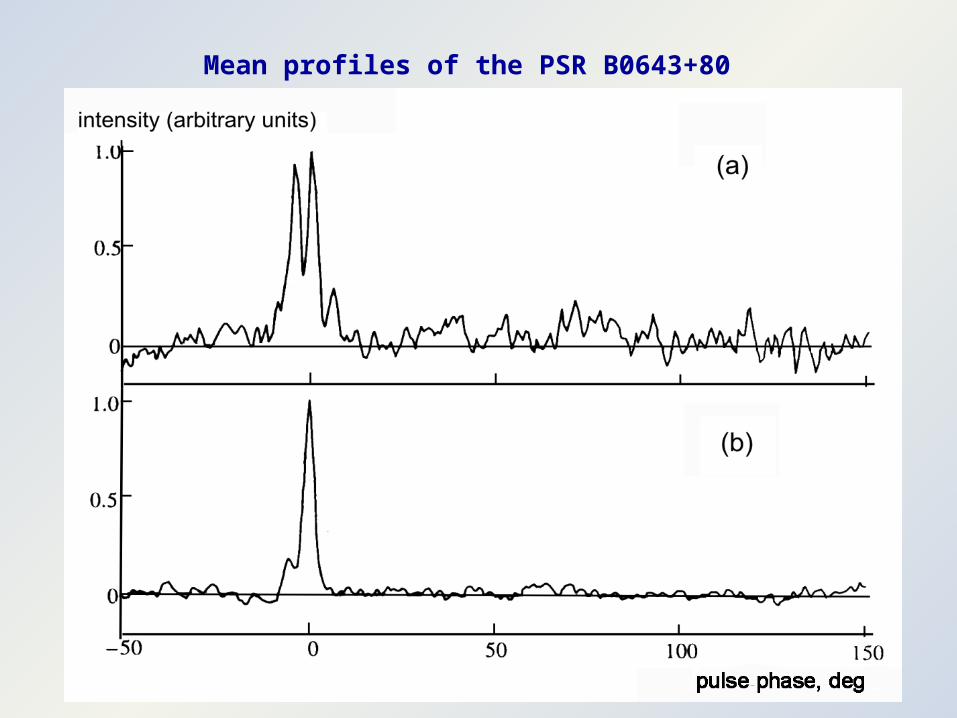
Mean profiles of the PSR B0643+80
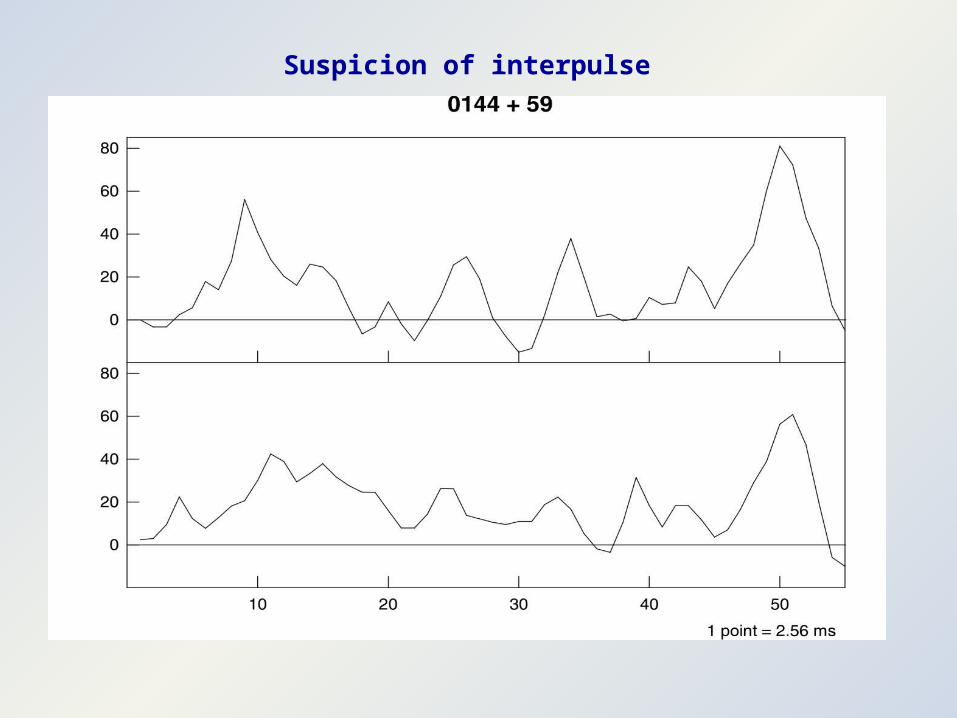
Suspicion of interpulse
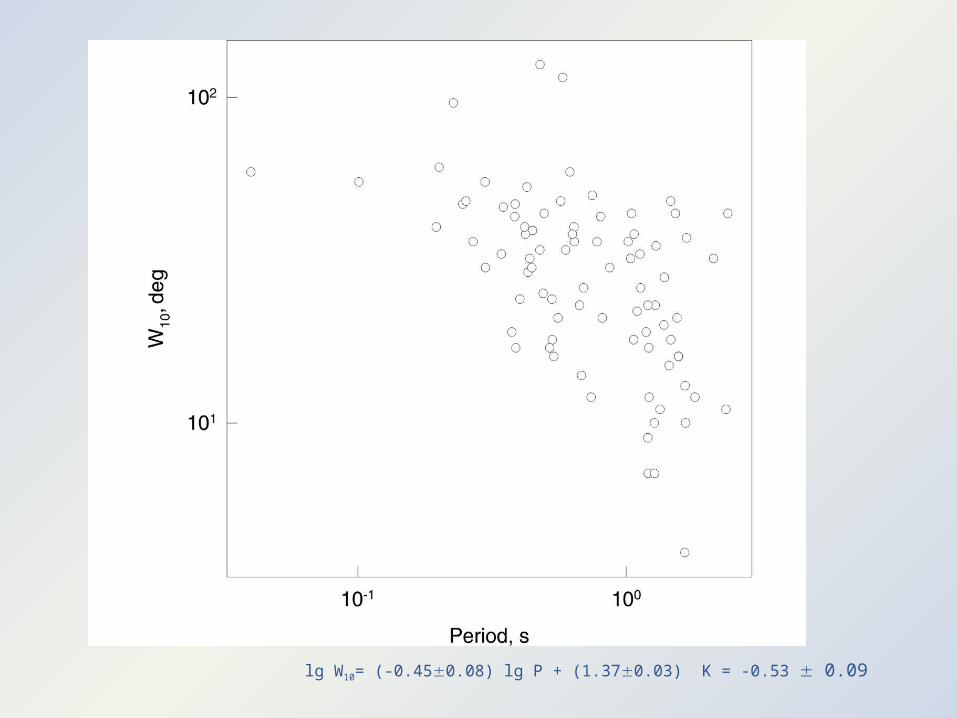
lg W10= (-0.450.08) lg P + (1.370.03) K = -0.53 0.09
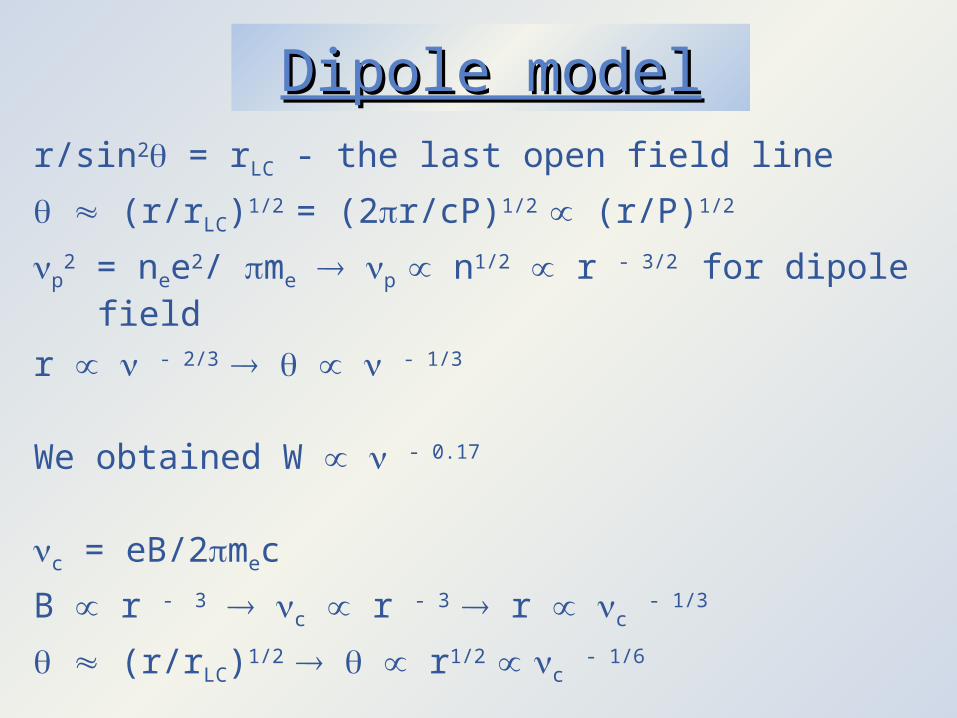
Dipole modelDipole modelr/sin2 = rLC - the last open field line
(r/rLC)1/2 = (2r/cP)1/2 (r/P)1/2
p2 = nee2/ me p
n1/2 r - 3/2 for dipole field
r - 2/3 - 1/3
We obtained W - 0.17
c = eB/2mec
B r - 3 c r - 3 r c - 1/3
(r/rLC)1/2 r1/2 c - 1/6
ConclusionsConclusions W - 0.17 probably means that the emission
generation takes place at the cyclotron frequency
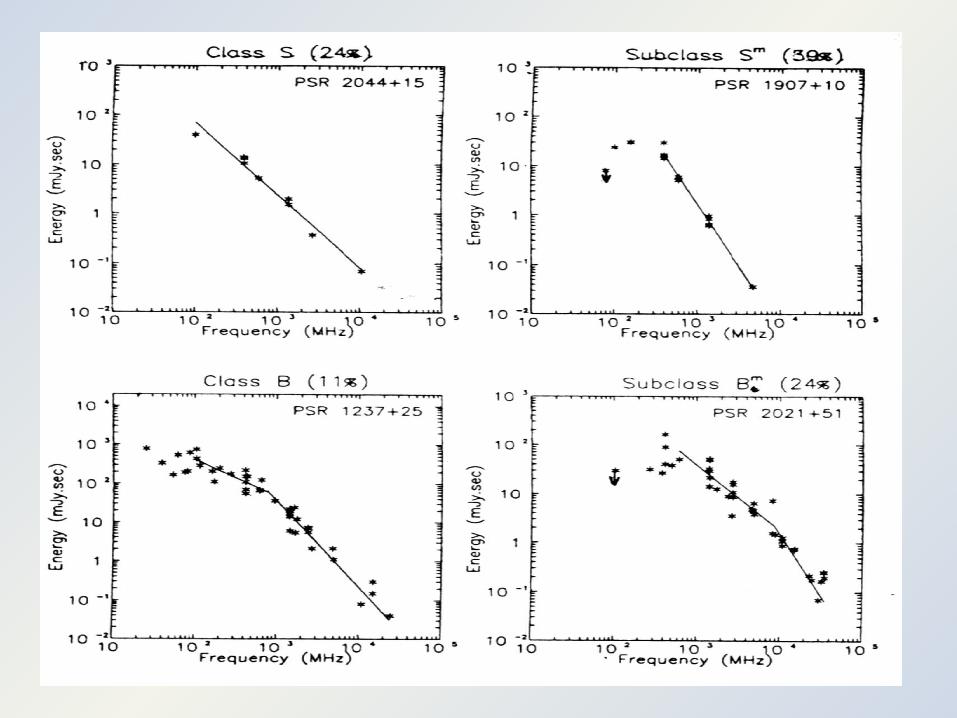
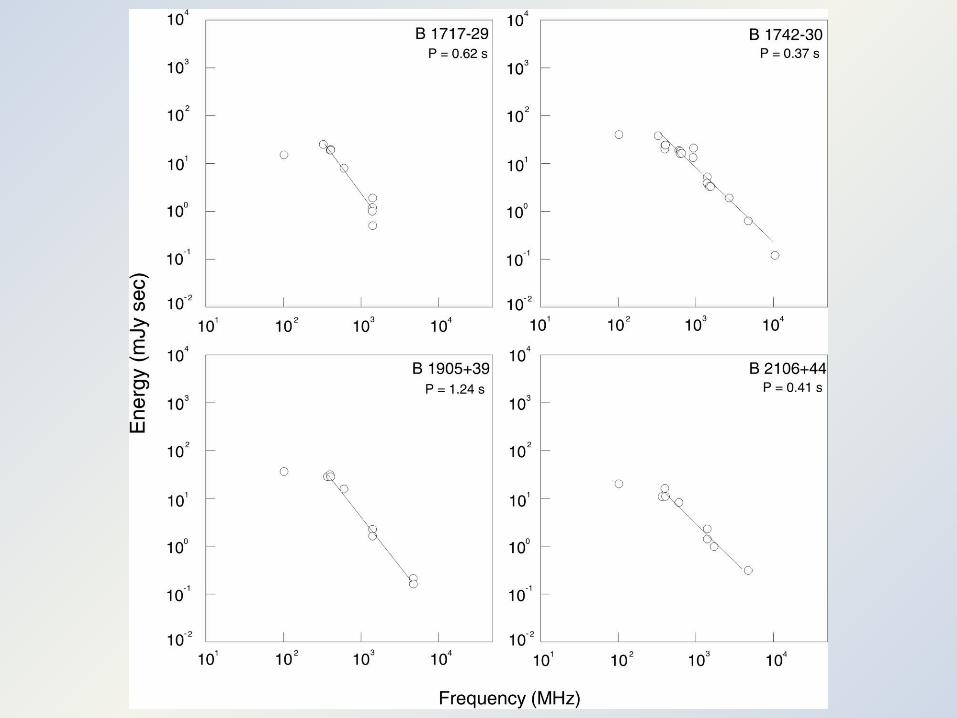
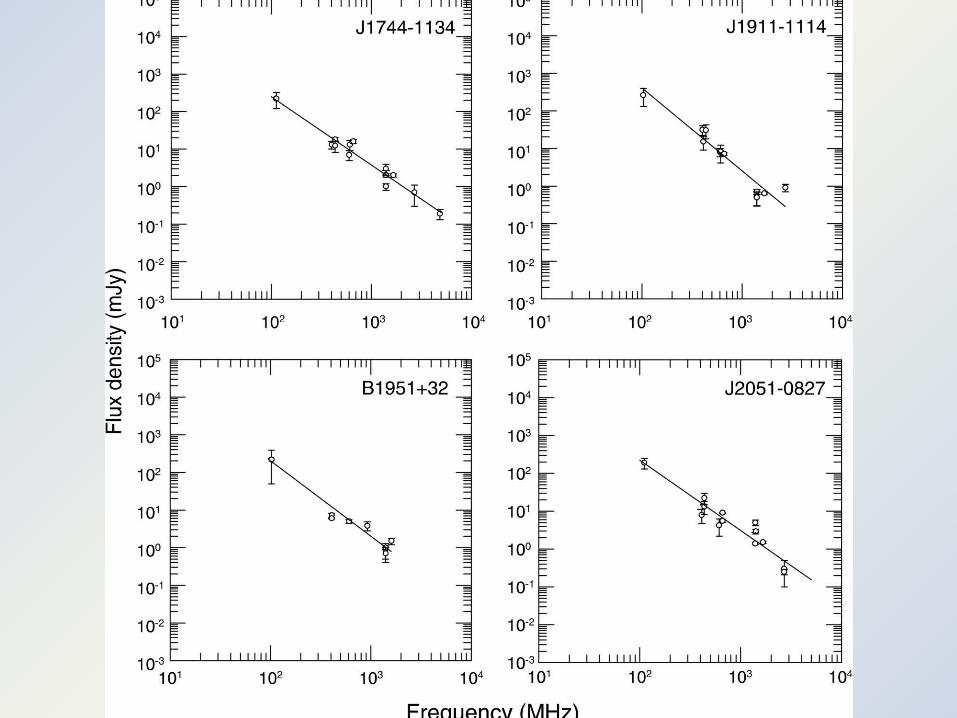
We constructed spectra for normal and millisecond pulsars using our measurements. About 30% of normal pulsars have a low frequency turn-over. Most of millisecond pulsars (about 95%) have linear spectra
Recommended