Measuring Time Preference and the
Elasticity of Intertemporal Substitution
Miles S. Kimball, Claudia R. Sahm and Matthew D. Shapiro
September 6, 2006
Internet Project Meeting
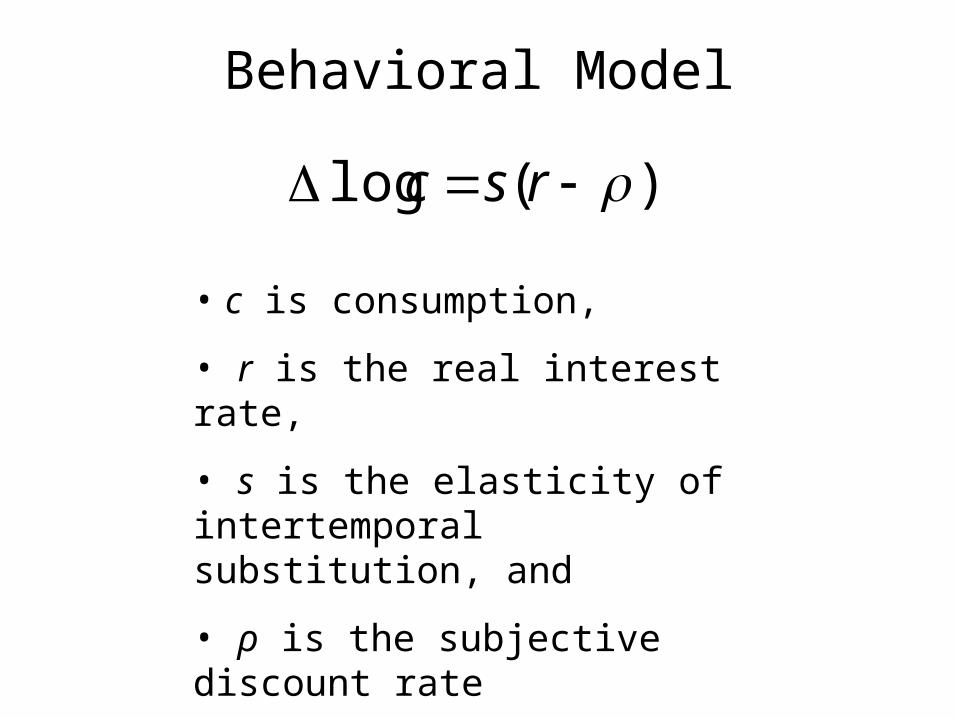
Behavioral Model
)(log rsc
• c is consumption,
• r is the real interest rate,
• s is the elasticity of intertemporal substitution, and
• ρ is the subjective discount rate
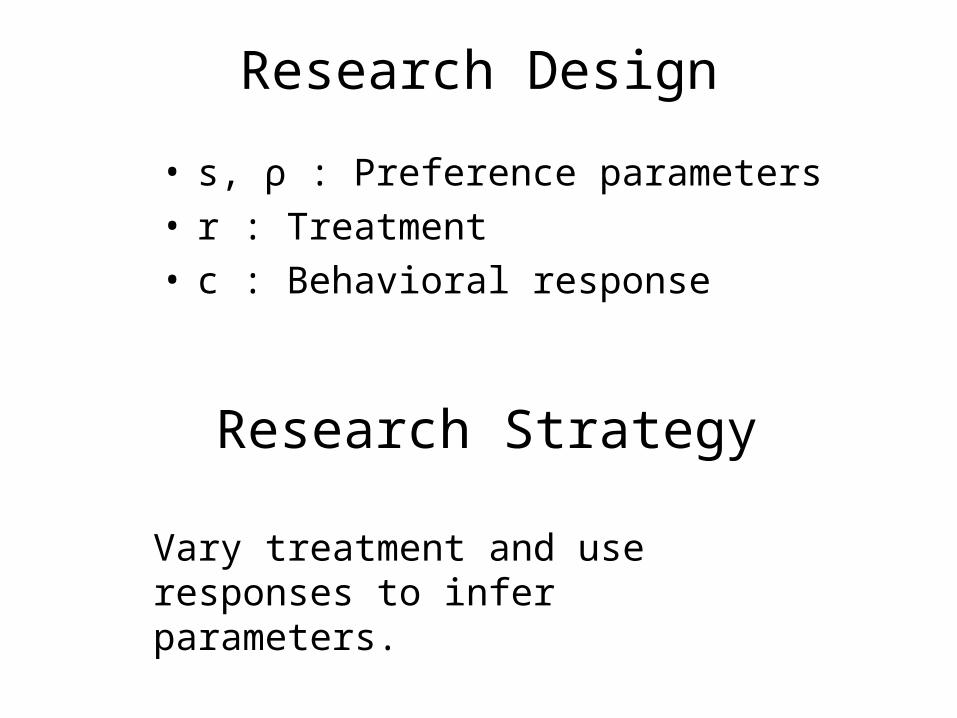
Research Design
• s, ρ : Preference parameters• r : Treatment• c : Behavioral response
Vary treatment and use responses to infer parameters.
Research Strategy
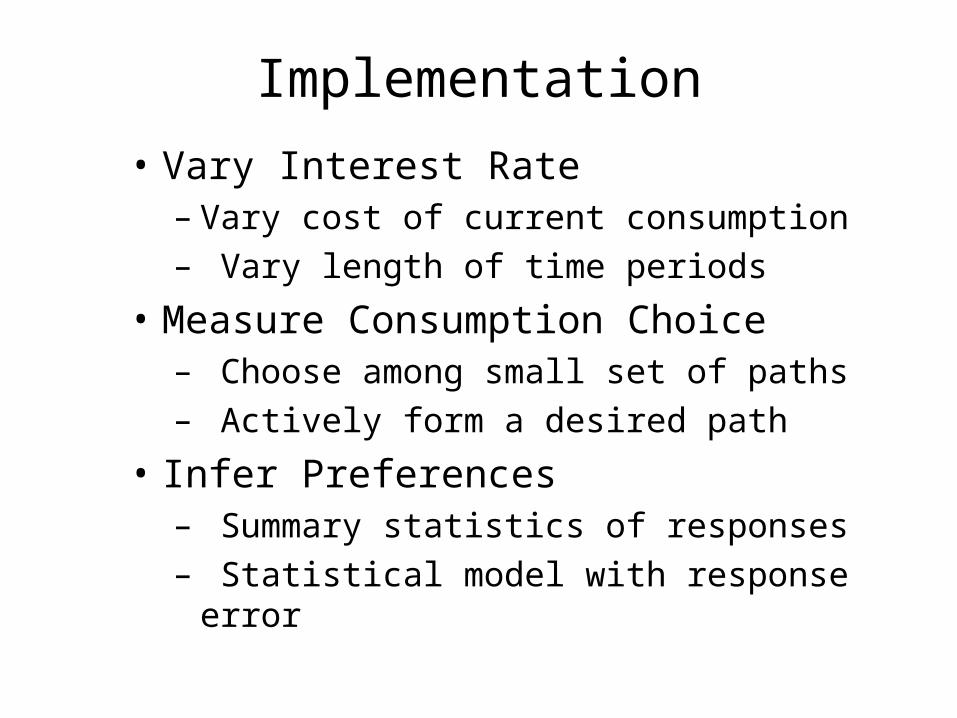
Implementation
• Vary Interest Rate– Vary cost of current consumption– Vary length of time periods
• Measure Consumption Choice– Choose among small set of paths– Actively form a desired path
• Infer Preferences– Summary statistics of responses– Statistical model with response error
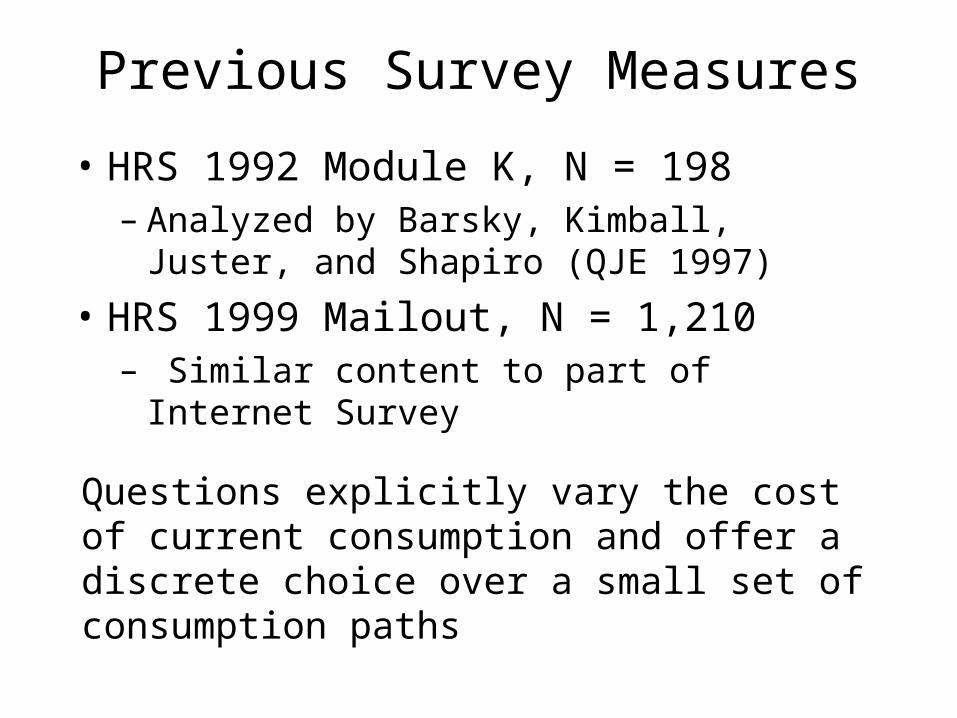
Previous Survey Measures
• HRS 1992 Module K, N = 198– Analyzed by Barsky, Kimball, Juster, and
Shapiro (QJE 1997)
• HRS 1999 Mailout, N = 1,210– Similar content to part of Internet Survey
Questions explicitly vary the cost of current consumption and offer a discrete choice over a small set of consumption paths
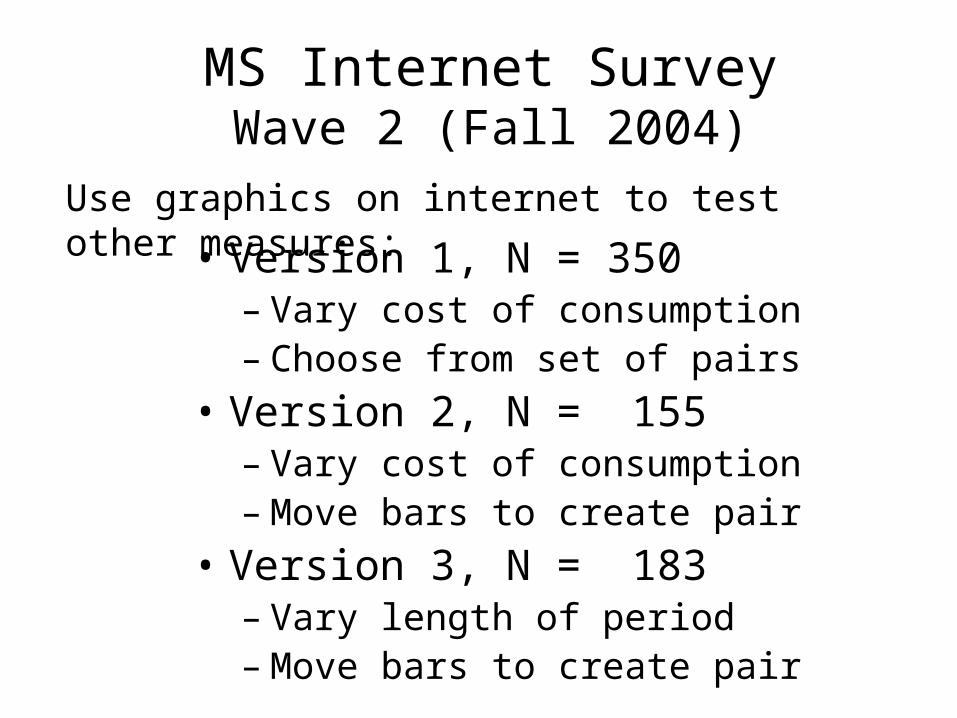
MS Internet SurveyWave 2 (Fall 2004)
• Version 1, N = 350– Vary cost of consumption– Choose from set of pairs
• Version 2, N = 155– Vary cost of consumption– Move bars to create pair
• Version 3, N = 183– Vary length of period– Move bars to create pair
Use graphics on internet to test other measures:
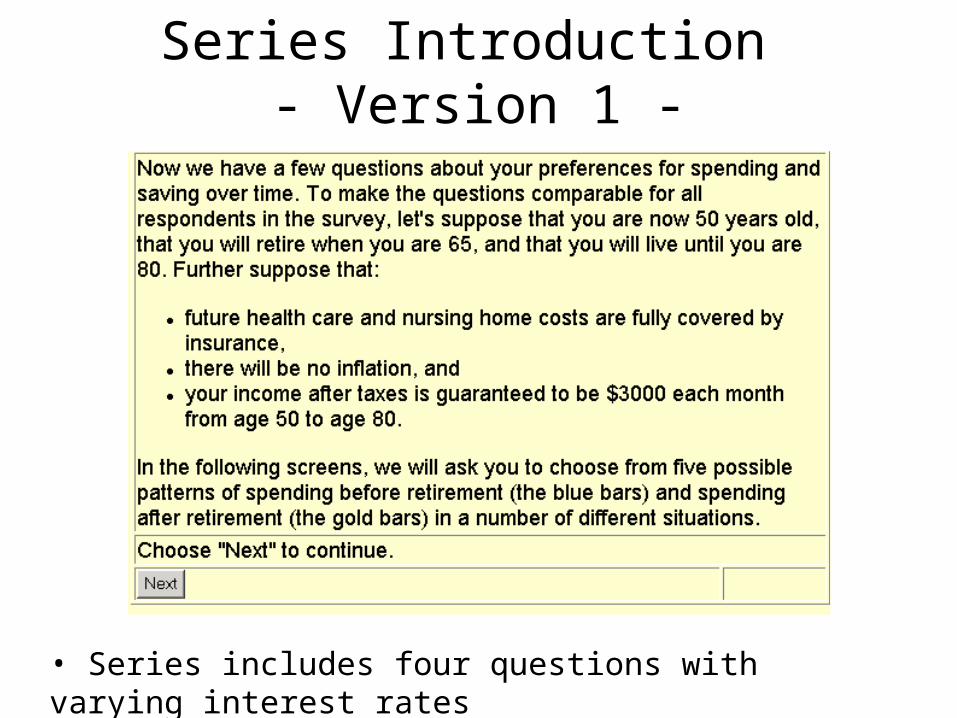
Series Introduction - Version 1 -
• Series includes four questions with varying interest rates
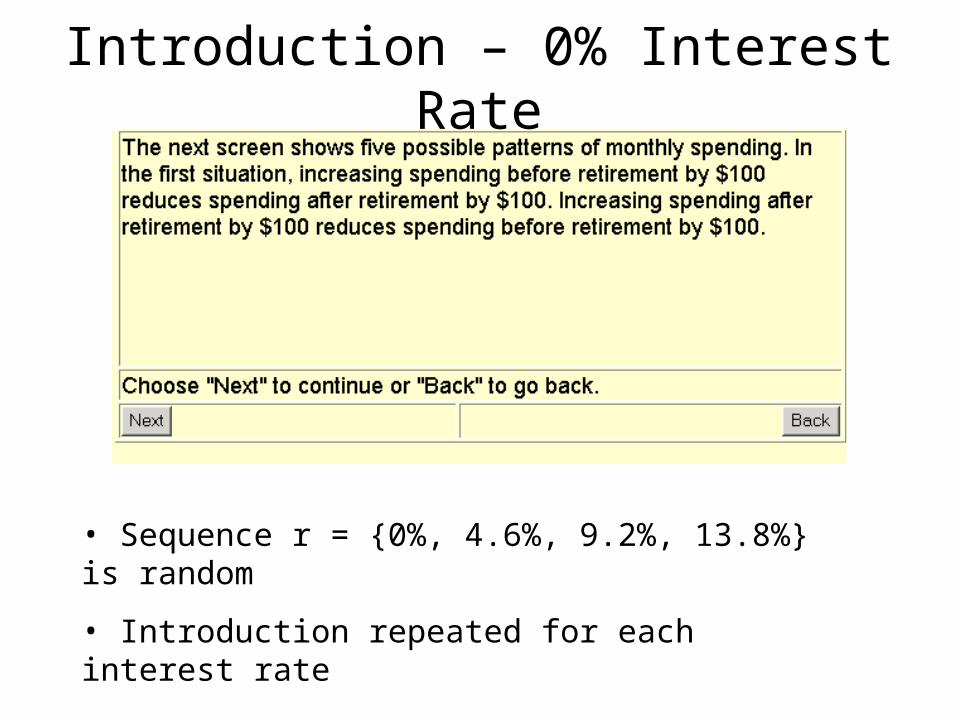
Introduction – 0% Interest Rate
• Sequence r = {0%, 4.6%, 9.2%, 13.8%} is random
• Introduction repeated for each interest rate
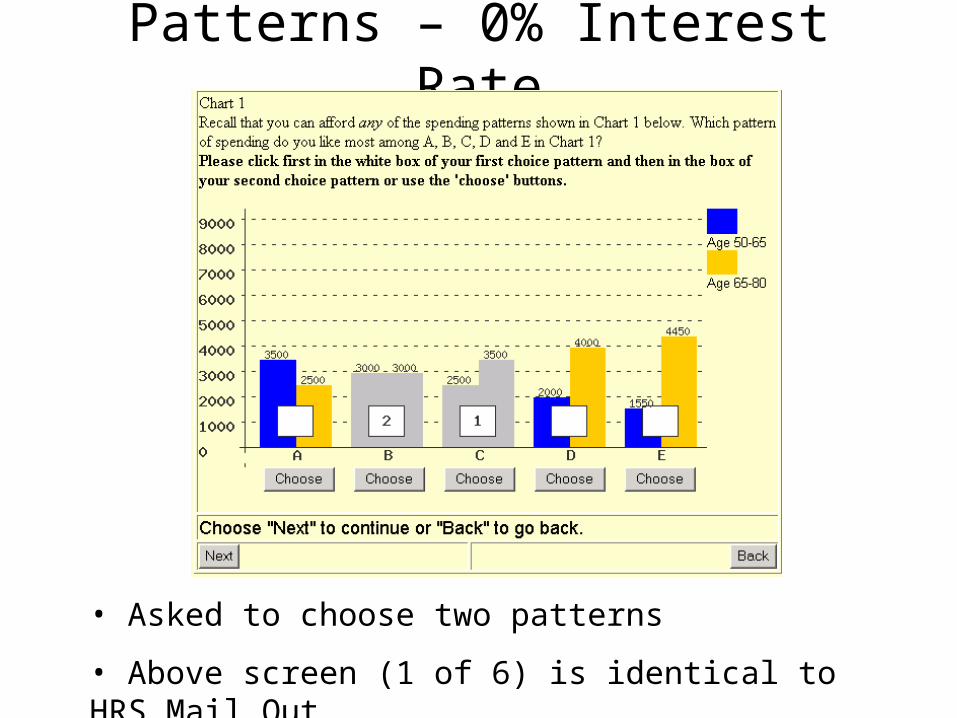
Patterns – 0% Interest Rate
• Asked to choose two patterns
• Above screen (1 of 6) is identical to HRS Mail Out
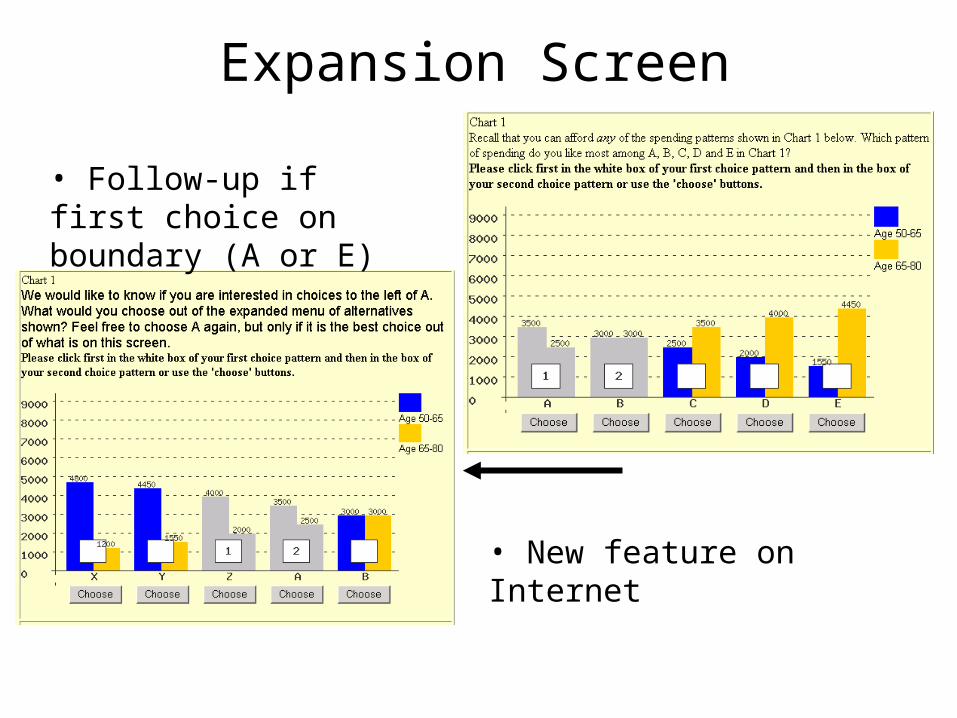
Expansion Screen
• Follow-up if first choice on boundary (A or E)
• New feature on Internet
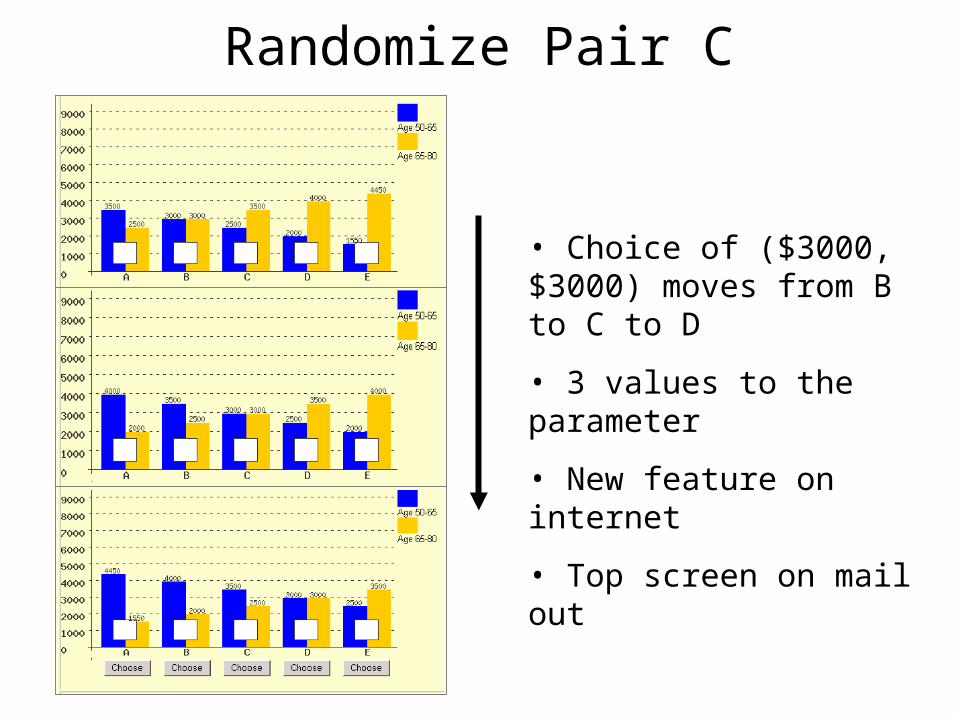
Randomize Pair C
• Choice of ($3000, $3000) moves from B to C to D
• 3 values to the parameter
• New feature on internet
• Top screen on mail out
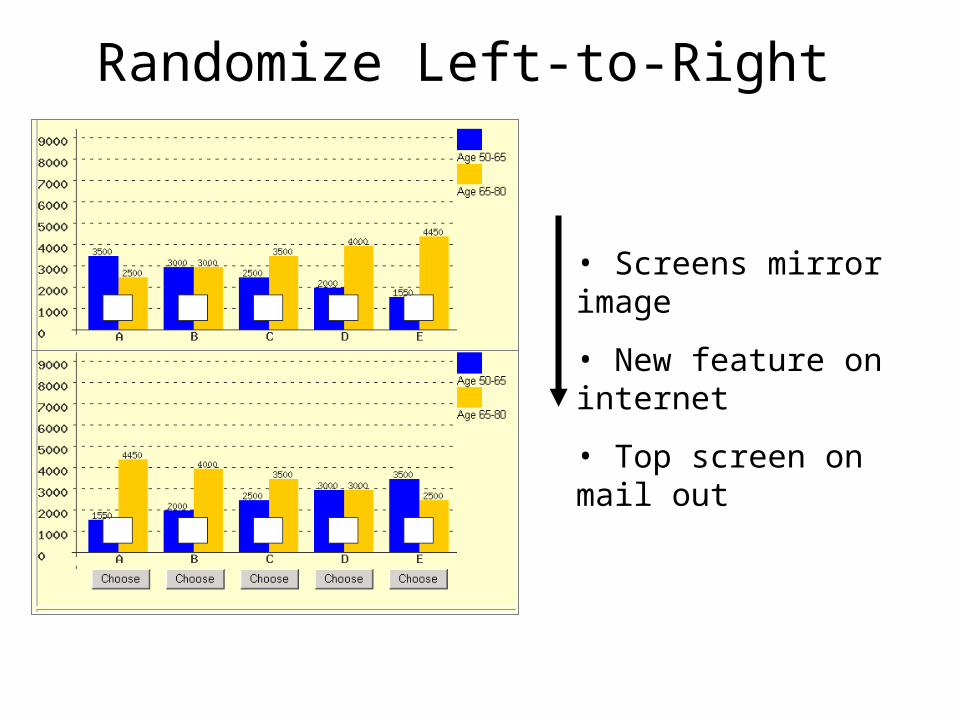
Randomize Left-to-Right
• Screens mirror image
• New feature on internet
• Top screen on mail out
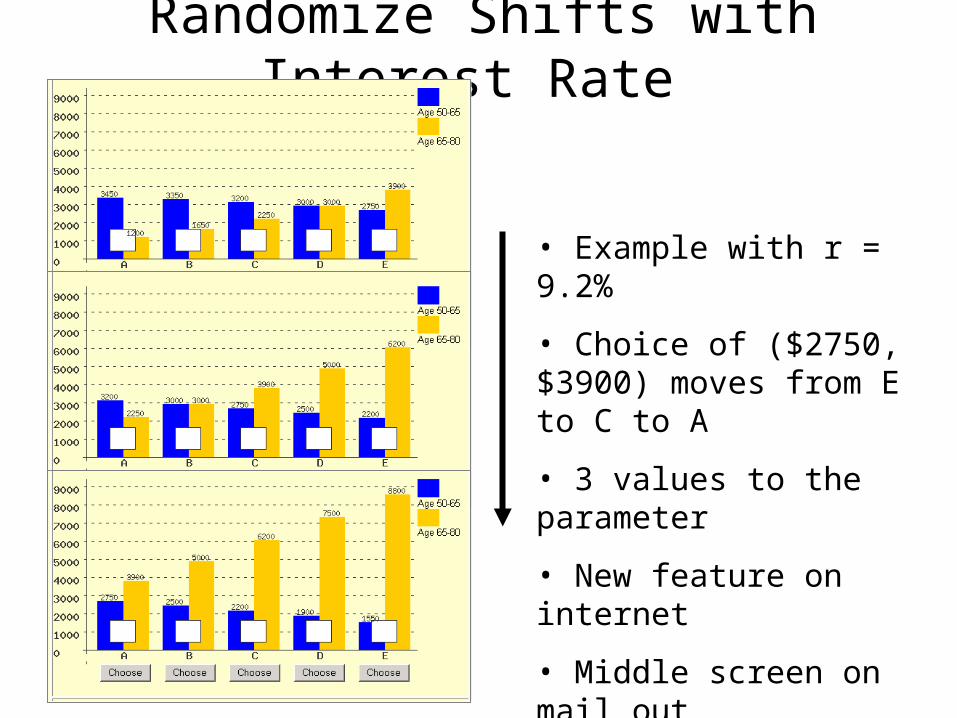
Randomize Shifts with Interest Rate
• Example with r = 9.2%
• Choice of ($2750, $3900) moves from E to C to A
• 3 values to the parameter
• New feature on internet
• Middle screen on mail out
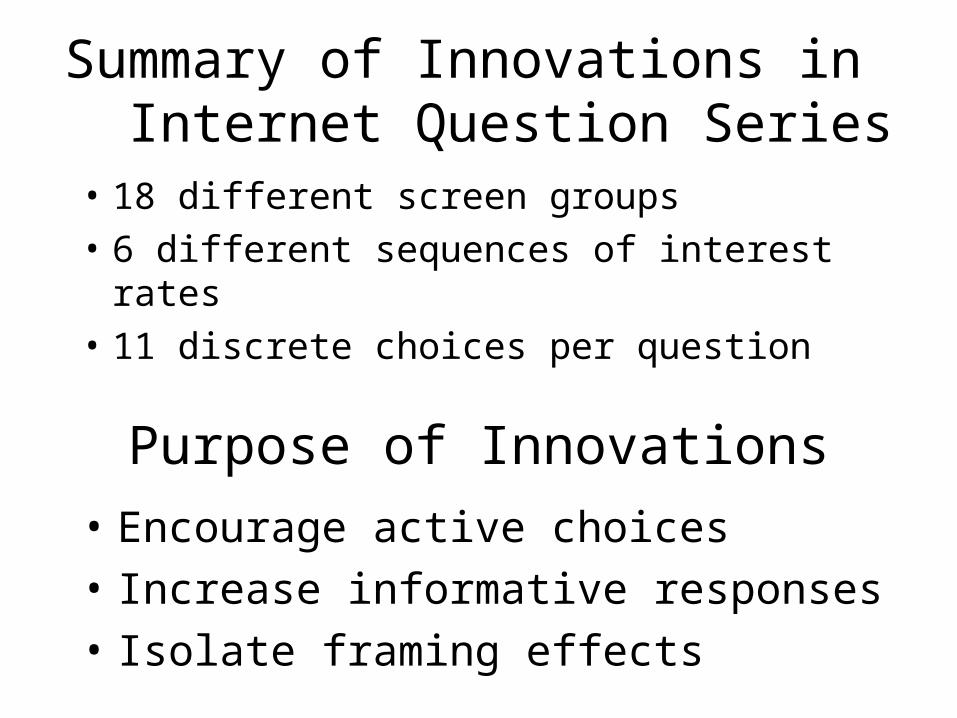
Summary of Innovations in Internet Question Series
• 18 different screen groups
• 6 different sequences of interest rates
• 11 discrete choices per question
• Encourage active choices
• Increase informative responses
• Isolate framing effects
Purpose of Innovations
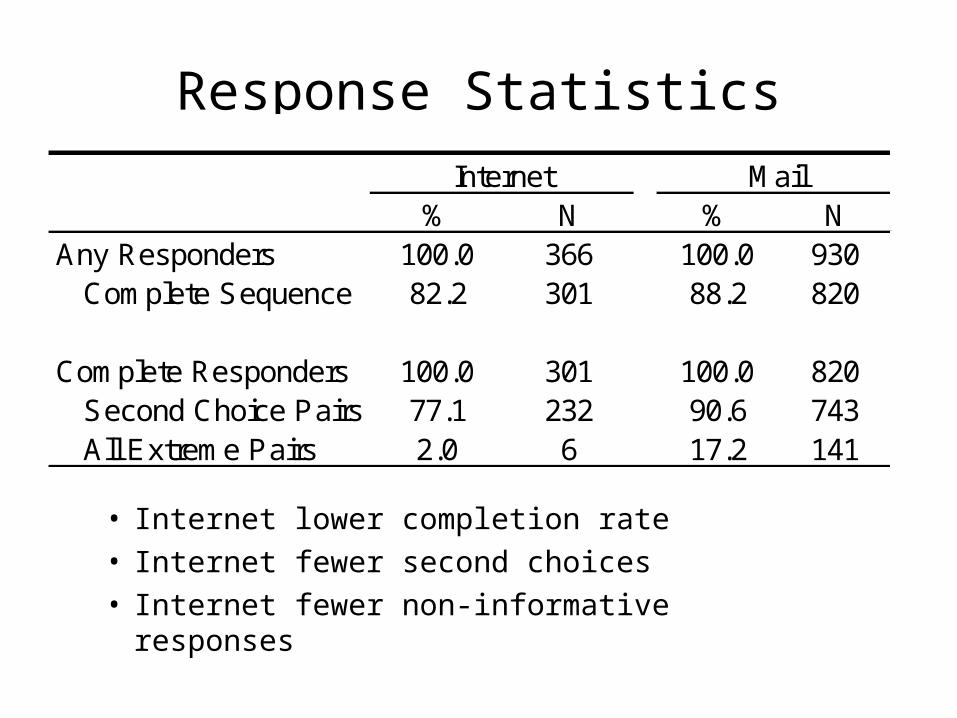
Response Statistics
% N % NAny Responders 100.0 366 100.0 930 Complete Sequence 82.2 301 88.2 820
Complete Responders 100.0 301 100.0 820 Second Choice Pairs 77.1 232 90.6 743 All Extreme Pairs 2.0 6 17.2 141
Internet Mail
• Internet lower completion rate• Internet fewer second choices• Internet fewer non-informative responses
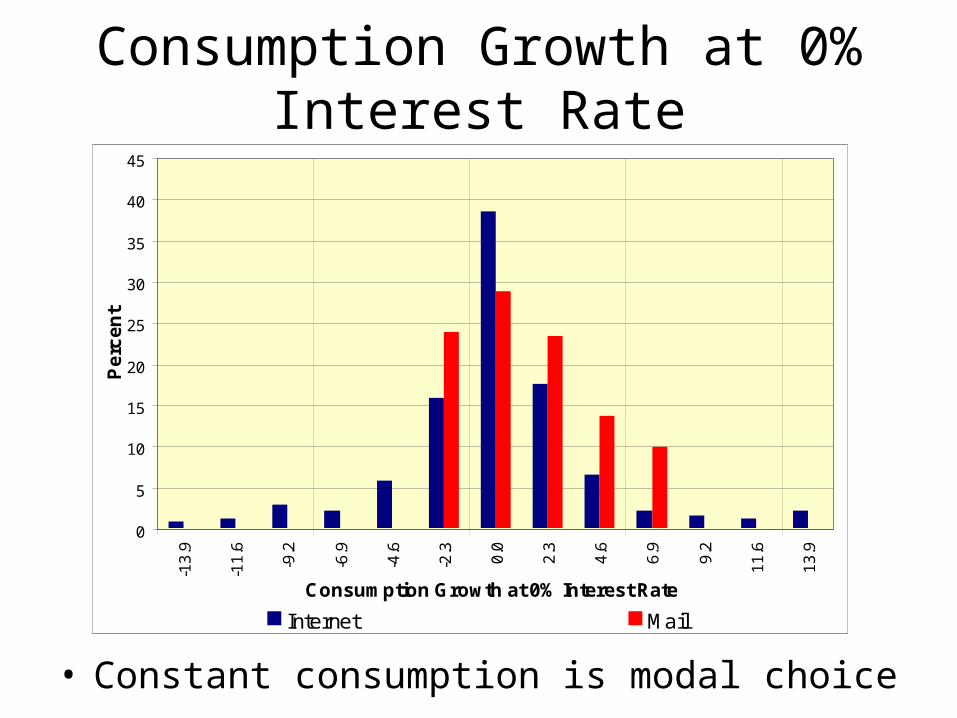
Consumption Growth at 0% Interest Rate
0
5
10
15
20
25
30
35
40
45
-13
.9
-11
.6
-9.2
-6.9
-4.6
-2.3
0.0
2.3
4.6
6.9
9.2
11
.6
13
.9
Consumption Growth at 0% Interest Rate
Pe
rce
nt
Internet Mail
• Constant consumption is modal choice
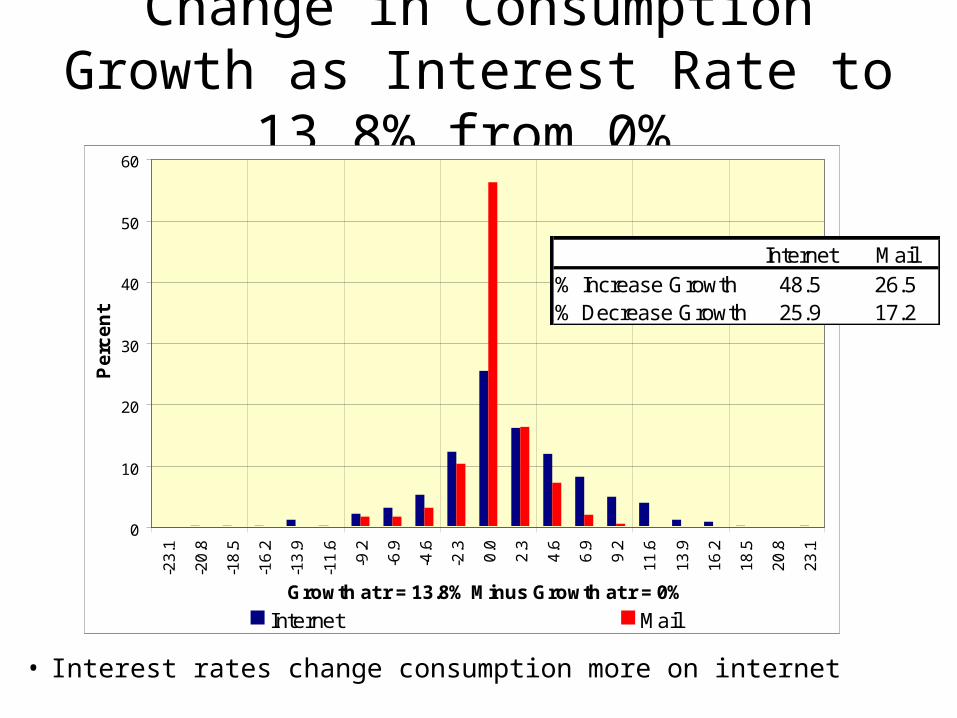
Change in Consumption Growth as Interest Rate to 13.8% from 0%
0
10
20
30
40
50
60-2
3.1
-20
.8
-18
.5
-16
.2
-13
.9
-11
.6
-9.2
-6.9
-4.6
-2.3
0.0
2.3
4.6
6.9
9.2
11
.6
13
.9
16
.2
18
.5
20
.8
23
.1
Growth at r = 13.8% Minus Growth at r = 0%
Pe
rce
nt
Internet Mail
• Interest rates change consumption more on internet
Internet Mail% Increase Growth 48.5 26.5% Decrease Growth 25.9 17.2
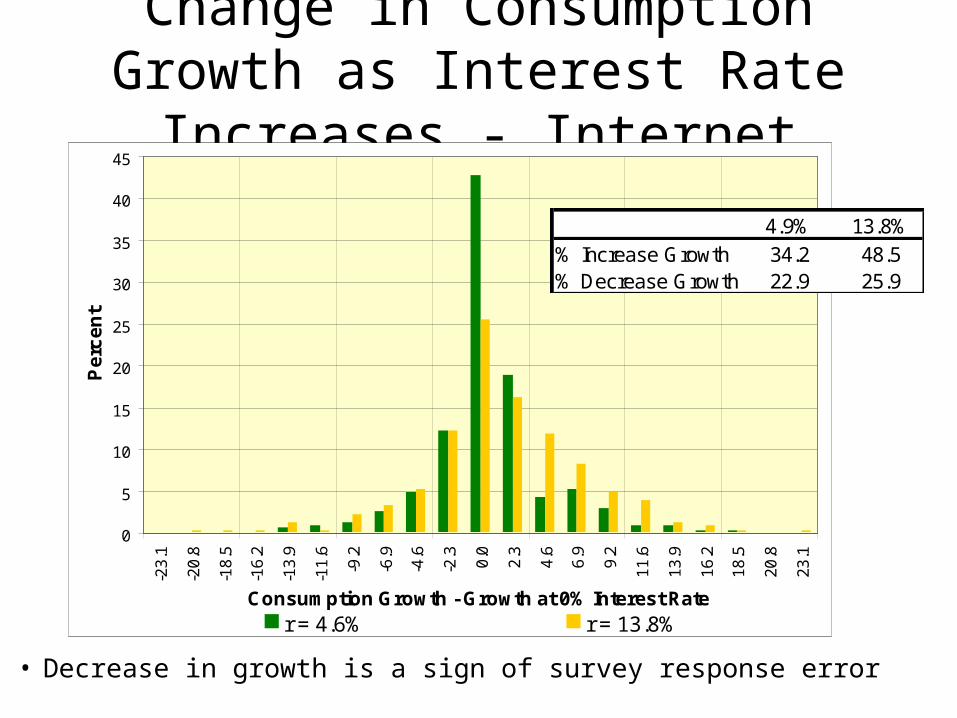
Change in Consumption Growth as Interest Rate Increases - Internet
• Decrease in growth is a sign of survey response error
0
5
10
15
20
25
30
35
40
45-2
3.1
-20
.8
-18
.5
-16
.2
-13
.9
-11
.6
-9.2
-6.9
-4.6
-2.3
0.0
2.3
4.6
6.9
9.2
11
.6
13
.9
16
.2
18
.5
20
.8
23
.1
Consumption Growth - Growth at 0% Interest Rate
Pe
rce
nt
r = 4.6% r = 13.8%
4.9% 13.8%% Increase Growth 34.2 48.5% Decrease Growth 22.9 25.9
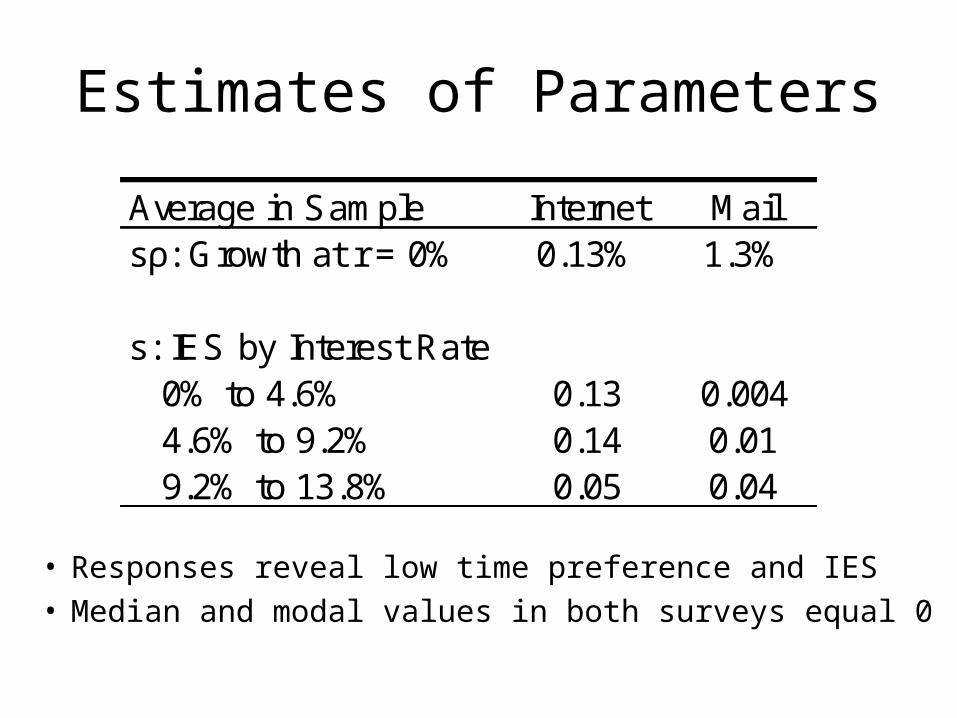
Estimates of Parameters
Average in Sample Internet Mailsρ: Growth at r = 0% 0.13% 1.3%
s: IES by Interest Rate 0% to 4.6% 0.13 0.004 4.6% to 9.2% 0.14 0.01 9.2% to 13.8% 0.05 0.04
• Responses reveal low time preference and IES• Median and modal values in both surveys equal 0
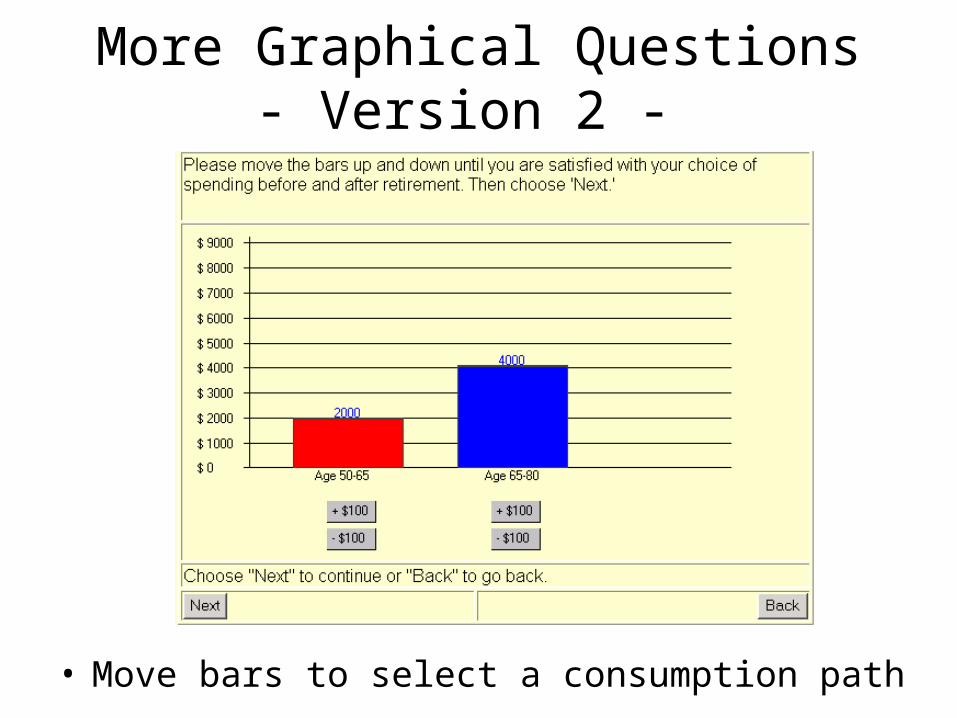
More Graphical Questions- Version 2 -
• Move bars to select a consumption path
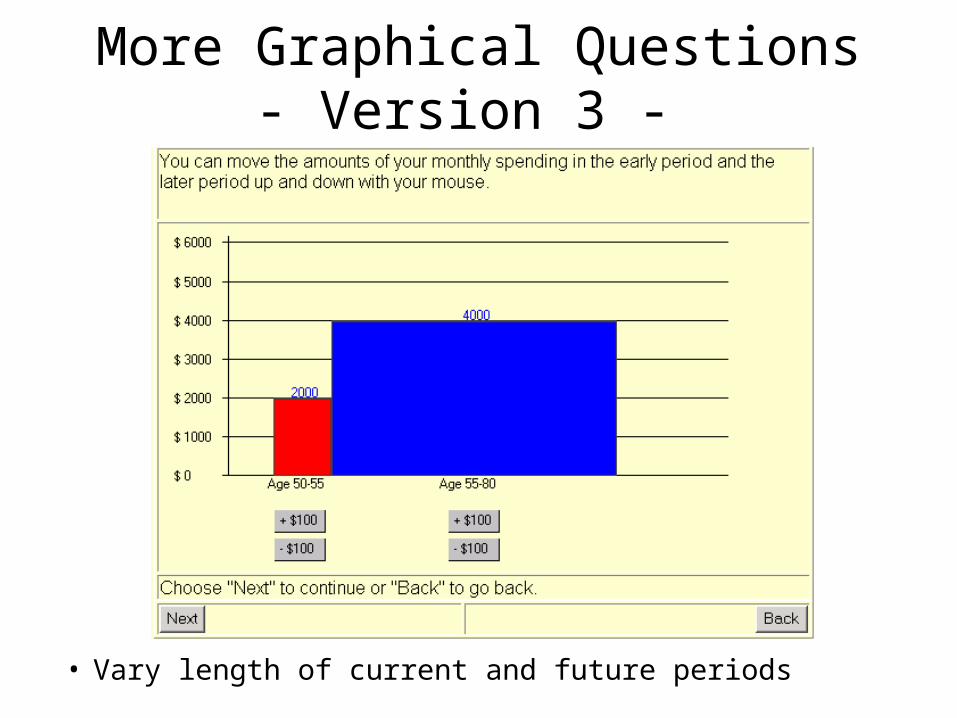
More Graphical Questions- Version 3 -
• Vary length of current and future periods
Implementation Issues
• Graphics require more programming– More programming → more bugs– Coordinate programmer and analyst
• Internet captures more data: number of clicks and interim responses
Internet expands preference measures, but
Extensions / Renewal
• Refine and analyze data on IES, time preference, and risk tolerance – Improve instrument and output delivery– Estimate statistical model
• Measure complementary parameters– Diminishing marginal utility– Labor supply elasticities– Retirement elasticity
Recommended