Υπέρταση και ∆ιαβήτης
NNικόλαοςικόλαος ΚουρεµένοςΚουρεµένος
MD, PhD, FESH
Cardiology Dep. Asklepeion Hospital, Athens, Greece

CV Prevention in EURO ASPIRE I, II & III
I II III
58.1 58.3
60.9
94.5
76.7
Kotseva, Lancet, 2009, 373, 923-940
Smokers
p = NS
Obesity
p < 0.001Hypertension
p = NS
Diabetes
p = 0.004
Raised TC
2525252525252525
20.3
21.2
18.2
25
32.6
38
2525252525252525
17.4 20.1
28
2525252525252525
46.8


Hypertension Dyslipidemia RAASDiabetes Heart Rate
Smoking Obesity SNS Hyperhomocysteinemiaa CRP Uric Acid
ENDOTHELIAL DYSFUNCTIONENDOTHELIAL DYSFUNCTION
Monocytes
MacrophagesMacrophages
EndotheliumEndothelium
VasoconstrictionVasoconstrictionCell adhesion Cell adhesion
and/or infiltrationand/or infiltrationProliferationProliferation Lipid accumulationLipid accumulation
Ischemic Heart DiseaseIschemic Heart Disease Cerebrovascular DiseaseCerebrovascular Disease Peripheral Vascular DiseasePeripheral Vascular Disease
MacrophagesMacrophages
↑ Endothelial Permeability
↑ LP contact with vessel wall
↑ Adhesion to endothelial cells
↑ O·2 generation
↑ Cytokines
↑ Uptake of oxidized LDL
↑ Tissue Factor
↑ PAI-1
↑ ICAM, VCAM
↑ MCP-1
↓ eNOS
↓ Prostacyclin
↑ Catecholamines
↑ Angiotensin II
↑ VSMC Proliferation
Manolis AJ. ESH Textbook 2008


Diabetic
Retinopathy
Leading cause
of blindness
in adults Cardiovascular
Stroke
2- to 4-fold increase in cardiovascular
mortality and stroke5
Type 2 diabetes is associated with serious
complications
in adults
Diabetic
Nephropathy
Leading cause of
end-stage renal disease3,4
Cardiovascular
Disease
Diabetic
Neuropathy
Leading cause of
non-traumatic lower
extremity amputations7,8
8/10 individuals with
diabetes die from CV
events6

Hypertensive Patients with DM
Are at Increased CV Risk
Men with DM (n=5163)MRFIT, N=347,976
250
CVD Deaths/10,000
Years
200
300 Men without DM (n=342,815)
CV = Cardiovascular
Stanler J et al. Diabetes Care. 1993;16: 434-444
50
150
<120 120-139 140-159 160-179
Systolic BP (mmHg)
CVD Deaths/10,000
Person-Years
0
100
180-199 ≥200

Risk Factor for the Development of AF
38-year follow-up of the Framingham studyadjusted odds ratio
3
4
Risk factors
Age-adjusted odds ratio
Cigarettes
1
2
0
Diabetes ECG LVH Hypertension BMI Alcohol

ESH/ESC GuidelinesStratification of CV Risk in Four Categories
High
added risk
Moderate
added risk
Low Low
added riskadded risk
Other Risk Factors,
OD
or Disease
Grade 1 HT
SBP 140-159
or DBP 90-99
Grade 2 HT
SBP 160-179
or DBP 100-109
Grade 3 HT
SBP ≥ 180
or DBP ≥ 110
Average
risk
Average
risk
Normal
SBP 120-129
or DBP 80-84
High Normal
SBP 130-139
or DBP 85-89
No other risk factors Low
added risk
Very high
added risk
Very high
added risk
Very high
added risk
Very high
added risk
Very high
added risk
High
added riskHigh
added risk
Moderate
added risk
Moderate
added risk
3 or more Risk Factors,
MS, OD or Diabetes
Very high
added risk
Very high Very high
added riskadded risk
High
added riskModerate
added risk
Low
added risk
LowLow
added riskadded risk1-2 risk factors
Established CV
or renal disease
Moderate
added risk
Cardiovascular event rate in 10 yearsCardiovascular event rate in 10 years
Risk for cardiovascular death in
10 years (SCORE)
Risk for cardiovascular death in
10 years (SCORE)

Lifestyle Changes
�weight reduction,
�adopting the Dietary approaches to Stop Hypertension (DASH)
eating plan,
�limiting alcohol consumption,
�smoking cessation, and, importantly,
�limiting salt intake to < 2.4 g/day
�engaging in physical activity,
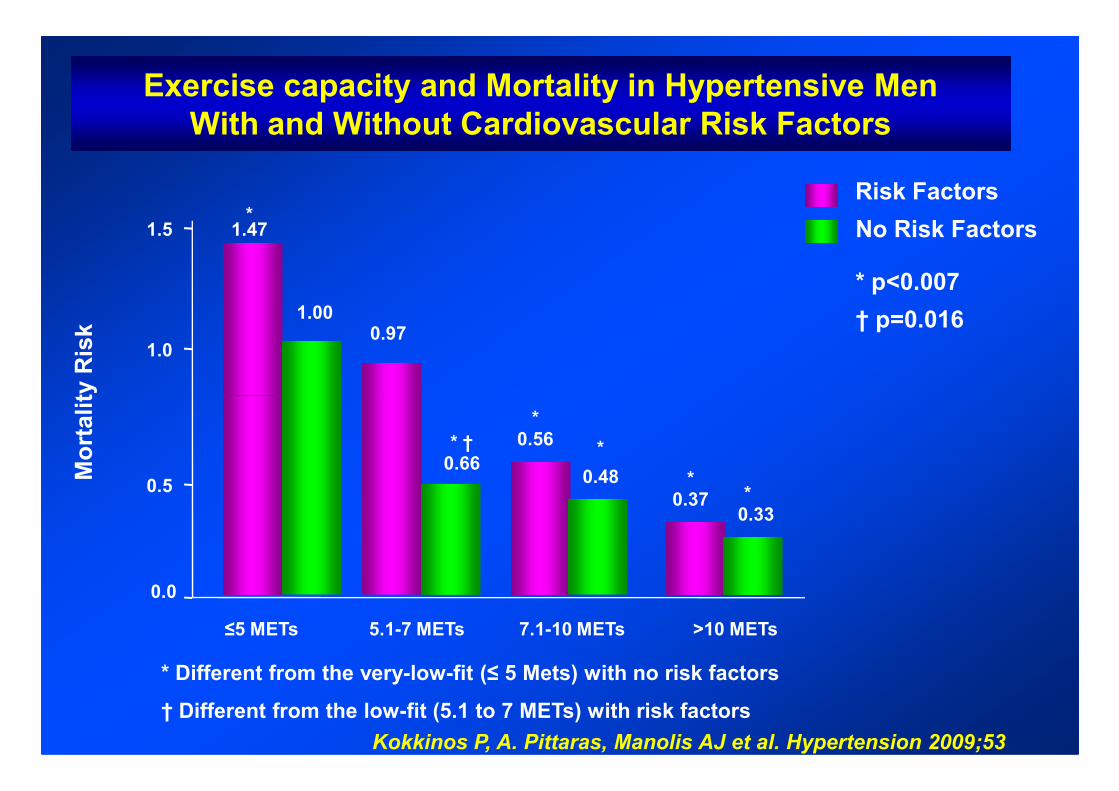
Εxercise capacity and Mortality in Hypertensive Men
With and Without Cardiovascular Risk Factors
Risk Factors
No Risk Factors
* p<0.007
† p=0.016
1.0
1.5*
1.000.97
1.47
Mortality Risk
Kokkinos P, A. Pittaras, Manolis AJ et al. Hypertension 2009;53
0.0
0.5
≤5 METs
0.660.48
0.370.33
0.56
5.1-7 METs 7.1-10 METs >10 METs
*
*
**
* †
* Different from the very-low-fit (≤ 5 Mets) with no risk factors
† Different from the low-fit (5.1 to 7 METs) with risk factors
Mortality Risk

Exercise Capacity and Mortality in Diabetics
Kokkinos P, Manolis AJ et al. Diabetes Care 2009
Which is the Blood Pressure Target?

GOALS OF ANTIHYPERTENSIVE
TREATMENT
BP reduction

2007 ESH/ESC Guidelines
BP Thresholds / Targets (mmHg)
General HT population
≥ 140/90
High risk patients
(CAD/Cerebrovasc. disease/
Diabetes/Renal dysfunction)
≥ 130/85Threshold ≥ 140/90
< 140/90
≥ 130/85
< 130/80
Threshold
Target
Concept of flexible threshold/target
for treatment in relation to total CV risk

Diabetes: Tight Glucose vs Tight BP Control and CV
Outcomes in UKPDS
Stroke
Any Diabetic
Endpoint
DM
Deaths
Microvascular
Complications
-10
0
% Reduction In Relative Risk
10%12%
5%
-50
-40
-30
-20
% Reduction In Relative Risk
Tight Glucose Control(Goal <6.0 mmol/l or 108 mg/dL)
Tight BP Control(Average 144/82 mmHg)
32%
37%
32%
24%
44%
Bakris GL, et al. Am J Kidney Dis. 2000;36(3):646-661.
*
*
*
**P <0.05 compared to tight glucose control
20
25
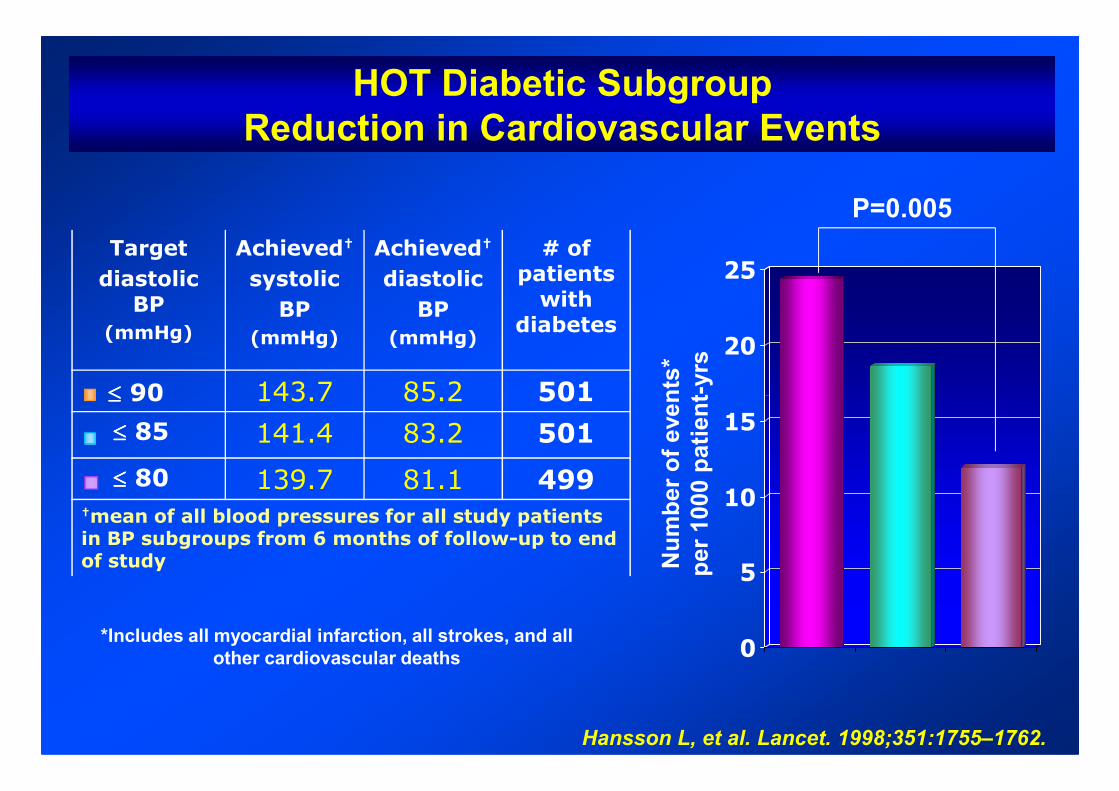
HOT Diabetic Subgroup
Reduction in Cardiovascular Events
Number of events*
per 1000 patient-yrs
P=0.005
Target
diastolic BP
(mmHg)
Achieved†
systolic
BP
(mmHg)
Achieved†
diastolic
BP
(mmHg)
# of patients with
diabetes
≤≤≤≤ 90 143.7 85.2 501
0
5
10
15
Hansson L, et al. Lancet. 1998;351:1755–1762.
Number of events*
per 1000 patient
*Includes all myocardial infarction, all strokes, and all
other cardiovascular deaths
≤≤≤≤ 90 143.7 85.2 501
≤≤≤≤ 85 141.4 83.2 501
≤≤≤≤ 80 139.7 81.1 499†mean of all blood pressures for all study patients in BP subgroups from 6 months of follow-up to end of study

AIM: A multicenter, randomized, comparative trial to test if
the intensive control of
� glycaemia,
ACCORD
� blood pressure,
� lipids,
can reduce the risk of major cardiovascular events in high
risk type 2 diabetic patients.

140
130
(mmHg)Standard
Mean 133.5 mmHg
1.0
0.8
0.60.0
0.1
0.2 Standard
Intensive
Proportion with events
BP and CV Events in ACCORD
SBP Primary outcome
The ACCORD Study Group, NEJM 2010; March 14
120
110
0
0 1 2 3 4 5 6 7 8
Years since randomization
Intensive
Mean 119.3 mmHg
Mean no. of
medications
prescribed
Intensive
Standard
No. of patients
Intensive
Standard
3.2
1.9
2174
2208
3.4
2.1
2071
2136
3.4
2.1
1973
2077
3.5
2.2
1792
1860
3.5
2.2
1150
1241
3.5
2.3
445
504
3.4
2.3
156
203
3.4
2.3
156
201
0.4
0.2
0.00 1 2 3 4 5 6 7 8
0 1 2 3 4 5 6 7 8
0.0
Years
P = 0.20
DBP: 70 vs 62 mm Hg

Nonfatal MI
HR RR
0.87
P
0.25
Relative Risk of Stroke / MI in ACCORD
Stroke
0.5 1.0 2.0
Favours standard therapyFavours intensive therapy
0.59 0.01
Intensive: SBP 119.3 mmHg
Standard: SBP 133.5 mmHg
The ACCORD Study Group, NEJM 2010
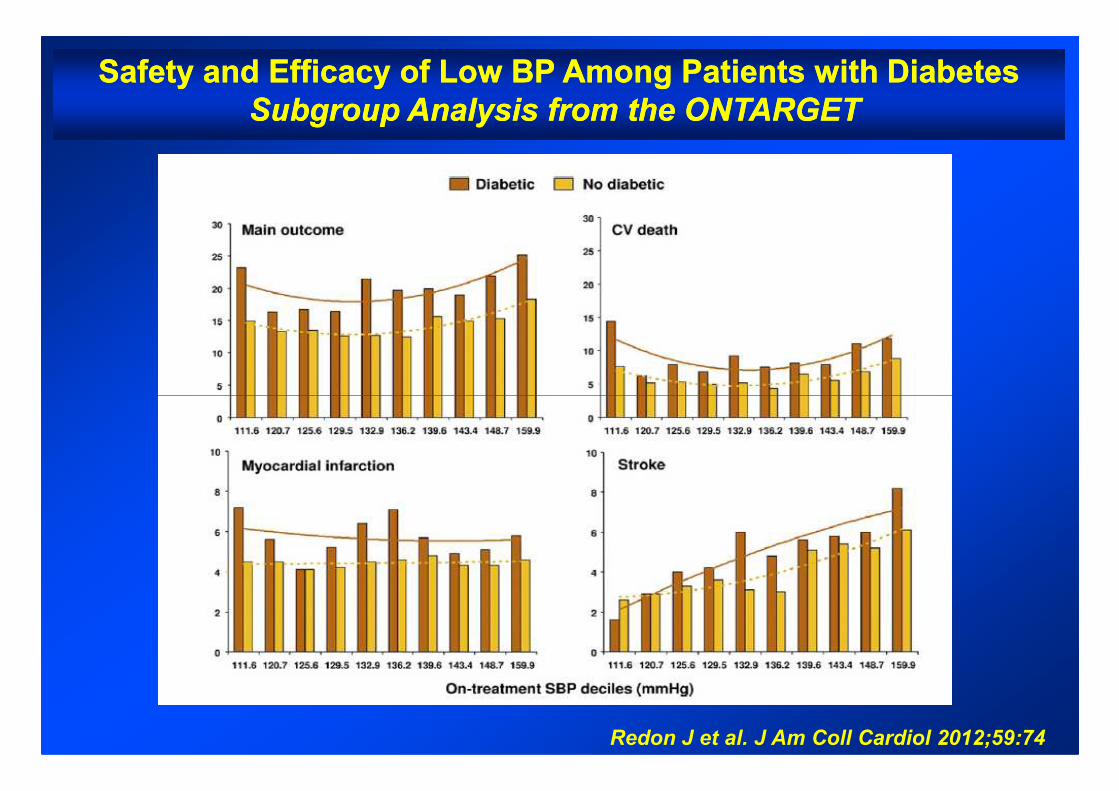
Safety and Efficacy of Low BP Among Patients with DiabetesSafety and Efficacy of Low BP Among Patients with Diabetes
Subgroup Analysis from the ONTARGET Subgroup Analysis from the ONTARGET
Redon J et al. J Am Coll Cardiol 2012;59:74

150
150
149150
160
162
154155
160
170
Diabetes PreviousPrevious CVDCVD
SBP (SBP (mmHg)) SBP (SBP (mmHg))
PLPL
Stroke CHD
Achieved BP in TrialsAchieved BP in Trials
132
129130
124
136
130130
122
140
136
130
124
133
128
138
135
140
136
141
132
143
100
110
120
130
140
136
133133
119
144
141
145
143144
140
137
128
138
132
140
134
143
134
153
143
139
154
144
155
145
148
145
110
120
130
140
150
BP BP ∆∆∆∆ ∆∆∆∆ BenefitBenefit No benefit No benefit
Zanchetti, Grassi, Mancia J Hypert 2009; 27: 923
HOTHOTSHEPSHEP
UKPDSUKPDS S. S. EurEur ADVADV ABCDABCDRENRENHOPEHOPE PROGPROG
HTHT
IDNTIDNT
AMAMNTNT IRIR
IDNTIDNT
PLPL
ActiveActive
PATSPATS
ActiveActive
PROGPROG
ACCACC
PROFPROF
HOPEHOPE
EUEU
CAMCAM--AMAM PREVPREV
ACTACT
CAMCAM--ENEN
PEAPEATRTRACRDACRD
NAVNAV
preDMpreDM

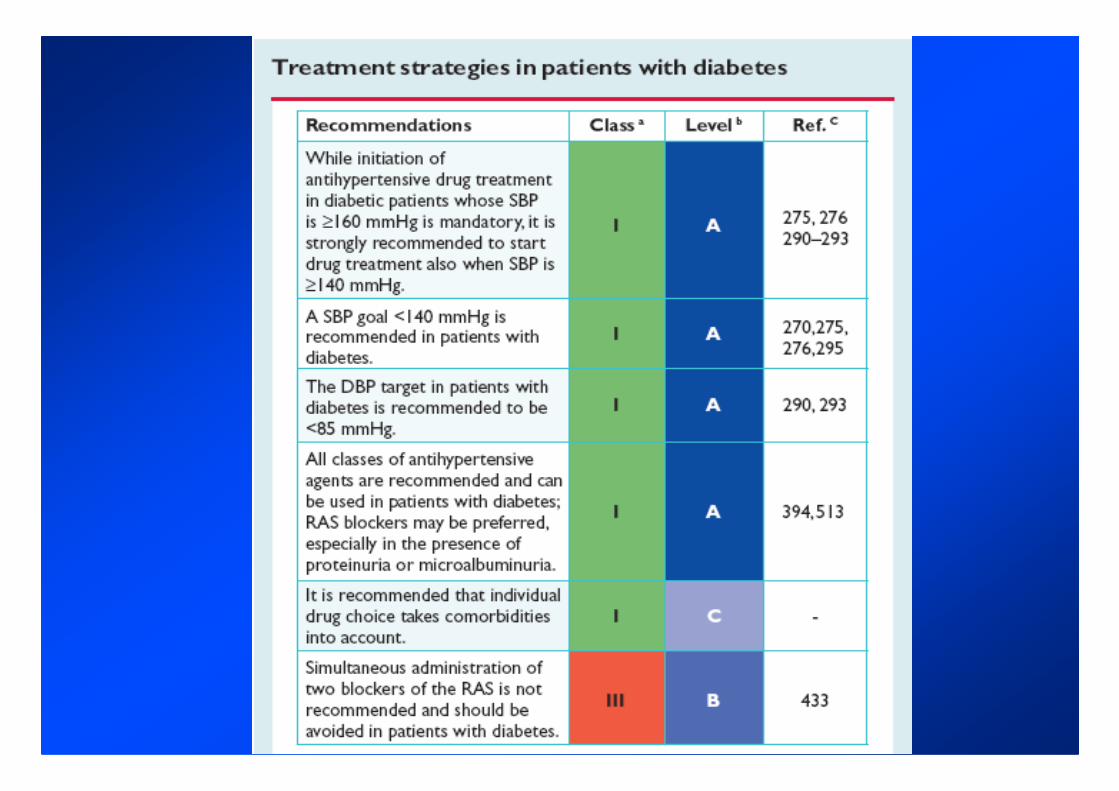
Diabetes Mellitus - Drug Treatment Recommendations
� Initiation at SBP ≥ 140 mmHg
� Target BP < 140/85 mmHg
2013 ESH/ESC Hypertension Guidelines2013 ESH/ESC Hypertension Guidelines
� All drug classes are useful
� Combination treatment most often to be considered

Choice Of Antihypertensive Drugs -
Conclusions From 2013 (And 2003 And 2007) Guidelines
2013 ESH/ESC Hypertension Guidelines
� The main benefits of antihypertensive treatment are due to lowering BP
“per se” and are largely independent of the drug employed
� Although meta-analyses occasionally claim superiority of one class for
some outcomes this largely depends on selection bias of trials. The
largest meta-analyses do not show clinically relevant between-class
differences
� Current Guidelines reconfirm that the following drugs classes are all
suitable for initiation and maintenance of antihypertensive treatment
either as monotherapy or in some combinations with each other (IA)
�Diuretics (thiazides / chlorthalidone / indapamide)
�Beta-blockers
�Calcium antagonists
�ACE-inhibitors
�Angiotensin receptor blockers

Target BP
(mm Hg)
Average Number of Antihypertensive Agents
1
UKPDS DBP <85
ABCD DBP <75
MDRD MAP <92
Trial 2 3 4
Multiple Antihypertensive Agents
are Needed to Achieve Target BP
AASK MAP <92
MDRD MAP <92
HOT DBP <80
IDNT SBP/DBP 135/85
UKPDS = United Kingdom Prospective Diabetes Study;
ABCD = Appropriate Blood Pressure Control in Diabetes;
MDRD = Modification of Diet in Renal Disease; HOT = Hypertension Optimal Treatment;
AASK = African American Intervention Study of Kidney Disease;
IDNT = Irbesartan Diabetic Nephropathy Trial.Bakris GL et al. Am J Kidney Dis. 2000;36:646-661.
Lewis EJ et al. N Engl J Med. 2001;345:851-860.

ACCOMPLISH
SBP over time Kaplan-Meier for primary endpoint
mmHg
ACEI / HCTZN=5733
CCB / ACEI
Cumulative event rate
20% Risk ReductionACEI / HCTZ
CCB / ACEI650
Month
5731 5387 5206 4999 4804 4285 2520 1045
5709 5377 5154 4980 4831 4286 2594 1075Pts.
*Mean values are taken at 30 months F/U visit
129.3 mmHg
130 mmHg
Difference of 0.7 mmHg p<0.05*
DBP: 71.1 DBP: 72.8
CCB / ACEIN=5713
HR (95% CI): 0.80 (0.72, 0.90)
Time to 1st CV morbidity/mortality (days)
p = 0.0002
526

ACCOMPLISH ACCOMPLISH TrialTrial
� 50% of patients were obese
� 60% of patients had Diabetes Mellitus
� 97% of patients were treated previously for
hypertensionhypertension
� 74% of patients were treated with ≥ 2
antihypertensive agents
� Only 37.5% of patients were controlled to <140/90
mmHg

2013 ESH/ESC Guidelines
Combinations Between Some Classes
of Antihypertensive Drugs
Thiazide diureticsThiazide diuretics
ßß--blockersblockers ATAT11--receptorreceptor
antagonistsantagonists
Thiazide diureticsThiazide diuretics
ATAT11--receptorreceptor
antagonistsantagonists
ACCOMPLISHACCOMPLISH
ADVANCEADVANCE
HYVETHYVET
ASCOTASCOT
ONTARGETONTARGET
ACE inhibitorsACE inhibitors
Calcium Calcium
antagonistsantagonists
αα--blockersblockers
ACE inhibitorsACE inhibitors
Calcium Calcium
antagonistsantagonists
•• Pronounced antihypertensive effectPronounced antihypertensive effect
•• CV protectionCV protection
•• Optimal tolerabilityOptimal tolerability
ACCOMPLISH: ACE-I
ADVANCE: ACE-I
HYVET: ACE-I
ASCOT: ACE-I
ON TARGET: ACE-I

Selecting Patients Suitbale for RAS Blockade with
CCB or Diuretic
RAS blocker
CCB Thiazide diuretic
� Metabolic syndrome
� Impaired fasting glucose
� Family history of diabetes
� Lipid profile alterations
� Need to avoid hypokalemia
� No metabolic problems
� Low risk of developing
diabetes
� Hypervolemia
� Advanced nephropathy

GOALS OF ANTIHYPERTENSIVE
TREATMENT
BP reduction
Risk
Factors
HT
Prevention
NOD
PreventionESRDAF
PreventionCHD StrokeCHF Cognitive
Dysfunction
TOD
regression/
prevention
Dysfunction
Dementia
� LVH
� IMT
� Microalbuminaria
� Arterial stiffness
� Endotheliadysfunction
� Cardiacfibrosis
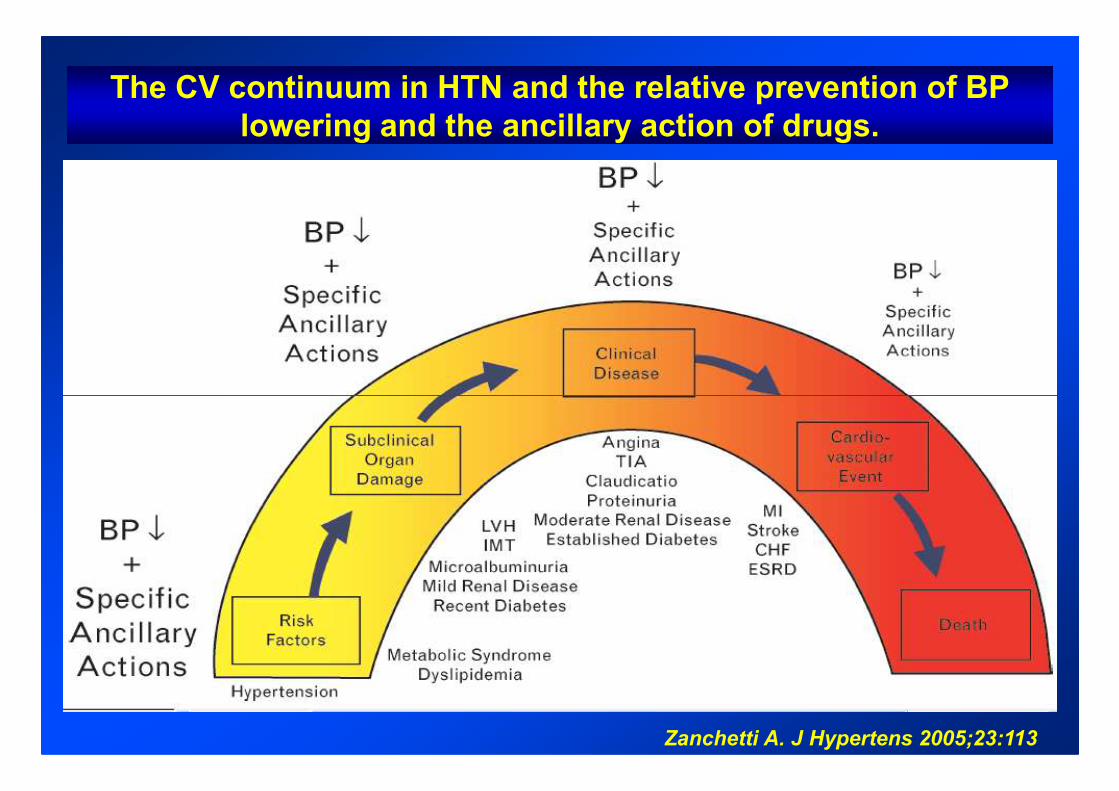
The CV continuum in HTN and the relative prevention of BP
lowering and the ancillary action of drugs.
Zanchetti A. J Hypertens 2005;23:113

Drugs To Be Preferred In Specific Conditions
2013 ESH/ESC Hypertension Guidelines2013 ESH/ESC Hypertension Guidelines

Results of a Meta-analysis for Incident Diabetes -
Twenty-two Clinical Trials of 143,153 Hypertensive Patients
ARB
ACE inhibitor
CCB
0.57 (0.46-0.72) p < 0.0001
0.67 (0.56-0.80) p < 0.0001
0.75 (0.62-0.90) p = 0.002
Elliott WJ, Lancet 2007; 369: 201
Placebo
Beta-blocker
Diuretic
0.77 (0.63-0.94) p = 0.009
0.90 (0.75-1.09) p = 0.30
Referent
50 70 90 126
Odds ratio of incident diabetes Incoherence = 0.000017

2525
3030
20/9320/93
20/8320/83
PP=0.007=0.007
PP=0.048=0.048
25/9425/94
PP=0.002=0.002
Development of new-onset diabetes*
ATAT11 blocker + HCTZ blocker + HCTZ
Calcium Antagonist + ACE inhibitorCalcium Antagonist + ACE inhibitor
Percentage of Patients
Percentage of Patients
Losartan/HCTZ increased the incidence of new onset type 2 Diabetes Mellitus more significantly than verapamil SR/trandolapril following OGTT by study end*
* Fasting blood glucose ≥126mg/dl and/or
2-hour blood glucose levels after OGTT
≥200mg/dl based on ADA definition
00
55
1010
1515
2020
2525
Week 12Week 12 Week 52Week 52
6/866/86
20/9320/93
10/7210/72
End ofEnd ofstudystudy
10/9110/91
Percentage of Patients
Percentage of Patients
Bakris G et al: Diabetes Care. 2006;29(12):2592-7
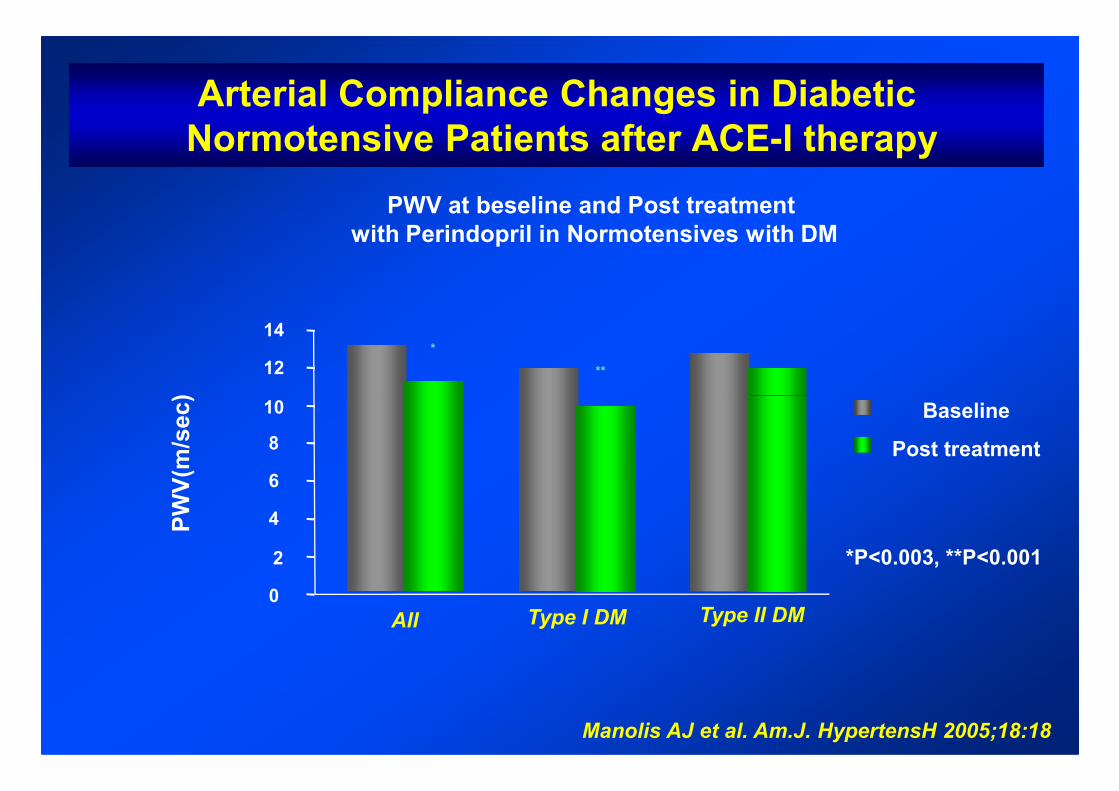
Arterial Compliance Changes in Diabetic
Normotensive Patients after ACE-I therapy
12
14
PWV(m/sec)
*
**
PWV at beseline and Post treatment
with Perindopril in Normotensives with DM
0
2
4
6
8
10
Type II DM
*P<0.003, **P<0.001
Baseline
Post treatment
PWV(m/sec)
Manolis AJ et al. Am.J. HypertensH 2005;18:18
All Type I DM

Ideal Antihypertensive in the Patient With
Diabetes
� Does not worsen Insulin resistance
� Does not cause - Hyperglycemia
- New-onset diabetes
- Dyslipidemia
� Protects kidney and heart
Take Home Messages
� Hypertension occurs in 75% of patients with type 2
diabetes
� Hypertension in patients with type 1 diabetes is also
common
� Hypertension is a promoter of macro- and � Hypertension is a promoter of macro- and
microvascular disease
� There is evidence to link the RAAS with hypertension
in patients with obesity, metabolic syndrome, and
patients with type 2 diabetes

www.hypertension2014.orgwww.hypertension2014.orgwww.hypertension2014.orgwww.hypertension2014.org
See you in Athens !
Recommended