8/9/2019 P SRINIVASA RAJU Portfolio_20141024.pdf
http://slidepdf.com/reader/full/p-srinivasa-raju-portfolio20141024pdf 1/5
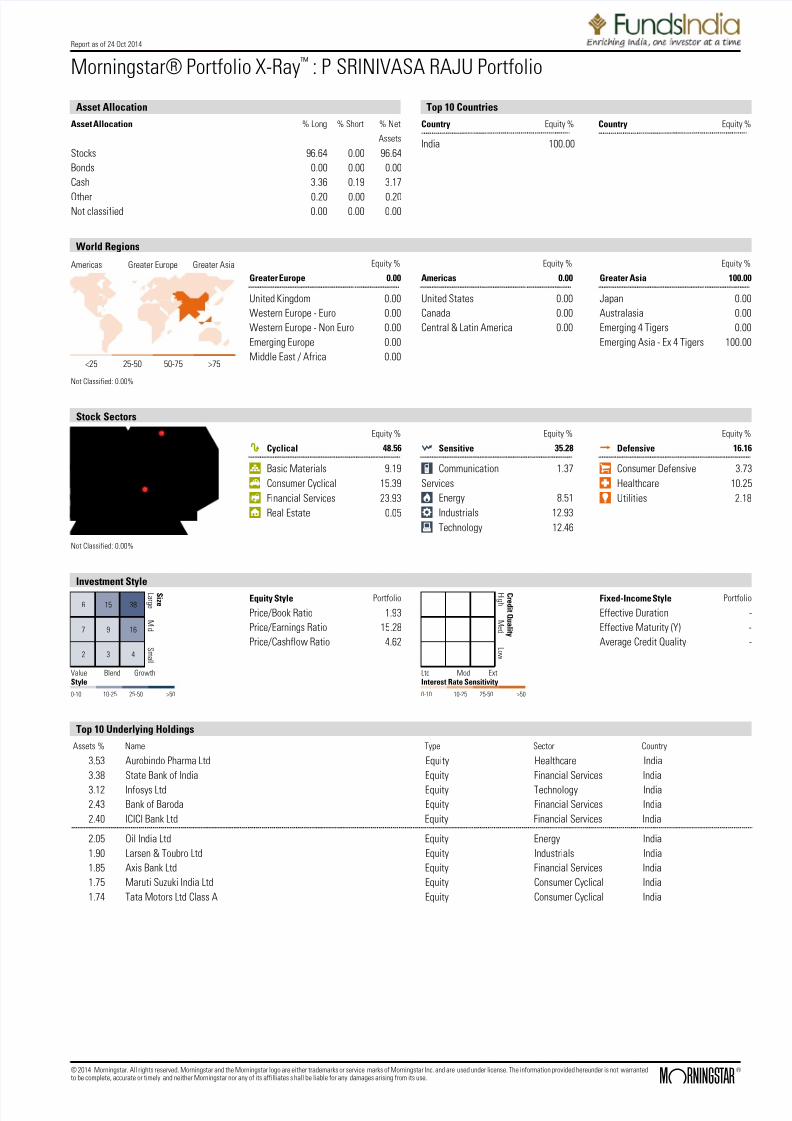
Report as of 24 Oct 2014
Morningstar® Portfolio X-Ray™ : P SRINIVASA RAJU Portfolio
Asset Allocation Asset Allocation % Long % Short % Net
Assets
Stocks 96.64 0.00 96.64
Bonds 0.00 0.00 0.00
Cash 3.36 0.19 3.17
Other 0.20 0.00 0.20Not classified 0.00 0.00 0.00
Top 10 Countries Country Equity %
India 100.00
Country Equity %
World Regions Americas Greater Europe Greater Asia
<25 25-50 50-75 >75
Not Classified: 0.00%
Greater Europe
United Kingdom
Western Europe - Euro
Western Europe - Non Euro
Emerging Europe
Middle East / Africa
Equity %
0.00
0.00
0.00
0.00
0.00
0.00
Americas
United States
Canada
Central & Latin America
Equity %
0.00
0.00
0.00
0.00
Greater Asia
Japan
Australasia
Emerging 4 Tigers
Emerging Asia - Ex 4 Tigers
Equity %
100.00
0.00
0.00
0.00
100.00
Stock Sectors
Cyclical
e f e
n s i v e
S e n s i t i v e
Portfolio
Not Classified: 0.00%
Equity %
h Cyclical 48.56
r Basic Materials 9.19
t Consumer Cyclical 15.39
y Financial Services 23.93
u Real Estate 0.05
Equity %
j Sensitive 35.28
i Communication
Services
1.37
o Energy 8.51
p Industrials 12.93
a Technology 12.46
Equity %
k Defensive 16.16
s Consumer Defensive 3.73
d Healthcare 10.25
f Utilities 2.18
Investment Style
0-10 10-25 25-50 >50
StyleValue Blend Growth
S m a l l
Mi d
L a r g e
S i z e
6 15 38
7 9 16
2 3 4
Equity Style Portfolio
Price/Book Ratio 1.93
Price/Earnings Ratio 15.28
Price/Cashflow Ratio 4.62
0-10 10-25 25-50 >50
Interest Rate SensitivityLtd Mod Ext
L o w
M e d
H i g h
C r e d i t Q u a l i t y
Fixed-Income Style Portfolio
Effective Duration -
Effective Maturity (Y) -
Average Credit Quality -
Top 10 Underlying Holdings Assets % Name Type Sector Country
3.53 Aurobindo Pharma Ltd Equity Healthcare India
3.38 State Bank of India Equity Financial Services India
3.12 Infosys Ltd Equity Technology India
2.43 Bank of Baroda Equity Financial Services India
2.40 ICICI Bank Ltd Equity Financial Services India
2.05 Oil India Ltd Equity Energy India
1.90 Larsen & Toubro Ltd Equity Industrials India
1.85 Axis Bank Ltd Equity Financial Services India
1.75 Maruti Suzuki India Ltd Equity Consumer Cyclical India
1.74 Tata Motors Ltd Class A Equity Consumer Cyclical India
© 2014 Morningstar. All rights reserved. Morningstar and the Morningstar logo are either trademarks or service marks of Morningstar Inc. and are used under license. The information provided hereunder is not warrantedto be complete, accurate or timely and neither Morningstar nor any of its affilliates s hall be liable for any damages arising from its use. ß
®
8/9/2019 P SRINIVASA RAJU Portfolio_20141024.pdf
http://slidepdf.com/reader/full/p-srinivasa-raju-portfolio20141024pdf 2/5
Report as of 24 Oct 2014
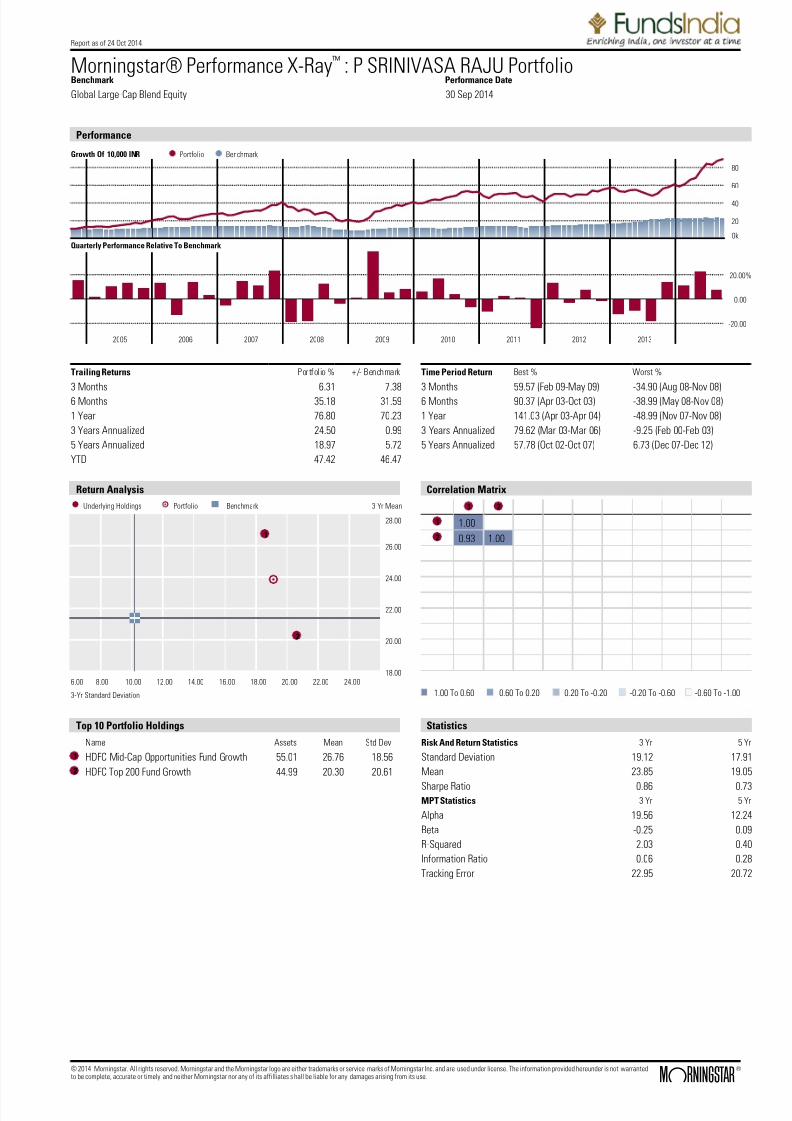
Morningstar® Performance X-Ray™ : P SRINIVASA RAJU PortfolioBenchmark Performance Date
Global Large-Cap Blend Equity 30 Sep 2014
Performance Growth Of 10,000 INR Portfolio Benchmark
0k
20
40
60
80
Quarterly Performance Relative To Benchmark
-20.00
0.00
20.00%
2005 2006 2007 2008 2009 2010 2011 2012 2013
Trailing Returns Portfol io % +/- Benchmark
3 Months 6.31 7.38
6 Months 35.18 31.59
1 Year 76.80 70.23
3 Years Annualized 24.50 0.99
5 Years Annualized 18.97 5.72
YTD 47.42 46.47
Time Period Return Best % Worst %
3 Months 59.57 (Feb 09-May 09) -34.90 (Aug 08-Nov 08)
6 Months 90.37 (Apr 03-Oct 03) -38.99 (May 08-Nov 08)
1 Year 141.03 (Apr 03-Apr 04) -48.99 (Nov 07-Nov 08)
3 Years Annualized 79.62 (Mar 03-Mar 06) -9.25 (Feb 00-Feb 03)
5 Years Annualized 57.78 (Oct 02-Oct 07) 6.73 (Dec 07-Dec 12)
Return Analysis
Underlying Holdings Portfolio Benchmark 3 Yr Mean
3-Yr Standard Deviation
6.00 8.00 10.00 12.00 14.00 16.00 18.00 20.00 22.00 24.0018.00
20.00
22.00
24.00
26.00
28.00
1
2
Correlation Matrix
1 2
1 1.00
2 0.93 1.00
1.00 To 0.60 0.60 To 0.20 0.20 To -0.20 -0.20 To -0.60 -0.60 To -1.00
Top 10 Portfolio Holdings
Name Assets Mean Std Dev
1 HDFC Mid-Cap Opportunities Fund Growth 55.01 26.76 18.56
2 HDFC Top 200 Fund Growth 44.99 20.30 20.61
Statistics Risk And Return Statistics 3 Yr 5 Yr
Standard Deviation 19.12 17.91
Mean 23.85 19.05
Sharpe Ratio 0.86 0.73MPT Statistics 3 Yr 5 Yr
Alpha 19.56 12.24
Beta -0.25 0.09
R-Squared 2.03 0.40
Information Ratio 0.06 0.28
Tracking Error 22.95 20.72
© 2014 Morningstar. All rights reserved. Morningstar and the Morningstar logo are either trademarks or service marks of Morningstar Inc. and are used under license. The information provided hereunder is not warrantedto be complete, accurate or timely and neither Morningstar nor any of its affilliates s hall be liable for any damages arising from its use. ß
®

8/9/2019 P SRINIVASA RAJU Portfolio_20141024.pdf
http://slidepdf.com/reader/full/p-srinivasa-raju-portfolio20141024pdf 3/5
Report as of 24 Oct 2014
Holding Overlap
Holding Overlap The portfolio date is the most recent available for full holdings disclosure in the database. It could be that two funds have a different portfolio date. Please see disclosure pages for details.
Weight in
Portfolio (%)
Underlying Holding / Portfolio Holding ISIN Weight in Holding
(%)
Sector Portfolio Date
3.53 Aurobindo Pharma Ltd INE406A01037 Healthcare
1.93 HDFC Mid-Cap Opportunities Fund Growth INF179K01CR2 3.51 - 30 Sep 2014
1.60 HDFC Top 200 Fund Growth INF179K01BE2 3.56 - 30 Sep 2014
2.43 Bank of Baroda INE028A01013 y Financial Services
1.13 HDFC Mid-Cap Opportunities Fund Growth INF179K01CR2 2.06 - 30 Sep 2014
1.29 HDFC Top 200 Fund Growth INF179K01BE2 2.88 - 30 Sep 2014
2.05 Oil India Ltd INE274J01014 o Energy
0.88 HDFC Mid-Cap Opportunities Fund Growth INF179K01CR2 1.61 - 30 Sep 2014
1.17 HDFC Top 200 Fund Growth INF179K01BE2 2.59 - 30 Sep 2014
1.85 Axis Bank Ltd INE238A01034 y Financial Services
1.06 HDFC Mid-Cap Opportunities Fund Growth INF179K01CR2 1.93 - 30 Sep 2014
0.79 HDFC Top 200 Fund Growth INF179K01BE2 1.76 - 30 Sep 2014
1.63 Voltas Ltd INE226A01021 p Industrials
1.36 HDFC Mid-Cap Opportunities Fund Growth INF179K01CR2 2.46 - 30 Sep 2014
0.27 HDFC Top 200 Fund Growth INF179K01BE2 0.61 - 30 Sep 2014
1.52 Hindustan Petroleum Corp Ltd INE094A01015 o Energy
1.09 HDFC Mid-Cap Opportunities Fund Growth INF179K01CR2 1.97 - 30 Sep 2014
0.43 HDFC Top 200 Fund Growth INF179K01BE2 0.96 - 30 Sep 2014
1.47 Crompton Greaves Ltd INE067A01029 Technology
0.34 HDFC Mid-Cap Opportunities Fund Growth INF179K01CR2 0.62 - 30 Sep 2014
1.13 HDFC Top 200 Fund Growth INF179K01BE2 2.51 - 30 Sep 2014
1.36 Union Bank of India INE692A01016 y Financial Services
1.03 HDFC Mid-Cap Opportunities Fund Growth INF179K01CR2 1.87 - 30 Sep 2014
0.33 HDFC Top 200 Fund Growth INF179K01BE2 0.74 - 30 Sep 2014
1.29 Divi's Laboratories Ltd INE361B01024 Healthcare
1.13 HDFC Mid-Cap Opportunities Fund Growth INF179K01CR2 2.05 - 30 Sep 2014
0.17 HDFC Top 200 Fund Growth INF179K01BE2 0.37 - 30 Sep 2014
1.28 Punjab National Bank INE160A01014 y Financial Services
0.87 HDFC Mid-Cap Opportunities Fund Growth INF179K01CR2 1.57 - 30 Sep 2014
0.41 HDFC Top 200 Fund Growth INF179K01BE2 0.92 - 30 Sep 2014
© 2014 Morningstar. All rights reserved. Morningstar and the Morningstar logo are either trademarks or service marks of Morningstar Inc. and are used under license. The information provided hereunder is not warrantedto be complete, accurate or timely and neither Morningstar nor any of its affilliates s hall be liable for any damages arising from its use. ß
®

8/9/2019 P SRINIVASA RAJU Portfolio_20141024.pdf
http://slidepdf.com/reader/full/p-srinivasa-raju-portfolio20141024pdf 4/5
Report as of 24 Oct 2014
Portfolio Holdings Performance Date
30 Sep 2014
Portfolio Holdings Total 2 Holdings Type Holding
Portfolio Date
Morningstar
Rating™
1 Year 3 Years
Annualized
5 Years
Annualized
Market Value
(INR)
Assets
(%)
HDFC Mid-Cap Opportunities Fund Growth Fund 30 Sep 2014 QQQQQ 91.44 28.22 23.50 33498.30 55.01
HDFC Top 200 Fund Growth Fund 30 Sep 2014 QQQQ 60.04 19.90 13.48 27397.20 44.99
© 2014 Morningstar. All rights reserved. Morningstar and the Morningstar logo are either trademarks or service marks of Morningstar Inc. and are used under license. The information provided hereunder is not warrantedto be complete, accurate or timely and neither Morningstar nor any of its affilliates s hall be liable for any damages arising from its use. ß
®

8/9/2019 P SRINIVASA RAJU Portfolio_20141024.pdf
http://slidepdf.com/reader/full/p-srinivasa-raju-portfolio20141024pdf 5/5
Report as of 24 Oct 2014
Disclosure
The performance data given represents past performance and should not be
considered indicative of future results.
The fund(s) returns do not reflect active trading and do not necessarily reflect
the results that might have been achieved by active management of the
account. The investment returns of other clients of the adviser may differ
materially from the investment portrayed.
Asset Allocation
This pie chart and table shows the portfolio's exposure to the following broad
asset classes: Stocks, Bonds, Cash and Other. The Other category represents
an asset class that Morningstar recognizes but classifies outside of the asset
classes listed above. (For example, real estate is typically classified as Other.)
Not Classified is for those securities Morningstar does not recognize or track.
The tables adjacent to the pie chart identify the net asset allocation
percentages of the portfolio, as well as the component long positions (assets)
and short or marginal positions (liabilities) of the portfolio.
World Regions
This data set provides a broad breakdown of a portfolios geographicalexposure, by region and by market maturity. Only non-cash equity assets are
evaluated in determining the exposures. Not Classified indicates the
percentage of the equity portion of the portfolio for which Morningstar is
unable to assess region or origin.
Stock Sector
This table shows the percentage of the portfolios equity assets invested in
each of the three supersectors (information, service, and manufacturing
economies) and 12 major industry subclassifications, in comparison with a
benchmark. The Sector Graph accompanying the table demonstrates the
sector orientation of the portfolio in relation to the Morningstar Broad Market
Index.) Not Classified is for those securities Morningstar does not recognize
or track. The percentage of each sector that composes the benchmark index(Rel Bmark) is also listed.
Top 10 Underlying Holdings
This listing indicates the most heavily weighted underlying holdings in the
portfolio, up to 10, identifying the percentage of assets that each represents
in the portfolio, the security type, the sector classification, and the country
of origin. The portfolio date is the most recent available for full holdings
disclosure in Morningstar's database. It could be that two funds have a
different portfolio date, depending on portfolio availability in the database.
Total Return
Total return reflects performance without adjusting for sales charges or the
effects of taxation, but is adjusted to reflect all actual ongoing fund expensesand assumes reinvestment of dividends and capital gains. If adjusted, sales
charges would reduce the performance quoted.
Portfolio and benchmark returns are calculated by asset-weighting the
monthly returns of the underlying holdings and thus reflect the pretax results
an investor would have achieved by rebalancing the portfolio on a monthly
basis. These same returns are used to calculate all returns-based statistics.
Returns for individual holdings are trailing total returns.
Risk and Return Profile
R-squared reflects the percentage of a fund's movements that are explained
by movements in its benchmark index, showing the degree of correlation
between the fund and the benchmark.
Beta is a measure of a fund's sensitivity to market movements. A portfolio
with a beta greater than 1 is more volatile than the market, and a portfolio
with a beta less than 1 is less volatile than the market.
Alpha measures the difference between a fund's actual returns and its
expected performance, given its level of risk (as measured by beta).
The Sharpe Ratio is a risk-adjusted measure calculated by using standard
deviation and excess return to determine reward per unit of risk. The higher
the Sharpe Ratio, the better the fund's historical risk-adjusted performance.
The Sharpe Ratio is calculated for the past 36-month period by dividing a
fund's excess returns by the standard deviation of a fund's excess returns.
Since this ratio uses standard deviation as its risk measure, it is most
appropriately applied when analysing a fund that is an investors sole holding.
The Sharpe Ratio can be used to compare two funds directly on how much
risk a fund had to bear to earn excess return over the risk-free rate.
The standard deviation shows how far a set of values are spread above and
below the average for a particular fund type. If the standard deviation is a
high number positive or negative then the fund has performed that far below
or above the average. If the standard deviation is low then the fund has
performed closer to the average.
Mean is the annualised performance of a fund over three years.
Growth Graph
The graph compares the growth of a fund with that of an index and with that
of the average for all funds in its Morningstar category. The total returns are
not adjusted to reflect sales charges or the effects of taxation, but are
adjusted to reflect actual ongoing fund expenses, and assumes reinvestment
of dividends and capital gains. If adjusted, sales charges would reduce the
performance quoted. The index is an unmanaged portfolio of specified
securities and the index and the category average do not reflect any initial
or ongoing expenses. A fund's portfolio may differ significantly from the
securities in the index. The index is assigned by Morningstar and may differ
from that in the fund's prospectus.
Risk Scatter Graph
The risk / reward scatter plot is based on each holding's risk and return over
the most recent three-year period. Risk is measured as 3-year standard
deviation of return. Return is measured as 3 year mean return. The risk /
reward scatter plot also contains the portfolio's risk and return.
Correlation Matrix
The matrix shows the performance correlation between different holdings. A
correlation of 1 indicates the two holdings move in the same direction, a
correlation of -1 indicates the two holdings move in opposite directions and
a correlation of 0 means that no correlation could be found. A correlation of
-1 will offer maximum diversification.
© 2014 Morningstar. All rights reserved. Morningstar and the Morningstar logo are either trademarks or service marks of Morningstar Inc. and are used under license. The information provided hereunder is not warrantedto be complete, accurate or timely and neither Morningstar nor any of its affilliates s hall be liable for any damages arising from its use. ß
®
Recommended