Physics 343 Lecture # 14:the Search for ExtraTerrestrial Intelligence
and galactic collisions (mergers)

SETI

Astrobiology: a useful starting pointastrobiology (Lafleur 1941)cosmobiology (Bernal 1952)exobiology (Lederberg 1960)bioastronomy (IAU 2004)
1941 definition by Lafleur: “consideration of life in the universe elsewhere than on earth”
1964 comment by Simpson: “this 'science' has yet to demonstrate that its subject matter exists!”
2008 definition by NASA: “study of the living universe”

Astrobiology vs. SETIAstrobiology research is funded by NASA.
NASA Astrobiology Institute (http://nai.nasa.gov/)started in 1998 as a virtual institute to coordinate research.
SETI has not been funded by NASA since 1993, when Congress killed the Ames/JPL “High Resolution Microwave Survey.”
Should “astrobiology” include life on Earth?
To address many astrobiological questions, we have no choice but to extrapolate from a sample of one.
Is this legitimate?Copernican principle: our circumstances are not specialanthropic principle: our circumstances are special,
because we're here
Relevant to SETI because insights about astrobiology guideour choice of search strategy.

Quantifying our ignorance...
UC Santa Cruz astronomer Frank Drake in Green Bank, WV

November 1960: a secret meeting in WV
Ten scientists met in Green Bank, WV to discuss the prospect for existence and detection of extraterrestrial life.
Location inspired by Drake's first SETI experiment.
Participants included astronomers, biologists, engineers, and a chemist whose Nobel Prize was announced duringthe meeting; nicknamed themselves “Order of the Dolphins.”

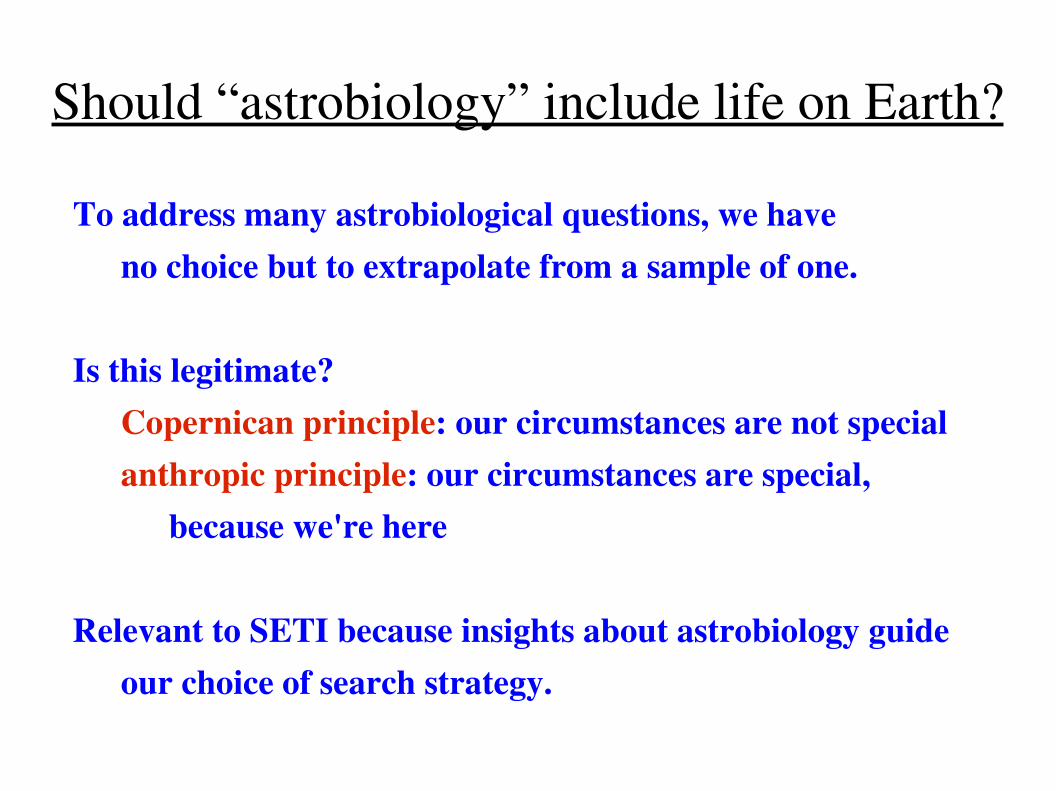
The Drake Equation
N = number of transmitting civilizations in the Milky Way

The Drake Equation
R* = rate at which suitable stars form in Milky Way (yr1)
The Drake Equation
fp = fraction of such stars that have planets

The Drake Equation
ne = mean number of planets per solar system that could support life

The Drake Equation
fl = fraction of habitable planets on which life did evolve

The Drake Equation
fi = fraction of planets with life on which intelligence evolved

The Drake Equation
fc = fraction of planets with intelligent lifeon which a transmitting civilization arises

The Drake Equation
L = mean lifetime of a transmitting civilization (yr)

The Drake Equation
units: R* ~ yr1 and L ~ yr ⇒ N is dimensionless

What did Frank Drake guess in 1961?R* ~ 10 yr1 fp ~ 0.5ne ~ 2fl ~ 1 ⇒ N ~ 10fi ~ 0.01fc ~ 0.01L ~ 104 yr
Key value of the Drake Equation: highlights the fact that some factors are less certain than others!

Quiz

Overall strategy for contacting ETI
If we want to get in touch with ETI, should we(a) send messages?(b) listen for messages?(c) wait to be visited?
The relative youth of our technological civilization argues that (b) is better than (a), but also begs the question of why we have not already been visited!
Latter question is known as the Fermi Paradox. Possibleanswers: they don't exist, they're far away, or they're hiding.

The listening strategy for SETI: details
Two key questions:(1) Where do we look on the sky?(2) Where do we look in the electromagnetic spectrum?
Most straightforward answers draw from our own experience:(1) Look near stars like the Sun, which could have
planetary systems like our solar system.(2) Look in the radio, where interstellar dust and a
planetary atmopshere will not absorb/scatter a signal.

Project Ozma
1960: Frank Drake used the 85 foot telescope in Green Bank to observe two nearby stars at ~ 1420.4 MHz (a single 100 Hzchannel scanned 400 kHz of bandwidth; compare to mode 1of SRT receiver, which obtains 500 kHz at 7.8125 kHz resolution). Frequency was chosen for cheap cost ($2000).Strip chart and tape recorder stored data. Observed 150 hrs.
Targets chosen to be like the Sun: Epsilon Eridani (3.22 pc)
and Tau Ceti (3.65 pc). No astronomical signals detected.
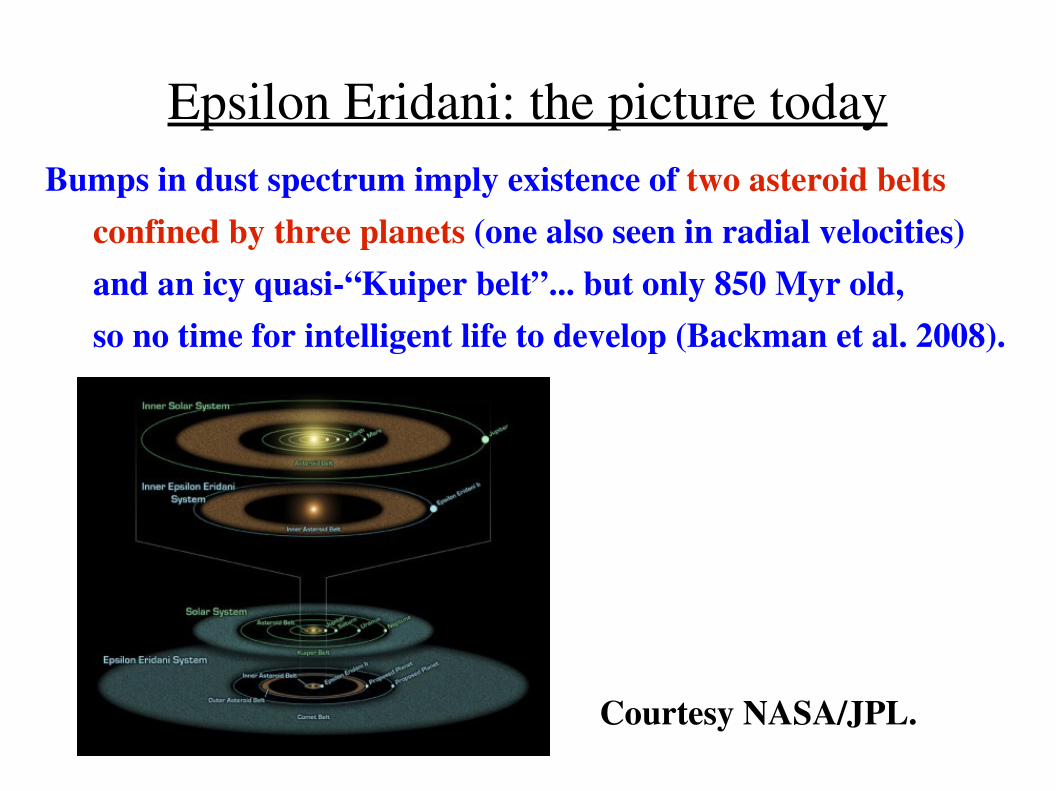
Epsilon Eridani: the picture todayBumps in dust spectrum imply existence of two asteroid belts
confined by three planets (one also seen in radial velocities) and an icy quasi“Kuiper belt”... but only 850 Myr old, so no time for intelligent life to develop (Backman et al. 2008).
Courtesy NASA/JPL.

Tau Ceti: the picture todayNo evidence for planets in radial velocity searches, but
submillimeter photometry indicates a debris disk ten times as massive as our Kuiper belt... which presumably
implies a tentimeshigherrate of major impacts thanwhat the Earth suffers.
Greaves et al. (2004)

What sort of signals are expected?
What sort of signals have we (deliberately) sent?
1974 Arecibo Message: 23 × 73 sequence of pulses at two different frequencies, to suggest arrangement into a 2D array.
This was beamed towards the globular cluster M13, which will move out of its path before the 25,000 year travel time has elapsed!

Where might we look in frequency?Close to the 21cm HI line, which is an obvious point of
reference for all radio astronomers (Morrison & Cocconi 1959).1420 MHz through 1662 MHz (frequency of strong OH lines)
defines the lowbackground “water hole” (B. Oliver),which might be appealing to species with a common biology.
Signal frequency unlikely to be stationary
Search strategies need to check for repeatability but allow forDoppler drift: transmissions from a planet or a satellitein orbit will in general reflect lineofsight motions.
Conclusion: want to search wide frequency ranges at veryhigh frequency resolution.

PostOzma searches from Green Bank
Later programs could take advantage of the 140 ft and 300 ft telescopes at NRAO Green Bank.
197172: “Ozpa” searches towards 9 nearby stars (including allowance for Doppler drift) over a meager 13 hours
197276: “Ozma II” searches towards 674 stars over 500 hours;target stars selected to be between F5 and K4, to avoidshort stellar lifetimes and small habitable zones

The first universitybased SETI effortOhio State's “Big Ear” (19631998): drift field telescope with
feed horns on a cart at base of flat reflector. SETI workbegan in 1973 and continued over two decades.

August 15, 1977: the “wow” signal
While observing in the direction of Sagittarius, Big Ear detected a strong, narrowband signal in one of its two feed horns that was not repeated. Nevertheless, Jerry Ehman was quite enthusiastic!

1979: NASA gets on board
NASA established the “Microwave Observing Program”(MOP) to pursue a mixture of targeted and allsky searches.
This attracted mixed attention from Congress: Sen. WilliamProxmire (DWI) gave it a “Golden Fleece” award in 1979,and succeeded in killing funding in 1982.
Funding reestablished in 1983 after Carl Sagan and others paid Sen. Proxmire a visit...

MOP observations: 199293MOP surveys began in 1992 at Arecibo (305m, targeted, 8001000
stars, led by NASA Ames) and Goldstone (34m, allsky, led by NASA JPL).
Renamed the “High Resolution Microwave Survey”.
HRMS signal processingTargeted survey:
searched 1 – 3 GHz in 20 MHz chunks, each divided into20 million channels, for 1 – 28 Hz bandwidth signals
Allsky survey:searched 1 – 10 GHz in 320 MHz chunks, each divided into16 million channels
Compare to early “Big Ear” searches of 50 channels at a time!
Funding killed by Sen. Richard Bryan (DNV) in 1995.

Onward via private support
First private funding of SETI: The Planetary Society (1980 – present, http://www.planetary.org/), which funnelled donations from Steven Spielberg and others into theSentinel (131 kchan), META (8.4 Mchan), and BETA (250 Mchan + rapid retuning) projects on the 26m telescope in Harvard, MA.
Alas: the 26m telescope was blown over by strong windsin 1999...

Project Phoenix
Resuscitation of HRMS targeted search under the leadership of Dr. Jill Tarter of the SETI Institute.
Used 64m Parkes radio telescope in Australia (1995 – 1996) + Green Bank 140 foot (1996 – 1998) + Arecibo (1998 – 2004) to survey 800 stars within 200 lightyears of earth over 1 – 3 GHz range.
Targeted search requires (temporary) control of the telescope.

SERENDIPLike the Sentinel/META/BETA efforts, SERENDIP targets
an allsky survey, but in this case by piggybacking on science observations with Arecibo.
SERENDIP IV dataare analyzed by theSETI@home program.

GALAXY MERGERS

Evidence of merging in the Milky Way: ITidal streams and halo moving groups are fossil evidence of
prior episodes of galactic cannibalism (typical victim = globular cluster or dwarf galaxy).
Grillmair & Dionatos (2006); Willett et al. (2009)
stream in RA + Dec,Galactic polar coordinates
stream in colormagnitude diagram

Evidence of merging in the Milky Way: II
The Sagittarius Dwarf is being ripped apart in front of us.
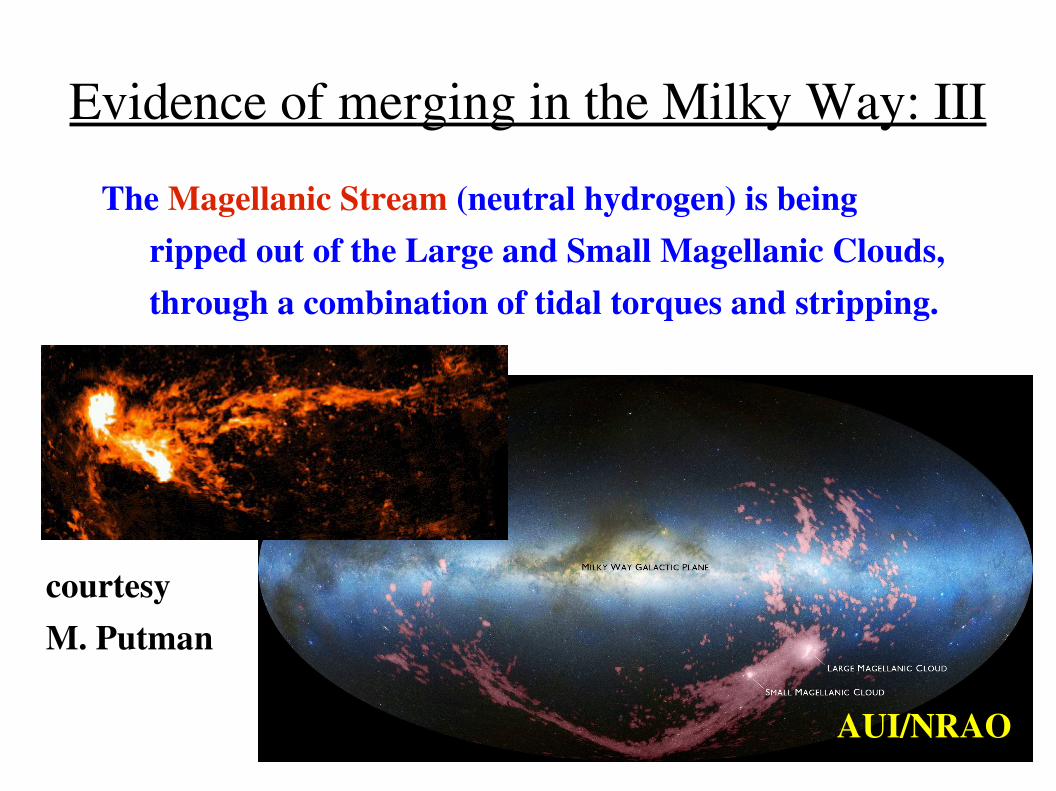
Evidence of merging in the Milky Way: IIIThe Magellanic Stream (neutral hydrogen) is being
ripped out of the Large and Small Magellanic Clouds,through a combination of tidal torques and stripping.
courtesy M. Putman
AUI/NRAO

The Toomre sequenceA. Toomre (1977, in “The Evolution of Galaxies and Stellar
Populations”): proposed an evolutionary sequence for mergers.
courtesy J. Hibbard

Fossil evidence in “normal” galaxies
NGC4138: normal Sa in Bband... but contains two counterrotating stellar disks (Jore et al. 1996)!
NGC3332: normal, isolated E...but reveals multiple shell features after unsharpmarking is applied(Colbert et al. 2001)!

Identification of mergers: morphologyGini coefficient = measure of “inequality”
of a galaxy's pixels (area of shaded region/area under y = x)
M20 = logarithm of (normalized) secondorder moment of brightest 20% of a galaxy's pixels
Lotz et al. (2004)

Mergers in Gini vs. M20 space
In 6500 Å images,mergers have higher Gini and M20 thannormal galaxies.
Lotz et al. (2004)

Key concepts in discussing mergers
I. major vs. minormajor: 1:1 to ~2:1minor: ~3:1 to ~10:1
II. wet vs. drywet: both galaxies involved are gasrichdry: both galaxies involved are gaspoor
When one galaxy has gas and the other doesn't,a merger is “wetdry”, “damp”, etc.

Simulation of a Milky Way/M31 merger
2 × (40M stellar + 10M dark matter particles); t = 90 Myr.Taken from J. Dubinski, http://www.galaxydynamics.org/.

Key stages in a major merger
Dynamical frictionof dark matter haloes drives themerger process.
(1) approach (2) first passage
(3) formation of tidal bridges/tails
(4) second
passage (5) coalescence and violent relaxation
images from J. Dubinski

Tidal bridges and tailsTidal features are formed because the gravitational
field is stronger (weaker) on the near (far) side.
Encounter geometry affects the strength of the effect.
Toomre & Toomre (1972)
retrograde encounter prograde encounter
with mean subtracted

How does gas behave in a major merger?Barnes & Hernquist (1996): simulated stars (left) and gas (right).

Why gas and stars behave differentlyStars and gas both feel gravitational attraction. However,
while stars and dark matter particles can persist on intersecting (and selfintersecting) orbits, gas cannot.
⇒ gas makes the progenitors' disks more susceptible to bar instabilities (although massive bulges will stabilize the disks against bar formation)
⇒ gas loses (“dissipates”) energy and angular momentummore quickly, so is concentrated in the center of each progenitor and (eventually) the remnant

Offsets between gas and stellar tidal tailsSome mergers show offsets between gas and stellar tidal tails – why?
Offset tailsare seen in
simulationsif gas starts
at larger radiithan starsstars!
Arp 299: HIvs. stars (J. Hibbard)
Mihos et al. (2001)

The fate of gas in (wet) major mergers
Simulation results:
+ 50–90% of the gas in the progenitors rapidly coalescesinto a massive central condensation in the remnant
+ most of the rest falls back into the center on longer timescales, from extended tidal tail/bridge features
+ a modest amount can end up in gravitationally boundtidal dwarf galaxies

An observational example: the “Antennae”Hibbard et al. (2001): HI tails and
two tidal dwarf candidates
Wilson et al. (2000): CO(1–0) tracing densegas in progenitors and “overlap region”

Forming ellipticals: the merger hypothesis
Toomre (1977) proposed that the end state of a mergerbetween two gasrich spirals is an elliptical. This wasa provocative suggestion: ellipticals have higher phasespace density and greater orbital anisotropy than spirals.
+ violent relaxation makes stellar orbits more anisotropic(although it does not change phase space density)
+ large central gas mass can form new stars, leading to a higher phase space density than in the progenitors

Testing the merger hypothesis: gasrich systemsThe best way to identify gasrich mergers is to look for the
central burst of star formation that the gas inflow triggers!
Infrared Astronomical Satellite (IRAS)in 1983 mapped 96% of the skyat 12, 25, 60, and 100 m,and recognized a new categoryof infraredluminous galaxies.
LIR(8–1000 m) > 1011 L⊙: luminous infrared galaxy (LIRG)LIR(8–1000 m) > 1012 L⊙: ultraluminous infrared galaxy (ULIRG)

LIRG and ULIRG morphologies
As LIR increases, we see + a higher fraction of mergers
(100% for ULIRGs), and + smaller separations.
LIRG sample:Sanders & Ishida (2004)
ULIRG sample:Veilleux et al. (2002)

Star formation during a major merger
Sharp peaks in star formationrate (therefore, LIR) occurat first passage if progenitorsdo not have bulges, but aredelayed until final coalescenceif progenitors do have bulges.
ULIRGs are more likely to be latestage mergers.
courtesy J. C. Mihos

Large central gas masses
CO(2–1) mapping revealsMgas ~ 9 × 10⁹ M⊙.
Sakamoto et al. (1999)
Hubble Space Telescope image ofArp 220 (nearest ULIRG)
Scoville et al. (2000)

Double AGN buried in NGC6240NGC6240: a messy merger at the LIRG/ULIRG boundary...
...whose LIR is mostly powered by two highly obscured AGN.
Xray (Komossa et al. 2003)
optical (HST/WFPC2)

Merger hypothesis: rotational support
ULIRGs have high v/ (i.e., rotational support) moresimilar to intermediatemass, disky ellipticals thanto giant, boxy ellipticals (Genzel et al. 2001).

The origin of BCG/cD ellipticals?
Giant, boxy ellipticals that lie at the centers of clusters do not appear to be formed in wet, ULIRGlike mergers: they have higher and lower v/ (greateranisotropy) than ULIRGs.
A likely formation scenario: multiple dry mergers,with tidal capture of other galaxies' globular clustersexplaining their high specific frequency (SN).
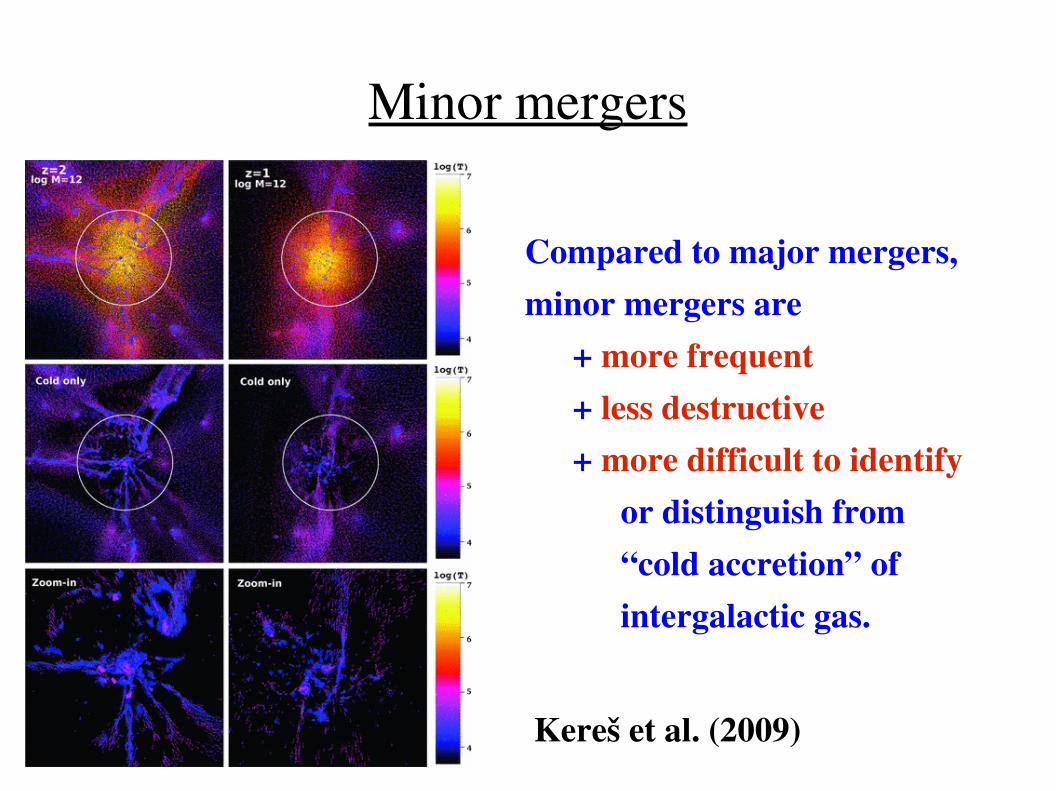
Minor mergers
Compared to major mergers, minor mergers are
+ more frequent+ less destructive+ more difficult to identify
or distinguish from “cold accretion” of intergalactic gas.
Kereš et al. (2009)

Effects of minor mergers on disks
Minor mergers are likely to dynamically heat a disk(increasing its verticalscale height), and if onepartner is gasrich, to trigger a LIRGscaleburst of star formation.
Hernquist & Mihos (1995):disk thickened by a 10:1 minor merger
Recommended