Yoichiro IshiharaSenior EconomistIPAR 5th Annual Research ConferenceKigali, Rwanda, Mar 2016
Macroeconomic Resilience in Rwanda
In this presentation, I will
2
conceptualize risk, vulnerability and resilience.
attempt to estimate Rwanda’s resilience using the concept.
argue Rwanda’s resilience based on the estimate.
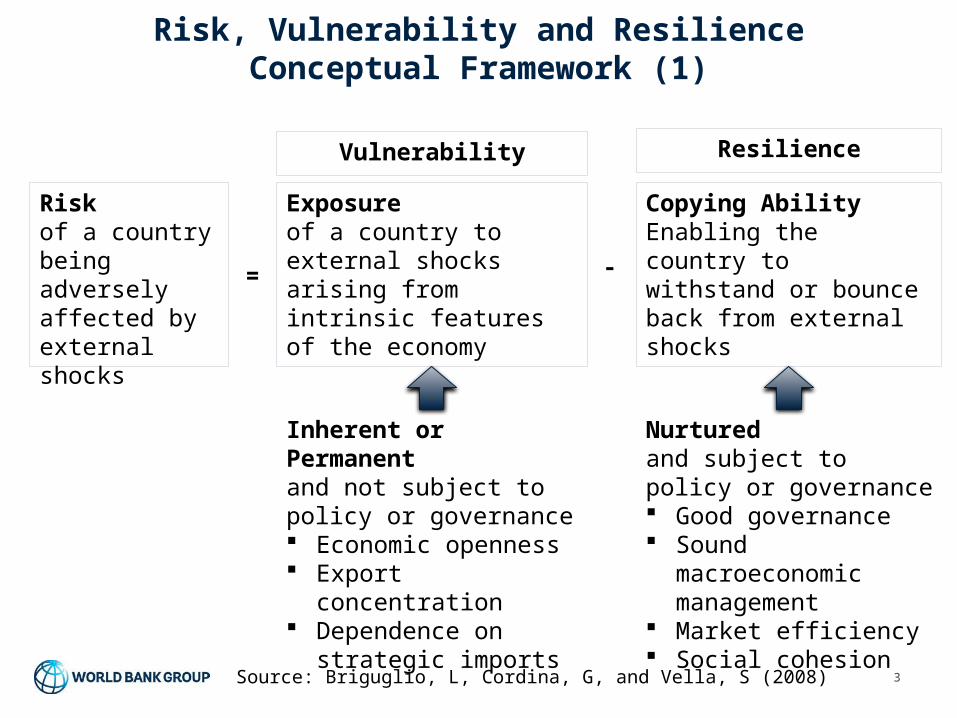
Risk, Vulnerability and ResilienceConceptual Framework (1)
3
Riskof a country being adversely affected by external shocks
Exposureof a country to external shocks arising from intrinsic features of the economy
Copying AbilityEnabling the country to withstand or bounce back from external shocks
Vulnerability Resilience
Inherent or Permanentand not subject to policy or governance Economic openness Export concentration Dependence on
strategic imports
Nurturedand subject to policy or governance Good governance Sound
macroeconomic management
Market efficiency Social cohesion
= -
Source: Briguglio, L, Cordina, G, and Vella, S (2008)
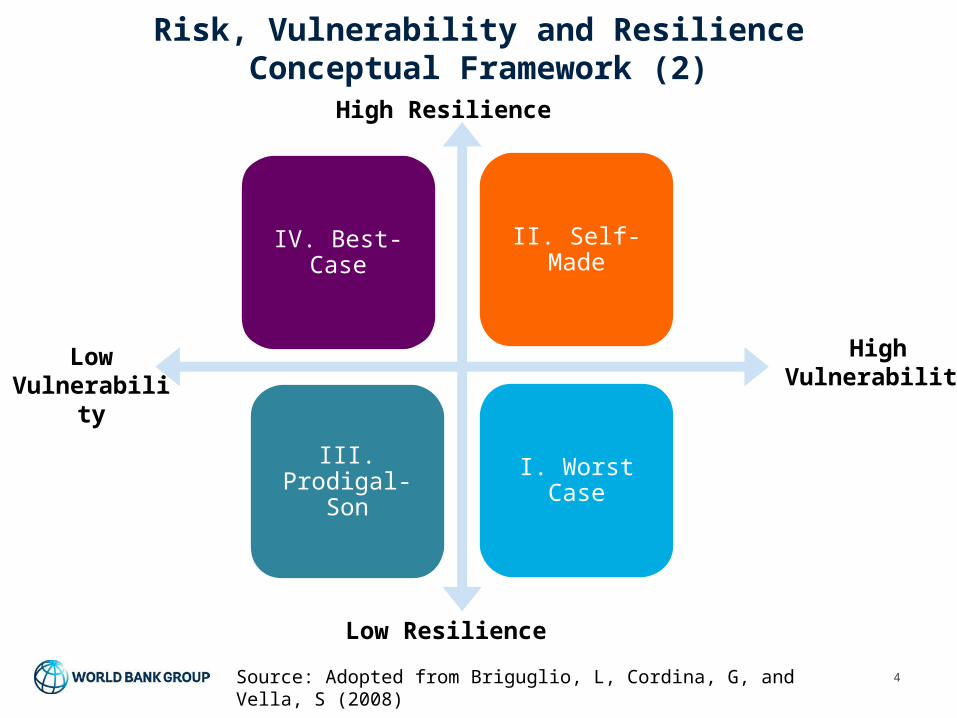
Risk, Vulnerability and ResilienceConceptual Framework (2)
4Source: Adopted from Briguglio, L, Cordina, G, and Vella, S (2008)
I. Worst Case
II. Self-Made
III. Prodigal-Son
IV. Best-Case
High Vulnerability
Low Vulnerabilit
y
High Resilience
Low Resilience
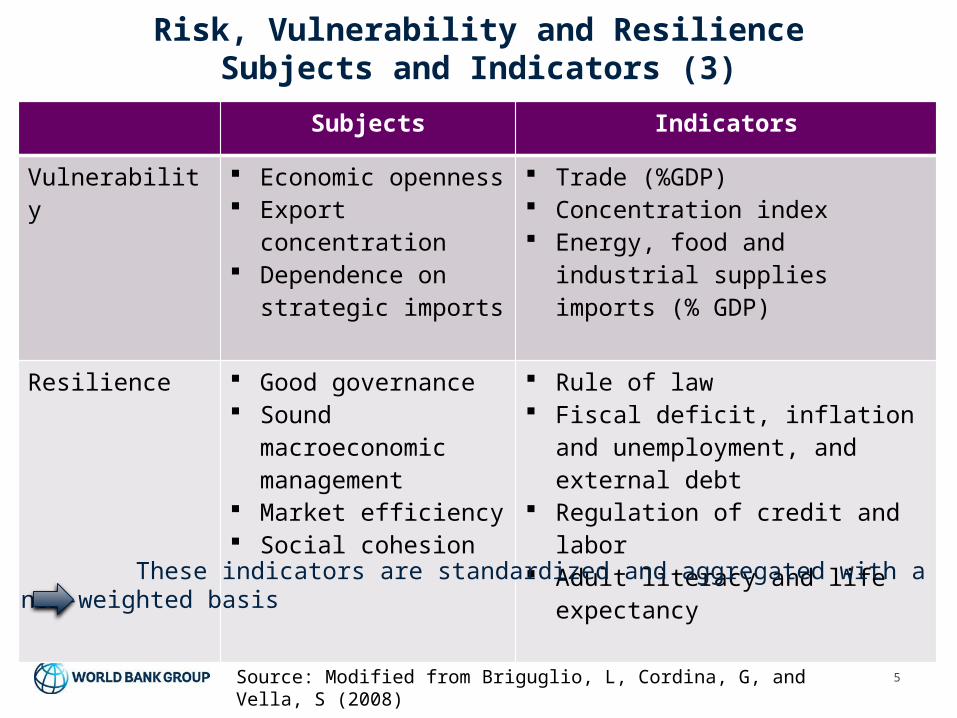
Risk, Vulnerability and ResilienceSubjects and Indicators (3)
5
Subjects Indicators
Vulnerability Economic openness Export
concentration Dependence on
strategic imports
Trade (%GDP) Concentration index Energy, food and industrial
supplies imports (% GDP)
Resilience Good governance Sound
macroeconomic management
Market efficiency Social cohesion
Rule of law Fiscal deficit, inflation and
unemployment, and external debt
Regulation of credit and labor Adult literacy and life
expectancy
Source: Modified from Briguglio, L, Cordina, G, and Vella, S (2008)
These indicators are standardized and aggregated with a non-weighted basis
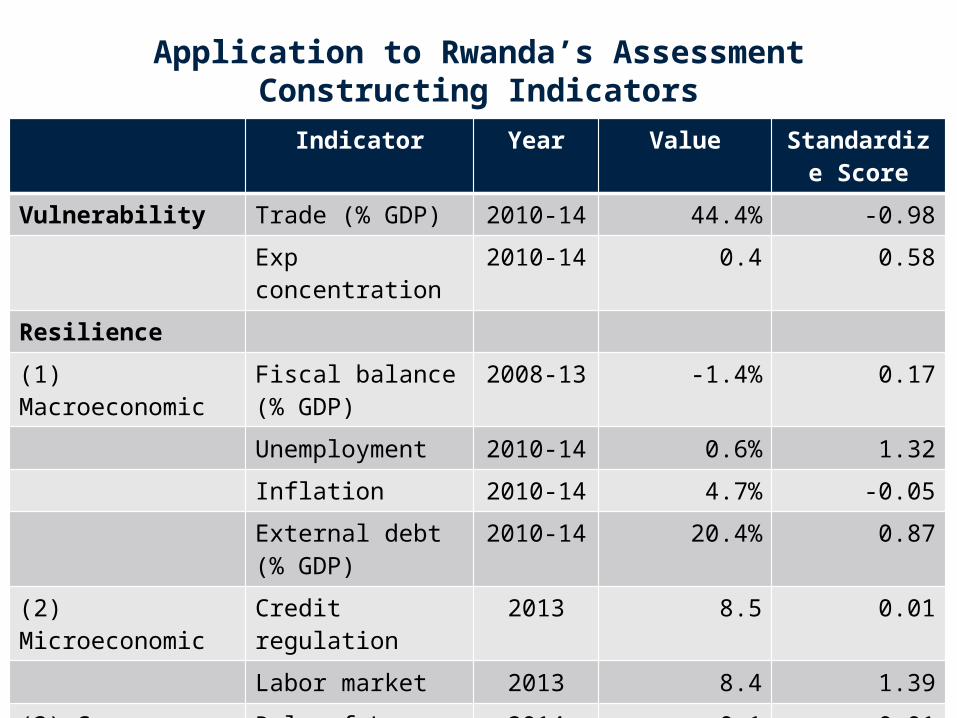
Application to Rwanda’s AssessmentConstructing Indicators
6
Indicator Year Value Standardize Score
Vulnerability Trade (% GDP) 2010-14 44.4% -0.98Exp concentration 2010-14 0.4 0.58
Resilience(1) Macroeconomic Fiscal balance (%
GDP)2008-13 -1.4% 0.17
Unemployment 2010-14 0.6% 1.32Inflation 2010-14 4.7% -0.05External debt (% GDP)
2010-14 20.4% 0.87
(2) Microeconomic Credit regulation 2013 8.5 0.01Labor market 2013 8.4 1.39
(3) Governance Rule of Law 2014 0.1 -0.01(4) Social dev Adult literacy (%) 2010-14 67.1% -0.94
Life expectancy 62.0 years -0.95

Application to Rwanda’s AssessmentRwanda falls into “Best-Case”
7
-3 -2 -1 0 1 2 3 4 5 6-15
-10
-5
0
5
10
15
Singapore
High Vulnerability
High Resilience
Rwanda
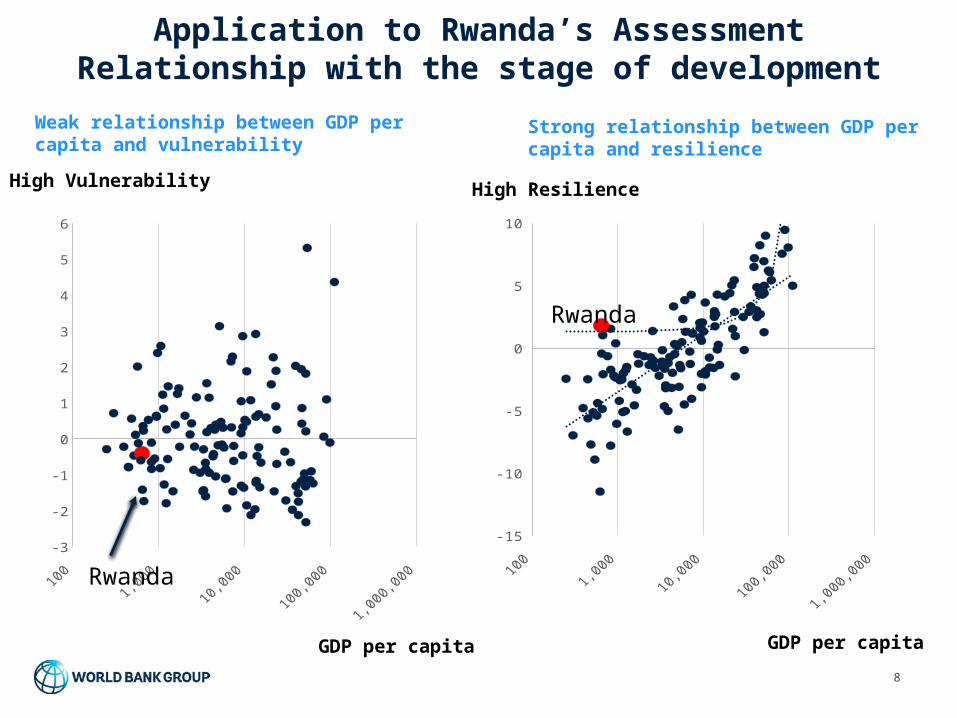
Application to Rwanda’s AssessmentRelationship with the stage of development
8
100 1,000 10,000 100,000 1,000,000 -3
-2
-1
0
1
2
3
4
5
6
High Vulnerability
GDP per capita
Weak relationship between GDP per capita and vulnerability
100 1,000 10,000 100,000 1,000,000 -15
-10
-5
0
5
10
High Resilience
GDP per capita
Strong relationship between GDP per capita and resilience
Rwanda
Rwanda
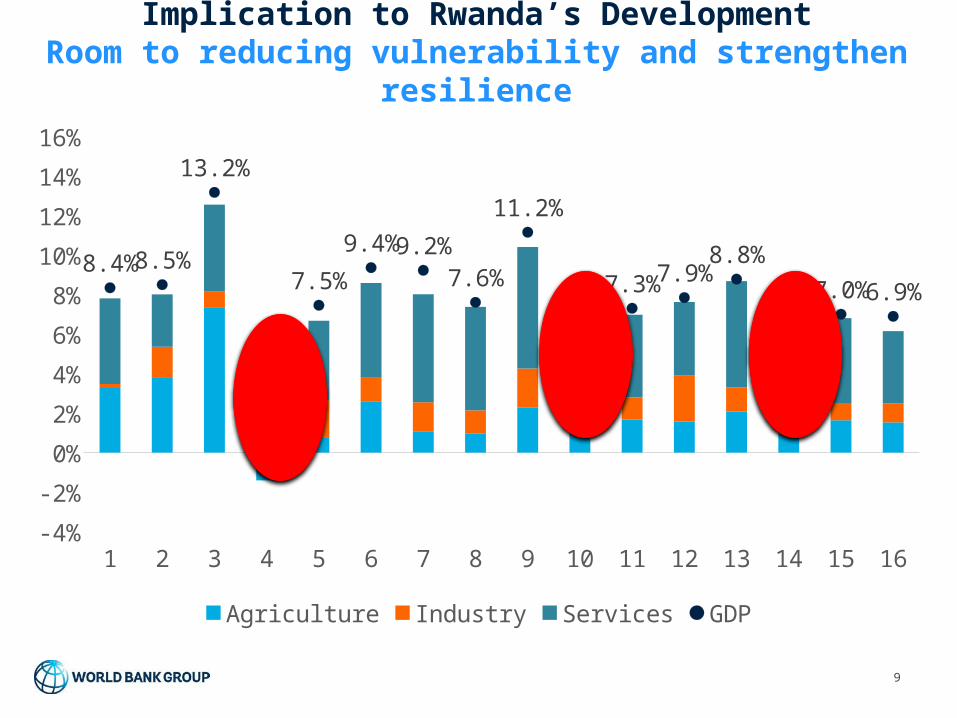
Implication to Rwanda’s DevelopmentRoom to reducing vulnerability and strengthen
resilience
9
1 2 3 4 5 6 7 8 9 10 11 12 13 14 15 16-4%-2%0%2%4%6%8%
10%12%14%16%
8.4%8.5%
13.2%
2.2%
7.5%9.4%9.2%
7.6%
11.2%
6.3%7.3%7.9%8.8%
4.7%7.0%6.9%
Agriculture Industry Services GDP

Implication to Rwanda’s DevelopmentTowards lower vulnerability
10
2004 2009 2014 20150%
10%
20%
30%
40%
50%
60%
70%
80%
90%
100%
33%19%
10% 11%
22%
25%
9%13%
32%
29%
34% 21%
6%21%
20%23%
7% 6%
28% 32%
Coffee Tea MineralsOthers Reexports
2004 2005 2006 2007 2008 2009 2010 2011 2012 2013 2014 20150%
5%
10%
15%
20%
25%
30%
35%
40%
5% 5% 5% 5% 6% 4% 4% 6% 7% 8% 8% 7%
15% 16% 18% 20%
24%23%
25%
29% 29%30% 30%
29%
Exports Imports
Slow progress on export diversification (share in goods exports)
Imports have lead increase in the exposure to the rest of the world (% GDP)
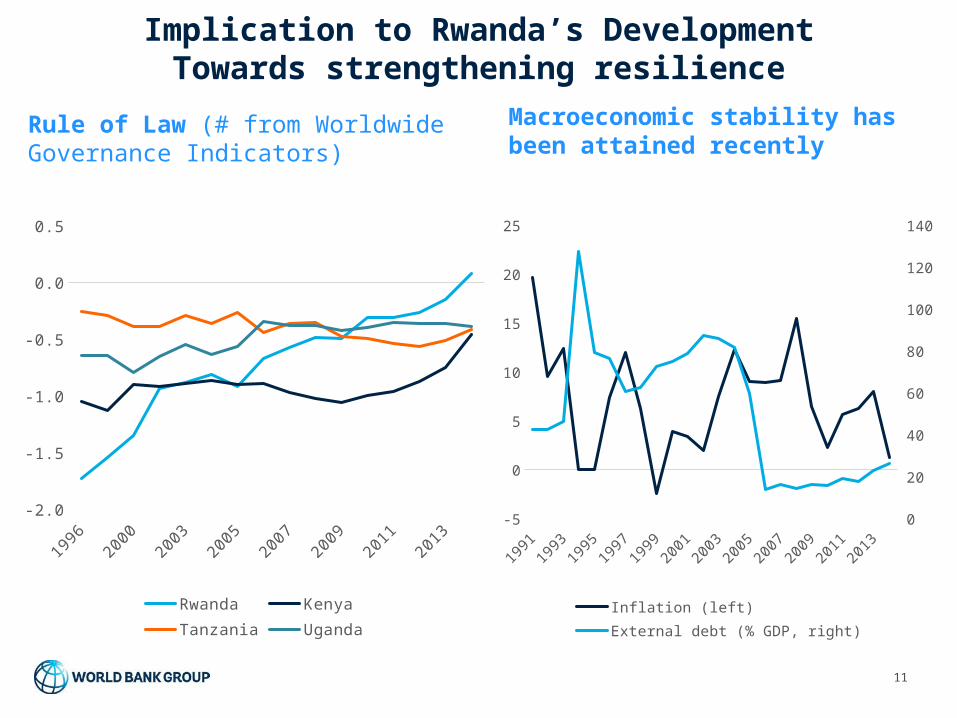
Implication to Rwanda’s DevelopmentTowards strengthening resilience
11
Rule of Law (# from Worldwide Governance Indicators)
Macroeconomic stability has been attained recently
1996
1998
2000
2002
2003
2004
2005
2006
2007
2008
2009
2010
2011
2012
2013
2014
-2.0
-1.5
-1.0
-0.5
0.0
0.5
Rwanda Kenya Tanzania Uganda
1991
1993
1995
1997
1999
2001
2003
2005
2007
2009
2011
2013
-5
0
5
10
15
20
25
0
20
40
60
80
100
120
140
Inflation (left)External debt (% GDP, right)
Thank you very much
For further informationWorld Bank’s Rwanda country page (http://www.worldbank.org/en/country/rwanda) Facebook (https://www.facebook.com/search/top/?q=world%20bank%20rwanda)
Recommended