
Invariance and optimalityLinear rank statistics
Permutation tests in R
Rank Tests
Patrick Breheny
October 7
Patrick Breheny STA 621: Nonparametric Statistics

Invariance and optimalityLinear rank statistics
Permutation tests in R
Power
Permutation testing allows great freedom to use a widevariety of test statistics, all of which lead to exact level-αtests regardless of the distribution of the data
However, not all test statistics are equally good – we wanttest statistics with high power
It is not possible to develop tests that are uniformly mostpowerful regardless of the distribution of the data
Still, we would like our tests to be robust, meaning that theyhave good power for a wide variety of distributions
Patrick Breheny STA 621: Nonparametric Statistics
Invariance and optimalityLinear rank statistics
Permutation tests in R
Invariance
Another attractive feature is invariance, meaning that the testresults do not change when the data is transformed in someway
For example:
The results of a t-test do not change when x is replaced byax+ b, for any constants a and bThe t-test is said to be location-scale invariant
A stronger type of invariance is invariance to any monotonetransformation:
The results of a t-test change if x is replaced by log(x)The t-test is not invariant to monotone transformations
Patrick Breheny STA 621: Nonparametric Statistics
Invariance and optimalityLinear rank statistics
Permutation tests in R
Rank-based tests
Any test that is based on the ranks of the data, however, isclearly invariant to monotone transformations, as suchtransformations do not affect the relative ranking ofobservations
Thus, rank-based tests do not depend on whether theoutcome is measured on the original scale or the log scale – orany other scale, for that matter
The is a powerful motivation for rank-based tests
Another important motivation is that, as we will see,rank-based tests tend to be robust
Patrick Breheny STA 621: Nonparametric Statistics
Invariance and optimalityLinear rank statistics
Permutation tests in R
Locally most powerful rank tests
One way of constructing powerful tests based on ranks is tofind the locally most powerful rank test
We will see how this test is constructed for the most commonapplication: testing for a difference in location between twogroups
A test is locally most powerful among a class of tests T forH : ∆ = 0 versus K : ∆ 6= 0 if it is uniformly most powerfulat level α for H versus Kε, where Kε = {|∆| ∈ (0, ε)}If the above class of tests is the set of rank-based tests, thenthe test is said to be a locally most powerful rank (LMPR) test
Patrick Breheny STA 621: Nonparametric Statistics
Invariance and optimalityLinear rank statistics
Permutation tests in R
Locally most powerful tests for two-group comparison
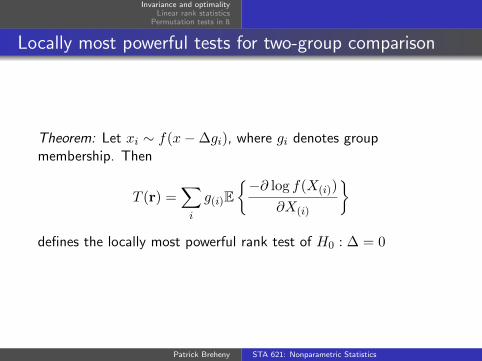
Theorem: Let xi ∼ f(x−∆gi), where gi denotes groupmembership. Then
T (r) =∑i
g(i)E{−∂ log f(X(i))
∂X(i)
}defines the locally most powerful rank test of H0 : ∆ = 0
Patrick Breheny STA 621: Nonparametric Statistics

Invariance and optimalityLinear rank statistics
Permutation tests in R
Homework
Homework: Show that
P0(r) + ∆∂
∂∆P∆(r)|∆=0 =
1
n!{1 + ∆T (r)},
where T (r) is defined on the previous slide.
To accomplish this, you will need to interchange differentiation andintegration. This cannot always be done – in general, certainregularity conditions regarding f need to hold. Assume that theseconditions hold and that interchanging the two is possible.
Hint: You may wish to consult Section 5.4 of Casella & Berger torefresh your memory concerning joint densities of order statistics.
Patrick Breheny STA 621: Nonparametric Statistics
Invariance and optimalityLinear rank statistics
Permutation tests in R
Comment
This may seem like a step backwards – we’re trying to develophypothesis tests that don’t assume anything about thedistribution, but in order to calculate T (r), we need toassume things about f
Keep in mind that all permutation tests are valid (i.e., havethe correct size α) regardless of the test statistic
However, the true distribution f will affect the power thatarises from various test statistics
Choosing f poorly (i.e. you choose an f that looks nothinglike the actual f) will not affect the validity of your hypothesistest, only its power
Patrick Breheny STA 621: Nonparametric Statistics
Invariance and optimalityLinear rank statistics
Permutation tests in R
IntroductionDerivation of linear rank scores
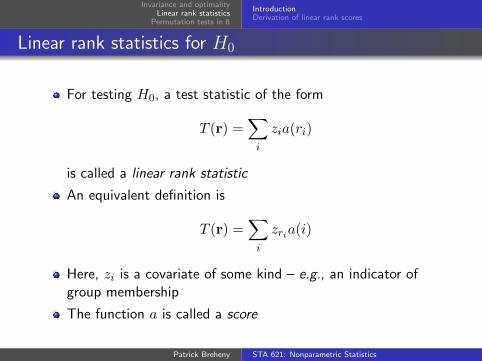
Linear rank statistics for H0
For testing H0, a test statistic of the form
T (r) =∑i
zia(ri)
is called a linear rank statistic
An equivalent definition is
T (r) =∑i
zria(i)
Here, zi is a covariate of some kind – e.g., an indicator ofgroup membership
The function a is called a score
Patrick Breheny STA 621: Nonparametric Statistics
Invariance and optimalityLinear rank statistics
Permutation tests in R
IntroductionDerivation of linear rank scores
Connection with LMPR tests
Note that the LMPR tests we just derived are based on linearrank statistics
Once again, all permutation tests based on linear rankstatistics are valid level-α tests
However, different scores will lead to tests that are morepowerful in some situations than others
Patrick Breheny STA 621: Nonparametric Statistics
Invariance and optimalityLinear rank statistics
Permutation tests in R
IntroductionDerivation of linear rank scores
Central limit theorem approximation
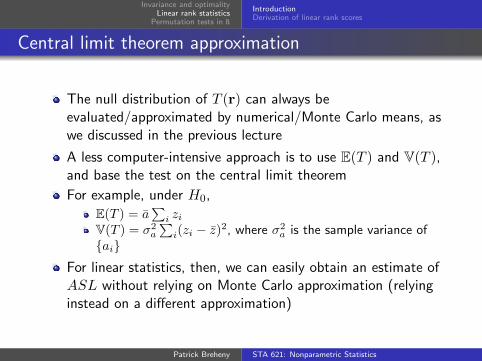
The null distribution of T (r) can always beevaluated/approximated by numerical/Monte Carlo means, aswe discussed in the previous lecture
A less computer-intensive approach is to use E(T ) and V(T ),and base the test on the central limit theorem
For example, under H0,
E(T ) = a∑
i ziV(T ) = σ2
a
∑i(zi − z)2, where σ2
a is the sample variance of{ai}
For linear statistics, then, we can easily obtain an estimate ofASL without relying on Monte Carlo approximation (relyinginstead on a different approximation)
Patrick Breheny STA 621: Nonparametric Statistics
Invariance and optimalityLinear rank statistics
Permutation tests in R
IntroductionDerivation of linear rank scores
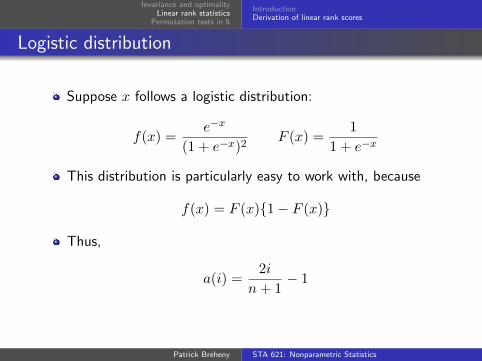
Logistic distribution
Suppose x follows a logistic distribution:
f(x) =e−x
(1 + e−x)2F (x) =
1
1 + e−x
This distribution is particularly easy to work with, because
f(x) = F (x){1− F (x)}
Thus,
a(i) =2i
n+ 1− 1
Patrick Breheny STA 621: Nonparametric Statistics
Invariance and optimalityLinear rank statistics
Permutation tests in R
IntroductionDerivation of linear rank scores
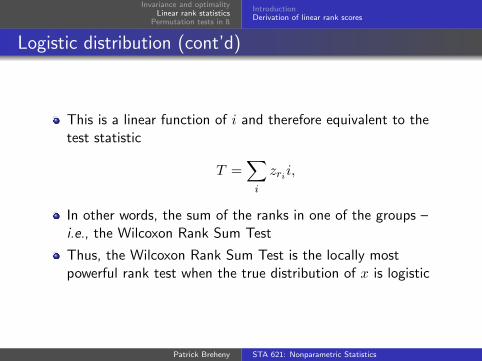
Logistic distribution (cont’d)
This is a linear function of i and therefore equivalent to thetest statistic
T =∑i
zrii,
In other words, the sum of the ranks in one of the groups –i.e., the Wilcoxon Rank Sum Test
Thus, the Wilcoxon Rank Sum Test is the locally mostpowerful rank test when the true distribution of x is logistic
Patrick Breheny STA 621: Nonparametric Statistics
Invariance and optimalityLinear rank statistics
Permutation tests in R
IntroductionDerivation of linear rank scores
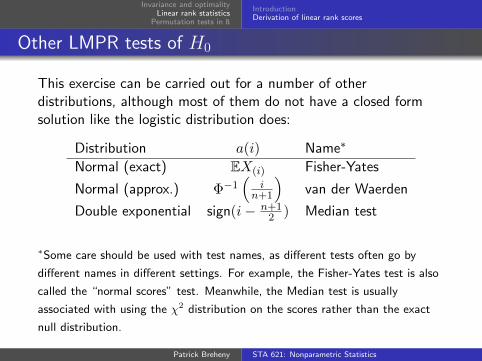
Other LMPR tests of H0
This exercise can be carried out for a number of otherdistributions, although most of them do not have a closed formsolution like the logistic distribution does:
Distribution a(i) Name∗
Normal (exact) EX(i) Fisher-Yates
Normal (approx.) Φ−1(
in+1
)van der Waerden
Double exponential sign(i− n+12 ) Median test
∗Some care should be used with test names, as different tests often go by
different names in different settings. For example, the Fisher-Yates test is also
called the “normal scores” test. Meanwhile, the Median test is usually
associated with using the χ2 distribution on the scores rather than the exact
null distribution.
Patrick Breheny STA 621: Nonparametric Statistics
Invariance and optimalityLinear rank statistics
Permutation tests in R
IntroductionDerivation of linear rank scores
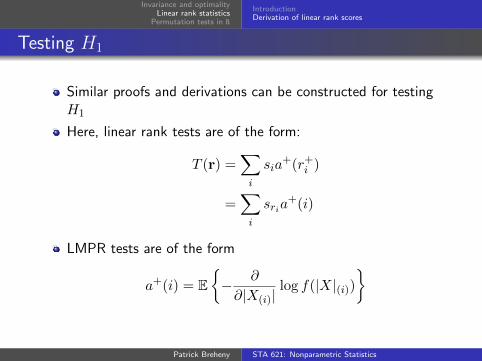
Testing H1
Similar proofs and derivations can be constructed for testingH1
Here, linear rank tests are of the form:
T (r) =∑i
sia+(r+
i )
=∑i
sria+(i)
LMPR tests are of the form
a+(i) = E{− ∂
∂|X(i)|log f(|X|(i))
}
Patrick Breheny STA 621: Nonparametric Statistics
Invariance and optimalityLinear rank statistics
Permutation tests in R
IntroductionDerivation of linear rank scores
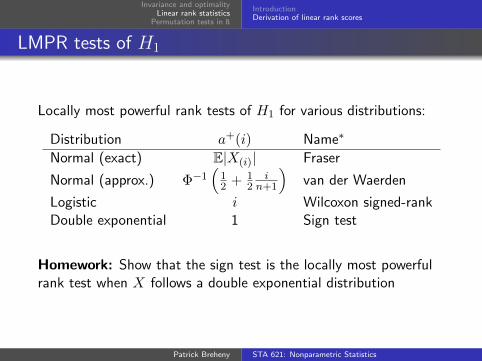
LMPR tests of H1
Locally most powerful rank tests of H1 for various distributions:
Distribution a+(i) Name∗
Normal (exact) E|X(i)| Fraser
Normal (approx.) Φ−1(
12 + 1
2i
n+1
)van der Waerden
Logistic i Wilcoxon signed-rankDouble exponential 1 Sign test
Homework: Show that the sign test is the locally most powerfulrank test when X follows a double exponential distribution
Patrick Breheny STA 621: Nonparametric Statistics
Invariance and optimalityLinear rank statistics
Permutation tests in R
IntroductionDerivation of linear rank scores
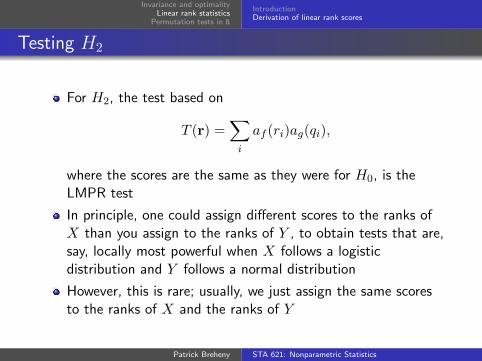
Testing H2
For H2, the test based on
T (r) =∑i
af (ri)ag(qi),
where the scores are the same as they were for H0, is theLMPR test
In principle, one could assign different scores to the ranks ofX than you assign to the ranks of Y , to obtain tests that are,say, locally most powerful when X follows a logisticdistribution and Y follows a normal distribution
However, this is rare; usually, we just assign the same scoresto the ranks of X and the ranks of Y
Patrick Breheny STA 621: Nonparametric Statistics
Invariance and optimalityLinear rank statistics
Permutation tests in R
IntroductionDerivation of linear rank scores
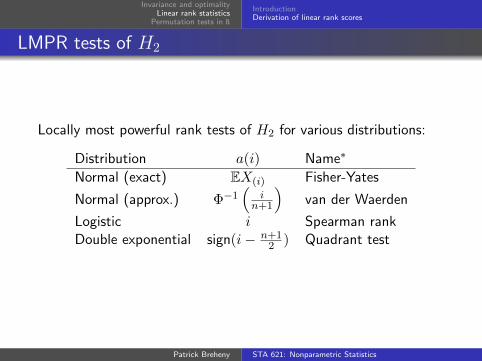
LMPR tests of H2
Locally most powerful rank tests of H2 for various distributions:
Distribution a(i) Name∗
Normal (exact) EX(i) Fisher-Yates
Normal (approx.) Φ−1(
in+1
)van der Waerden
Logistic i Spearman rankDouble exponential sign(i− n+1
2 ) Quadrant test
Patrick Breheny STA 621: Nonparametric Statistics
Invariance and optimalityLinear rank statistics
Permutation tests in R
IntroductionDerivation of linear rank scores
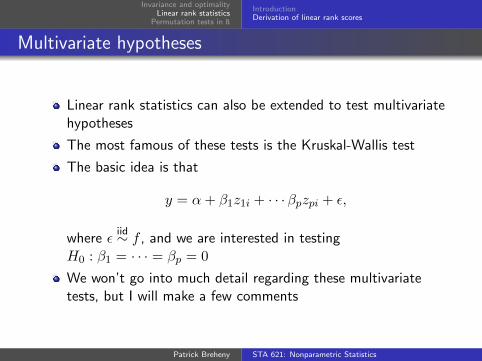
Multivariate hypotheses
Linear rank statistics can also be extended to test multivariatehypotheses
The most famous of these tests is the Kruskal-Wallis test
The basic idea is that
y = α+ β1z1i + · · ·βpzpi + ε,
where εiid∼ f , and we are interested in testing
H0 : β1 = · · · = βp = 0
We won’t go into much detail regarding these multivariatetests, but I will make a few comments
Patrick Breheny STA 621: Nonparametric Statistics
Invariance and optimalityLinear rank statistics
Permutation tests in R
IntroductionDerivation of linear rank scores
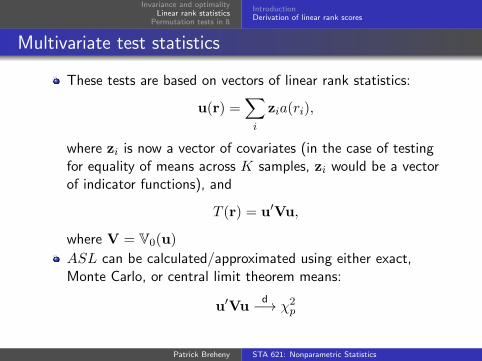
Multivariate test statistics
These tests are based on vectors of linear rank statistics:
u(r) =∑i
zia(ri),
where zi is now a vector of covariates (in the case of testingfor equality of means across K samples, zi would be a vectorof indicator functions), and
T (r) = u′Vu,
where V = V0(u)
ASL can be calculated/approximated using either exact,Monte Carlo, or central limit theorem means:
u′Vud−→ χ2
p
Patrick Breheny STA 621: Nonparametric Statistics
Invariance and optimalityLinear rank statistics
Permutation tests in R
IntroductionDerivation of linear rank scores
Multivariate scores and optimality
One can use the same scores a(i) that we derived earlier
However, these scores do not ensure that the resulting test isLMPR, like we had in the univariate case
Our LMPR proof does not extend to the multivariate case –indeed, LMPR tests do not necessarily exist for testingmultivariate null hypotheses
Patrick Breheny STA 621: Nonparametric Statistics
Invariance and optimalityLinear rank statistics
Permutation tests in R
Asymptotic vs. exact vs. Monte Carlo
When it comes to numerically calculating a p-value, there arethree approaches: exact calculation, asymptotic calculationbased on the central limit theorem, and Monte Carloapproximation
We have covered the Monte Carlo approach already
The other approaches are available in R via the functionswilcox.test (and kruskal.test) for a(i) = i, and via thepackage exactRankTests for any linear scores
Patrick Breheny STA 621: Nonparametric Statistics
Invariance and optimalityLinear rank statistics
Permutation tests in R
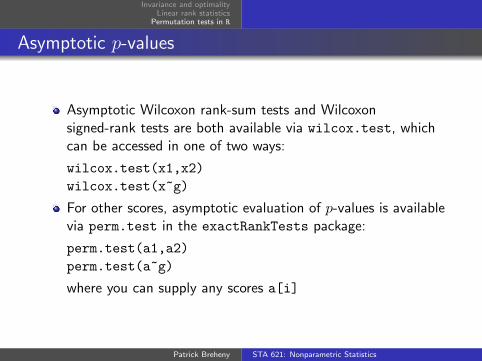
Asymptotic p-values
Asymptotic Wilcoxon rank-sum tests and Wilcoxonsigned-rank tests are both available via wilcox.test, whichcan be accessed in one of two ways:
wilcox.test(x1,x2)
wilcox.test(x~g)
For other scores, asymptotic evaluation of p-values is availablevia perm.test in the exactRankTests package:
perm.test(a1,a2)
perm.test(a~g)
where you can supply any scores a[i]
Patrick Breheny STA 621: Nonparametric Statistics
Invariance and optimalityLinear rank statistics
Permutation tests in R
Exact p-values
Exact p-values are available in both of these methods byspecifying exact=TRUE
Both of these methods use a technique called the shiftalgorithm to obtain exact answers much, much faster thanwould be possible by evaluating all n! permutations (althoughperm.test makes slight approximations to non-integer scoresbefore applying the algorithm, so its ASL isn’t always“exact”)
The default of both functions is to calculate exact scores ifn < 50, and otherwise use a normal approximation
Patrick Breheny STA 621: Nonparametric Statistics
Invariance and optimalityLinear rank statistics
Permutation tests in R
Homework
For a homework assignment, we will continue to look at thedriving/illegal drug use data from the previous lecture.
Homework: Test the null hypothesis that the distribution offollowing distance is the same in both groups using (a) theWilcoxon rank-sum test, (b) the van der Waerden test, and (c) theMedian test. For all three, report exact (or “exact”) p-values.
Patrick Breheny STA 621: Nonparametric Statistics
Recommended