RASPBERRY PI 3 MULTISPECTRAL LOW-COST SENSOR FOR UAV BASED
REMOTE SENSING. CASE STUDY IN SOUTH-WEST NIGER.
Elena Belcore1,2 *; Marco Piras1; Alessandro Pezzoli2; Giovanni Massazza2; Maurizio Rosso1
1Politecnico di Torino, DIATI, Department of Environment, Land and Infrastructure Engineering.
Corso Duca degli Abruzzi, 24, 10129 Torino, Italia (elena.belcore, marco.piras, maurizio.rosso)@polito.it 2Politecnico di Torino, DIST, Interuniversity Department of Regional and Urban Studies and Planning.
Viale Pier Andrea Mattioli, 39,10125 Torino, Italia (alessandro.pezzoli, giovanni.massazza)@polito.it
Commission VI, WG VI/4
KEY WORDS: UAV (Unmanned Aerial Vehicles), Raspberry Pi, NoIR, camera calibration, multispectral sensor, low costing
ABSTRACT:
The technology of UAV (Unmanned Aerial Vehicles) is rapidly improving and UAV-integrated sensors have kept up with it,
providing more efficient and effective solutions. One of the most sought-after characteristics of on-board sensors is the low costing
associated to good quality of the collected data. This paper proposes a very low-cost multiband sensor developed on a Raspberry
device and two Raspberry Pi 3 cameras that can be used in photogrammetry from drone applications. The UAV-integrated
radiometric sensor and its performance were tested in in two villages of South-west Niger for the detection of temporary surface
water bodies (or Ephemeral water bodies): zones of seasonal stagnant water within villages threatening the viability and people’s
health. The Raspberry Pi 3 cameras employed were a regular RGB Pi camera 2 (Red, Green, Blue) and a NoIR Pi 3 camera v2
(regular RGB without IR filter) with 8MPX resolution. The cameras were geometrically calibrated and radiometrically tested before
the survey in the field. The results of the photogrammetry elaborations were 4 orthophotos (a RGB and NoIRGB orthophoto for each
village). The Normalized Difference Water Index (NDWI) was calculated. The index allowed the localization and the contouring of
the temporary surface water bodies present in the villages. The data were checked against the data collected with a Sony (ILCE-
5100). Very high correspondence between the different data was detected. Raspberry-based sensors demonstrated to be a valid tool
for the data collection in critical areas.
* Corresponding author
1. INTRODUCTION
The usage of Unmanned Aerial Vehicles (UAVs) has gaining
approval in scientific community for different applications
related to the acquisition of information. UAVs have become
common tools in a wide range of applications (D’Oleire-
Oltmanns et al., 2012).
The UAVs advantages UAVs are unquestionable: they can fly at
low altitudes and reach remote areas and thet can be equipped
with a multitude of sensors (Giordan et al., 2017), such as
optical and hyperspectral camera, Laser, SAR, IMU, GPS, etc
(D’Oleire-Oltmanns et al., 2012; Hruska et al., 2012; Skoglar et
al., 2012); These characteristics make UAVs reliable data
collectors, especially in areas where dangers to personnel exist,
as an example in post-hazard areas in which structures have
collapsed or explosions have occurred. Furthermore, UAVs can
capture very high resolution imagery and oblique imagery
(Aicardi et al., 2016). Nowadays UAV technologies are
consolidate in several fields. In agriculture are used for
precision farming, to assess the phytosanitary conditions of
crops and the phenology of cultures (Candiago et al., 2015).
Similarly, in forestry UAVs are employed in forest health
assessment, but also in volumes estimations, forest-fires
monitoring and trees classifications (Aicardi et al., 2016; Pla et
al., 2017; Banu et al., 2016). Environment monitoring activities
benefit of UAVs too, for example in landslides and erosion
monitoring (D’Oleire-Oltmanns et al., 2012; Piras et al., 2017),
water assessment, coastline and volcano monitoring (Gonçalves
and Henriques, 2015), or natural resources and infrastructure
documentations (Angeli et al., 2019; Giordan et al., 2017). In
disciplines like archaeology and architecture UAVs are
employed in 3D surveying and mapping (Chiabrando et al.,
2010). Thanks to their ability of acquire data regardless the
criticism of study area, UAVs are widely employed in rescues,
post-hazard monitoring (Calantropio et al., 2018) and
emergency activities (Nex and Remondino, 2014).
The spreading application of UAVs is attributable to the
versatility of the technology ant the possibility of being
equipped of many different sensors with the limit of the size and
the weight. Beside the fundamental navigation sensors, the most
common sensors are cameras, multi spectral sensors (Baluja et
al., 2012; Berni et al., 2009.; Kelcey and Lucieer, 2012) and
Lidar (Chisholm et al., 2013; Tulldahl et al., 2015; Wallace et
al., 2012). Regarding the radiometric information, using a
simple near InfraRed and visible data grants the possibility to
apply several radiometric index, performing meaningful
analysis in most of the applications. One of the most sought-
after characteristics of on-board sensors are the low-costing
(Aden et al., 2014; Kingston and Beard, 2004), the
customizability, and the lightweight. In the last few years,
several low-cost multiband sensors have entered into the
market, providing to UAV-users several solutions. Beside these,
inexpensive alternatives to commercial radiometric sensors
exist. Particularly, some devices can be self-assembled and
programmed, such as Raspberry device. This contribution
analyses a RGBNoIR camera based on Raspberry Pi 3 system
The International Archives of the Photogrammetry, Remote Sensing and Spatial Information Sciences, Volume XLII-2/W13, 2019 ISPRS Geospatial Week 2019, 10–14 June 2019, Enschede, The Netherlands
This contribution has been peer-reviewed. https://doi.org/10.5194/isprs-archives-XLII-2-W13-207-2019 | © Authors 2019. CC BY 4.0 License.
207
for photogrammetry from UAV purposes. The tests and the
calibrations carried on in laboratory and in the field are
presented.
2. THE RASPBERRY SENSOR
Raspberry Pi 3 is a personal computer board with Linux
operating system installed on it. Users must integrate any
hardware, including screen and mouse. Raspberry Pi can be
applied to electronic structures and programming network work
(Jindarat and Wuttidittachotti, 2015). It is cheap to encourage
young people for learning programming and experimenting
(Agrawal and Singhal, 2015). Although initially developed to
increase interest in software engineering, it has soon became
accepted as a programmable control unit in many different
applications (Sobota et al., 2013). Raspberry Pi can connect to
numerous external accessories (Foundation Raspberry, 2019),
including cameras. On the market are available camera modules
for Raspberry, among others, there are sensors that are able to
collect InfraRed light. The Raspberry device analysed in this
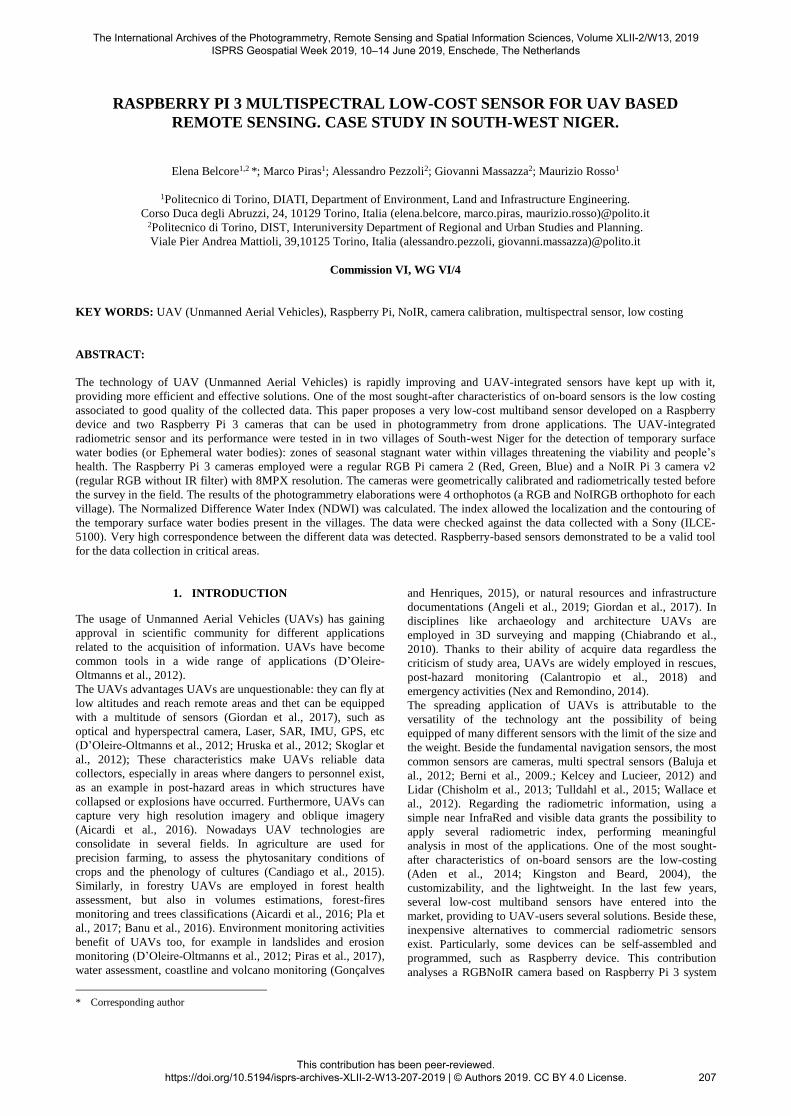
contribution (Figure 1) is composed by 1) a central Raspberry
Pi 3 board; 2) a 3.5 inches touch screen; 3) a multiplexer chip
4) a Raspberry Pi 3 V.2 camera 5) a Raspberry Pi 3 V.2 NoIR
camera 6) a 5v power bank. Table 1 describes the main
characteristic of the components. The size of the device is
85mmx56mmx32mm, the final weight (battery included) 300
grams and costed around 100€. A Python code was specifically
created using Raspberry Pi camera library to shoot and save
pictures automatically from both cameras at a given frequency.
Component Description
Central Raspberry Pi
board Raspberry PI 3 Model B+
3.5 inches touch-screen Standard touchscreen connected
(and powered) to the Central board
Multiplexer chip
Component that allows the use of
two cameras on the same Raspberry
board
Raspberry Pi 3 V2 8MPx camera, RGB, 3g, Sony
IMX219
Raspberry Pi 3 V2 NoIR 8MPx camera, NoIR-GB, 3g, Sony
IMX219
Table 1. Components of the Raspberry-based device
The two cameras did not work simultaneously, but with 0,1
second delay between each other, which was considered
negligible for our applications. Moreover, to store the pictures
taken at 1Hz frequency, the resolution of the data was reduced
to 5 MP. The Raspberry Pi 3 cameras v2 employed were a
regular RGB Pi 3 camera v2 (Red, Green, Blue) and a NoIR Pi
3 camera v2 (NoIR-RGB). Camera calibration is fundamental
for any metric reconstruction from images (Nex and
Remondino, 2014). Thus, before the application in the field, the
NoIR camera module was tested in laboratory. Pagnutti et al.
(2017) realized an in-depth study on the Raspberry Pi 3 v2
RGB camera. Considering the already existing study regarding
the RGB Raspberry sensor, this contribution is focused on the
NoIR Camera Module calibration. Were performed a geometric
calibration of the sensor. The dark frame was assessed and
radiometric tests was realized.
Once the tested in laboratory, the Raspberry device was used in
the field during a UAV campaign in Niger.
3. GEOMETRIC CALIBRATION
The sensor was geometrically calibrated using a known size
chessboard. 20 pictures were taken from different angulations.
The distortion of the camera was then estimated using
MATLAB camera calibration tool (MATLAB, Computer
Vision ToolboxTM). The results are shown in Table 2.
Radial distortion of the lens is expressed by K1 and K2
coefficients (MATLAB, Computer Vision ToolboxTM). The
radial distortion coefficient k3 is 0. Tangential distortion of the
lens is expressed as p1 and p2 coefficients (MATLAB,
Computer Vision ToolboxTM). The estimated focal length is
expressed in millimetres. The principal point (i.e. the optical
centre of the camera) is in pixels. The mean reprojection error is
an extrinsic parameter that represent the average Euclidean
distance between reprojected and detected points and is
expressed in pixel (MATLAB, Computer Vision ToolboxTM).
Table 2, for each parameter show the σ (standard error) value on
x and y components that represents the uncertainty of the
estimated parameters. The errors have the same unit of measure
on the corresponding parameter and are expressed for both x
and y components. σ can be used to calculate the confidence
intervals.
x y x-error y-error
Radial distortion 0.1914 -0.4324 0.0093 0.0463
Tangential distortion -0.0026 -0.0113 0.0014 0.0015
Estimated focal length [mm] 2.28 2.29 0.0044 0.0039
Principal point [pixel] 1244 969 6.301 5.991
Mean reprojection error
[pixel] 0.663
Table 2. Geometric calibration results
4. RADIOMETRIC AND SPECTRAL ANALYSIS
4.1 Dark frame knowledge
The dark frame assessment was performed in constant
conditions of temperature (indoor, 21°C). The sensor was
covered with a black stopper and 50 pictures were captured ad
different ISO (100, 200, 300, 400, 500 and 600) and constant
exposure of 5ms. It was notice that the first 4 pictures acquired
were overexposed, thus discarded. The DNs of each band were
spatially averaged.
Figure 1. Raspberry-based device used in this study
The International Archives of the Photogrammetry, Remote Sensing and Spatial Information Sciences, Volume XLII-2/W13, 2019 ISPRS Geospatial Week 2019, 10–14 June 2019, Enschede, The Netherlands
This contribution has been peer-reviewed. https://doi.org/10.5194/isprs-archives-XLII-2-W13-207-2019 | © Authors 2019. CC BY 4.0 License.
208
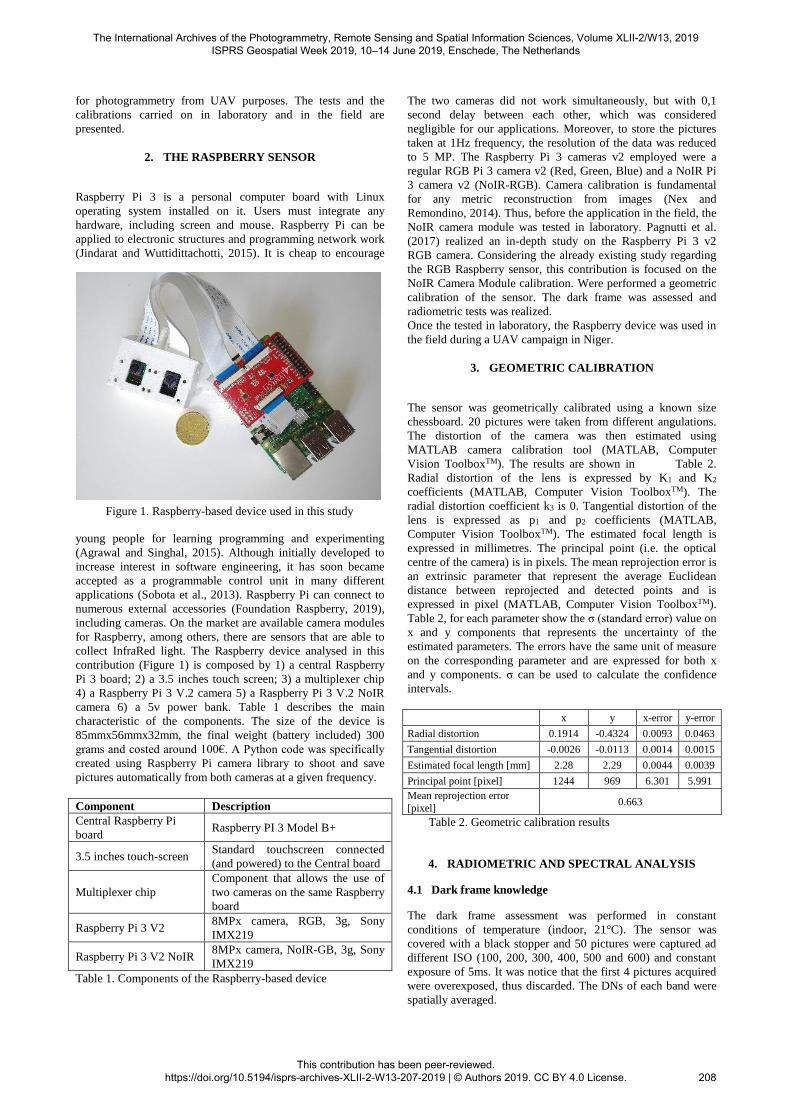
The results are three matrices (NoIR channel dark frame; green
channel dark frame; blue channel dark frame) for each ISO
setting. As expected, dark frame is ISO dependant: its values
increase for higher ISO (Figure 3). Table 3 reports the
histogram of DN distributions for the dark frame assessment for
ISO 100 and ISO 600.
4.2 Spectral response
Pagnutti et al. (2017) realize a study on the Raspberry Pi 3 v2
camera identifying the spectral resolution of its bands (Figure
2). A far as we know, there are no studies on the spectral
response of the Raspberry NoIR. The producer does not reveal
information in its regard, but that the NoIR camera is a
“standard” Raspberry PI camera without the IR filter
(RaspberryFoundation, 2019). This means that the camera is
able to detect InfraRed light, but is unknown which part of the
electromagnetic spectrum.
ISO Band Min
DN
Max
DN
Mean
DN
Median
DN STDev
100
1 0.00 32.60 0.34 0.20 0.13
2 0.70 35.90 1.81 1.60 0.17
3 0.00 32.40 0.25 0.00 0.14
200
1 0.00 30.80 0.01 0.00 0.04
2 0.00 31.00 0.08 0.00 0.05
3 0.00 30.00 0.01 0.00 0.04
300
1 0.00 19.60 0.03 0.00 0.06
2 0.00 19.30 0.04 0.00 0.06
3 0.00 19.90 0.03 0.00 0.05
400
1 0.00 43.60 0.24 0.10 0.09
2 0.00 25.00 0.24 0.20 0.08
3 0.00 22.60 0.23 0.15 0.08
500
1 0.00 50.00 0.58 0.40 0.14
2 0.00 33.40 0.46 0.40 0.10
3 0.00 35.20 0.43 0.30 0.11
600
1 0.00 45.80 0.66 0.50 0.15
2 0.00 32.90 0.60 0.50 0.11
3 0.00 36.80 0.61 0.50 0.12
Table 3. Dark frame assessment per band for different ISO
settings.
A clue regarding the radiometric resolution of the sensor derives
from the work of Hobbs et al. (Hobbs et al., 2016). They created
a spectrometer using a Raspberry Pi NoIR and it is sensible
between 415 nm and 775 nm. This includes part of the Near-
InfraRed spectrum. In order to better define the spectral
resolution of the device, NoIR data were checked against the
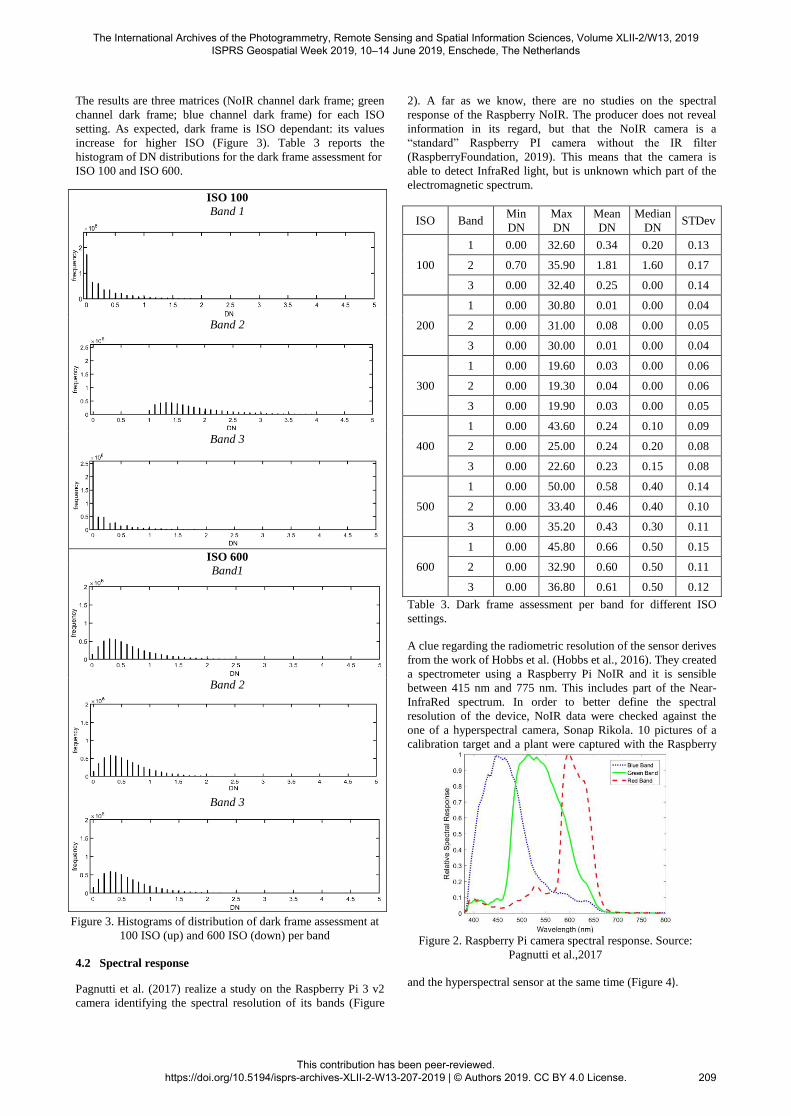
one of a hyperspectral camera, Sonap Rikola. 10 pictures of a
calibration target and a plant were captured with the Raspberry
and the hyperspectral sensor at the same time (Figure 4).
ISO 100
Band 1
Band 2
Band 3
ISO 600
Band1
Band 2
Band 3
Figure 3. Histograms of distribution of dark frame assessment at
100 ISO (up) and 600 ISO (down) per band Figure 2. Raspberry Pi camera spectral response. Source:
Pagnutti et al.,2017
The International Archives of the Photogrammetry, Remote Sensing and Spatial Information Sciences, Volume XLII-2/W13, 2019 ISPRS Geospatial Week 2019, 10–14 June 2019, Enschede, The Netherlands
This contribution has been peer-reviewed. https://doi.org/10.5194/isprs-archives-XLII-2-W13-207-2019 | © Authors 2019. CC BY 4.0 License.
209
The data were spatially averaged and dark frame subtracted. The
hyperspectral camera is not able to detect values below 500nm
(blue) of the spectrum, consequentially the blue band of the
Raspberry was not taken into consideration. 13 bands between
640 nm and 900 nm were acquired (amplitude of bands of
20nm). The spectral signatures of sample pixels from the scene
were extracted. The reflectance values of the green channel of
Raspberry (i.e. 550mn) were subtracted to the one of the
hyperspectral, showing a constant difference for the sample
pixels (Table 4).
Raspberry NoIR and hyperspectral reflectance
difference on Green band (550nm)
Dark Grey White Light Grey Black Vegetation
0.24 0.26 0.25 0.04 0.25
Table 4. Distances between Raspberry reflectance values of
green band and Hyperspectral ones. The data are referred to
sample pixels of the calibration panels.
Figure 4. Picture of the calibration scene taken by the NoIR
camera. On the left the calibration target composed by four
panels (white, light grey, dark grey and black). On the right,
side on the picture a plant. At the bottom of the picture is
visible the irradiance sensor of the hyperspectral.
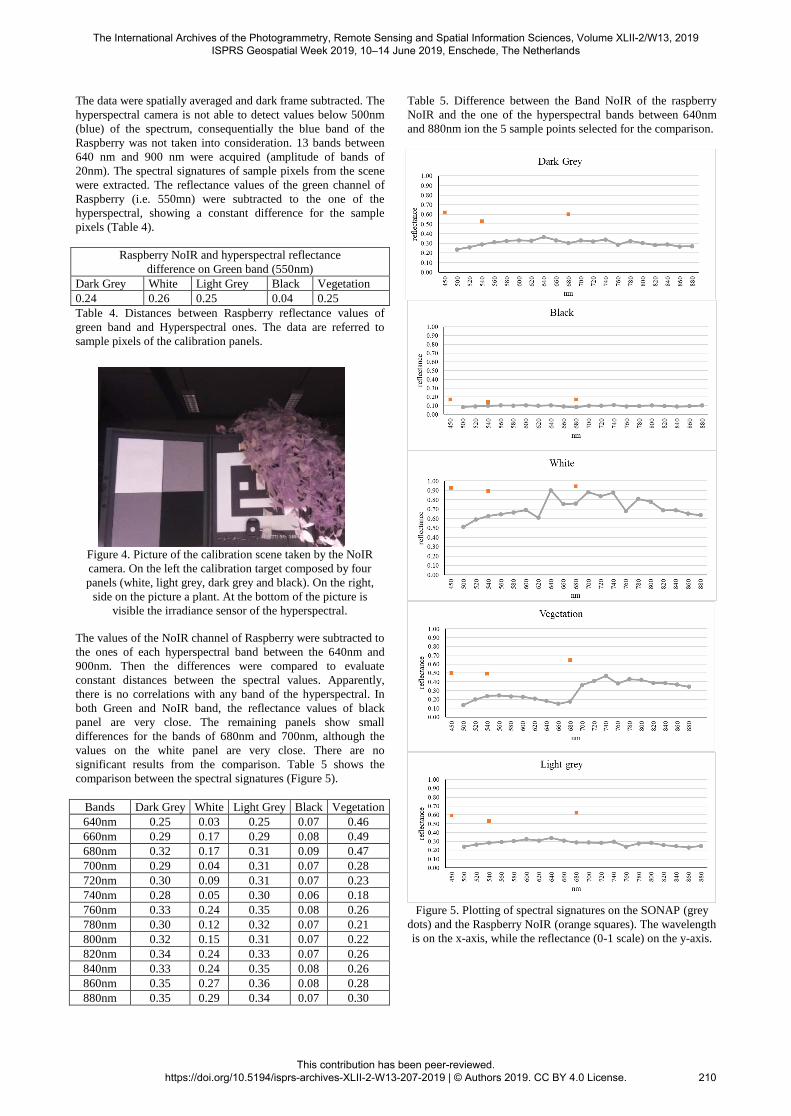
The values of the NoIR channel of Raspberry were subtracted to
the ones of each hyperspectral band between the 640nm and
900nm. Then the differences were compared to evaluate
constant distances between the spectral values. Apparently,
there is no correlations with any band of the hyperspectral. In
both Green and NoIR band, the reflectance values of black
panel are very close. The remaining panels show small
differences for the bands of 680nm and 700nm, although the
values on the white panel are very close. There are no
significant results from the comparison. Table 5 shows the
comparison between the spectral signatures (Figure 5).
Bands Dark Grey White Light Grey Black Vegetation
640nm 0.25 0.03 0.25 0.07 0.46
660nm 0.29 0.17 0.29 0.08 0.49
680nm 0.32 0.17 0.31 0.09 0.47
700nm 0.29 0.04 0.31 0.07 0.28
720nm 0.30 0.09 0.31 0.07 0.23
740nm 0.28 0.05 0.30 0.06 0.18
760nm 0.33 0.24 0.35 0.08 0.26
780nm 0.30 0.12 0.32 0.07 0.21
800nm 0.32 0.15 0.31 0.07 0.22
820nm 0.34 0.24 0.33 0.07 0.26
840nm 0.33 0.24 0.35 0.08 0.26
860nm 0.35 0.27 0.36 0.08 0.28
880nm 0.35 0.29 0.34 0.07 0.30
Table 5. Difference between the Band NoIR of the raspberry
NoIR and the one of the hyperspectral bands between 640nm
and 880nm ion the 5 sample points selected for the comparison.
Figure 5. Plotting of spectral signatures on the SONAP (grey
dots) and the Raspberry NoIR (orange squares). The wavelength
is on the x-axis, while the reflectance (0-1 scale) on the y-axis.
The International Archives of the Photogrammetry, Remote Sensing and Spatial Information Sciences, Volume XLII-2/W13, 2019 ISPRS Geospatial Week 2019, 10–14 June 2019, Enschede, The Netherlands
This contribution has been peer-reviewed. https://doi.org/10.5194/isprs-archives-XLII-2-W13-207-2019 | © Authors 2019. CC BY 4.0 License.
210
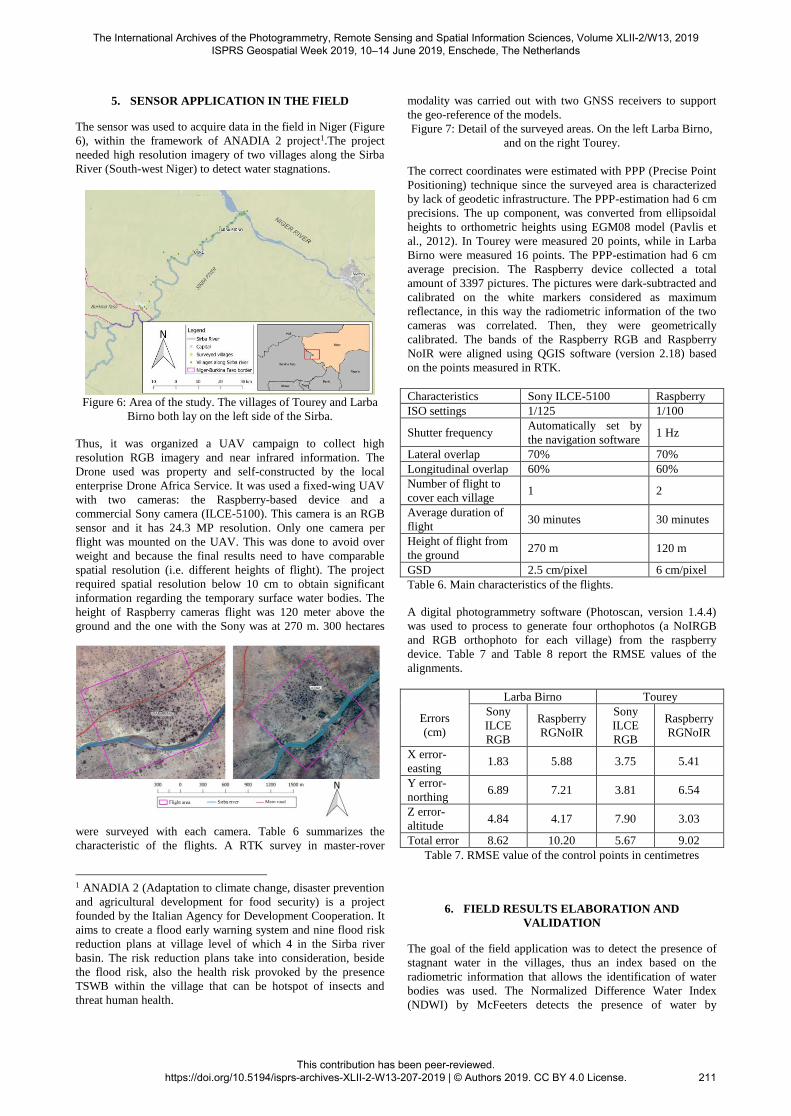
5. SENSOR APPLICATION IN THE FIELD
The sensor was used to acquire data in the field in Niger (Figure
6), within the framework of ANADIA 2 project1.The project
needed high resolution imagery of two villages along the Sirba
River (South-west Niger) to detect water stagnations.
Figure 6: Area of the study. The villages of Tourey and Larba
Birno both lay on the left side of the Sirba.
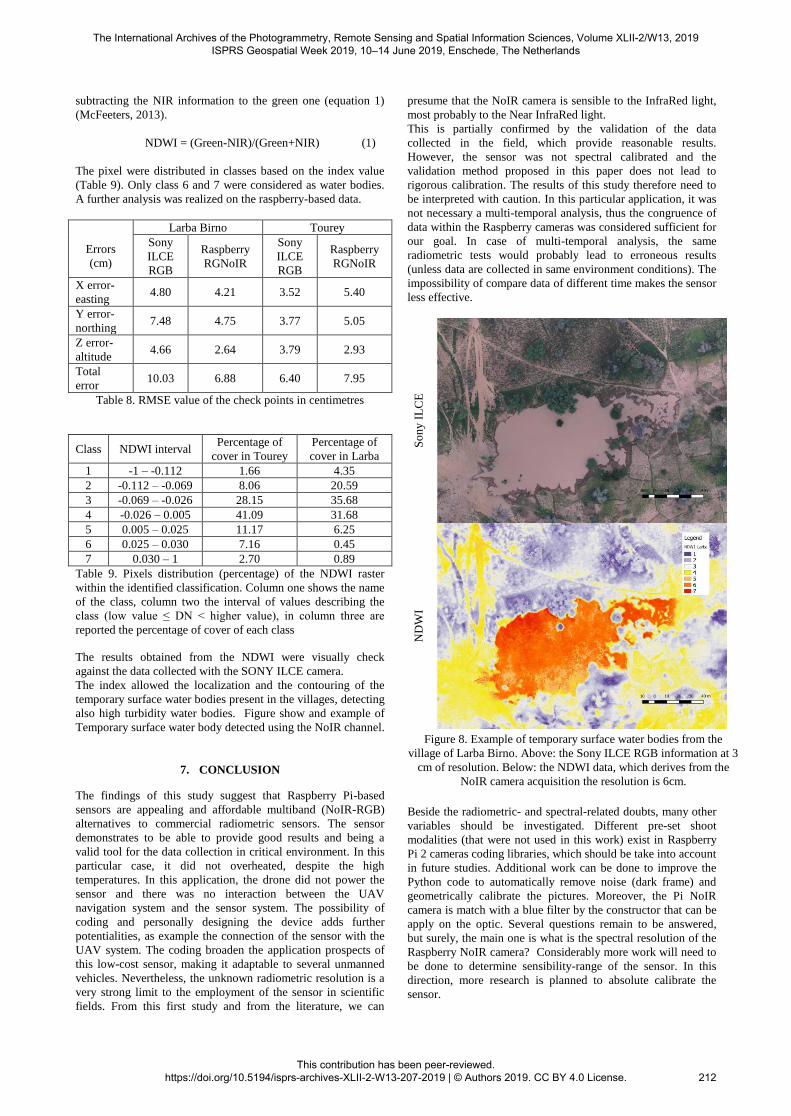
Thus, it was organized a UAV campaign to collect high
resolution RGB imagery and near infrared information. The
Drone used was property and self-constructed by the local
enterprise Drone Africa Service. It was used a fixed-wing UAV
with two cameras: the Raspberry-based device and a
commercial Sony camera (ILCE-5100). This camera is an RGB
sensor and it has 24.3 MP resolution. Only one camera per
flight was mounted on the UAV. This was done to avoid over
weight and because the final results need to have comparable
spatial resolution (i.e. different heights of flight). The project
required spatial resolution below 10 cm to obtain significant
information regarding the temporary surface water bodies. The
height of Raspberry cameras flight was 120 meter above the
ground and the one with the Sony was at 270 m. 300 hectares
were surveyed with each camera. Table 6 summarizes the
characteristic of the flights. A RTK survey in master-rover
1 ANADIA 2 (Adaptation to climate change, disaster prevention
and agricultural development for food security) is a project
founded by the Italian Agency for Development Cooperation. It
aims to create a flood early warning system and nine flood risk
reduction plans at village level of which 4 in the Sirba river
basin. The risk reduction plans take into consideration, beside
the flood risk, also the health risk provoked by the presence
TSWB within the village that can be hotspot of insects and
threat human health.
modality was carried out with two GNSS receivers to support
the geo-reference of the models.
Figure 7: Detail of the surveyed areas. On the left Larba Birno,
and on the right Tourey.
The correct coordinates were estimated with PPP (Precise Point
Positioning) technique since the surveyed area is characterized
by lack of geodetic infrastructure. The PPP-estimation had 6 cm
precisions. The up component, was converted from ellipsoidal
heights to orthometric heights using EGM08 model (Pavlis et
al., 2012). In Tourey were measured 20 points, while in Larba
Birno were measured 16 points. The PPP-estimation had 6 cm
average precision. The Raspberry device collected a total
amount of 3397 pictures. The pictures were dark-subtracted and
calibrated on the white markers considered as maximum
reflectance, in this way the radiometric information of the two
cameras was correlated. Then, they were geometrically
calibrated. The bands of the Raspberry RGB and Raspberry
NoIR were aligned using QGIS software (version 2.18) based
on the points measured in RTK.
Characteristics Sony ILCE-5100 Raspberry
ISO settings 1/125 1/100
Shutter frequency Automatically set by
the navigation software 1 Hz
Lateral overlap 70% 70%
Longitudinal overlap 60% 60%
Number of flight to
cover each village 1 2
Average duration of
flight 30 minutes 30 minutes
Height of flight from
the ground 270 m 120 m
GSD 2.5 cm/pixel 6 cm/pixel
Table 6. Main characteristics of the flights.
A digital photogrammetry software (Photoscan, version 1.4.4)
was used to process to generate four orthophotos (a NoIRGB
and RGB orthophoto for each village) from the raspberry
device. Table 7 and Table 8 report the RMSE values of the
alignments.
Errors
(cm)
Larba Birno Tourey
Sony
ILCE
RGB
Raspberry
RGNoIR
Sony
ILCE
RGB
Raspberry
RGNoIR
X error-
easting 1.83 5.88 3.75 5.41
Y error-
northing 6.89 7.21 3.81 6.54
Z error-
altitude 4.84 4.17 7.90 3.03
Total error 8.62 10.20 5.67 9.02
Table 7. RMSE value of the control points in centimetres
6. FIELD RESULTS ELABORATION AND
VALIDATION
The goal of the field application was to detect the presence of
stagnant water in the villages, thus an index based on the
radiometric information that allows the identification of water
bodies was used. The Normalized Difference Water Index
(NDWI) by McFeeters detects the presence of water by
The International Archives of the Photogrammetry, Remote Sensing and Spatial Information Sciences, Volume XLII-2/W13, 2019 ISPRS Geospatial Week 2019, 10–14 June 2019, Enschede, The Netherlands
This contribution has been peer-reviewed. https://doi.org/10.5194/isprs-archives-XLII-2-W13-207-2019 | © Authors 2019. CC BY 4.0 License.
211
subtracting the NIR information to the green one (equation 1)
(McFeeters, 2013).
NDWI = (Green-NIR)/(Green+NIR) (1)
The pixel were distributed in classes based on the index value
(Table 9). Only class 6 and 7 were considered as water bodies.
A further analysis was realized on the raspberry-based data.
Errors
(cm)
Larba Birno Tourey
Sony
ILCE
RGB
Raspberry
RGNoIR
Sony
ILCE
RGB
Raspberry
RGNoIR
X error-
easting 4.80 4.21 3.52 5.40
Y error-
northing 7.48 4.75 3.77 5.05
Z error-
altitude 4.66 2.64 3.79 2.93
Total
error 10.03 6.88 6.40 7.95
Table 8. RMSE value of the check points in centimetres
Class NDWI interval Percentage of
cover in Tourey
Percentage of
cover in Larba
1 -1 – -0.112 1.66 4.35
2 -0.112 – -0.069 8.06 20.59
3 -0.069 – -0.026 28.15 35.68
4 -0.026 – 0.005 41.09 31.68
5 0.005 – 0.025 11.17 6.25
6 0.025 – 0.030 7.16 0.45
7 0.030 – 1 2.70 0.89
Table 9. Pixels distribution (percentage) of the NDWI raster
within the identified classification. Column one shows the name
of the class, column two the interval of values describing the
class (low value ≤ DN < higher value), in column three are
reported the percentage of cover of each class
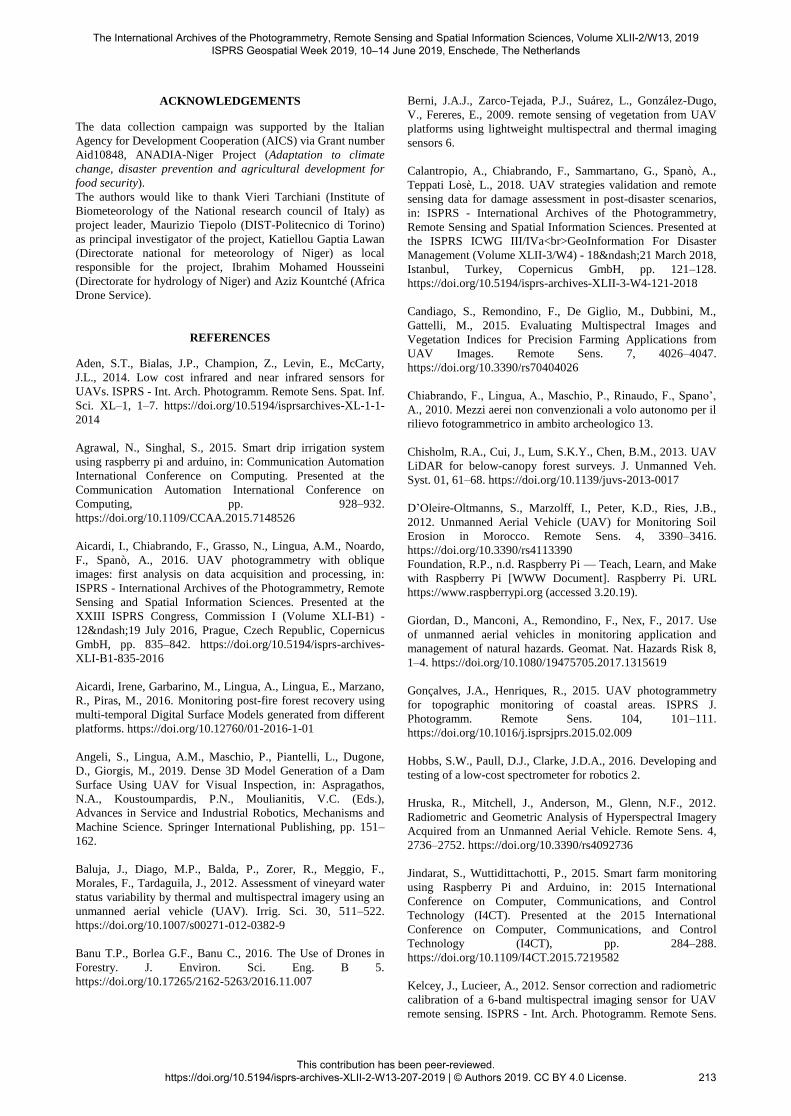
The results obtained from the NDWI were visually check
against the data collected with the SONY ILCE camera.
The index allowed the localization and the contouring of the
temporary surface water bodies present in the villages, detecting
also high turbidity water bodies. Figure show and example of
Temporary surface water body detected using the NoIR channel.
7. CONCLUSION
The findings of this study suggest that Raspberry Pi-based
sensors are appealing and affordable multiband (NoIR-RGB)
alternatives to commercial radiometric sensors. The sensor
demonstrates to be able to provide good results and being a
valid tool for the data collection in critical environment. In this
particular case, it did not overheated, despite the high
temperatures. In this application, the drone did not power the
sensor and there was no interaction between the UAV
navigation system and the sensor system. The possibility of
coding and personally designing the device adds further
potentialities, as example the connection of the sensor with the
UAV system. The coding broaden the application prospects of
this low-cost sensor, making it adaptable to several unmanned
vehicles. Nevertheless, the unknown radiometric resolution is a
very strong limit to the employment of the sensor in scientific
fields. From this first study and from the literature, we can
presume that the NoIR camera is sensible to the InfraRed light,
most probably to the Near InfraRed light.
This is partially confirmed by the validation of the data
collected in the field, which provide reasonable results.
However, the sensor was not spectral calibrated and the
validation method proposed in this paper does not lead to
rigorous calibration. The results of this study therefore need to
be interpreted with caution. In this particular application, it was
not necessary a multi-temporal analysis, thus the congruence of
data within the Raspberry cameras was considered sufficient for
our goal. In case of multi-temporal analysis, the same
radiometric tests would probably lead to erroneous results
(unless data are collected in same environment conditions). The
impossibility of compare data of different time makes the sensor
less effective.
So
ny
IL
CE
ND
WI
Figure 8. Example of temporary surface water bodies from the
village of Larba Birno. Above: the Sony ILCE RGB information at 3
cm of resolution. Below: the NDWI data, which derives from the
NoIR camera acquisition the resolution is 6cm.
Beside the radiometric- and spectral-related doubts, many other
variables should be investigated. Different pre-set shoot
modalities (that were not used in this work) exist in Raspberry
Pi 2 cameras coding libraries, which should be take into account
in future studies. Additional work can be done to improve the
Python code to automatically remove noise (dark frame) and
geometrically calibrate the pictures. Moreover, the Pi NoIR
camera is match with a blue filter by the constructor that can be
apply on the optic. Several questions remain to be answered,
but surely, the main one is what is the spectral resolution of the
Raspberry NoIR camera? Considerably more work will need to
be done to determine sensibility-range of the sensor. In this
direction, more research is planned to absolute calibrate the
sensor.
The International Archives of the Photogrammetry, Remote Sensing and Spatial Information Sciences, Volume XLII-2/W13, 2019 ISPRS Geospatial Week 2019, 10–14 June 2019, Enschede, The Netherlands
This contribution has been peer-reviewed. https://doi.org/10.5194/isprs-archives-XLII-2-W13-207-2019 | © Authors 2019. CC BY 4.0 License.
212
ACKNOWLEDGEMENTS
The data collection campaign was supported by the Italian
Agency for Development Cooperation (AICS) via Grant number
Aid10848, ANADIA-Niger Project (Adaptation to climate
change, disaster prevention and agricultural development for
food security).
The authors would like to thank Vieri Tarchiani (Institute of
Biometeorology of the National research council of Italy) as
project leader, Maurizio Tiepolo (DIST-Politecnico di Torino)
as principal investigator of the project, Katiellou Gaptia Lawan
(Directorate national for meteorology of Niger) as local
responsible for the project, Ibrahim Mohamed Housseini
(Directorate for hydrology of Niger) and Aziz Kountché (Africa
Drone Service).
REFERENCES
Aden, S.T., Bialas, J.P., Champion, Z., Levin, E., McCarty,
J.L., 2014. Low cost infrared and near infrared sensors for
UAVs. ISPRS - Int. Arch. Photogramm. Remote Sens. Spat. Inf.
Sci. XL–1, 1–7. https://doi.org/10.5194/isprsarchives-XL-1-1-
2014
Agrawal, N., Singhal, S., 2015. Smart drip irrigation system
using raspberry pi and arduino, in: Communication Automation
International Conference on Computing. Presented at the
Communication Automation International Conference on
Computing, pp. 928–932.
https://doi.org/10.1109/CCAA.2015.7148526
Aicardi, I., Chiabrando, F., Grasso, N., Lingua, A.M., Noardo,
F., Spanò, A., 2016. UAV photogrammetry with oblique
images: first analysis on data acquisition and processing, in:
ISPRS - International Archives of the Photogrammetry, Remote
Sensing and Spatial Information Sciences. Presented at the
XXIII ISPRS Congress, Commission I (Volume XLI-B1) -
12–19 July 2016, Prague, Czech Republic, Copernicus
GmbH, pp. 835–842. https://doi.org/10.5194/isprs-archives-
XLI-B1-835-2016
Aicardi, Irene, Garbarino, M., Lingua, A., Lingua, E., Marzano,
R., Piras, M., 2016. Monitoring post-fire forest recovery using
multi-temporal Digital Surface Models generated from different
platforms. https://doi.org/10.12760/01-2016-1-01
Angeli, S., Lingua, A.M., Maschio, P., Piantelli, L., Dugone,
D., Giorgis, M., 2019. Dense 3D Model Generation of a Dam
Surface Using UAV for Visual Inspection, in: Aspragathos,
N.A., Koustoumpardis, P.N., Moulianitis, V.C. (Eds.),
Advances in Service and Industrial Robotics, Mechanisms and
Machine Science. Springer International Publishing, pp. 151–
162.
Baluja, J., Diago, M.P., Balda, P., Zorer, R., Meggio, F.,
Morales, F., Tardaguila, J., 2012. Assessment of vineyard water
status variability by thermal and multispectral imagery using an
unmanned aerial vehicle (UAV). Irrig. Sci. 30, 511–522.
https://doi.org/10.1007/s00271-012-0382-9
Banu T.P., Borlea G.F., Banu C., 2016. The Use of Drones in
Forestry. J. Environ. Sci. Eng. B 5.
https://doi.org/10.17265/2162-5263/2016.11.007
Berni, J.A.J., Zarco-Tejada, P.J., Suárez, L., González-Dugo,
V., Fereres, E., 2009. remote sensing of vegetation from UAV
platforms using lightweight multispectral and thermal imaging
sensors 6.
Calantropio, A., Chiabrando, F., Sammartano, G., Spanò, A.,
Teppati Losè, L., 2018. UAV strategies validation and remote
sensing data for damage assessment in post-disaster scenarios,
in: ISPRS - International Archives of the Photogrammetry,
Remote Sensing and Spatial Information Sciences. Presented at
the ISPRS ICWG III/IVa<br>GeoInformation For Disaster
Management (Volume XLII-3/W4) - 18–21 March 2018,
Istanbul, Turkey, Copernicus GmbH, pp. 121–128.
https://doi.org/10.5194/isprs-archives-XLII-3-W4-121-2018
Candiago, S., Remondino, F., De Giglio, M., Dubbini, M.,
Gattelli, M., 2015. Evaluating Multispectral Images and
Vegetation Indices for Precision Farming Applications from
UAV Images. Remote Sens. 7, 4026–4047.
https://doi.org/10.3390/rs70404026
Chiabrando, F., Lingua, A., Maschio, P., Rinaudo, F., Spano’,
A., 2010. Mezzi aerei non convenzionali a volo autonomo per il
rilievo fotogrammetrico in ambito archeologico 13.
Chisholm, R.A., Cui, J., Lum, S.K.Y., Chen, B.M., 2013. UAV
LiDAR for below-canopy forest surveys. J. Unmanned Veh.
Syst. 01, 61–68. https://doi.org/10.1139/juvs-2013-0017
D’Oleire-Oltmanns, S., Marzolff, I., Peter, K.D., Ries, J.B.,
2012. Unmanned Aerial Vehicle (UAV) for Monitoring Soil
Erosion in Morocco. Remote Sens. 4, 3390–3416.
https://doi.org/10.3390/rs4113390
Foundation, R.P., n.d. Raspberry Pi — Teach, Learn, and Make
with Raspberry Pi [WWW Document]. Raspberry Pi. URL
https://www.raspberrypi.org (accessed 3.20.19).
Giordan, D., Manconi, A., Remondino, F., Nex, F., 2017. Use
of unmanned aerial vehicles in monitoring application and
management of natural hazards. Geomat. Nat. Hazards Risk 8,
1–4. https://doi.org/10.1080/19475705.2017.1315619
Gonçalves, J.A., Henriques, R., 2015. UAV photogrammetry
for topographic monitoring of coastal areas. ISPRS J.
Photogramm. Remote Sens. 104, 101–111.
https://doi.org/10.1016/j.isprsjprs.2015.02.009
Hobbs, S.W., Paull, D.J., Clarke, J.D.A., 2016. Developing and
testing of a low-cost spectrometer for robotics 2.
Hruska, R., Mitchell, J., Anderson, M., Glenn, N.F., 2012.
Radiometric and Geometric Analysis of Hyperspectral Imagery
Acquired from an Unmanned Aerial Vehicle. Remote Sens. 4,
2736–2752. https://doi.org/10.3390/rs4092736
Jindarat, S., Wuttidittachotti, P., 2015. Smart farm monitoring
using Raspberry Pi and Arduino, in: 2015 International
Conference on Computer, Communications, and Control
Technology (I4CT). Presented at the 2015 International
Conference on Computer, Communications, and Control
Technology (I4CT), pp. 284–288.
https://doi.org/10.1109/I4CT.2015.7219582
Kelcey, J., Lucieer, A., 2012. Sensor correction and radiometric
calibration of a 6-band multispectral imaging sensor for UAV
remote sensing. ISPRS - Int. Arch. Photogramm. Remote Sens.
The International Archives of the Photogrammetry, Remote Sensing and Spatial Information Sciences, Volume XLII-2/W13, 2019 ISPRS Geospatial Week 2019, 10–14 June 2019, Enschede, The Netherlands
This contribution has been peer-reviewed. https://doi.org/10.5194/isprs-archives-XLII-2-W13-207-2019 | © Authors 2019. CC BY 4.0 License.
213
Spat. Inf. Sci. XXXIX-B1, 393–398.
https://doi.org/10.5194/isprsarchives-XXXIX-B1-393-2012
Kingston, D., Beard, R., n.d. Real-Time Attitude and Position
Estimation for Small UAVs Using Low-Cost Sensors, in: AIAA
3rd “Unmanned Unlimited” Technical Conference, Workshop
and Exhibit. American Institute of Aeronautics and
Astronautics. https://doi.org/10.2514/6.2004-6488
McFeeters, S.K., 2013. Using the Normalized Difference Water
Index (NDWI) within a Geographic Information System to
Detect Swimming Pools for Mosquito Abatement: A Practical
Approach. Remote Sens. 5, 3544–3561.
https://doi.org/10.3390/rs5073544
Nex, F., Remondino, F., 2014. UAV for 3D mapping
applications: a review. Appl. Geomat. 6, 1–15.
https://doi.org/10.1007/s12518-013-0120-x
Pagnutti, M.A., Ryan, R.E., Cazenavette, G.J., Gold, M.J.,
Harlan, R., Leggett, E., Pagnutti, J.F., 2017. Laying the
foundation to use Raspberry Pi 3 V2 camera module imagery
for scientific and engineering purposes. J. Electron. Imaging 26,
013014. https://doi.org/10.1117/1.JEI.26.1.013014
Pavlis, N.K., Holmes, S.A., Kenyon, S.C., Factor, J.K., 2012.
The development and evaluation of the Earth Gravitational
Model 2008 (EGM2008). J. Geophys. Res. Solid Earth 117.
https://doi.org/10.1029/2011JB008916
Piras, M., Taddia, G., Forno, M.G., Gattiglio, M., Aicardi, I.,
Dabove, P., Russo, S.L., Lingua, A., 2017. Detailed geological
mapping in mountain areas using an unmanned aerial vehicle:
application to the Rodoretto Valley, NW Italian Alps. Geomat.
Nat. Hazards Risk 8, 137–149.
https://doi.org/10.1080/19475705.2016.1225228
Pla, M., Duane, A., Brotons, L., 2017. Potential of UAV images
as ground-truth data for burn severity classification of Landsat
imagery: approaches to an useful product for post-fire
management. Rev. Teledetec. 0, 91–102.
https://doi.org/10.4995/raet.2017.7140
Skoglar, P., Orguner, U., Törnqvist, D., Gustafsson, F., 2012.
Road Target Search and Tracking with Gimballed Vision
Sensor on an Unmanned Aerial Vehicle. Remote Sens. 4, 2076–
2111. https://doi.org/10.3390/rs4072076
Sobota, J., PiŜl, R., Balda, P., Schlegel, M., 2013. Raspberry Pi
and Arduino boards in control education. IFAC Proc. Vol., 10th
IFAC Symposium Advances in Control Education 46, 7–12.
https://doi.org/10.3182/20130828-3-UK-2039.00003
Tulldahl, H.M., Bissmarck, F., Larsson, H., Grönwall, C., Tolt,
G., 2015. Accuracy evaluation of 3D lidar data from small
UAV, in: Electro-Optical Remote Sensing, Photonic
Technologies, and Applications IX. Presented at the Electro-
Optical Remote Sensing, Photonic Technologies, and
Applications IX, International Society for Optics and Photonics,
p. 964903. https://doi.org/10.1117/12.2194508
Wallace, L., Lucieer, A., Watson, C., Turner, D., 2012.
Development of a UAV-LiDAR System with Application to
Forest Inventory. Remote Sens. 4, 1519–1543.
https://doi.org/10.3390/rs4061519
The International Archives of the Photogrammetry, Remote Sensing and Spatial Information Sciences, Volume XLII-2/W13, 2019 ISPRS Geospatial Week 2019, 10–14 June 2019, Enschede, The Netherlands
This contribution has been peer-reviewed. https://doi.org/10.5194/isprs-archives-XLII-2-W13-207-2019 | © Authors 2019. CC BY 4.0 License.
214
Recommended