Proceedings World Geothermal Congress 2020
Reykjavik, Iceland, April 26 – May 2, 2020
1
Real Time Monitoring of Airborne Hydrogen Sulfide Using Pulsed Fluorescence SO2-H2S-
CS Analyzers
Sverrir Óskar Elefsen
Mannvit Consulting Engineers, Urðarhvarf 6, 203 Kópavogur, Iceland
Ásgerður K. Sigurðardóttir
Landsvirkjun, Háaleitisbraut 68, 103 Reykjavík, Iceland
Keywords: hydrogen sulfide, H2S, pulsed fluorescence, environment, health
ABSTRACT
The paper describes results from real time monitoring of Airborne Hydrogen Sulfide (H2S) in NE-Iceland, i.e. the lake Mývatn area,
town of Húsavík and the area of Kelduhverfi. In general, the H2S concentration is low and below regulatory limits in all the areas.
Located close to both natural emissions of H2S as well as geothermal power plants in Bjarnarflag and Krafla, stations in the Mývatn
area generally show higher concentrations of H2S than observed in Húsavík and Kelduhverfi. Stations in Húsavík and Kelduhverfi
are not close to any major sources of H2S, but the Húsavík station shows signs of H2S emission from the Theistareykir geothermal
power plant. Clear relationship is observed between H2S concentration and weather conditions. For a given station, the highest H2S
concentrations normally are measured during cold weather (<0°C) and light breeze from certain wind directions. Inversion in the
troposphere occurs, when a layer of cold air at the surface is overlain by a layer of warmer air, resulting in accumulation of H2S near
the surface. Periods of H2S accumulation are rare and short term.
1. INTRODUCTION
Landsvirkjun is owned by the Icelandic state and produces 75% of all electricity used in Iceland. In addition to multiple hydro power
plants, the company operates three geothermal power plants, in NE-Iceland. The Bjarnarflag (1969) and Krafla (1977) power plants
are in the Mývatn area and the Theistareykir (2017) power plant is about 20 km towards north from the lake. In order to monitor the
air quality in local settlements, the company has installed four automatic H2S and weather monitoring stations. Two of these stations,
Reykjahlíð and Vogar, are in the Mývatn area and the other two are closer to the Theistareykir power plant, in town of Húsavík and
in Kelduhverfi, respectively. Time series of H2S concentration in NE-Iceland reach back to 2011. The above-mentioned monitoring
stations have been in simultaneous operation since 2015.
The H2S analyzers used in this project operate on the principle that H2S can be converted to sulfur dioxide (SO2). The amount of SO2
molecules in an air sample is proportional to the energy emitted when SO2 molecules, excited in ultraviolet light, decay to a lower
energy state. A built-in converter is used to convert H2S and any reduced sulfur species to SO2. The inferred H2S reading is the
difference in SO2 between two measurements of ambient air, one without and the other after being shunted through the converter[1].
The type of equipment used in Reykjahlíð and Vogar is Airpointer 2D, but Thermo 450i in Húsavík and Kelduhverfi. The built-in
converter uses a molybdenum catalyst to convert H2S to SO2. Experiments have shown, that the conversion efficiency of the catalyst
may be reduced as the relative humidity of air increases. This would lead to under-estimation of the actual H2S concentration[2].
Instruments used in Iceland have not been tested for relative humidity interference.
Icelandic regulation on the concentration of hydrogen sulfide in atmospheric air[3] is stricter than for example WHO’s “Air quality
guidelines for Europe “[4]. Due to technical limitations of the monitoring equipment, such as detection limits and zero noise, it can be
hard to demonstrate that air quality is within Icelandic regulatory limits.
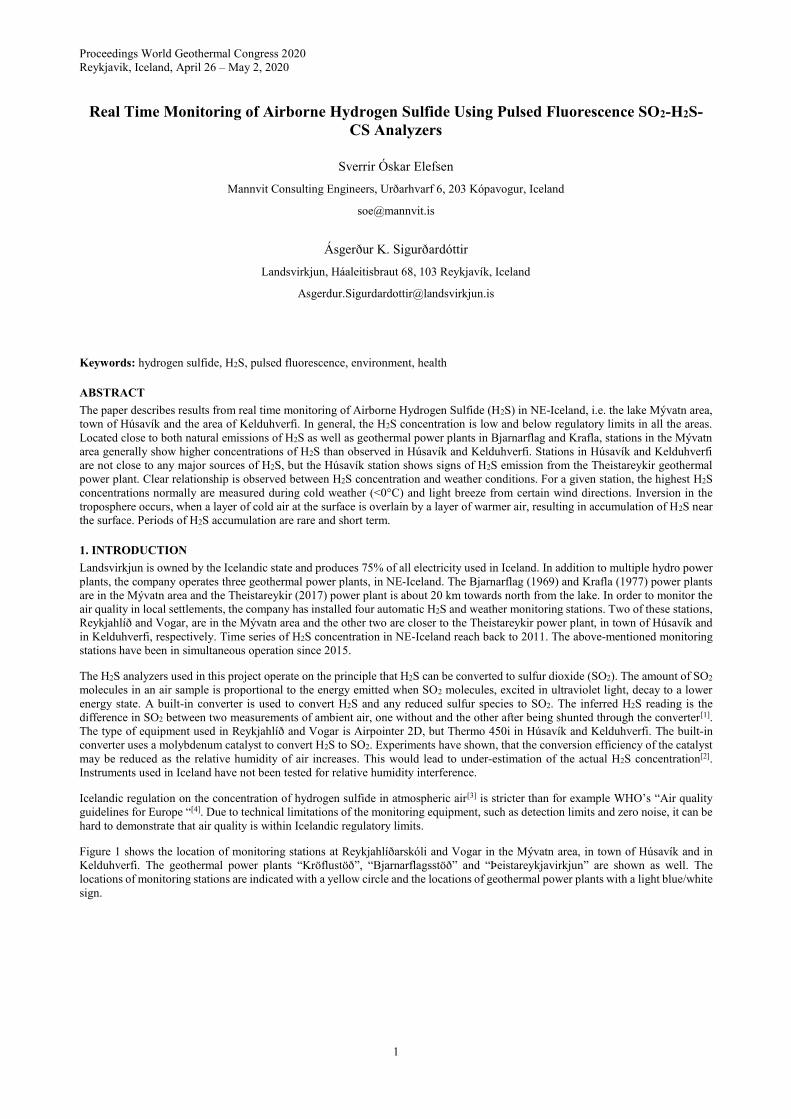
Figure 1 shows the location of monitoring stations at Reykjahlíðarskóli and Vogar in the Mývatn area, in town of Húsavík and in
Kelduhverfi. The geothermal power plants “Kröflustöð”, “Bjarnarflagsstöð” and “Þeistareykjavirkjun” are shown as well. The
locations of monitoring stations are indicated with a yellow circle and the locations of geothermal power plants with a light blue/white
sign.
Elefsen and Sigurðardóttir
2
Figure 1. Geothermal power plants and H2S monitoring stations in NE-Iceland.
Elefsen and Sigurðardóttir
3
2. MEASURED CONCENTRATIONS AND REGULATORY LIMITS
Environmental limits for hydrogen sulfide concentration in atmospheric air are defined in the Icelandic regulation on the concentration
of hydrogen sulfide in the atmosphere, regulation no. 514/2010[3]. The limits are divided into two categories, health-limits and a
“notification-limit”. The limits correspond to the concentration of H2S in g/m3 (micrograms pr. cubic meter) at 293 K and 1013 hPa,
see table 1.
Table 1. Environmental limits for airborne H2S in Iceland.
Environmental limit Description Value [g/m3] Deviations
Health limit #1 Daily maximum of 24-hour
running average
50 May be exceeded 3 times
annually
Health limit #2 Annual mean 5 May not be exceed
Notification limit Three-hour average 150 Must be reported every time
In practice, the logged concentration of H2S is a 10 minutes average mole fraction of H2S in parts pr. billion (ppb). The conversion
from ppb to g/m3 at 293 K and 1013 hPa is based on the ideal gas law, by multiplying the logged value in ppb with 1.42. The 24-
hour running average is calculated every 10 minutes and contains the last 144 logged values. The three-hour average contains the last
18 logged values[5].
As mentioned, the monitoring stations measure the concentration of SO2 and not H2S. The inferred H2S reading is the difference in
SO2 between two measurements of ambient air, one without and the other after being shunted through a converter where a catalyst
converts H2S and any reduced sulfur species to SO2. For low H2S concentrations, the accuracy in determining the SO2 can result in
both positive and negative values of H2S. It is generally recognized that uncertainty in the measurement of H2S is +/- 3 g/m3. Notice,
that the uncertainty is of the same magnitude as health limit #2.
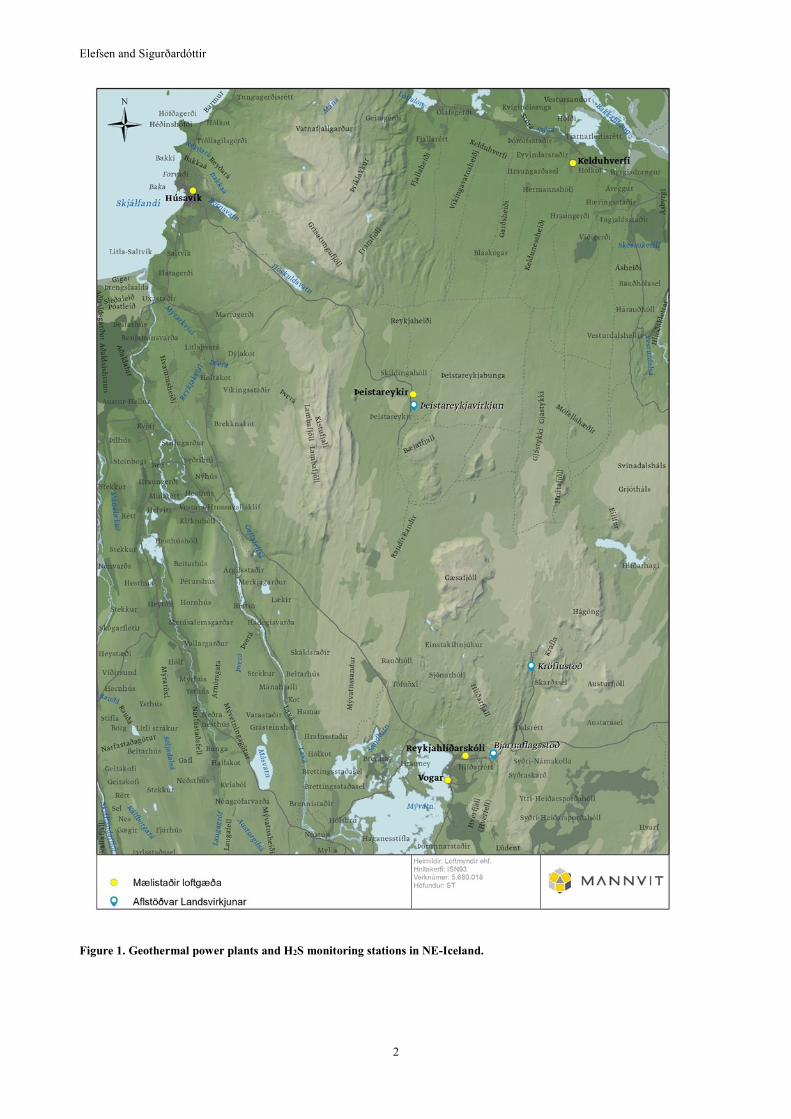
Figure 2 shows the H2S concentration at Vogar and Húsavík, the daily maximum of 24-hour running average from 2015 to 2018[6,7].
A green line indicates the corresponding health limit #1. During the 4-year period, the daily value exceeded the health limit twice at
Vogar, in January 20 and 21, 2016, but the limit was not exceeded in Húsavík. The daily maximum of 24-hour running average in
Reykjahlíð and Kelduhverfi never exceeded the limit.
Figure 2. Concentration of H2S in Vogar and Húsavík, daily maximum of 24-hour running average.
The annual mean values of H2S concentration are shown in table 2. Compared to the regulatory health limit #2, none of these values
exceeded the limit during 2015 to 2018.
01.01.2015 01.07.2015 01.01.2016 01.07.2016 01.01.2017 01.07.2017 01.01.2018 01.07.2018
Sty
rkur
H2S
[µg/
m³]
0
5
10
15
20
25
30
35
40
45
50
55
60
65
Con
cent
ratio
n of
H2S
HÚSAVÍK - DAILY MAX OF 24H RAVG
VOGAR - DAILY MAX OF 24H RAVG
HEALTH LIMIT #1
Elefsen and Sigurðardóttir
4
Table 2. Annual mean values of H2S in g/m3, 2015 through 2018.
YEAR VOGAR REYKJAHLÍÐ KELDUHVERFI HÚSAVÍK
2015 3 3 1 0
2016 5 5 1 0
2017 4 4 1 1
2018 3 3 1 1
3. THE EFFECT OF GEOGRAPHIC LOCATION AND WEATHER CONDITIONS.
In order to understand the variability in the measured H2S concentration, it is useful to look further into both the geographic location
of the relevant monitoring stations as well as the weather conditions. As a case study, the following subsections will discuss these
effects on measurement results from Vogar in 2016.
3.1 Geographic location
The geographic location of the monitoring station in Vogar is shown in figure 1. The station is located next to Mývatn and close to
both natural emissions of H2S as well as geothermal power plants and steam wells emitting H2S. The Krafla plant is located 11 km
towards northeast (36°), the Bjarnarflag plant is 4 km towards east-northeast (60°) and steam wells in Bjarnarflag are at around 70°.
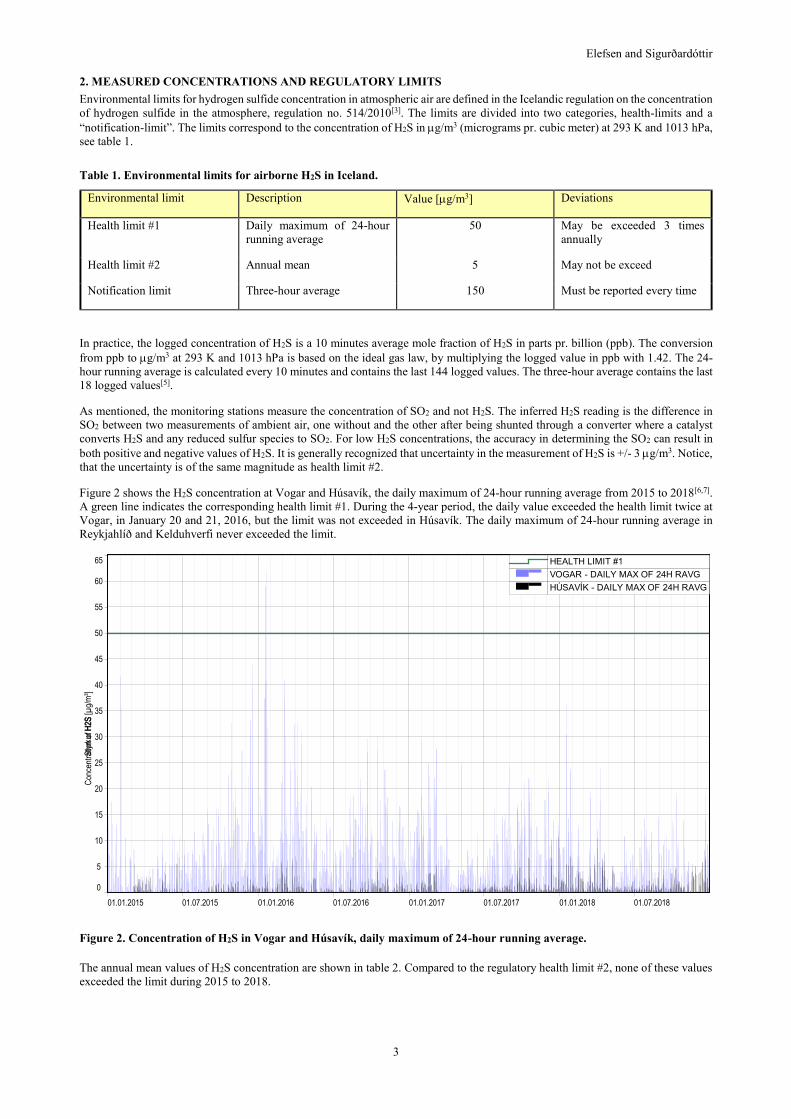
A new plant is planned in Bjarnarflag at 80° but has not been built. Figure 3 shows the H2S concentration in Vogar as a function of
wind direction, as measured during 2016. The red line shows the maximum concentration for 90% of measured values within each
5° in wind direction.
Figure 3. Concentration of H2S in Vogar as a function of wind direction, 2016.
By comparison of figures 1 and 3 it can be concluded, that the Krafla power plant (36°) most likely has some effect on H2S
concentration in Vogar and the Bjarnarflag area (60-70°) obviously has significant effect. On the other hand, there are no steam wells
located further east from Vogar. The response in H2S concentration at 90 to 100° most likely stems from natural emissions.
3.2. The effect of wind speed and air temperature on H2S concentration.
Analysis of weather data from Vogar reveals that during January 16 through 19, 2016 there was calm wind and the air temperature
was from -10 to -15 °C. These weather conditions may have caused temperature inversion, a layer of cool air at the surface was
overlain by a layer of warmer air and the dispersion of H2S was reduced. The wind increased the following days, blowing from 80 to
100°, moving the accumulated H2S towards Vogar.
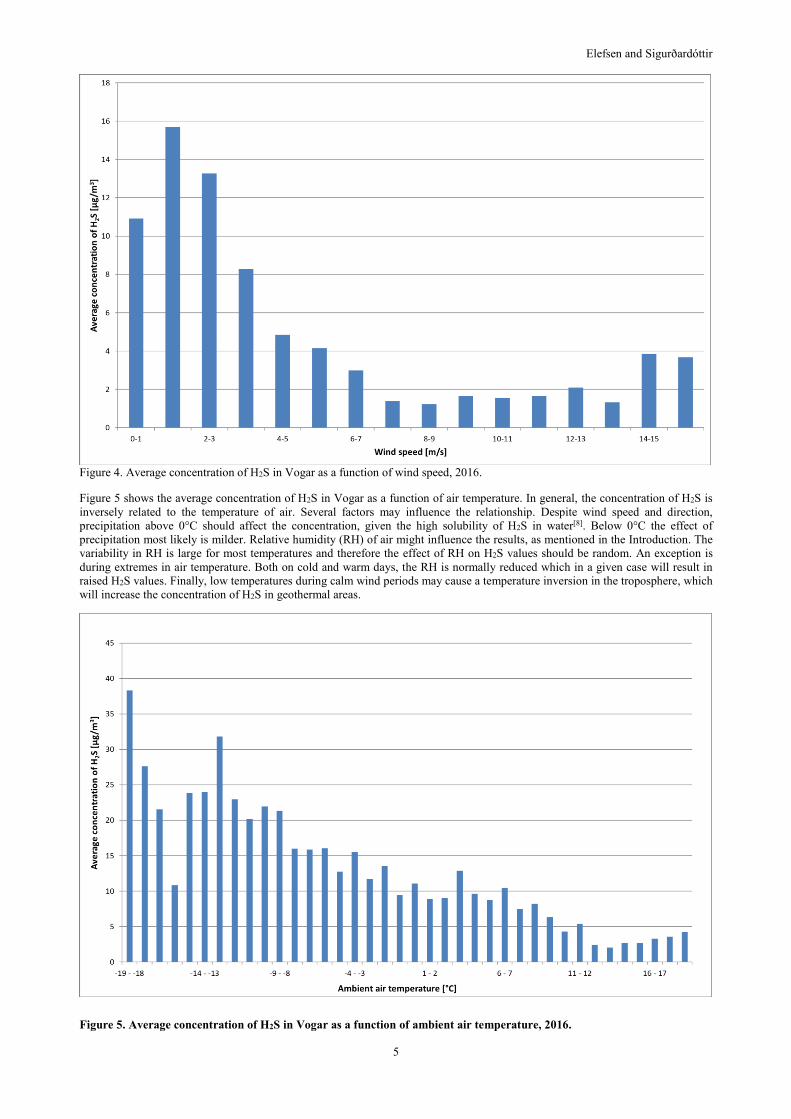
Figure 4 shows the average concentration of H2S in Vogar as a function of wind speed. The average is calculated for every 1 m/s
change in wind speed. It is observed that the concentration of H2S is reduced with increased wind speed. Given the amount of H2S
released is constant with time, the results show increased dilution and dispersion of emissions, proportional to wind speed.
Elefsen and Sigurðardóttir
5
Figure 4. Average concentration of H2S in Vogar as a function of wind speed, 2016.
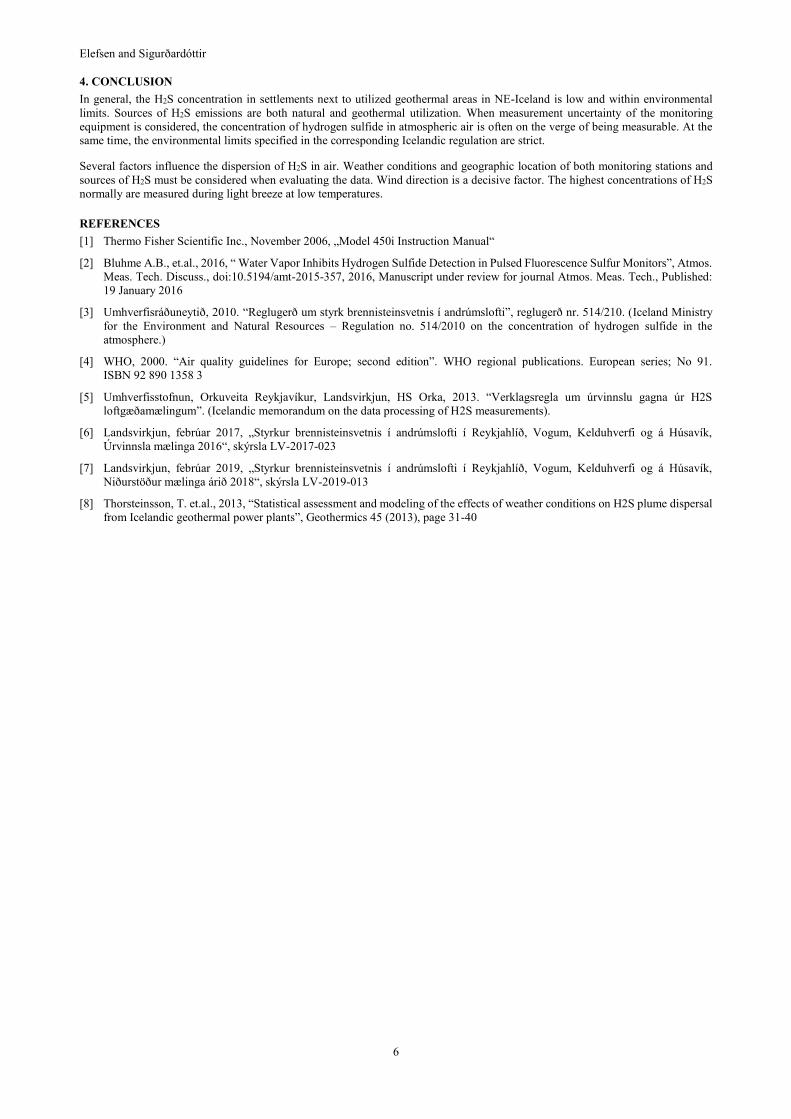
Figure 5 shows the average concentration of H2S in Vogar as a function of air temperature. In general, the concentration of H2S is
inversely related to the temperature of air. Several factors may influence the relationship. Despite wind speed and direction,
precipitation above 0°C should affect the concentration, given the high solubility of H2S in water[8]. Below 0°C the effect of
precipitation most likely is milder. Relative humidity (RH) of air might influence the results, as mentioned in the Introduction. The
variability in RH is large for most temperatures and therefore the effect of RH on H2S values should be random. An exception is
during extremes in air temperature. Both on cold and warm days, the RH is normally reduced which in a given case will result in
raised H2S values. Finally, low temperatures during calm wind periods may cause a temperature inversion in the troposphere, which
will increase the concentration of H2S in geothermal areas.
Figure 5. Average concentration of H2S in Vogar as a function of ambient air temperature, 2016.
Elefsen and Sigurðardóttir
6
4. CONCLUSION
In general, the H2S concentration in settlements next to utilized geothermal areas in NE-Iceland is low and within environmental
limits. Sources of H2S emissions are both natural and geothermal utilization. When measurement uncertainty of the monitoring
equipment is considered, the concentration of hydrogen sulfide in atmospheric air is often on the verge of being measurable. At the
same time, the environmental limits specified in the corresponding Icelandic regulation are strict.
Several factors influence the dispersion of H2S in air. Weather conditions and geographic location of both monitoring stations and
sources of H2S must be considered when evaluating the data. Wind direction is a decisive factor. The highest concentrations of H2S
normally are measured during light breeze at low temperatures.
REFERENCES
[1] Thermo Fisher Scientific Inc., November 2006, „Model 450i Instruction Manual“
[2] Bluhme A.B., et.al., 2016, “ Water Vapor Inhibits Hydrogen Sulfide Detection in Pulsed Fluorescence Sulfur Monitors”, Atmos.
Meas. Tech. Discuss., doi:10.5194/amt-2015-357, 2016, Manuscript under review for journal Atmos. Meas. Tech., Published:
19 January 2016
[3] Umhverfisráðuneytið, 2010. “Reglugerð um styrk brennisteinsvetnis í andrúmslofti”, reglugerð nr. 514/210. (Iceland Ministry
for the Environment and Natural Resources – Regulation no. 514/2010 on the concentration of hydrogen sulfide in the
atmosphere.)
[4] WHO, 2000. “Air quality guidelines for Europe; second edition”. WHO regional publications. European series; No 91.
ISBN 92 890 1358 3
[5] Umhverfisstofnun, Orkuveita Reykjavíkur, Landsvirkjun, HS Orka, 2013. “Verklagsregla um úrvinnslu gagna úr H2S
loftgæðamælingum”. (Icelandic memorandum on the data processing of H2S measurements).
[6] Landsvirkjun, febrúar 2017, „Styrkur brennisteinsvetnis í andrúmslofti í Reykjahlíð, Vogum, Kelduhverfi og á Húsavík,
Úrvinnsla mælinga 2016“, skýrsla LV-2017-023
[7] Landsvirkjun, febrúar 2019, „Styrkur brennisteinsvetnis í andrúmslofti í Reykjahlíð, Vogum, Kelduhverfi og á Húsavík,
Niðurstöður mælinga árið 2018“, skýrsla LV-2019-013
[8] Thorsteinsson, T. et.al., 2013, “Statistical assessment and modeling of the effects of weather conditions on H2S plume dispersal
from Icelandic geothermal power plants”, Geothermics 45 (2013), page 31-40
Recommended