Five Year Royalty In Kind Business Plan
May 2004
MINERALS MANAGEMENT SERVICE
FIVE YEAR ROYALTY IN KIND BUSINESS PLAN
MAY 2004
Cover Photo Credits (clockwise from left):
1. Gas production platform, Gulf of Mexico (BP) 2. Pelican Gas Plant, Louisiana (El Paso Field Services) 3. Oil well, Spring Creek Field, Wyoming (Marathon Oil Company) 4. “MOPS” Pipeline System, Texas (Northern Natural Gas Company)
1 Director’s Message I MMS Director, R. M. “ Johnnie” Burton
The Minerals Management Service (MMS) is responsible for ensuring that all revenues fiom Federal and Indian mineral leases are effectively, efficiently, and accurately collected, accounted for, and disbursed to recipients. These substantial revenues,
averaging more than $7 billion annually over the past 5 years, are disbursed to 38 States, 41 Indian Tribes, some 20,000 individual Indian royalty owners, and to U.S. Treasury accounts. By virtue of the scale of these mineral revenues, MMS is entrusted with an important fiduciary role by and for all Americans.
Historically, most of these revenues have been received in the form of cash royalty payments - so-called royalty in value payments - paid by mineral development interests. In recent years, MMS has been developing an additional approach to managing the Nation’s oil and gas royalty asset stream - the royalty in kind approach, also known as RIK. Under this approach, we take payment fiom mineral lessees “in kind” in the form of produced volumes, rather than in cash payments. We then sell the energy commodity in competitive sales, collect revenues fiom our purchasers and disburse these to Federal and State revenue recipients per statutory authorities.
Since the mid-l990s, we have been conducting several pilot projects to test the effectiveness of the RIK approach. These projects have demonstrated that this option can bring a unique suite of benefits that increase our management effectiveness, including conflict avoidance, increased certainty and decreased administrative costs for the public and industry, earlier receipt of royalty revenues, and revenue enhancement. In 2001, MMS began implementing its RLK Road Map to the Future, a management action plan that transitioned the RIK business activity fiom pilot phase to operational activity.
In 2003, at my direction, we contracted with a respected commercial oil and gas consulting firm to assess our RIK program, and offer recommendations for improvement. I felt it important to gain independent commercial perspectives and input for advancing the fiture RIK business activity. We obtained excellent input validating our development approach and providing valuable guidance for a filly operational RIK program.
This Five Year RIK Business PZan provides a management framework that will evolve the Federal RIK program for the next five years. The Plan is guided fust and foremost by our statutory authorities, applied to the energy commodity market through a risk averse, conservative business model. Cornerstones of the Plan are proven business principles, a revenue enhancement goal, measurable program objectives, routine measurement of our program performance, and emphasis on strong internal controls. The Plan stresses the importance of professionalism’ and ethical stanhds. Implementation of this Plan will result in an effective, steady-state RIK program of the highest quality and integrity.
A few words to our Minerals Revenue Management employees: Your persistent efforts and hard work in reengineering the royalty compliancx activity and developing new RIK business processes and support systems are taking root. Real progress is being made. I appreciate your past and continuing efforts. Many action items in this Plan are intended to increase and leverage your already well-developed commercial expertise. Many of you will have the opportunity to continue learning new skills within the still developing RIK business activity. Your continued excellent efforts are the key to success of this Plan. Likewise, we value our critical relationships with our stakeholders in royalty asset management - Congress, State governments, the minerals industry, contractors, and partnering Federal agencies. We emphasize continued close working relationships and effective communication with each of our stakeholders.
I am pleased and excited to issue this Five Year RL. Business Plan. It arrays a formidable suite of program objectives and management actions. I am confident that working together we can meet these challenging expectations and continue establishment of a top tier royalty asset management program of which all Americans can be proud.
Table of Contents
Executive Summary............................................................................................................1
1 Royalty in Kind and Asset Management ..................................................................5
2 An Overview of the Economic Climate.....................................................................8
3 Strategic Drivers of the Five Year Plan ..................................................................10
4 RIK Principles...........................................................................................................14
5 Performance Metrics ................................................................................................16
6 Five Year Goals and Objectives...............................................................................18
7 Commercial Business Model and Implications ......................................................23
8 Five Year RIK Business Plan – Timeline and Action Items .................................33
Appendix A - Economic Climate .....................................................................................39
Appendix B - Net Revenue Performance Measurement ...............................................43
Appendix C - Glossary of Terms .....................................................................................48
1
Executive Summary The Minerals Management Service (MMS) has developed a Five Year Royalty in Kind (RIK) Business Plan that outlines business principles, objectives, and specific action items that will guide and evolve the Federal RIK program from fiscal years 2005 through 2009. The Federal RIK program has entered into an operational phase after six years of pilot project testing. This Plan provides a management blueprint for the RIK program over its first five years of operational activity. MMS and RIK In the mid-1990s, MMS began exploring the potential for a broadly applied RIK program to increase efficiencies, decrease conflict, and enhance net revenues generated from oil and gas production royalties. Several pilot projects tested this approach under a variety of conditions for crude oil and natural gas, and for onshore and offshore production volumes. Based on the pilot projects, MMS has concluded that RIK is a viable approach to be used in tandem with royalty in value (RIV) in managing the Nation’s oil and gas royalty assets. MMS has also concluded that the RIK approach may not be optimal for all oil and gas production scenarios. Accordingly, selective and strategic use of both RIK and RIV, based on systematic economic analysis of the Federal oil and gas portfolio, is the royalty asset management approach adopted by MMS. Since publication of the RIK Road Map to the Future in 2001, MMS has been developing the capability needed to transition the Federal RIK activity from pilots to an operational program. The Road Map’s action items were completed in 2003, and included information management systems, organization, human resources, and business processes. Completion of the Road Map has provided MMS with a base foundation of commercial capabilities needed to manage the RIK portfolio. The future challenge for the RIK program is implementing a comprehensive business model with clear objectives that can fully realize the commercial and management potential of the RIK approach. This Plan is designed to achieve these results over the next five years. Foundation for a Successful RIK Operational Program – Business Principles Successful operation of a commercial energy commodity sales program requires the existence of and adherence to a set of guiding principles. For the Federal RIK program, these begin with the statutes and lease terms authorizing the RIK activity, and are further based on pilot project lessons and fundamental business tenets.
2
Outcomes of a Successful RIK Operational Program - Business Objectives/Goals This Plan includes a series of measurable commercial objectives and program efficiency goals designed to ensure that both effectiveness and efficiency of the RIK program are emphasized and measured. These objectives are as follows:
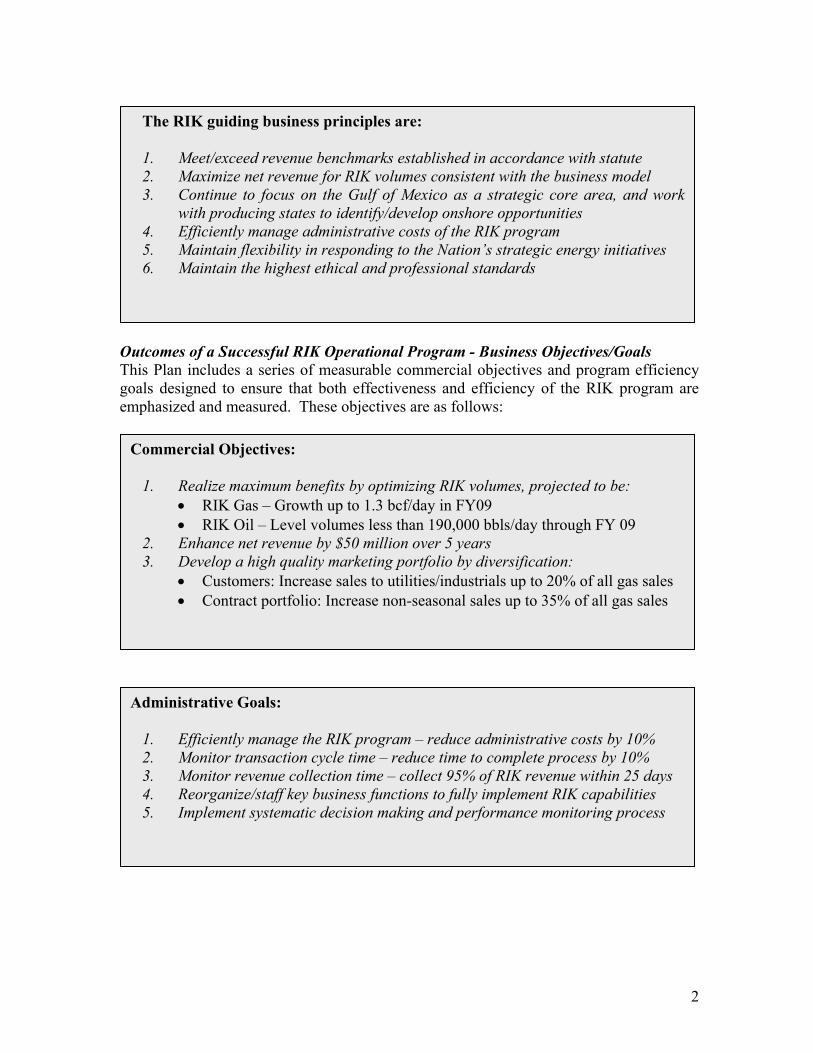
The RIK guiding business principles are: 1. Meet/exceed revenue benchmarks established in accordance with statute 2. Maximize net revenue for RIK volumes consistent with the business model 3. Continue to focus on the Gulf of Mexico as a strategic core area, and work
with producing states to identify/develop onshore opportunities 4. Efficiently manage administrative costs of the RIK program 5. Maintain flexibility in responding to the Nation’s strategic energy initiatives 6. Maintain the highest ethical and professional standards
Commercial Objectives:
1. Realize maximum benefits by optimizing RIK volumes, projected to be: • RIK Gas – Growth up to 1.3 bcf/day in FY09 • RIK Oil – Level volumes less than 190,000 bbls/day through FY 09
2. Enhance net revenue by $50 million over 5 years 3. Develop a high quality marketing portfolio by diversification:
• Customers: Increase sales to utilities/industrials up to 20% of all gas sales • Contract portfolio: Increase non-seasonal sales up to 35% of all gas sales
Administrative Goals:
1. Efficiently manage the RIK program – reduce administrative costs by 10% 2. Monitor transaction cycle time – reduce time to complete process by 10% 3. Monitor revenue collection time – collect 95% of RIK revenue within 25 days 4. Reorganize/staff key business functions to fully implement RIK capabilities 5. Implement systematic decision making and performance monitoring process
3
Business Model Extensions and Implications The MMS RIK program has adopted a market strategy of a conservative, price-taking producer/seller of energy commodities into the wholesale market at or near the lease in producing areas.
Business Model Extensions. Based on extensive assessment of the commercial viability of MMS RIK operations, some modifications to current marketing strategies will be made. These strategies were developed to capitalize on market trends, manage uncertainty, and optimize contracting opportunities. These extensions from the current business model will potentially increase net revenues, while continuing to operate within the RIK program’s statutory authorities and conservative risk profile.
• Diversify sales portfolio • Aggregate volumes to pipeline pools or market centers • Optimize processing contracts • Optimize production area transportation and market opportunities • Explore production exchanges
The net result of the RIK business model extensions is to move the MMS RIK activity to a more active producer/seller of wholesale energy commodities, seeking to better optimize revenues within a conservative, physical spot market-based presence. Implications of Business Model Extensions. The extended RIK business model of the future will require changes in the organization and human resource areas to accommodate the increased commercial capabilities and flexibility envisioned.
Organization. The intended RIK organization structure builds upon elements of the existing structure. Primary changes include better delineation of functions between the front office/mid office/back office, greater policy oversight, a separate group to perform economic and quantitative analysis, and establishment of a Houston front office presence. Primary among these changes is the establishment of a separate policy assurance office reporting outside the RIK line management to MRM management and, by extension, the MMS Executive Committee. This function is intended to provide risk policies and procedures similar to the chief risk officer function in the private sector. Human Resources. Personnel will be hired or otherwise retained in key positions with significant commercial experience in oil and natural gas marketing. The level of experience and expertise of personnel in the following functional areas will be increased:
• Front office marketing • Economic and quantitative analysis • Scheduling • Legal support • Contract administration
4
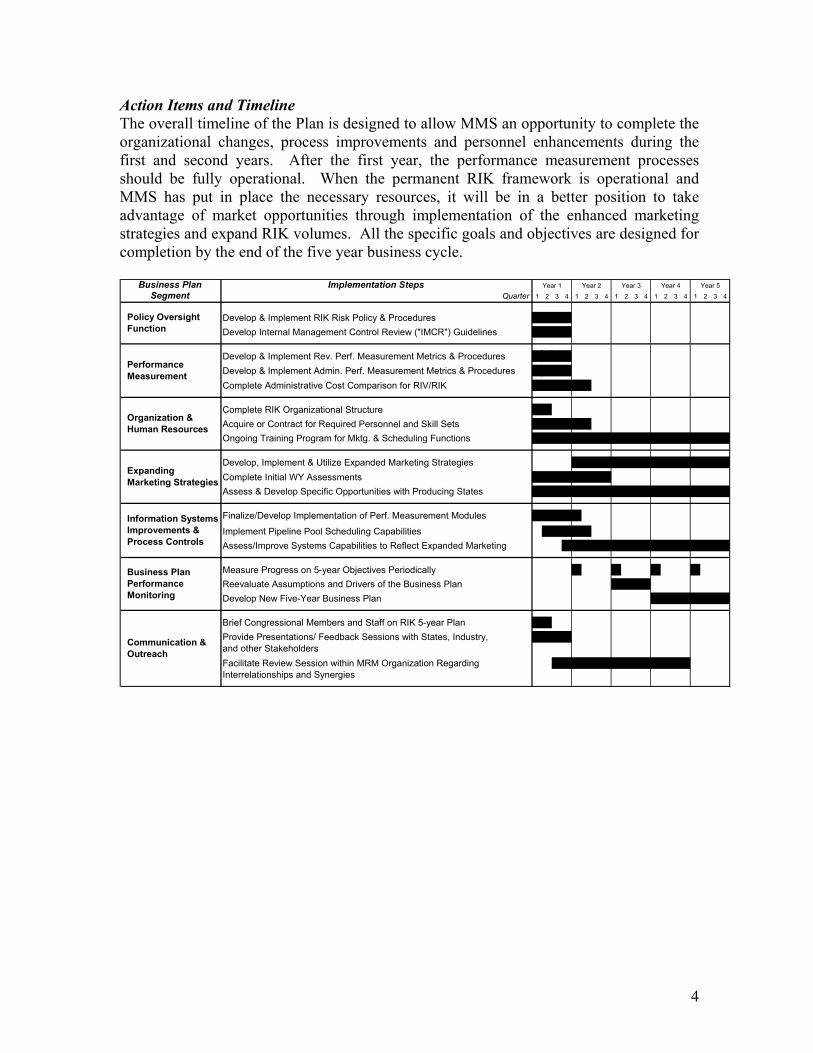
Action Items and Timeline The overall timeline of the Plan is designed to allow MMS an opportunity to complete the organizational changes, process improvements and personnel enhancements during the first and second years. After the first year, the performance measurement processes should be fully operational. When the permanent RIK framework is operational and MMS has put in place the necessary resources, it will be in a better position to take advantage of market opportunities through implementation of the enhanced marketing strategies and expand RIK volumes. All the specific goals and objectives are designed for completion by the end of the five year business cycle.
Business Plan Implementation Steps
Segment Quarter 1 2 3 4 1 2 3 4 1 2 3 4 1 2 3 4 1 2 3 4
Develop & Implement RIK Risk Policy & ProceduresDevelop Internal Management Control Review ("IMCR") Guidelines
Develop & Implement Rev. Perf. Measurement Metrics & ProceduresDevelop & Implement Admin. Perf. Measurement Metrics & ProceduresComplete Administrative Cost Comparison for RIV/RIK
Complete RIK Organizational StructureAcquire or Contract for Required Personnel and Skill SetsOngoing Training Program for Mktg. & Scheduling Functions
Develop, Implement & Utilize Expanded Marketing StrategiesComplete Initial WY AssessmentsAssess & Develop Specific Opportunities with Producing States
Finalize/Develop Implementation of Perf. Measurement Modules
Implement Pipeline Pool Scheduling CapabilitiesAssess/Improve Systems Capabilities to Reflect Expanded Marketing
Measure Progress on 5-year Objectives PeriodicallyReevaluate Assumptions and Drivers of the Business PlanDevelop New Five-Year Business Plan
Brief Congressional Members and Staff on RIK 5-year PlanProvide Presentations/ Feedback Sessions with States, Industry,and other StakeholdersFacilitate Review Session within MRM Organization Regarding Interrelationships and Synergies
Information Systems Improvements & Process Controls
Business Plan Performance Monitoring
Organization & Human Resources
Expanding Marketing Strategies
Communication & Outreach
Year 5Year 1 Year 2 Year 3 Year 4
Performance Measurement
Policy Oversight Function
5
1 Royalty in Kind and Asset Management The Minerals Management Service (MMS) is entrusted with ensuring that all Americans receive a fair and appropriate return for oil, gas, and other minerals produced from Federal leased lands. MMS collects, accounts for, and disburses between $5 and $10 billion in mineral revenues annually. Historically, most of these revenues have been received in the form of royalty in value (RIV) cash payments made by mineral development interests. In recent years, the MMS has been opting to take and receive an increasing proportion of oil and gas mineral royalties in the form of royalty in kind (RIK) production payments. This is particularly true for the royalty asset stream generated from Federal oil and gas leases on the Outer Continental Shelf.
This Five Year RIK Business Plan provides both the overall business principles and objectives, and the management actions that will guide the RIK commercial operation from fiscal years 2005 through 2009. Implementation of this Plan will result in the full realization of the potential of the RIK approach as one of the essential components of the Federal government’s management of oil and gas mineral royalties.
1.1 MMS’s Asset Management Strategy Governing Federal statutes and oil and gas lease terms provide the Secretary of the Interior with two options for collecting oil and gas royalties. Payments may be received either by RIV cash payments or RIK production payments. These options present the opportunity to improve the efficiency and effectiveness of royalty management processes. Benefits of the RIK option have been explored and realized by the MMS and include conflict avoidance, increased certainty and decreased administrative costs for the public and industry, earlier receipt of royalty revenues, revenue enhancement for the Treasury, and responsiveness to government mandated energy programs. Based on experience in pilot programs since 1998, MMS has concluded that RIK is a viable option to deploy in the right circumstances, but is not appropriate for all lease production situations. To leverage this opportunity, MMS is committed to the systematic and deliberate analysis of the Federal royalty portfolio to selectively apply the RIK and RIV asset management methods to optimize returns and efficiencies for the taxpayer.
1.2 History of RIK at MMS: pilot to operations to permanent The Department of the Interior has managed an RIK program for eligible small refiners since the 1970s. This program, authorized pursuant to provisions of the Mineral Leasing Act (MLA) and Outer Continental Shelf Lands Act (OCSLA), has for decades provided small refiners with access to crude oil supplies that otherwise were difficult to obtain. In the mid-1990s, MMS began exploring the potential for a more broadly applied RIK program to increase efficiencies, decrease conflict, and enhance revenues generated from oil and gas production royalties. A feasibility study conducted by MMS in 1997 documented that taking royalties in kind could, under the right circumstances, be revenue
6
neutral or positive and administratively more efficient for MMS and its mineral lessees. Based on recommendations from this study, MMS established three pilot projects:
Wyoming Crude Oil RIK Pilot: In 1998, MMS and the State of Wyoming initiated the first major RIK pilot project. The project involved sale of crude oil produced from Federal leases in Wyoming’s Powder River and Big Horn Basins. This pilot has evolved into a steady state program. Crude oil from both Federal and state leases is sold in the same events, jointly managed by the State and MMS.
Texas 8(g) Natural Gas RIK Pilot: In 1998, MMS, in partnership with the State of Texas General Land Office (GLO), initiated this RIK pilot project involving natural gas produced from Federal leases in the Texas 8(g) zone of the Gulf of Mexico (GOM). The pilot goals included exploration of methods to market RIK natural gas and learning from GLO’s long-standing RIK experience.
Federal Gulf of Mexico Natural Gas RIK Pilot: In 1999, MMS initiated a large-
scale pilot project to test the effectiveness of taking substantial volumes of natural gas in the GOM and selling these aggregated volumes in the open market. The project has succeeded in refining and evolving the methods and business cases for taking gas in kind, and is now in its fifth year of operation.
A notable event in the history of the Federal RIK program occurred in January 2001 with the publication of the MMS Director’s RIK Road Map to the Future, a management action plan in which MMS formally adopted RIK as a permanent option to manage the Nation’s mineral royalty assets. The Road Map set forth the strategic direction and presented actions to develop the capability needed to transition the RIK option from pilot projects to operational activity over a 3 year period. Another major event occurred in 2002 with the start of the largest MMS RIK program to date – the joint initiative with the Department of Energy to fill the remaining capacity of the Strategic Petroleum Reserve (SPR). This initiative, directed by President Bush to enhance the Nation’s energy independence, began in April 2002 and has since ramped up to involve up to 60 percent of Outer Continental Shelf crude oil royalties. Calendar year 2003 witnessed the implementation of three management information systems to support the permanent RIK program, specifically used for natural gas, crude oil, and risk and performance management RIK functions. These systems form the operational backbone of the RIK program, and house virtually all RIK data. Lastly, the latest RIK pilot project, a joint initiative with the State of Louisiana, was started in 2003.
1.3 Current MMS RIK Operations The Federal RIK Program has matured and has entered into an operational phase of activity. Budgets, organization, staff, and management are in place. A focused business model, internal controls, information systems, and standard commercial business processes are operating. Business relationships with states and industry are established.
7
Currently, more than 500,000 mmbtu per day of GOM natural gas is taken in kind – some 25% of GOM royalty volumes. No onshore Federal gas is currently taken in kind. Currently, some 180,000 barrels per day of Federal RIK crude oil are transacted, either through competitive sales or delivery to the SPR Fill Initiative, in three portfolios:
Gulf of Mexico: Up to 170,000 barrels per day (80% of OCS royalty volumes) contracted to small refiners (up to 50,000 barrels/day), commercial purchasers (less than 3,000 barrels/day) and the SPR (up to 115,000 barrels/day).
Pacific Outer Continental Shelf: Nearly 10,000 barrels per day (75% of Pacific
Outer Continental Shelf royalty crude) sold to small refiners.
Wyoming: Approximately 2,000 barrels per day sold to commercial crude oil purchasers (20% of Federal crude oil royalty volumes in Wyoming).
1.4 Lukens Energy Group Engagement and Results By January 2003, the MMS had completed the action elements of the RIK Road Map to the Future and in so doing had established the internal capability to manage an RIK portfolio. However, with the prospect of an expanded RIK activity, MMS first sought commercial input from an oil and gas consultant. In January 2003, MMS entered into a competitively awarded contract with the Lukens Energy Group of Houston, Texas to obtain an evaluation of the RIK program, recommendations for improvement, and advice on a five year strategic business plan. The Lukens Energy Group concluded that the MMS RIK business model has performed well in a volatile marketplace, and that the program has evolved from pilot projects to a well-developed operational program. Improvements in several areas were recommended prior to expansion of the program. Specifically , MMS’s level of commercial expertise was found to be improved, but thin. Capabilities in performance measurement, quantitative economic analysis, and more complex marketing and sales were found to need enhancement. Lastly, the consultant recommended specific program principles and measurable objectives to guide the RIK program in the future years. MMS believes that implementation of the primary recommendations of the Lukens Energy Group will result in a significant enhancement of the Federal RIK program.
8
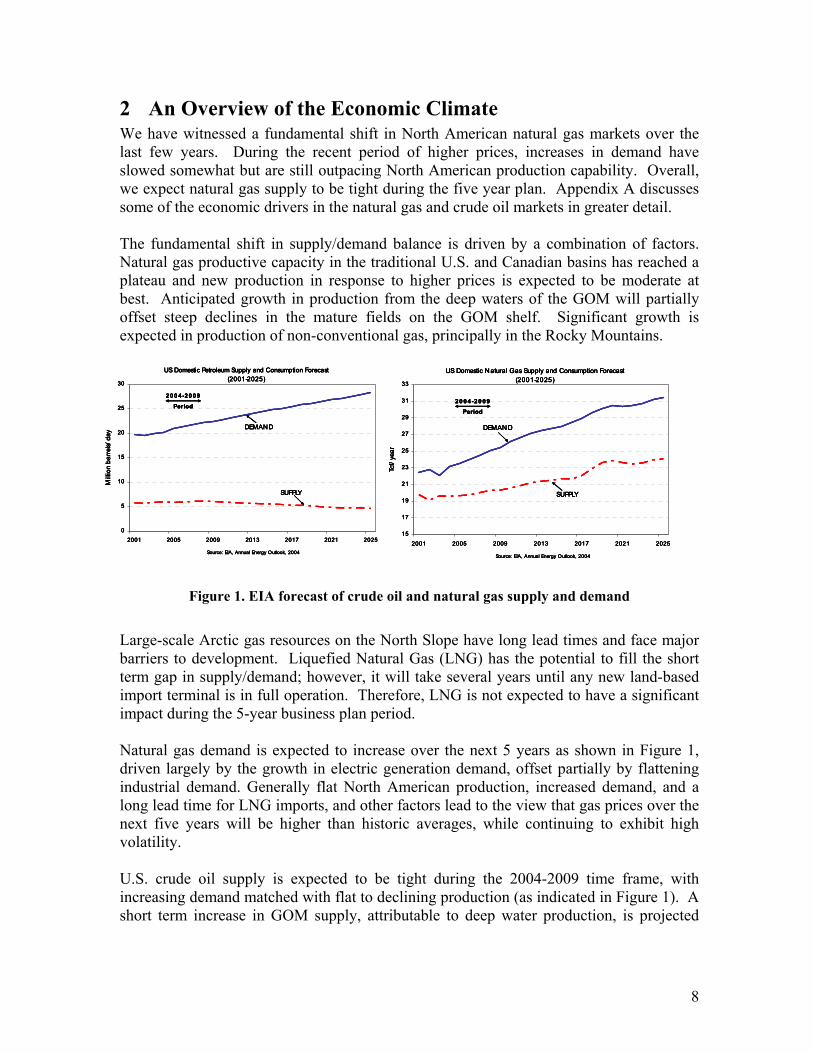
2 An Overview of the Economic Climate We have witnessed a fundamental shift in North American natural gas markets over the last few years. During the recent period of higher prices, increases in demand have slowed somewhat but are still outpacing North American production capability. Overall, we expect natural gas supply to be tight during the five year plan. Appendix A discusses some of the economic drivers in the natural gas and crude oil markets in greater detail. The fundamental shift in supply/demand balance is driven by a combination of factors. Natural gas productive capacity in the traditional U.S. and Canadian basins has reached a plateau and new production in response to higher prices is expected to be moderate at best. Anticipated growth in production from the deep waters of the GOM will partially offset steep declines in the mature fields on the GOM shelf. Significant growth is expected in production of non-conventional gas, principally in the Rocky Mountains.
Figure 1. EIA forecast of crude oil and natural gas supply and demand
Large-scale Arctic gas resources on the North Slope have long lead times and face major barriers to development. Liquefied Natural Gas (LNG) has the potential to fill the short term gap in supply/demand; however, it will take several years until any new land-based import terminal is in full operation. Therefore, LNG is not expected to have a significant impact during the 5-year business plan period. Natural gas demand is expected to increase over the next 5 years as shown in Figure 1, driven largely by the growth in electric generation demand, offset partially by flattening industrial demand. Generally flat North American production, increased demand, and a long lead time for LNG imports, and other factors lead to the view that gas prices over the next five years will be higher than historic averages, while continuing to exhibit high volatility. U.S. crude oil supply is expected to be tight during the 2004-2009 time frame, with increasing demand matched with flat to declining production (as indicated in Figure 1). A short term increase in GOM supply, attributable to deep water production, is projected
Source: EIA, Annual Energy Outlook, 2004
US Domestic Petroleum Supply and Consumption Forecast (2001-2025)
0
5
10
15
20
25
30
2001 2005 2009 2013 2017 2021 2025
Mill
ion
barr
els/
day
SUPPLY
DEMAND
200 4-2009
Period
Source: EIA, Annual Energy Outlook, 2004
US Domestic Petroleum Supply and Consumption Forecast (2001-2025)
0
5
10
15
20
25
30
2001 2005 2009 2013 2017 2021 2025
Mill
ion
barr
els/
day
SUPPLY
DEMAND
200 4-2009
Period
US Domestic Natural Gas Supply and Consumption Forecast (2001-2025)
15
17
19
21
23
25
27
29
31
33
2001 2005 2009 2013 2017 2021 2025
Tcf/
year
SUPPLY
DEMAND
Source: EIA, Annual Energy Outlook, 2004
2004-2009
Period
US Domestic Natural Gas Supply and Consumption Forecast (2001-2025)
15
17
19
21
23
25
27
29
31
33
2001 2005 2009 2013 2017 2021 2025
Tcf/
year
SUPPLY
DEMAND
Source: EIA, Annual Energy Outlook, 2004
2004-2009
Period
Source: EIA, Annual Energy Outlook, 2004
US Domestic Petroleum Supply and Consumption Forecast (2001-2025)
0
5
10
15
20
25
30
2001 2005 2009 2013 2017 2021 2025
Mill
ion
barr
els/
day
SUPPLY
DEMAND
200 4-2009
Period
Source: EIA, Annual Energy Outlook, 2004
US Domestic Petroleum Supply and Consumption Forecast (2001-2025)
0
5
10
15
20
25
30
2001 2005 2009 2013 2017 2021 2025
Mill
ion
barr
els/
day
SUPPLY
DEMAND
200 4-2009
Period
US Domestic Natural Gas Supply and Consumption Forecast (2001-2025)
15
17
19
21
23
25
27
29
31
33
2001 2005 2009 2013 2017 2021 2025
Tcf/
year
SUPPLY
DEMAND
Source: EIA, Annual Energy Outlook, 2004
2004-2009
Period
US Domestic Natural Gas Supply and Consumption Forecast (2001-2025)
15
17
19
21
23
25
27
29
31
33
2001 2005 2009 2013 2017 2021 2025
Tcf/
year
SUPPLY
DEMAND
Source: EIA, Annual Energy Outlook, 2004
2004-2009
Period
9
during the business plan period. However, crude oil imports are expected to increase in order to supply the domestic market. A combination of rising world wide demand and production quotas by the Organization of the Petroleum Exporting Countries (OPEC) has kept crude oil prices in a relatively high range over the last 2 years. The Energy Information Agency (EIA) is predicting that crude oil prices will remain moderately high, in a range from the high $20s per barrel to the low $30s per barrel over the next few years. A continued reliance on foreign crude oil imports and the uncertainties of world political events also point to increased volatility in world crude prices. The overall impact of a generally tight supply situation and higher prices for both crude oil and natural gas should provide MMS with an opportunity to negotiate favorable commercial contracts given their increasing and relatively stable RIK volumes. The impact of continuing high volatility will have less of an impact on MMS than other commodity sellers. As discussed in Appendix A, the recent restructuring of the merchant energy business, credit downgrading for many market participants, and increase in reliability of gas price indices have created opportunities in the market. MMS is well positioned to be a reliable commodity seller to a diverse customer base.
10
3 Strategic Drivers of the Five Year Plan MMS has developed several basic assumptions/parameters that collectively establish the framework and drive the specific actions within this Plan. The following assumptions are the key strategic drivers of the Plan.
3.1 RIK authorization language will continue to be approved by Congress
Congress will continue to annually authorize MMS to use a portion of the revenues from royalty in kind sales to pay for transportation and to process or otherwise dispose of royalty production in kind. Specific authorization language to pay for these services has been included in MMS appropriations statutes over the last few years. Authority for procuring multi-year transportation/processing services would create more flexibility for the RIK program. However, it is unclear if such a legislative proposal will become law.
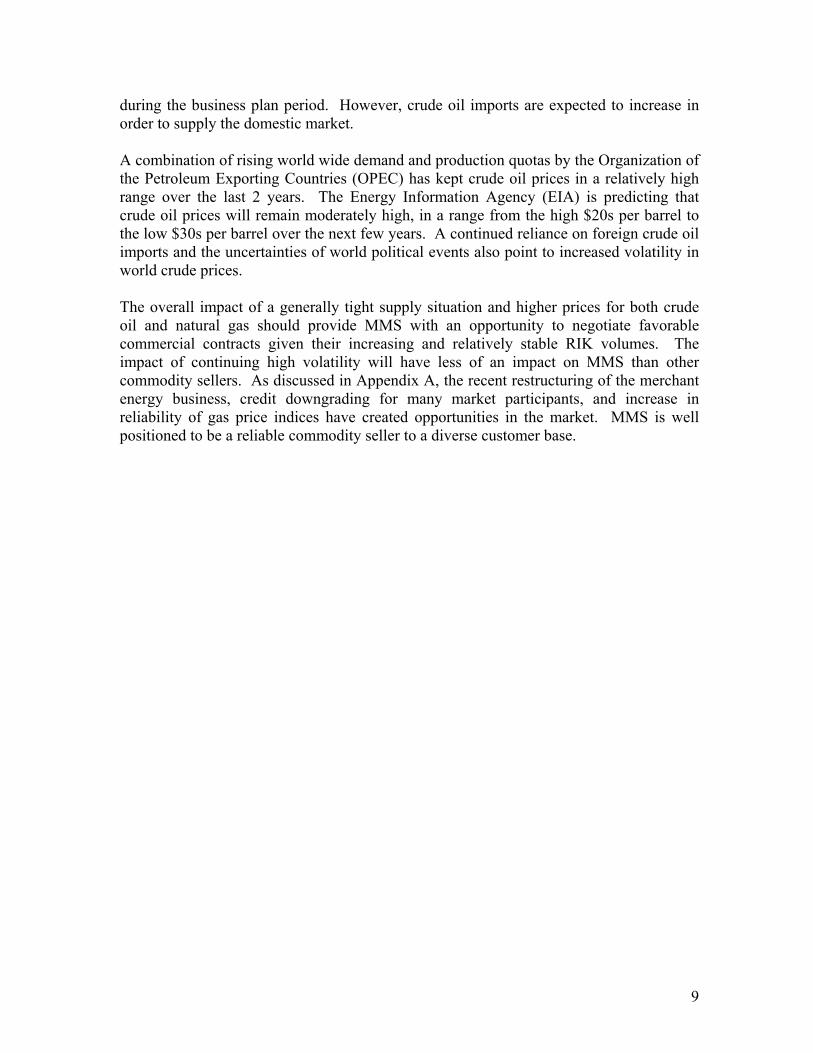
3.2 The SPR fill program will continue until current capacity is filled The existing SPR Fill Initiative will continue only until the current 700 million barrel capacity is filled. The SPR inventory as of May 26, 2004 was 660 million barrels1. Assuming a continuation of the approximately 100,000 barrels/day fill rate, the Reserve is anticipated to reach its 700 million barrel capacity in mid 2005 (Figure 2). The Department of Energy may initiate efforts to expand the existing capacity to 1 billion barrels, with a possible intermediate expansion of existing SPR caverns to 850 million barrels. However, considering the uncertainty over whether such an expansion will be funded, and the long lead times necessary for construction of additional capacity if funding occurs, we assume that the SPR Fill Initiative will be completed in mid 2005 with attainment of a 700 million barrel inventory. We anticipate that the royalty volumes committed to the current SPR program (up to 115,000 barrels/day) will convert to an RIK commercial program, assuming continuation of favorable economic conditions and receipt of fair market value (FMV) in the MMS RIK crude oil program.
1 Department of Energy – Fossil Energy website (http://www.fe.doe.gov/programs/reserves/)
Figure 2. Strategic Petroleum Reserve capacity and inventory
Strategic Petroleum Reserve Development & Inventory
0
100
200
300
400
500
600
700
800
900
1,000
1,100
1,200
1977
1979
1981
1983
1985
1987
1989
1991
1993
1995
1997
1999
2001
2003
2005
2007
2009
Calendar Year
Mill
ion
Bar
rels
Total Capacity (MMBbl)Inventory (MMBbl)
Iranian Crisis
Development Complete
Desert Storm Drawdown
Weeks Island Decommissioning
Budgetary Oil Sales
Potential SPR Increase to
850 MMBbl
Potential SPR Increase to 1 Billion Barrels
SPR Oil Fill Resumed
650 Million Barrels
11
3.3 Continuance of the Small Refiner Program The RIK Small Refiner Program has been in existence since the mid 1970’s. Periodically, the Department of Interior completes a needs assessment to determine if eligible small refiners continue to require access to domestic crude oil at competitive prices. Such an assessment was reviewed and approved in early 2004. For purposes of this Plan, it is assumed that the Small Refiner Program will be extended over the next five years and the program will maintain volumes at the current levels of 50,000 to 60,000 barrels/day.
3.4 Royalty relief impacts The existing and proposed MMS royalty relief incentive programs will have varying effects on available royalty volumes in the GOM over the five-year planning period. Two major categories of royalty relief were considered in developing the projected available royalty volumes.
• The Deep Water Royalty Relief Act (DWRRA) as instituted in 1996 and revised in 2001, includes royalty relief projects granted to-date and estimates of potential royalty relief production in the future.
• The deep gas prospects in the shallow waters of the GOM Outer Continental Shelf.
Royalty relief incentives for deep shelf gas have been available since 2001 for applicable deep gas wells on new leases. In March, 2004, MMS issued a final rule granting royalty relief for applicable deep gas wells on leases issued prior to 2001.
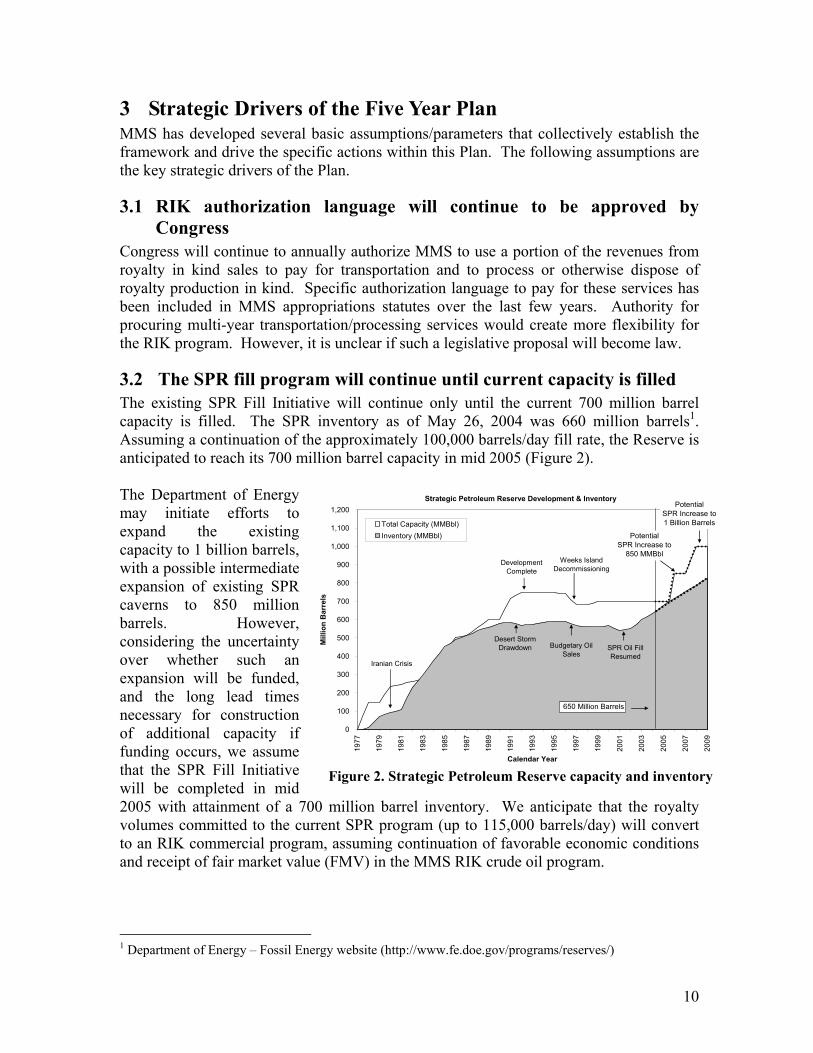
Figure 3 shows the projected royalty gas volume range after considering impacts of royalty relief; including deep water and deep shelf gas relief volumes, where applicable, in the projected range. The available royalty gas is expected to trend downward from a range of 1.57 to 1.84 billion cubic feet (bcf)/day in 2005 to 1.17 to 1.67 bcf/day in 2009.
Natural Gas Royalty Volumes
-
500
1,000
1,500
2,000
2,500
1999 2000 2001 2002 2003 2004 2005 2006 2007 2008 2009
Fiscal Year
Gas
Vol
umes
(MM
cf/d
)
Total GOM Net Royalty Gas
Source: EIA Annual Energy Outlook 2004, MMS GOM Outer Continental
Shelf Daily Oil & Gas Production Rate Projections
Figure 3. Range of available royalty gas in GOM
12
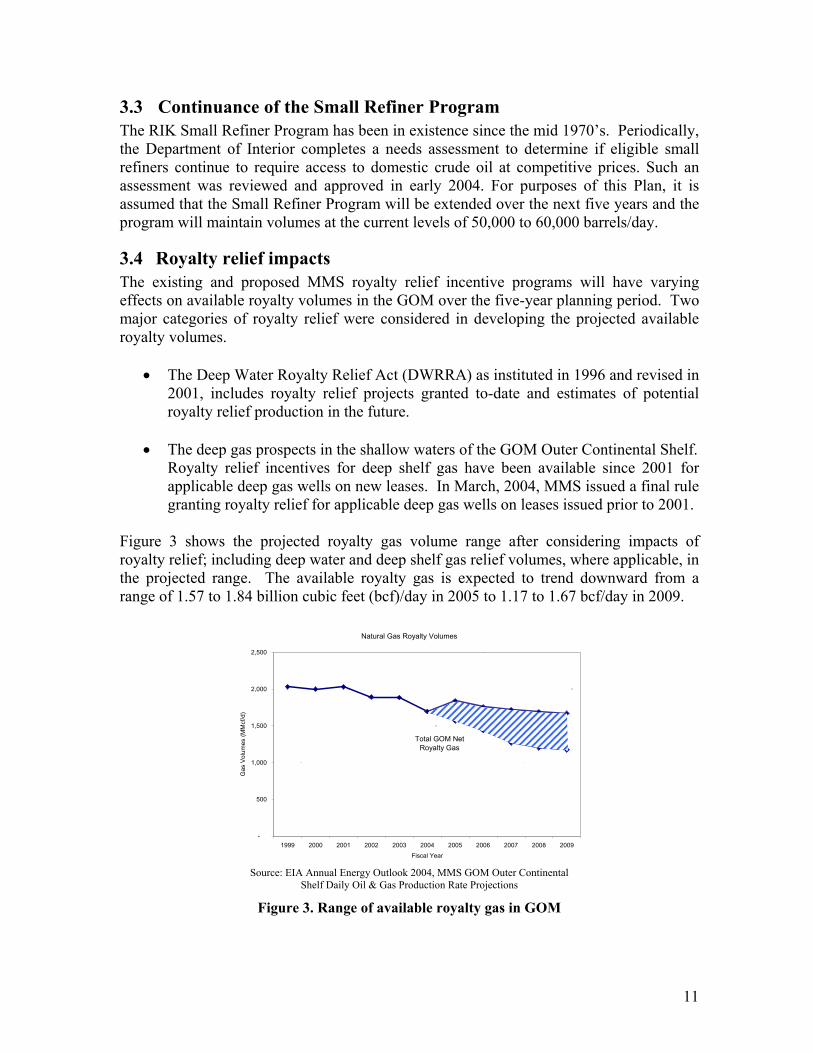
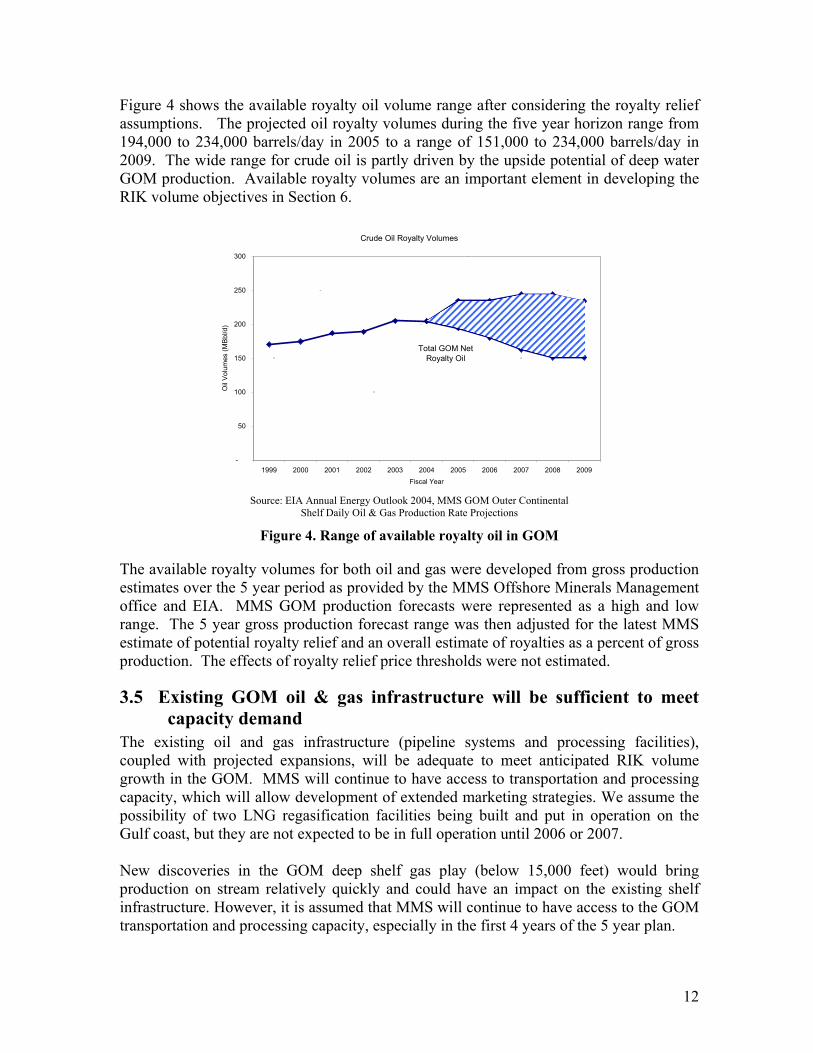
Figure 4 shows the available royalty oil volume range after considering the royalty relief assumptions. The projected oil royalty volumes during the five year horizon range from 194,000 to 234,000 barrels/day in 2005 to a range of 151,000 to 234,000 barrels/day in 2009. The wide range for crude oil is partly driven by the upside potential of deep water GOM production. Available royalty volumes are an important element in developing the RIK volume objectives in Section 6.
Crude Oil Royalty Volumes
-
50
100
150
200
250
300
1999 2000 2001 2002 2003 2004 2005 2006 2007 2008 2009Fiscal Year
Oil
Vol
umes
(MB
bl/d
)
Total GOM Net Royalty Oil
Source: EIA Annual Energy Outlook 2004, MMS GOM Outer Continental
Shelf Daily Oil & Gas Production Rate Projections
Figure 4. Range of available royalty oil in GOM
The available royalty volumes for both oil and gas were developed from gross production estimates over the 5 year period as provided by the MMS Offshore Minerals Management office and EIA. MMS GOM production forecasts were represented as a high and low range. The 5 year gross production forecast range was then adjusted for the latest MMS estimate of potential royalty relief and an overall estimate of royalties as a percent of gross production. The effects of royalty relief price thresholds were not estimated.
3.5 Existing GOM oil & gas infrastructure will be sufficient to meet capacity demand
The existing oil and gas infrastructure (pipeline systems and processing facilities), coupled with projected expansions, will be adequate to meet anticipated RIK volume growth in the GOM. MMS will continue to have access to transportation and processing capacity, which will allow development of extended marketing strategies. We assume the possibility of two LNG regasification facilities being built and put in operation on the Gulf coast, but they are not expected to be in full operation until 2006 or 2007. New discoveries in the GOM deep shelf gas play (below 15,000 feet) would bring production on stream relatively quickly and could have an impact on the existing shelf infrastructure. However, it is assumed that MMS will continue to have access to the GOM transportation and processing capacity, especially in the first 4 years of the 5 year plan.

13
Based on a projected increase in non-conventional gas production in the Rocky Mountain region, it is anticipated that additional infrastructure capacity will be developed in the region to allow for more efficient access to consuming markets. This development may allow consideration of taking RIK gas in the Rockies. Existing projects to expand crude oil transportation capacity and optionality will increase marketing options for GOM producer-marketers.
3.6 Continued partnership with Wyoming, Louisiana, and Texas MMS will continue its RIK partnership with the States of Wyoming, Louisiana, and Texas over the course of the five year business plan. It is assumed that the Wyoming oil RIK program will continue although volumes may decline from current levels. We also assume that natural gas in Wyoming will be evaluated to determine if RIK gas can add value over the RIV option. In addition, Louisiana and Texas will continue to partner with MMS on RIK volumes from leases subject to section 8(g) of the OCS Lands Act.
3.7 MMS continues to adopt a conservative risk profile MMS has adopted a conservative risk profile for the commercial risks associated with oil and gas marketing. The conservative risk profile is incorporated in the RIK business strategies. It is essential to know the nature and extent of commercial risks encountered in the RIK business activity, and to understand that the RIV approach also experiences most of the same risk parameters. The MMS risk profile deviates significantly from private counterparts in two major areas. First, since authority does not exist for MMS to make capital expenditures, MMS has no capital expense at risk. Second, authorizing statutes prescribe receipt of fair market value. The risk of failing to achieve this benchmark is unique to the federal government. Thus, it is the statutory compliance risk that drives the conservative risk profile.
Many producers and marketers engage in price risk management activities to meet specific revenue targets, ensure a return on capital and reduce earnings volatility. As a price taker, MMS is less concerned about variations in revenue associated with commodity price volatility. Rather than manage the absolute price received, MMS anticipates and emphasizes receiving the best market clearing price of oil and gas at any location.
14
4 RIK Principles The principles and objectives of the commercial RIK program are built upon a foundation that starts with the statutes and lease terms authorizing the RIK activity. This authorization clearly provides the Secretary of the Interior with the option of managing the royalty asset stream produced from most oil and gas leases using either an RIV or RIK method. This authority is tempered with the obligation placed upon the Secretary to receive fair market value (offshore) or market price (onshore). For brevity, the term “fair market value”, or FMV, is used in this Plan to generically refer to both statutory concepts.
4.1 RIK Statement of Purpose – fully utilize asset management It is critical that the MMS adopt clear RIK program guidelines in addition to specific, measurable goals. Specific goals are discussed in Section 6. Existence of both the RIV and RIK options presents the MMS with a unique opportunity to actively manage the royalty asset stream and optimize the efficiency and effectiveness of its royalty management process. On the one hand, the traditional RIV approach will continue to be employed in situations where it is optimal. On the other hand, benefits of the RIK approach have been explored and realized by the MMS and include conflict avoidance, increased certainty and decreased administrative costs for the public and industry, earlier receipt of royalty revenues, and potential revenue enhancement for the Treasury. Based on extensive experience to date, MMS has concluded that RIK is a viable option to deploy in the right circumstances. The strategic use of both the RIK and RIV options defines the asset management strategy adopted by the MMS. MMS is committed to the systematic and deliberate analysis of the Federal royalty portfolio to selectively apply each of these asset management methods to optimize returns and efficiencies for the taxpayer. As an integral component of the royalty asset management program, the overarching purpose of the RIK program is:
“Develop and maintain the ability and expertise to fully utilize the RIK approach to efficiently manage and optimize the value of mineral royalty assets.”
15
4.2 RIK principles to guide business activity 1. Meet or exceed FMV benchmarks that are established in accordance with statutory
requirements This principle clearly aligns the RIK objectives with statutory guidelines in optimizing the RIK/RIV decision. The FMV benchmarks are developed using commercial fair market value measures and estimates of what a comparable RIV program would yield for a specified field or area.
2. Maximize net revenue for the RIK share of production consistent with the permanent
business model An underlying premise of the RIK program is to develop and implement commercial activities that will maximize net revenue to the Federal government for all volumes taken in kind, based on a conservative risk profile. The level of RIK volumes will be dictated by the ability to enhance net revenues over the traditional RIV option, and by the ability to produce administrative and other efficiency savings.
3. Continue to focus on the Gulf of Mexico as a strategic core area, and work with
producing states to identify/develop onshore opportunities More than 80% of available royalty volumes are produced in the GOM. The Federal government has a commodity ownership position in the GOM that is unique. Combined with the option to take royalties in kind or in value, this position provides significant commercial opportunities. While the GOM is the RIK strategic core area, MMS also pledges a strong commitment to explore RIK with producing states as a collaborative partnership.
4. Efficiently manage administrative costs of the RIK program
This principle recognizes that one of the main advantages of RIK is the ability to streamline the royalty collection process, reduce transaction cycle time, increase the certainty of royalty payments, and reduce administrative expenses for both MMS and industry.
5. Maintain flexibility in responding to the Nation’s strategic energy initiatives The permanent RIK program must be able to react promptly to executive order mandates, as well as to leverage synergies between MMS and other governmental agencies. The current SPR Fill Initiative is a primary example of this capability.
6. Maintain the highest ethical and professional standards
The permanent RIK program must continually maintain the highest standards in carrying out its goals and objectives.
16
5 Performance Metrics As the permanent RIK program develops, it is important to define the metrics by which it will be measured. Implementing asset management strategies requires an understanding of the risks and rewards associated with each strategy and its potential impact on the organization. To support MMS’s decision-making and performance measurement processes, it is essential to develop performance metrics that reflect MMS’s business objectives. MMS has adopted four key performance metrics for development and implementation during the business planning period:
1. Net Revenue 2. Revenue Collection Time 3. Administrative Expense 4. Transaction Cycle Time
The above performance metrics will be implemented and used to monitor progress in meeting specific objectives as outlined in Section 6.
5.1 Net Revenues Net revenue or net revenue/unit volume is the major metric for measuring performance. For royalty collections, net revenue is the realized market price for oil and gas sales plus/minus adjustments to achieve the realized value of the commodity. Adjustments include the cost of transportation, processing, and quality. The metric provides a foundation for:
• Measuring performance of the RIK program relative to a FMV benchmark • Making decisions on RIK versus RIV • Making decisions on RIK commercial options and marketing strategies
A detailed review of the concepts and approach to measuring net revenue is incorporated in Appendix B.
5.2 Revenue Collection Time Revenue Collection Time (RCT) is a measure of the number of days after each production month that MMS takes to collect outstanding receivables for the month of production. For instance, if MMS invoices a natural gas purchaser on the 15th day following the production month (with 10-day payment terms) and payment is received by the 25th, then MMS has an RCT of 25 days. While conventional RIV payments are due at the end of the month following production, commercial transaction payments are typically collected in a much shorter timeframe after adjusting for holidays and weekends. Different commercial terms and conventions exist for oil and gas. For crude oil, settlement typically occurs on the 20th of the month following production, adjusted for non-business days. Natural gas is driven by the ability to submit invoices to the purchasers in a timely manner. MMS typically allows 10 day terms to remit payment.
17
The impact of reducing RCT by accelerating the collection process can provide tangible benefits. For example, assuming RIK sales of $2.4 billion on an annual basis, a 5-day improvement in collection and a short-term interest rate of 3%, increased revenue would be approximately $5 million during the 5-year plan. Additionally, tracking the average RCT will provide valuable information regarding the efficiency of MMS’s operations.
5.3 Administrative Expense Managing administrative expenses is an important element in successfully developing and implementing the RIK business plan. Expenses include direct costs for personnel, contracting, business expenses, and indirect costs associated with support services. Measuring administrative expense on a per unit volume basis allows relevant comparisons across different time periods, geographic regions, and commercial functions. Administrative expenses include costs for various business processes that are essential in capturing the incremental net revenue associated with RIK commercial activities. These costs are associated with the front office, mid office, back office, and economic analysis functions. They include market analysis, deal origination/negotiations, contract execution, quantitative analysis, financial/credit analysis, accounting, legal, and other support. MMS has been utilizing an activity based accounting system since October 2002 to capture and itemize administrative expense information. There is an ongoing effort to review and analyze this information to determine appropriate relationships between RIK business functions and the corresponding RIV functions.
5.4 Transaction Cycle Time Transaction Cycle Time (TCT) measures the time it takes to complete the RIK transaction process from the end of the production month to final confirmation that volumes reconcile and the transaction process is complete. Conceptually, lowering TCT allows for efficiencies in a process, and can lead to a decrease in the administrative expenses that support a specific function or process. Tasks that are not completed in a timely manner require additional administrative effort to continually maintain information and a knowledge base regarding the transaction. One of the major benefits of the RIK program is the significant reduction in the transaction cycle time relative to the RIV compliance/audit process – from years to several months. In establishing a benchmark for the TCT metric, it is beneficial to examine private corporations and their sales transaction cycle time. In most cases, reconciliation of volumes will drive the cycle time. Goals within corporate accounting groups to finalize transactions can be tied to quarter end or year-end accounting close out schedules. As a result, an analogous corporate TCT target would typically not be less than 180 days (compared to the 3 year compliance/audit TCT).
18
6 Five Year Goals and Objectives MMS management has established specific goals and objectives during the five year horizon of the Plan as outlined below:
6.1 Commercial Goals
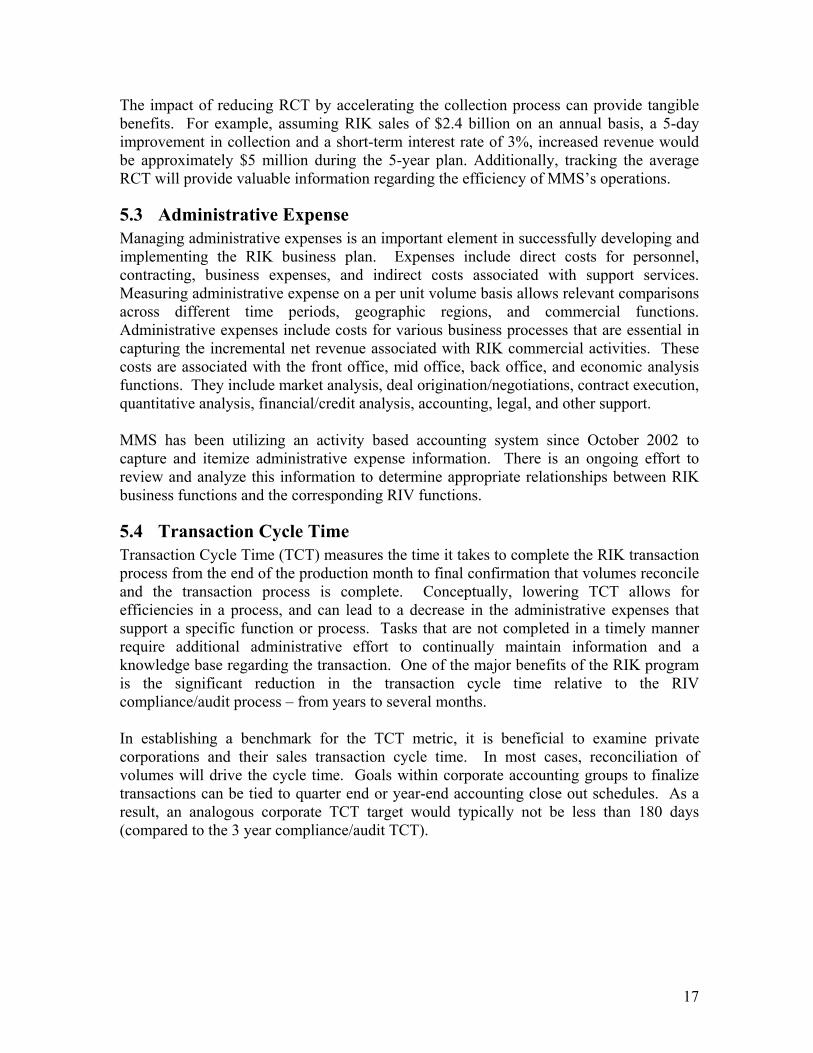
6.1.1 Realize maximum benefits to the public by optimizing RIK volumes MMS’s experience has shown that RIK can provide incremental benefits through increased net revenue and reduced administrative expenses. MMS’s experience also shows that RIK may not be appropriate for all properties. Therefore a major goal during the five year horizon is to realize the optimal level of RIK volumes that maximizes benefits to the public. The following oil and gas volume projections suggest that the optimal level will be within a range that considers the variability of available royalty volumes. These projections are planning scenarios, based on professional judgment as to optimal and realistic RIK volumes for the GOM. Royalty-in-kind gas volumes will increase through 2009 Considering projected royalty relief assumptions, available GOM royalty gas volumes range from 1.57 to 1.84 bcf/day in 2005 and 1.17 to 1.67 bcf/day in 2009 (Figure 5). A projection of RIK GOM royalty gas is shown in Figure 5. The RIK gas volumes should increase from a 2004 level of about 0.5 bcf/day to a range between 1.0 and 1.3 bcf/day. Growth of RIK gas volumes is projected at an optimal level consistent with expectations of being equal to or exceeding appropriate FMV benchmarks.
Natural Gas Royalty Volumes
-
500
1,000
1,500
2,000
2,500
1999 2000 2001 2002 2003 2004 2005 2006 2007 2008 2009
Fiscal Year
Gas
Vol
umes
(MM
cf/d
)
Total GOM Net Royalty Gas
GOM RIK Natural
Gas
Source: EIA Annual Energy Outlook 2004, MMS GOM Outer Continental
Shelf Daily Oil & Gas Production Rate Projections
Figure 5. Total royalty gas available and RIK projection
19
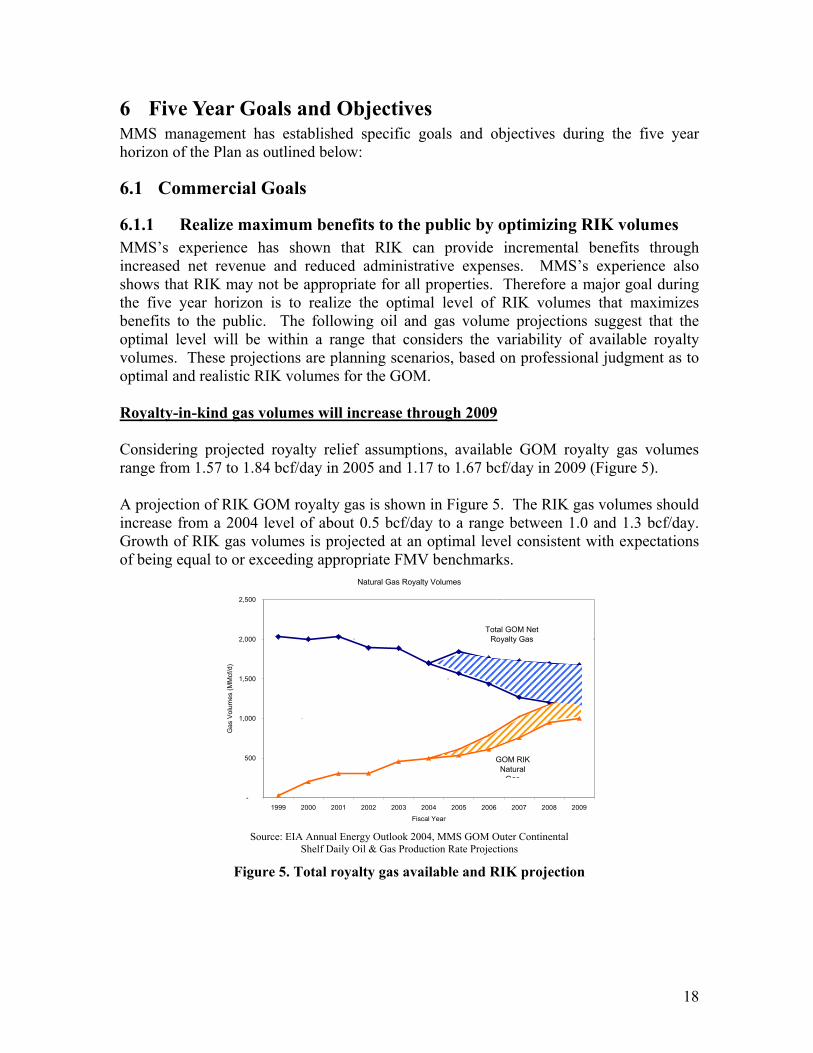
RIK oil volumes are projected to range between 114,000 and 194,000 barrels per day Based on EIA and MMS projections, gross GOM oil production is estimated to increase in 2005 when several large deep-water fields are anticipated to come on stream. When the projected royalty relief assumptions are factored in, available GOM royalty oil volumes range from 194,000 to 234,000 barrels/day in 2005 to between 151,000 and 234,000 barrels/day in 2009 (Figure 6). Projected RIK oil volumes in the GOM are expected to range between 114,000 and 194,000 barrels/day by 2009 as shown in Figure 6. The GOM volume projections include approximately 50,000 barrels/day for the GOM Small Refiner Program and a range of 64,000 to 144,000 barrels/day for a commercial crude oil sales program. The projected RIK oil volumes stay at a relatively constant 70% of available GOM royalty volumes.
Crude Oil Royalty Volumes
-
50
100
150
200
250
300
1999 2000 2001 2002 2003 2004 2005 2006 2007 2008 2009Fiscal Year
Oil
Vol
umes
(MB
bl/d
)
Total GOM Net Royalty Oil
GOM RIK Oil
Source: EIA Annual Energy Outlook 2004, MMS GOM Outer Continental
Shelf Daily Oil & Gas Production Rate Projections
Figure 6. Total GOM royalty oil available and RIK projection
20
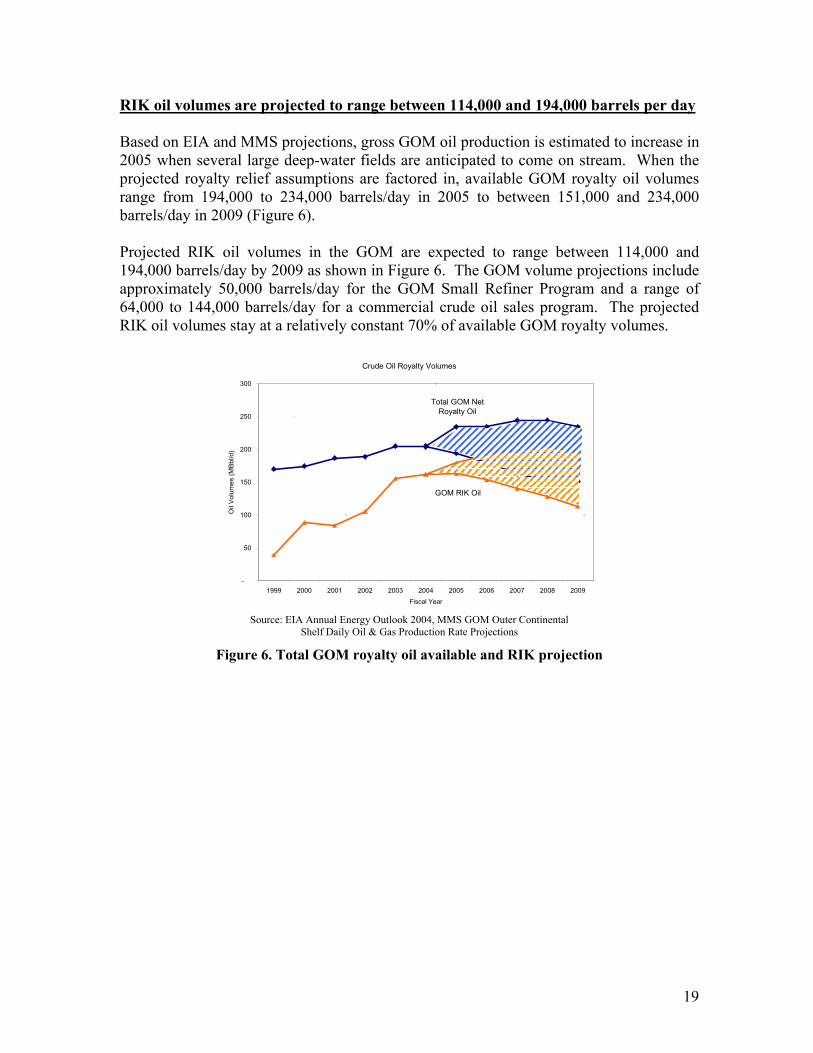
6.1.2 Enhance net revenue by $50 million over the 5-year plan Based on historical RIK performance data over the last 3-5 years, MMS has obtained an increase of about 1% in net revenues over RIV. This enhancement does not include administrative savings associated with RIK. In order to project a net revenue benefit over the five-year business plan, we made several simplifying assumptions including:
1) Many gas properties with the greatest optionality value have already been converted to RIK, therefore incremental net revenues from newly-added properties are likely to be lower.
2) MMS will see an increase in incremental net revenues as it gains additional expertise and adopts more enhanced marketing practices.
3) For gas, this results in incremental net revenue starting at about $.04 per mmbtu (1% of $4/mmbtu gas), declining to about $.02 per mmbtu during the five years. (Figure 7).
4) For oil, a more conservative incremental increase of $.15 per bbl (.5% of $30/bbl oil) is used, declining to about $.11 per barrel during the five years (Figure 7).
MMS RIK Program
$0.00
$0.02
$0.04
$0.06
$0.08
$0.10
$0.12
$0.14
$0.16
2003 2004 2005 2006 2007 2008 2009
Incr
emen
tal N
et R
even
ue ($
/uni
t vol
ume)
.
RIK Oil Range
RIK Gas Range
MMS RIK Program
$0
$5
$10
$15
$20
$25
$30
2003 2004 2005 2006 2007 2008 2009
Incr
emen
tal N
et R
even
ue ($
mill
ion)
.
RIK Incremental Net Revenue Range
(Gas & Oil)
Cumulative Incremental Net Revenue >= $50 million
MMS RIK Program
$0
$5
$10
$15
$20
$25
$30
2003 2004 2005 2006 2007 2008 2009
Incr
emen
tal N
et R
even
ue ($
mill
ion)
.
RIK Incremental Net Revenue Range
(Gas & Oil)
Cumulative Incremental Net Revenue >= $50 million
MMS RIK Program
$0.00
$0.02
$0.04
$0.06
$0.08
$0.10
$0.12
$0.14
$0.16
2003 2004 2005 2006 2007 2008 2009
Incr
emen
tal N
et R
even
ue ($
/uni
t vol
ume)
.
RIK Oil Range
RIK Gas Range
MMS RIK Program
$0
$5
$10
$15
$20
$25
$30
2003 2004 2005 2006 2007 2008 2009
Incr
emen
tal N
et R
even
ue ($
mill
ion)
.
RIK Incremental Net Revenue Range
(Gas & Oil)
Cumulative Incremental Net Revenue >= $50 million
MMS RIK Program
$0
$5
$10
$15
$20
$25
$30
2003 2004 2005 2006 2007 2008 2009
Incr
emen
tal N
et R
even
ue ($
mill
ion)
.
RIK Incremental Net Revenue Range
(Gas & Oil)
Cumulative Incremental Net Revenue >= $50 million
Figure 7. Incremental net revenue per unit and incremental net revenue projection
When the incremental net revenue assumptions are combined with the RIK volume projections, it produces a range of projected incremental net revenue (Figure 7). The chart shows that cumulative incremental net revenue of at least $50 million is expected over the five year period. This assumes conservative volume estimates at the lower end of the incremental net revenue range.
21
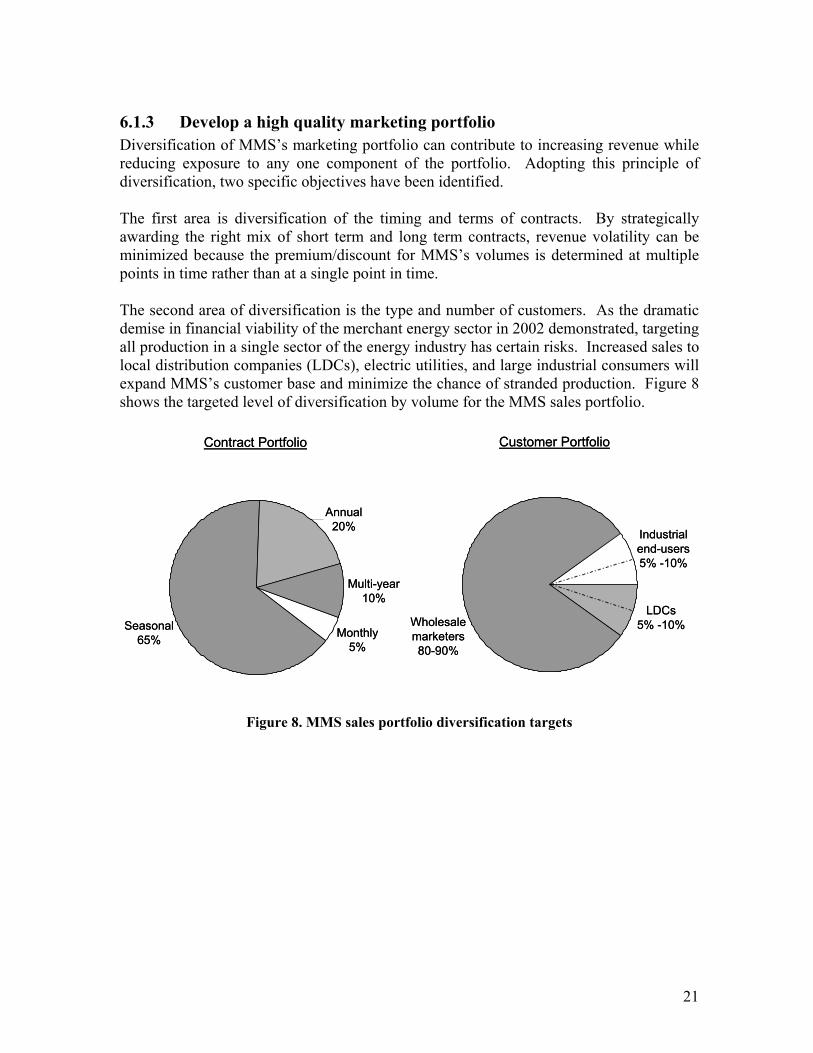
6.1.3 Develop a high quality marketing portfolio Diversification of MMS’s marketing portfolio can contribute to increasing revenue while reducing exposure to any one component of the portfolio. Adopting this principle of diversification, two specific objectives have been identified. The first area is diversification of the timing and terms of contracts. By strategically awarding the right mix of short term and long term contracts, revenue volatility can be minimized because the premium/discount for MMS’s volumes is determined at multiple points in time rather than at a single point in time. The second area of diversification is the type and number of customers. As the dramatic demise in financial viability of the merchant energy sector in 2002 demonstrated, targeting all production in a single sector of the energy industry has certain risks. Increased sales to local distribution companies (LDCs), electric utilities, and large industrial consumers will expand MMS’s customer base and minimize the chance of stranded production. Figure 8 shows the targeted level of diversification by volume for the MMS sales portfolio.
Figure 8. MMS sales portfolio diversification targets
Contract Portfolio
Monthly5%
Seasonal65%
Multi-year10%
Annual20%
Customer Portfolio
LDCs5% -10%
Industrial end-users5% -10%
Wholesale marketers80-90%
Contract Portfolio
Monthly5%
Seasonal65%
Multi-year10%
Annual20%
Customer Portfolio
LDCs5% -10%
Industrial end-users5% -10%
Wholesale marketers80-90%
22
6.2 Administrative Goals
6.2.1 Efficiently manage RIK program - reduce administrative costs This goal includes developing the processes and procedures to capture the direct and indirect administrative expenses for RIK and be able to compare to RIV expense on a volumetric basis. MMS has established a target of reducing RIK administrative expenses on a volumetric basis (using barrel of oil equivalent or BOE) by 10% over the last 3 years of the five year business plan.
6.2.2 Develop procedures to monitor Transaction Cycle Time - TCT Transaction cycle time is defined as the time from the end of the production month until all transactions and related activities are completed. TCT activities include: preparing and mailing invoices, collecting payment from the sales transaction, completing internal accounting and reporting, and reconciling any volume imbalances. In addition to the goal of developing procedures to monitor TCT, MMS has also established a target of reducing TCT by 10% over the 5 year business plan.
6.2.3 Develop procedures to monitor Revenue Collection Time - RCT RIV collections are due at the end of the month following production. Most RIK commercial transactions are due between 20 and 25 days after the production month. In addition to a goal of developing procedures to monitor RCT, MMS has established a target of meeting or exceeding 95% of revenue collections within a 25 day collection period.
6.2.4 Complete reorganization of MRM and staffing of key business functions to fully implement the permanent RIK program
This objective will complete the organizational restructuring and implement process control functions that are basic building blocks for the permanent RIK framework. Identification of specific skill set requirements and filling those personnel needs will allow the RIK team to enhance their commercial experience and expertise. This effort includes front office, back office, and mid office personnel. When completed, MMS will realize the internal controls and efficiencies of a top tier commercial marketing group.
6.2.5 Implement a systematic decision making and performance monitoring process
This objective includes implementation of systems, processes and procedures that will allow MMS to determine FMV benchmarks and measure RIK performance relative to the benchmarks.
23
7 Commercial Business Model and Implications Energy commodity sellers adopt a variety of commercial business models ranging from conservative, physical market-based strategies to those focused on a more active, market-making strategy using financial derivatives to manage risk. It is essential for an energy commodity seller to define its market position relative to specific strategies regarding risk and revenue needs. This market position is a prerequisite for and is foundational to the commercial entity’s business model and processes. This section discusses the MMS RIK program’s market strategy, business model, and associated implications on organization, business processes, human resources, and information management systems.
7.1 MMS is a conservative energy wholesaler The MMS RIK program has adopted a market strategy of a conservative, price-taking producer/seller of energy commodities into the wholesale market at or near the lease in producing areas. The current RIK business model is characterized as follows:
• Basis of Revenue Proceeds: All sales are competitively made and revenues are received based on the spot market for physical sales transactions as reported by the major price reporting publications at the most liquid and transparent market centers/pooling points. No fixed price sales are made.
• Contracting Mechanisms: Industry standard base contracts are used for general
terms and conditions. These base contracts, in combination with sales terms in specific “Invitations for Offer” and additional stipulations in individual transaction confirmations, comprise the entire sales transaction. MMS has not used financial instruments or storage positions.
• Sales Locations: Most sales are made at or near the lease with value differentials
from transparent market centers/pooling points expressed or implied in sales contracts.
• Transportation: Pre-sale movement of energy commodities to locations
downstream of the lease is currently done only to a limited extent and then only to the first set of producing area market centers/pooling points. MMS has not engaged in long-haul and/or firm transportation contracts.
• Sales Transactions: A bid-out or auction method is used to competitively sell
royalty commodities to counterparties that have been pre-qualified based on experience and credit worthiness. Limited negotiations with bidders occur. Sales are for multi-month terms, no more than 1 year in length.
• Service Contracts: Transportation and processing contracts are negotiated and
executed where favorable to optimize revenue returns.
24
7.2 Business model extensions will optimize the RIK program Extensions from the current business model will be made to potentially increase net revenues, while continuing to operate within the RIK program’s statutory authorities and conservative risk profile.
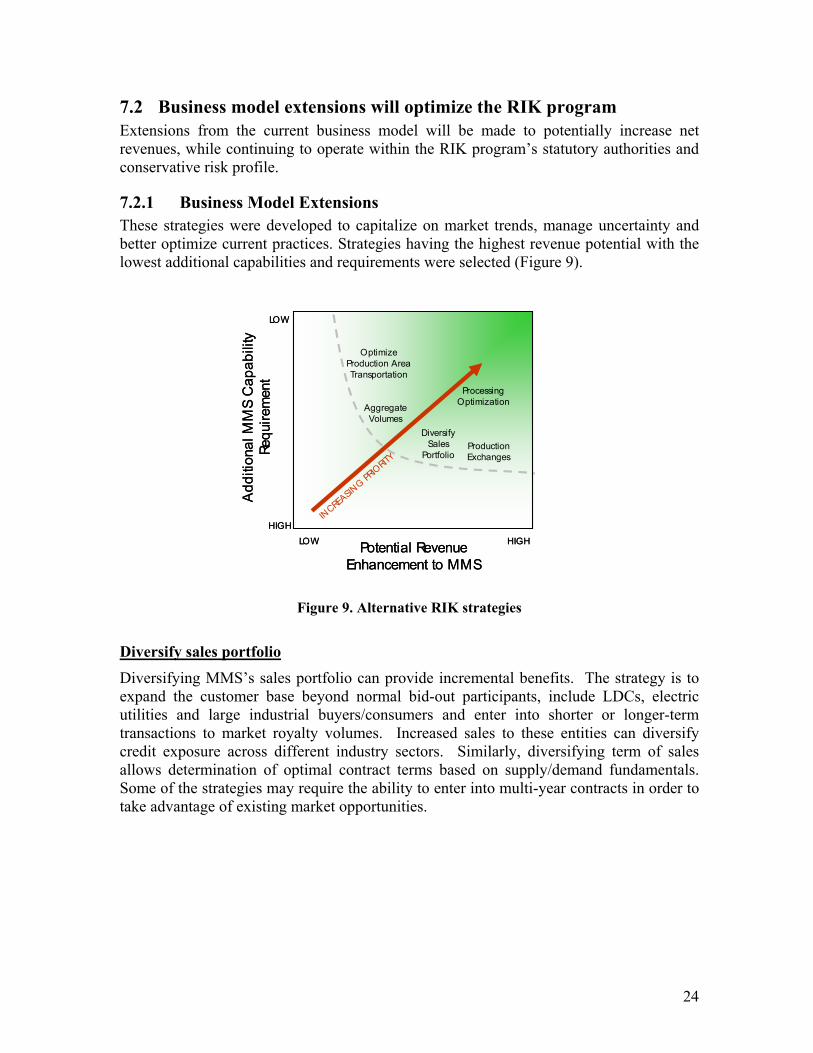
7.2.1 Business Model Extensions These strategies were developed to capitalize on market trends, manage uncertainty and better optimize current practices. Strategies having the highest revenue potential with the lowest additional capabilities and requirements were selected (Figure 9).
Figure 9. Alternative RIK strategies
Diversify sales portfolio Diversifying MMS’s sales portfolio can provide incremental benefits. The strategy is to expand the customer base beyond normal bid-out participants, include LDCs, electric utilities and large industrial buyers/consumers and enter into shorter or longer-term transactions to market royalty volumes. Increased sales to these entities can diversify credit exposure across different industry sectors. Similarly, diversifying term of sales allows determination of optimal contract terms based on supply/demand fundamentals. Some of the strategies may require the ability to enter into multi-year contracts in order to take advantage of existing market opportunities.
Potential Revenue Enhancement to MMS
Add
ition
al M
MS
Cap
abili
ty
Requ
irem
ent
Processing Optimization
Diversify Sales
Portfolio
LOW
HIGH
HIGH
LOW
Aggregate Volumes
INCRE
ASING PR
IORIT
Y
Optimize Production Area Transportation
Production Exchanges
Potential Revenue Enhancement to MMS
Add
ition
al M
MS
Cap
abili
ty
Requ
irem
ent
Processing Optimization
Diversify Sales
Portfolio
LOW
HIGH
HIGH
LOW
Aggregate Volumes
INCRE
ASING PR
IORIT
Y
Optimize Production Area Transportation
Production Exchanges
25
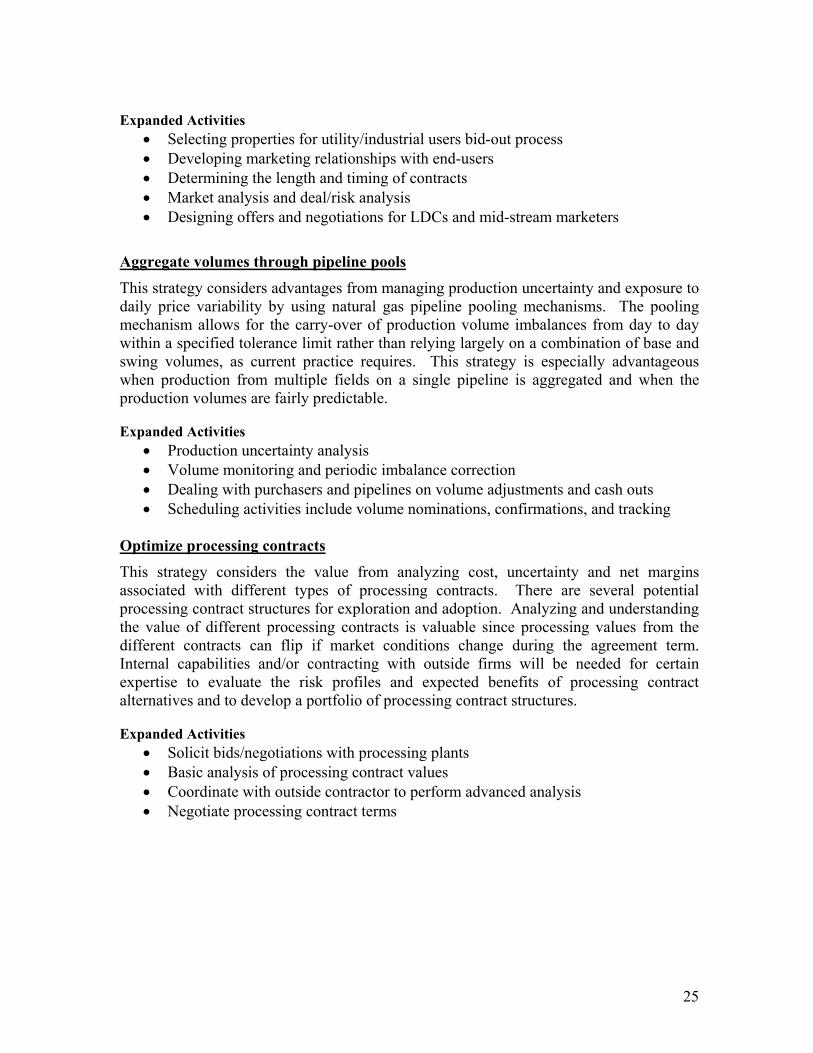
Expanded Activities • Selecting properties for utility/industrial users bid-out process • Developing marketing relationships with end-users • Determining the length and timing of contracts • Market analysis and deal/risk analysis • Designing offers and negotiations for LDCs and mid-stream marketers
Aggregate volumes through pipeline pools This strategy considers advantages from managing production uncertainty and exposure to daily price variability by using natural gas pipeline pooling mechanisms. The pooling mechanism allows for the carry-over of production volume imbalances from day to day within a specified tolerance limit rather than relying largely on a combination of base and swing volumes, as current practice requires. This strategy is especially advantageous when production from multiple fields on a single pipeline is aggregated and when the production volumes are fairly predictable.
Expanded Activities • Production uncertainty analysis • Volume monitoring and periodic imbalance correction • Dealing with purchasers and pipelines on volume adjustments and cash outs • Scheduling activities include volume nominations, confirmations, and tracking
Optimize processing contracts This strategy considers the value from analyzing cost, uncertainty and net margins associated with different types of processing contracts. There are several potential processing contract structures for exploration and adoption. Analyzing and understanding the value of different processing contracts is valuable since processing values from the different contracts can flip if market conditions change during the agreement term. Internal capabilities and/or contracting with outside firms will be needed for certain expertise to evaluate the risk profiles and expected benefits of processing contract alternatives and to develop a portfolio of processing contract structures.
Expanded Activities • Solicit bids/negotiations with processing plants • Basic analysis of processing contract values • Coordinate with outside contractor to perform advanced analysis • Negotiate processing contract terms
26
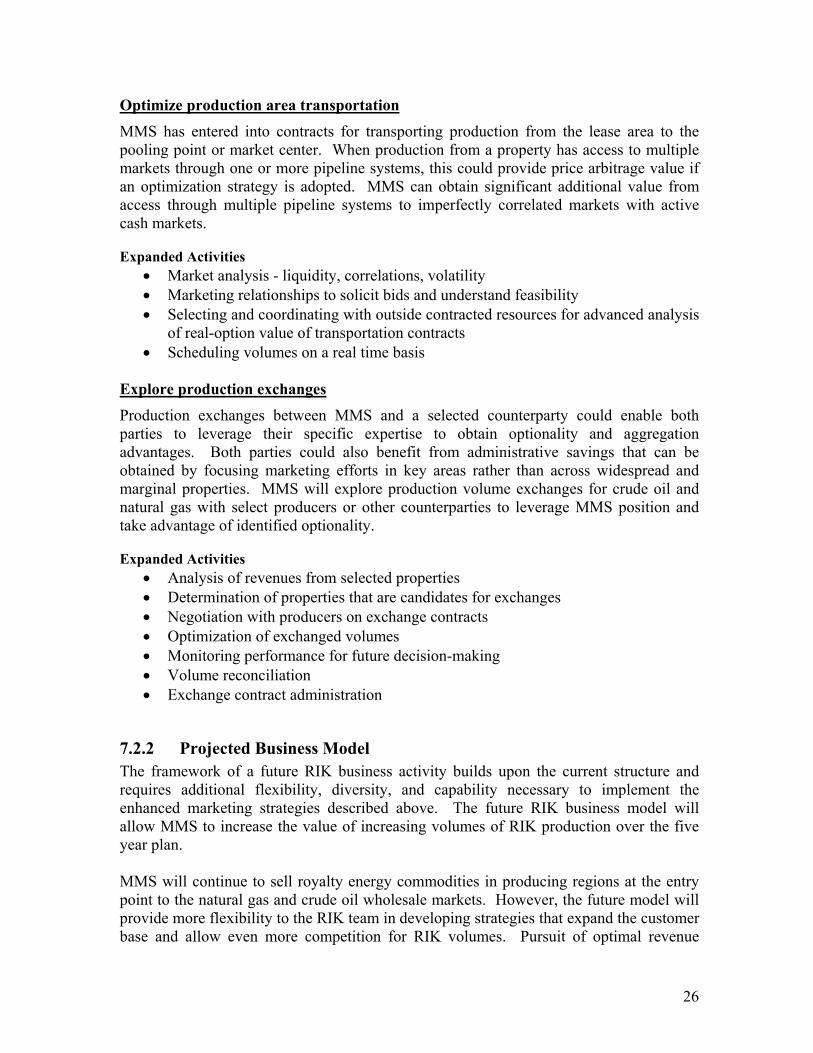
Optimize production area transportation MMS has entered into contracts for transporting production from the lease area to the pooling point or market center. When production from a property has access to multiple markets through one or more pipeline systems, this could provide price arbitrage value if an optimization strategy is adopted. MMS can obtain significant additional value from access through multiple pipeline systems to imperfectly correlated markets with active cash markets.
Expanded Activities • Market analysis - liquidity, correlations, volatility • Marketing relationships to solicit bids and understand feasibility • Selecting and coordinating with outside contracted resources for advanced analysis
of real-option value of transportation contracts • Scheduling volumes on a real time basis
Explore production exchanges Production exchanges between MMS and a selected counterparty could enable both parties to leverage their specific expertise to obtain optionality and aggregation advantages. Both parties could also benefit from administrative savings that can be obtained by focusing marketing efforts in key areas rather than across widespread and marginal properties. MMS will explore production volume exchanges for crude oil and natural gas with select producers or other counterparties to leverage MMS position and take advantage of identified optionality.
Expanded Activities • Analysis of revenues from selected properties • Determination of properties that are candidates for exchanges • Negotiation with producers on exchange contracts • Optimization of exchanged volumes • Monitoring performance for future decision-making • Volume reconciliation • Exchange contract administration
7.2.2 Projected Business Model The framework of a future RIK business activity builds upon the current structure and requires additional flexibility, diversity, and capability necessary to implement the enhanced marketing strategies described above. The future RIK business model will allow MMS to increase the value of increasing volumes of RIK production over the five year plan. MMS will continue to sell royalty energy commodities in producing regions at the entry point to the natural gas and crude oil wholesale markets. However, the future model will provide more flexibility to the RIK team in developing strategies that expand the customer base and allow even more competition for RIK volumes. Pursuit of optimal revenue
27
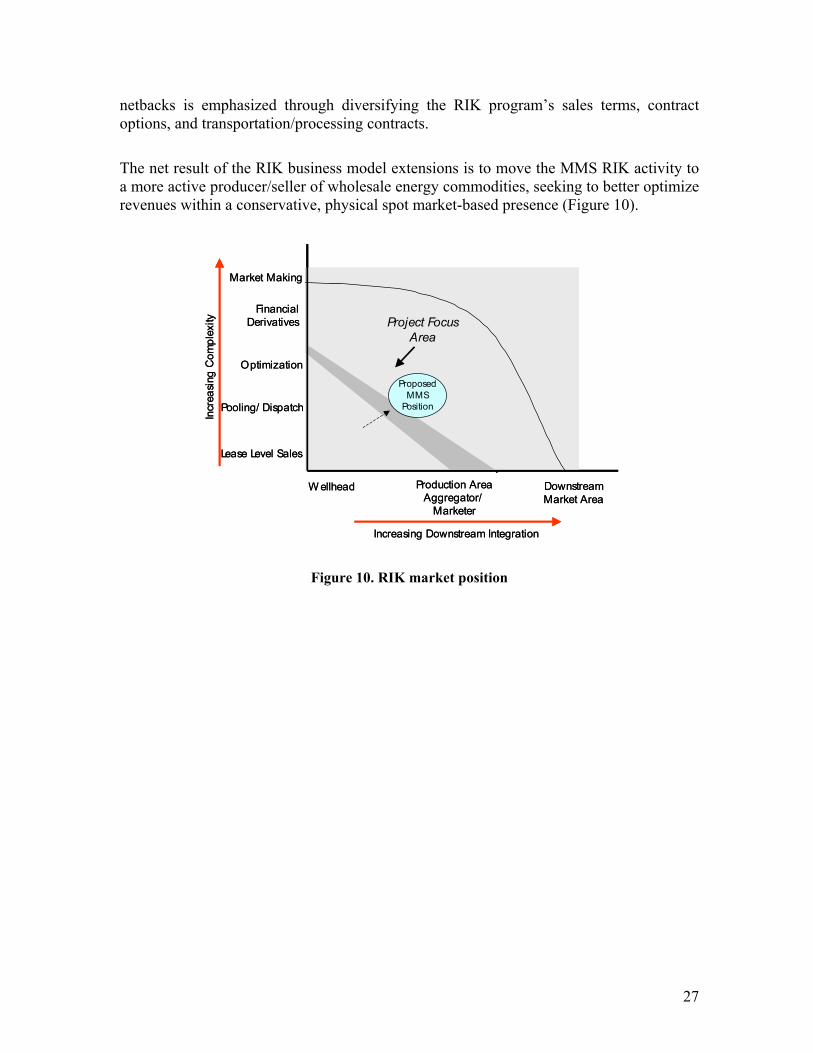
netbacks is emphasized through diversifying the RIK program’s sales terms, contract options, and transportation/processing contracts. The net result of the RIK business model extensions is to move the MMS RIK activity to a more active producer/seller of wholesale energy commodities, seeking to better optimize revenues within a conservative, physical spot market-based presence (Figure 10).
Figure 10. RIK market position
Lease Level Sales
Pooling/ Dispatch
Financial Derivatives
Market Making
W ellhead
Incr
easi
ng C
ompl
exity
Increasing Downstream Integration
Optimization
Current MMS
Position
Project Focus Area
Proposed MMS
Position
Production Area Aggregator/
Marketer
Downstream Market Area
Lease Level Sales
Pooling/ Dispatch
Financial Derivatives
Market Making
W ellhead
Incr
easi
ng C
ompl
exity
Increasing Downstream Integration
Optimization
Current MMS
Position
Project Focus Area
Proposed MMS
Position
Current MMS
Position
Project Focus Area
Proposed MMS
Position
Production Area Aggregator/
Marketer
Downstream Market Area
28
7.3 Business model changes will affect organization, human resources, and systems
Implementation of the above business model extensions, along with continued improvements in the RIK internal control structure, will provide MMS with the capability to fully deploy an oil and gas royalty asset management strategy, and thus achieve the program’s purpose/principles and objectives outlined in Sections 4 and 6, respectively. Program implications associated with installing this full RIK capability include organizational, business process, and human resource issues.
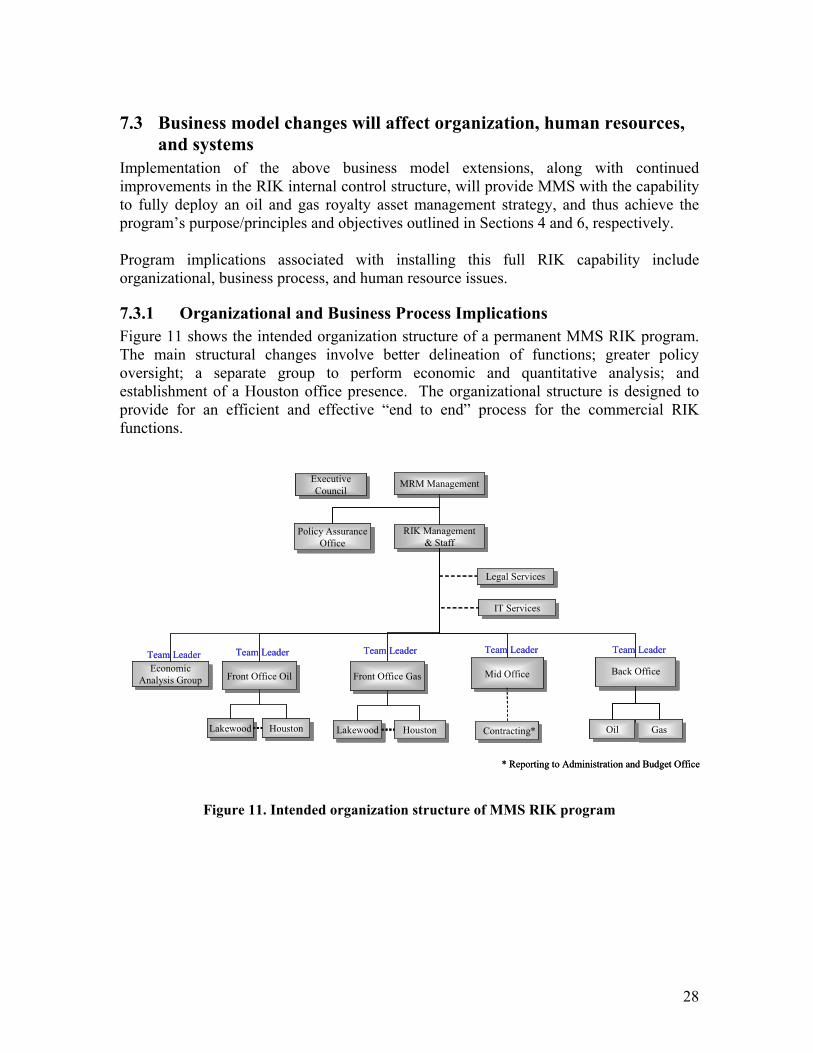
7.3.1 Organizational and Business Process Implications Figure 11 shows the intended organization structure of a permanent MMS RIK program. The main structural changes involve better delineation of functions; greater policy oversight; a separate group to perform economic and quantitative analysis; and establishment of a Houston office presence. The organizational structure is designed to provide for an efficient and effective “end to end” process for the commercial RIK functions.
Figure 11. Intended organization structure of MMS RIK program
RIK Management& Staff
RIK Management& Staff
Back OfficeBack OfficeMid OfficeMid OfficeEconomic Analysis Group
Economic Analysis Group
Legal ServicesLegal Services
GasGasOilOil
Team Leader
Front Office OilFront Office Oil
Team Leader Team Leader Team LeaderTeam Leader
IT ServicesIT Services
LakewoodLakewood HoustonHouston
Front Office GasFront Office Gas
LakewoodLakewood HoustonHouston
Executive Council
Executive Council
* Reporting to Administration and Budget Office
MRM ManagementMRM Management
Policy Assurance Office
Policy Assurance Office
Contracting*Contracting*
RIK Management& Staff
RIK Management& Staff
Back OfficeBack OfficeMid OfficeMid OfficeEconomic Analysis Group
Economic Analysis Group
Legal ServicesLegal Services
GasGasOilOil
Team Leader
Front Office OilFront Office Oil
Team Leader Team Leader Team LeaderTeam Leader
IT ServicesIT Services
LakewoodLakewood HoustonHouston
Front Office GasFront Office Gas
LakewoodLakewood HoustonHouston
Executive Council
Executive Council
* Reporting to Administration and Budget Office
MRM ManagementMRM Management
Policy Assurance Office
Policy Assurance Office
Contracting*Contracting*
29
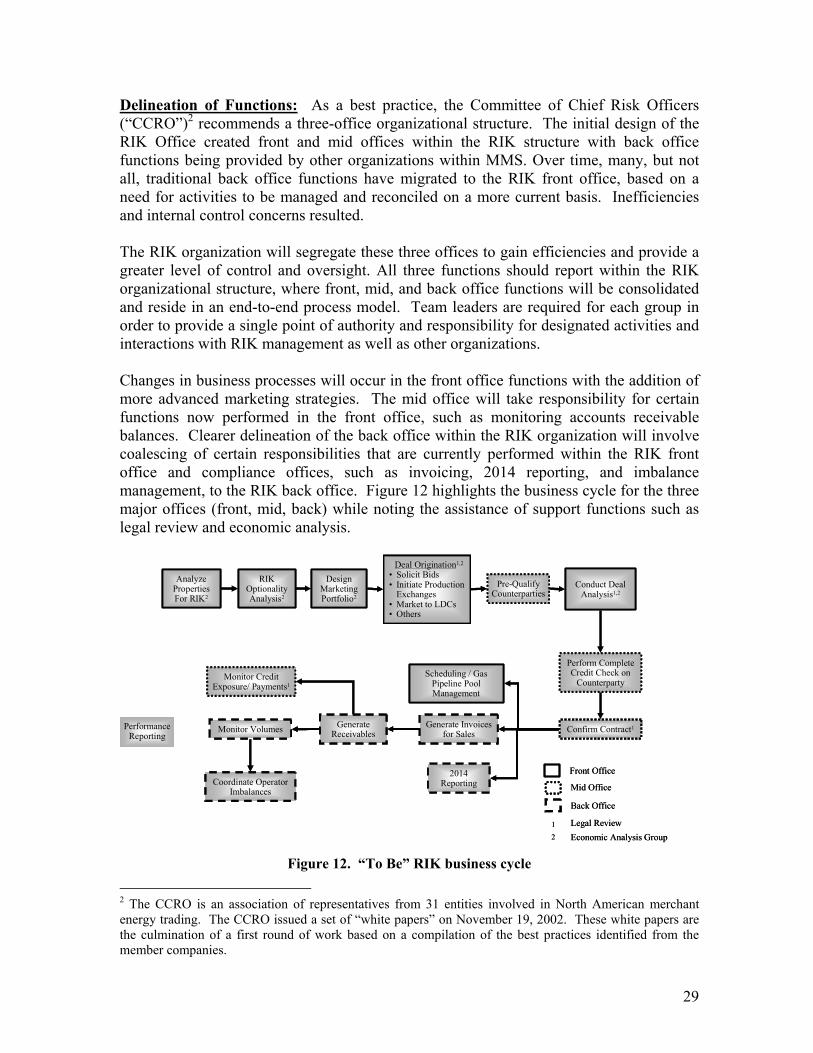
Delineation of Functions: As a best practice, the Committee of Chief Risk Officers (“CCRO”)2 recommends a three-office organizational structure. The initial design of the RIK Office created front and mid offices within the RIK structure with back office functions being provided by other organizations within MMS. Over time, many, but not all, traditional back office functions have migrated to the RIK front office, based on a need for activities to be managed and reconciled on a more current basis. Inefficiencies and internal control concerns resulted. The RIK organization will segregate these three offices to gain efficiencies and provide a greater level of control and oversight. All three functions should report within the RIK organizational structure, where front, mid, and back office functions will be consolidated and reside in an end-to-end process model. Team leaders are required for each group in order to provide a single point of authority and responsibility for designated activities and interactions with RIK management as well as other organizations. Changes in business processes will occur in the front office functions with the addition of more advanced marketing strategies. The mid office will take responsibility for certain functions now performed in the front office, such as monitoring accounts receivable balances. Clearer delineation of the back office within the RIK organization will involve coalescing of certain responsibilities that are currently performed within the RIK front office and compliance offices, such as invoicing, 2014 reporting, and imbalance management, to the RIK back office. Figure 12 highlights the business cycle for the three major offices (front, mid, back) while noting the assistance of support functions such as legal review and economic analysis.
Conduct DealAnalysis1,2
Analyze PropertiesFor RIK2
Perform Complete Credit Check on
Counterparty
Front Office
Confirm Contract1Generate Invoices for Sales
Generate ReceivablesMonitor Volumes
Coordinate Operator Imbalances Mid Office
Back Office
Monitor Credit Exposure/ Payments1
Legal ReviewEconomic Analysis Group
1
2
RIK Optionality Analysis2
Design Marketing Portfolio2
Deal Origination1,2
• Solicit Bids• Initiate Production
Exchanges• Market to LDCs• Others
Pre-Qualify Counterparties
Scheduling / Gas Pipeline Pool Management
2014 Reporting
PerformanceReporting
Figure 12. “To Be” RIK business cycle
2 The CCRO is an association of representatives from 31 entities involved in North American merchant energy trading. The CCRO issued a set of “white papers” on November 19, 2002. These white papers are the culmination of a first round of work based on a compilation of the best practices identified from the member companies.
30
Policy Oversight: The RIK program is exposed to certain risks associated with a commercial enterprise (outlined in Section 3). As in private commercial organizations, it is essential for MMS to adopt and follow clearly defined risk guidelines or policies. A risk policy will describe the risk tolerances and limits for the RIK organization. There is a need for a senior level oversight function within MMS to perform functions equivalent to the Risk Committee and/or Chief Risk Officer in commercial firms that typically develop guidelines and ensure compliance with corporate risk policies. The MMS Executive Committee (EC), comprised of the Director, Deputy Director, and Associate Directors, will provide an ongoing policy oversight function within MMS for the RIK commercial operations. The EC will provide direction for this function, which will be carried out by a policy assurance office, led by a senior manager having in-depth knowledge of RIK commercial activities and risk concepts. The policy assurance function will provide:
• Overall risk policy guidelines to be used in all RIK operations • Guidance and management of performance monitoring and measurement. • Input and concurrence on MMS’s internal audit/management control review
process for the RIK program. Economic Analysis Group: In today’s natural gas and crude oil marketing environment, the use of sophisticated analysis to examine various marketing opportunities has increased the complexity in making marketing decisions. There is a need in the RIK program for the additional expertise necessary for this increasingly complex analysis. MMS will develop a group within the RIK organization that has the responsibility and necessary resources to coordinate the economic and quantitative analysis function. This function will be a resource base for RIK commercial business decision analysis, working closely with RIK management in Lakewood and front office personnel on emerging strategies and portfolios. In addition, the Economic Analysis Group will be a resource for the policy assurance function. Houston Presence: The MMS RIK organizational team is headquartered in Lakewood, Colorado with almost all management and staff located in this office. Developing and managing the commodity bid-out packages, communicating with prospective customers, and negotiating transportation agreements has required frequent trips to Houston, where the majority of producers, purchasers and other counterparties are located. To increase efficiencies and facilitate relationships with counterparties in the industry, MMS will create a presence for the RIK front office team in Houston. The Houston presence is predicated on the need for crude oil and natural gas marketers to have access to their counterparts in the industry and maintain the level of experience and expertise required for an expanded business model. Further, a front office presence in Houston, the epicenter of GOM production and marketing activity, is considered essential to attract the required level of expertise and experience to more fully staff the front office.
31
7.3.2 Human Resource Implications Expanding the RIK business model and adopting new commercial strategies will increase the complexity of RIK origination, analysis, and negotiation of transportation, processing, exchange, and commodity sales agreements. The MMS RIK personnel have acquired substantial commercial experience during the pilot phase. However, execution of the new strategies will require an increased level of experience and expertise to allow full deployment of the new business model. As part of the permanent RIK program, MMS will hire or otherwise retain personnel in key positions with significant commercial experience in oil and natural gas marketing in the GOM and Rocky Mountain regions to assist in implementing the enhanced marketing strategies. MMS will increase the level of experience and expertise of its personnel specifically in the following functions:
• Front office marketing • Economic and quantitative analysis • Scheduling • Legal support • Contract administration
Specific additions to the RIK team include: oil marketer, gas marketers, gas schedulers, oil scheduler, and experienced economics/quantitative analysts. These modest additions to the RIK organization will have a minimal impact to the size of the MRM organization since they will be offset by efficiencies realized by expanded adoption of the RIK approach. Retention of the required human resources can be accomplished through 1) internal hiring or transferring of Federal employees and training over several years; 2) contracting for select skill sets/services for full-time operational work with the RIK team; 3) outsourced contracting or consulting services with commercial resources; or 4) a combination of these approaches. The following more fully describes the intended approaches to filling human resource needs:
• Front Office Marketing. Outsourcing the marketing function for GOM RIK commodity sales is not expected to result in benefits due to highly competitive, transparent markets with well-developed and accessible infrastructure. It is currently unclear whether outsourcing a marketing function for onshore RIK commodity sales would be beneficial. MMS anticipates enhancing capabilities in this area through a combination of internal hiring/transferring of Federal employees and selective, term contract hiring of specific skill sets for full-time work with the RIK front office operational team.
32
• Economic and Quantitative Analysis. Advanced economic analysis for commodity sales optimization requires a high level of expertise in economic modeling and real options valuation. Such analysis will be conducted only on a periodic basis and will likely not justify maintaining a full-time staff with advanced economic and quantitative backgrounds. Periodic contracting for consulting service to perform specific analyses is the preferred approach to assist the Economic Analysis Group.
• Scheduling. MMS will likely be able to attract and retain as Federal employees
the necessary level of expertise in the marketplace for scheduling functions.
• Legal Support. Expansion of the business model will require periodic legal analysis support to a greater degree than previously encountered. Commercial legal expertise, including experience with the Uniform Commercial Code in the context of selling, payment, shipping, and processing, will be needed. MMS will consult with the Office of the Solicitor as it identifies and retains this as-needed expertise.
• Contract Administration. The adoption of enhanced marketing strategies increases
the complexity of the commercial RIK contracting activity. Additional expertise in commercial oil and gas transactions and contracting practices is needed to provide the advice and oversight required in contract modifications or interpretations. MMS anticipates that such expertise can be developed in-house.
7.3.3 Information Systems Implications MMS implemented its three RIK information management systems in 2003. This suite of system support is comprised of a gas management system, liquids management system, and a risk and performance management system. These commercial-off-the-shelf systems, based on core functionality of SunGard’s industry standard “Nucleus” System, have been tailored for the MMS RIK business model and fully integrated with MRM’s financial and data warehouse systems. Implementation of efficiency metrics relatively early in the business planning period will require systems enhancements so that business objectives related to transaction cycle time and revenue collection time can be measured. It is likely that further systems refinements and enhancements will be required in the last several years of the Business Plan, as business model extensions are implemented and energy markets continue to evolve. Lastly, MRM systems enhancements are anticipated to support the capture of energy market intelligence and its presentation and dissemination to both RIK and RIV personnel.
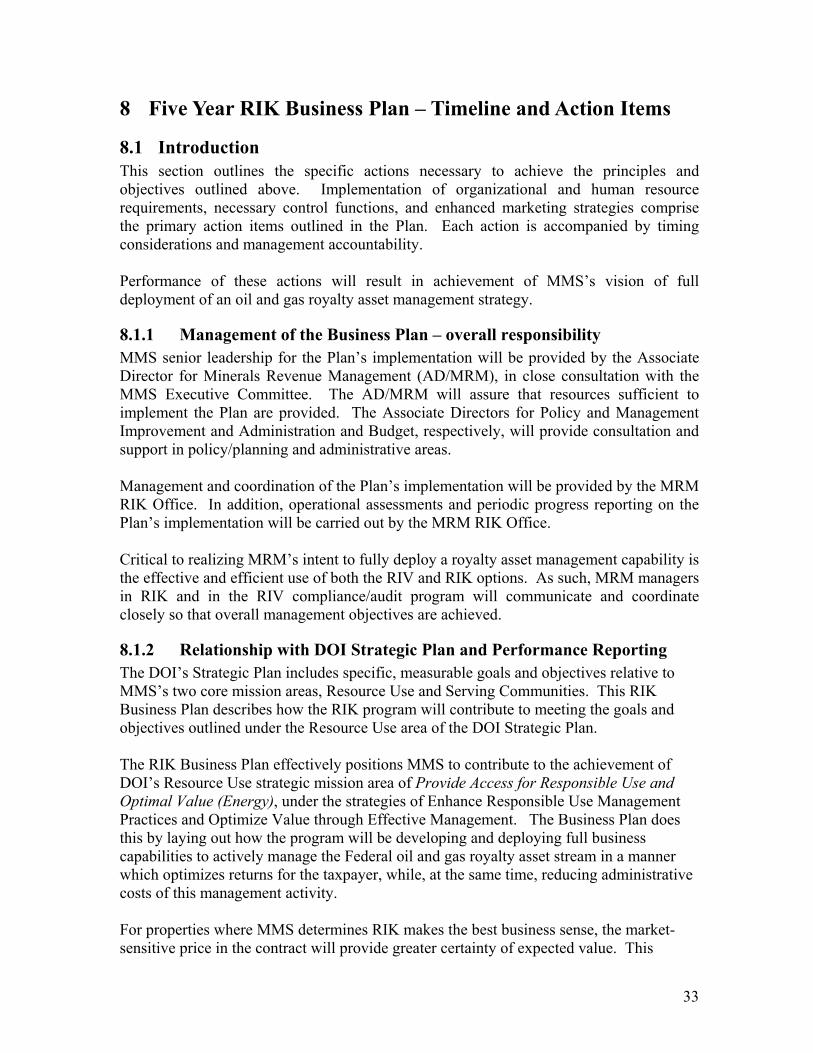
33
8 Five Year RIK Business Plan – Timeline and Action Items
8.1 Introduction This section outlines the specific actions necessary to achieve the principles and objectives outlined above. Implementation of organizational and human resource requirements, necessary control functions, and enhanced marketing strategies comprise the primary action items outlined in the Plan. Each action is accompanied by timing considerations and management accountability. Performance of these actions will result in achievement of MMS’s vision of full deployment of an oil and gas royalty asset management strategy.
8.1.1 Management of the Business Plan – overall responsibility MMS senior leadership for the Plan’s implementation will be provided by the Associate Director for Minerals Revenue Management (AD/MRM), in close consultation with the MMS Executive Committee. The AD/MRM will assure that resources sufficient to implement the Plan are provided. The Associate Directors for Policy and Management Improvement and Administration and Budget, respectively, will provide consultation and support in policy/planning and administrative areas. Management and coordination of the Plan’s implementation will be provided by the MRM RIK Office. In addition, operational assessments and periodic progress reporting on the Plan’s implementation will be carried out by the MRM RIK Office. Critical to realizing MRM’s intent to fully deploy a royalty asset management capability is the effective and efficient use of both the RIV and RIK options. As such, MRM managers in RIK and in the RIV compliance/audit program will communicate and coordinate closely so that overall management objectives are achieved.
8.1.2 Relationship with DOI Strategic Plan and Performance Reporting The DOI’s Strategic Plan includes specific, measurable goals and objectives relative to MMS’s two core mission areas, Resource Use and Serving Communities. This RIK Business Plan describes how the RIK program will contribute to meeting the goals and objectives outlined under the Resource Use area of the DOI Strategic Plan. The RIK Business Plan effectively positions MMS to contribute to the achievement of DOI’s Resource Use strategic mission area of Provide Access for Responsible Use and Optimal Value (Energy), under the strategies of Enhance Responsible Use Management Practices and Optimize Value through Effective Management. The Business Plan does this by laying out how the program will be developing and deploying full business capabilities to actively manage the Federal oil and gas royalty asset stream in a manner which optimizes returns for the taxpayer, while, at the same time, reducing administrative costs of this management activity. For properties where MMS determines RIK makes the best business sense, the market-sensitive price in the contract will provide greater certainty of expected value. This
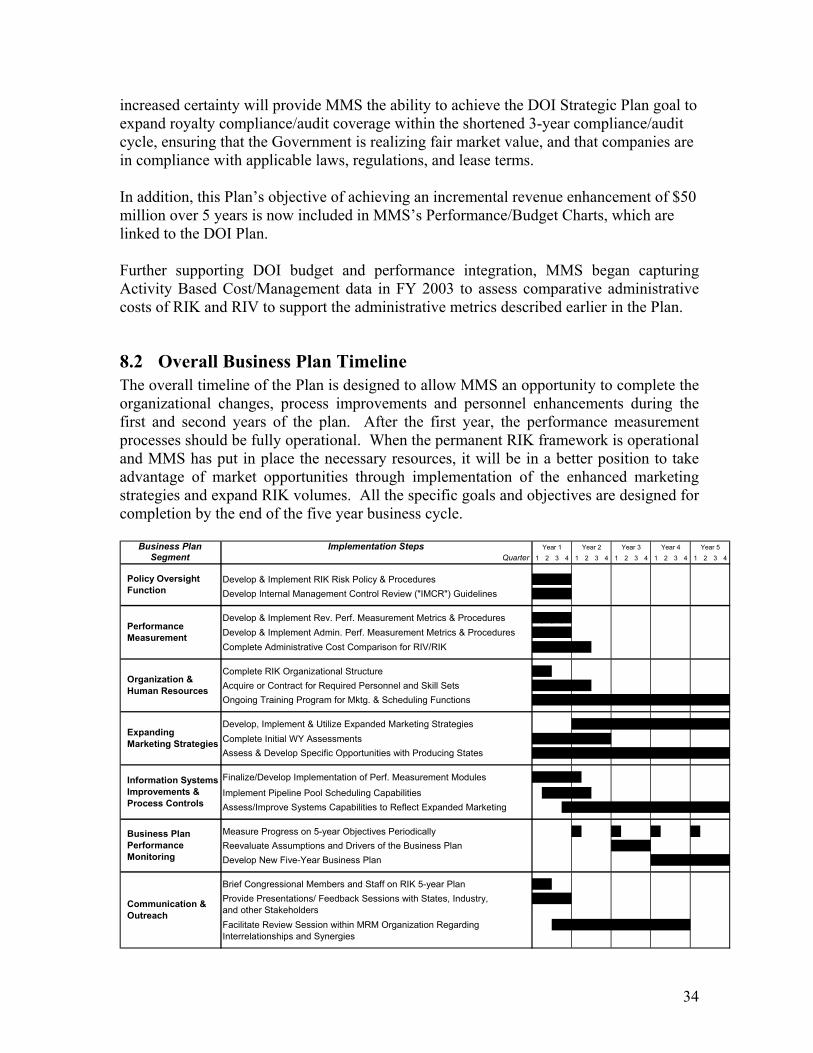
34
increased certainty will provide MMS the ability to achieve the DOI Strategic Plan goal to expand royalty compliance/audit coverage within the shortened 3-year compliance/audit cycle, ensuring that the Government is realizing fair market value, and that companies are in compliance with applicable laws, regulations, and lease terms. In addition, this Plan’s objective of achieving an incremental revenue enhancement of $50 million over 5 years is now included in MMS’s Performance/Budget Charts, which are linked to the DOI Plan. Further supporting DOI budget and performance integration, MMS began capturing Activity Based Cost/Management data in FY 2003 to assess comparative administrative costs of RIK and RIV to support the administrative metrics described earlier in the Plan.
8.2 Overall Business Plan Timeline The overall timeline of the Plan is designed to allow MMS an opportunity to complete the organizational changes, process improvements and personnel enhancements during the first and second years of the plan. After the first year, the performance measurement processes should be fully operational. When the permanent RIK framework is operational and MMS has put in place the necessary resources, it will be in a better position to take advantage of market opportunities through implementation of the enhanced marketing strategies and expand RIK volumes. All the specific goals and objectives are designed for completion by the end of the five year business cycle.
Business Plan Implementation StepsSegment Quarter 1 2 3 4 1 2 3 4 1 2 3 4 1 2 3 4 1 2 3 4
Develop & Implement RIK Risk Policy & ProceduresDevelop Internal Management Control Review ("IMCR") Guidelines
Develop & Implement Rev. Perf. Measurement Metrics & ProceduresDevelop & Implement Admin. Perf. Measurement Metrics & ProceduresComplete Administrative Cost Comparison for RIV/RIK
Complete RIK Organizational StructureAcquire or Contract for Required Personnel and Skill SetsOngoing Training Program for Mktg. & Scheduling Functions
Develop, Implement & Utilize Expanded Marketing StrategiesComplete Initial WY AssessmentsAssess & Develop Specific Opportunities with Producing States
Finalize/Develop Implementation of Perf. Measurement Modules
Implement Pipeline Pool Scheduling CapabilitiesAssess/Improve Systems Capabilities to Reflect Expanded Marketing
Measure Progress on 5-year Objectives PeriodicallyReevaluate Assumptions and Drivers of the Business PlanDevelop New Five-Year Business Plan
Brief Congressional Members and Staff on RIK 5-year PlanProvide Presentations/ Feedback Sessions with States, Industry,and other StakeholdersFacilitate Review Session within MRM Organization Regarding Interrelationships and Synergies
Information Systems Improvements & Process Controls
Business Plan Performance Monitoring
Organization & Human Resources
Expanding Marketing Strategies
Communication & Outreach
Year 5Year 1 Year 2 Year 3 Year 4
Performance Measurement
Policy Oversight Function

35
8.3 Components of the Business Plan – Focus Areas The major action items and timelines for the five year business plan are outlined below. Specific action items are grouped into seven major focus areas. Each focus area has specific action items with a timeline for completion and assignments of primary responsibility.
1. Policy Oversight Function 2. Performance Measurement 3. Organization & Human Resources 4. Expanding Marketing Strategies 5. Information Systems Improvements and Process Controls 6. Business Plan Performance Monitoring 7. Communication and Outreach
8.3.1 Policy Oversight Function A key element of the RIK control and process improvement initiative is development of a policy oversight function that will provide a clear separation of control outside of the RIK direct line management. This function, which was established in fiscal year 2004, can provide direction on key policy decisions and has responsibility for developing and maintaining RIK risk guidelines. The Policy Oversight Function will report to the Associate Director MRM and periodically get direction from the Executive Council. POLICY OVERSIGHT FUNCTIONAction Item Responsibility
Quarter 1 2 3 4 1 2 3 4 1 2 3 4 1 2 3 4 1 2 3 4
Define and Delineate Oversight Function AD-MRM
Develop & Implement RIK Risk Policy PAO
Develop & Implement RIK Risk Procedures PAO
Develop Internal Management Control Review Guidelines PAO
Re-examine Risk Policy & Procedures PAO
* PAO - Policy Assurance Officer
Year 5Year 1 Year 2 Year 3 Year 4

36
8.3.2 Performance Measurement It is recognized that a sustainable RIK program must be able to support asset management decisions and demonstrate quantifiable results for internal and external stakeholders. In fiscal year 2004, MMS initiated development of a revenue performance measurement program. In conjunction with the Policy Oversight Function, the RIK management team will complete and fully implement this effort during the first year of the plan. Development and implementation of the administrative metrics is targeted for completion within the first year. The second year of the Plan will be the baseline year for administrative costs, against which subsequent year administrative costs will be compared. Administrative cost comparisons between RIK and RIV will be developed during the first two years of the Plan. PERFORMANCE MEASUREMENTAction Item Responsibility
Quarter 1 2 3 4 1 2 3 4 1 2 3 4 1 2 3 4 1 2 3 4
Develop Revenue Performance Metrics PAO, RIK Mgr.
Implement Revenue Performance Measurement Procedures RIK Manager
Develop Administrative Performance Metrics PAO, RIK Mgr.
Implement Admin. Performance Measurement Procedures RIK Manager
Complete Administrative Cost Comparison for RIV/RIK AD-MRM
* PAO - Policy Assurance Officer
Year 5Year 1 Year 2 Year 3 Year 4
8.3.3 Organization and Human Resources To meet the objectives of the Plan, enhancements to the organizational and human resource capabilities will be necessary. These include organizational structure improvements and expanding capabilities to the human resource base that will bring specific commercial expertise and experience to the RIK program. The Plan calls for completion of the organizational structure changes within the first 6 months. Specific skill sets and expertise will be acquired or developed in-house over an 18 month window. The extended timeframe allows flexibility in identifying individuals that will provide the specialized expertise required to execute the expanded marketing strategies. ORGANIZATION & HUMAN RESOURCESAction Item Responsibility
Quarter 1 2 3 4 1 2 3 4 1 2 3 4 1 2 3 4 1 2 3 4
ORGANIZATIONDevelop Proposed RIK Organization Chart AD-MRM
Obtain Approval on Proposed Organization Chart AD-MRM
Develop New H.R. Staffing Plan RIK Manager
Develop Crosswalk to Existing Organization RIK Manager
H.R. STAFFINGContract to Assess/Recommend Staffing Strategy AD-MRM, AD-A&B
Develop/Approve Personnel Staffing Strategy AD-MRM, AD-A&B
Acquire/Develop Experienced Commercial Marketers RIK Manager
Acquire/Develop Commercial Contracting & Scheduling Personnel RIK Manager
Staff Economic Analysis Group RIK Manager
Evaluate Contracting Outside Quantitative Services RIK Manager
Consult with Solicitor's Office to Retain Commercial Legal Svcs AD-A&B
Run Ongoing Training Program for Mktg. & Scheduling Functions RIK Manager
Year 1 Year 2 Year 3 Year 4 Year 5
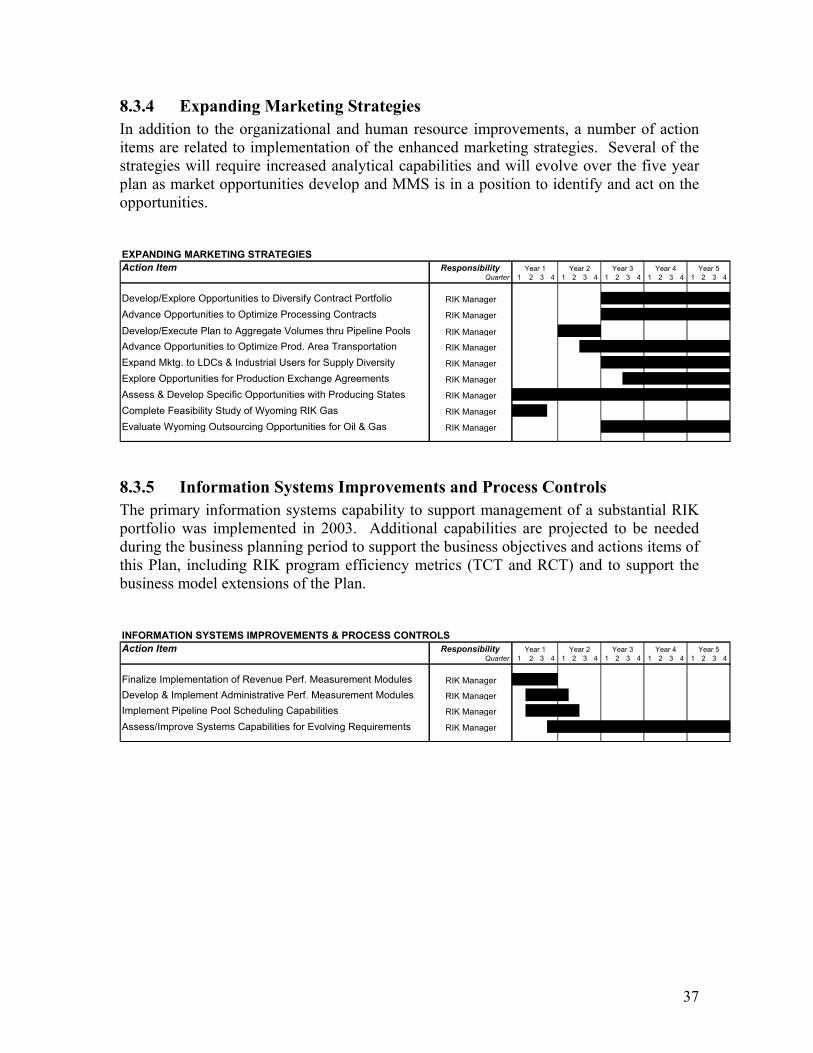
37
8.3.4 Expanding Marketing Strategies In addition to the organizational and human resource improvements, a number of action items are related to implementation of the enhanced marketing strategies. Several of the strategies will require increased analytical capabilities and will evolve over the five year plan as market opportunities develop and MMS is in a position to identify and act on the opportunities. EXPANDING MARKETING STRATEGIESAction Item Responsibility
Quarter 1 2 3 4 1 2 3 4 1 2 3 4 1 2 3 4 1 2 3 4
Develop/Explore Opportunities to Diversify Contract Portfolio RIK Manager
Advance Opportunities to Optimize Processing Contracts RIK Manager
Develop/Execute Plan to Aggregate Volumes thru Pipeline Pools RIK Manager
Advance Opportunities to Optimize Prod. Area Transportation RIK Manager
Expand Mktg. to LDCs & Industrial Users for Supply Diversity RIK Manager
Explore Opportunities for Production Exchange Agreements RIK Manager
Assess & Develop Specific Opportunities with Producing States RIK Manager
Complete Feasibility Study of Wyoming RIK Gas RIK Manager
Evaluate Wyoming Outsourcing Opportunities for Oil & Gas RIK Manager
Year 5Year 1 Year 2 Year 3 Year 4
8.3.5 Information Systems Improvements and Process Controls The primary information systems capability to support management of a substantial RIK portfolio was implemented in 2003. Additional capabilities are projected to be needed during the business planning period to support the business objectives and actions items of this Plan, including RIK program efficiency metrics (TCT and RCT) and to support the business model extensions of the Plan. INFORMATION SYSTEMS IMPROVEMENTS & PROCESS CONTROLSAction Item Responsibility
Quarter 1 2 3 4 1 2 3 4 1 2 3 4 1 2 3 4 1 2 3 4
Finalize Implementation of Revenue Perf. Measurement Modules RIK Manager
Develop & Implement Administrative Perf. Measurement Modules RIK Manager
Implement Pipeline Pool Scheduling Capabilities RIK Manager
Assess/Improve Systems Capabilities for Evolving Requirements RIK Manager
Year 5Year 1 Year 2 Year 3 Year 4
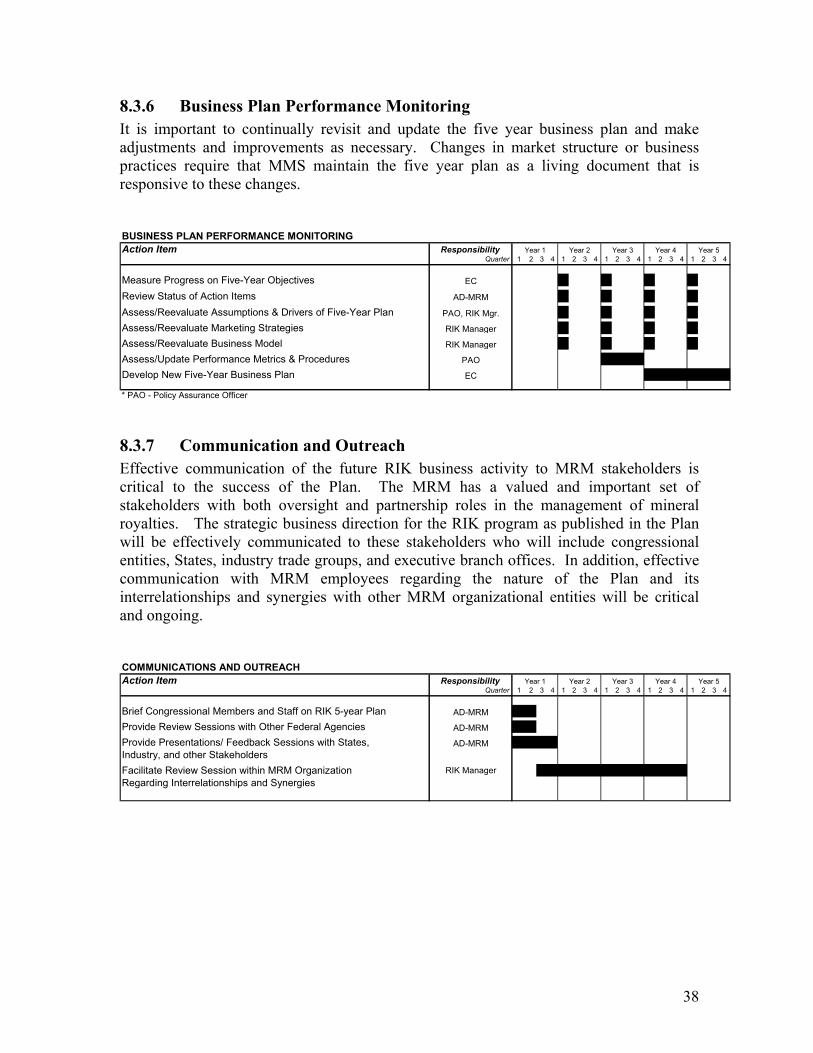
38
8.3.6 Business Plan Performance Monitoring It is important to continually revisit and update the five year business plan and make adjustments and improvements as necessary. Changes in market structure or business practices require that MMS maintain the five year plan as a living document that is responsive to these changes. BUSINESS PLAN PERFORMANCE MONITORINGAction Item Responsibility
Quarter 1 2 3 4 1 2 3 4 1 2 3 4 1 2 3 4 1 2 3 4
Measure Progress on Five-Year Objectives EC
Review Status of Action Items AD-MRM
Assess/Reevaluate Assumptions & Drivers of Five-Year Plan PAO, RIK Mgr.
Assess/Reevaluate Marketing Strategies RIK Manager
Assess/Reevaluate Business Model RIK Manager
Assess/Update Performance Metrics & Procedures PAO
Develop New Five-Year Business Plan EC
* PAO - Policy Assurance Officer
Year 1 Year 2 Year 3 Year 4 Year 5
8.3.7 Communication and Outreach Effective communication of the future RIK business activity to MRM stakeholders is critical to the success of the Plan. The MRM has a valued and important set of stakeholders with both oversight and partnership roles in the management of mineral royalties. The strategic business direction for the RIK program as published in the Plan will be effectively communicated to these stakeholders who will include congressional entities, States, industry trade groups, and executive branch offices. In addition, effective communication with MRM employees regarding the nature of the Plan and its interrelationships and synergies with other MRM organizational entities will be critical and ongoing. COMMUNICATIONS AND OUTREACHAction Item Responsibility
Quarter 1 2 3 4 1 2 3 4 1 2 3 4 1 2 3 4 1 2 3 4
Brief Congressional Members and Staff on RIK 5-year Plan AD-MRM
Provide Review Sessions with Other Federal Agencies AD-MRM
Provide Presentations/ Feedback Sessions with States, AD-MRMIndustry, and other StakeholdersFacilitate Review Session within MRM Organization RIK ManagerRegarding Interrelationships and Synergies
Year 5Year 1 Year 2 Year 3 Year 4
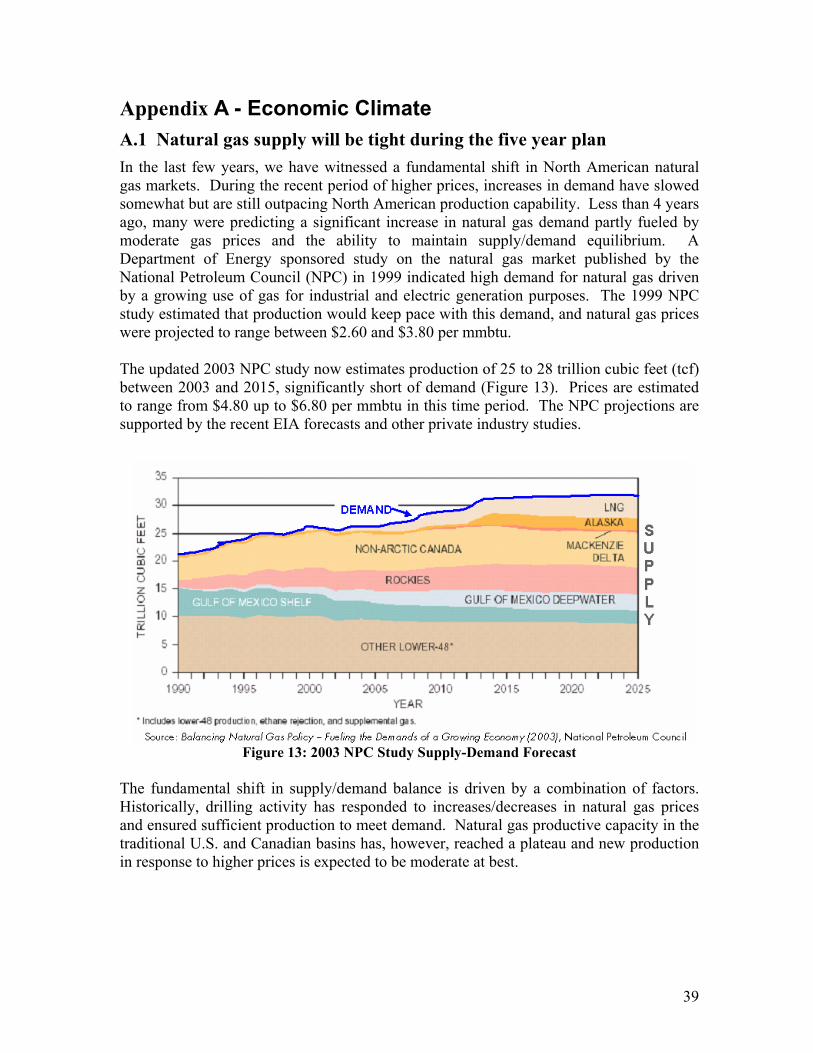
39
Appendix A - Economic Climate A.1 Natural gas supply will be tight during the five year plan In the last few years, we have witnessed a fundamental shift in North American natural gas markets. During the recent period of higher prices, increases in demand have slowed somewhat but are still outpacing North American production capability. Less than 4 years ago, many were predicting a significant increase in natural gas demand partly fueled by moderate gas prices and the ability to maintain supply/demand equilibrium. A Department of Energy sponsored study on the natural gas market published by the National Petroleum Council (NPC) in 1999 indicated high demand for natural gas driven by a growing use of gas for industrial and electric generation purposes. The 1999 NPC study estimated that production would keep pace with this demand, and natural gas prices were projected to range between $2.60 and $3.80 per mmbtu. The updated 2003 NPC study now estimates production of 25 to 28 trillion cubic feet (tcf) between 2003 and 2015, significantly short of demand (Figure 13). Prices are estimated to range from $4.80 up to $6.80 per mmbtu in this time period. The NPC projections are supported by the recent EIA forecasts and other private industry studies.
Figure 13: 2003 NPC Study Supply-Demand Forecast The fundamental shift in supply/demand balance is driven by a combination of factors. Historically, drilling activity has responded to increases/decreases in natural gas prices and ensured sufficient production to meet demand. Natural gas productive capacity in the traditional U.S. and Canadian basins has, however, reached a plateau and new production in response to higher prices is expected to be moderate at best.
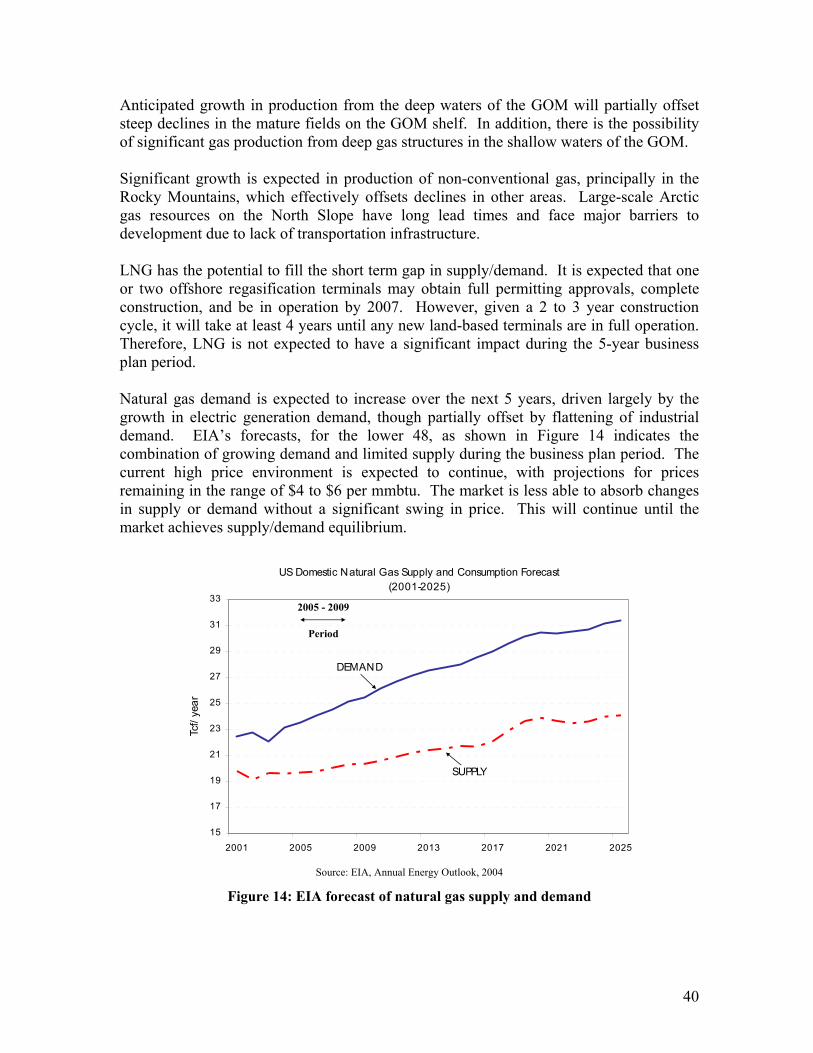
40
Anticipated growth in production from the deep waters of the GOM will partially offset steep declines in the mature fields on the GOM shelf. In addition, there is the possibility of significant gas production from deep gas structures in the shallow waters of the GOM. Significant growth is expected in production of non-conventional gas, principally in the Rocky Mountains, which effectively offsets declines in other areas. Large-scale Arctic gas resources on the North Slope have long lead times and face major barriers to development due to lack of transportation infrastructure. LNG has the potential to fill the short term gap in supply/demand. It is expected that one or two offshore regasification terminals may obtain full permitting approvals, complete construction, and be in operation by 2007. However, given a 2 to 3 year construction cycle, it will take at least 4 years until any new land-based terminals are in full operation. Therefore, LNG is not expected to have a significant impact during the 5-year business plan period. Natural gas demand is expected to increase over the next 5 years, driven largely by the growth in electric generation demand, though partially offset by flattening of industrial demand. EIA’s forecasts, for the lower 48, as shown in Figure 14 indicates the combination of growing demand and limited supply during the business plan period. The current high price environment is expected to continue, with projections for prices remaining in the range of $4 to $6 per mmbtu. The market is less able to absorb changes in supply or demand without a significant swing in price. This will continue until the market achieves supply/demand equilibrium.
US Domestic Natural Gas Supply and Consumption Forecast (2001-2025)
15
17
19
21
23
25
27
29
31
33
2001 2005 2009 2013 2017 2021 2025
Tcf/
year
SUPPLY
DEMAND
2005 - 2009
Period
Source: EIA, Annual Energy Outlook, 2004
Figure 14: EIA forecast of natural gas supply and demand
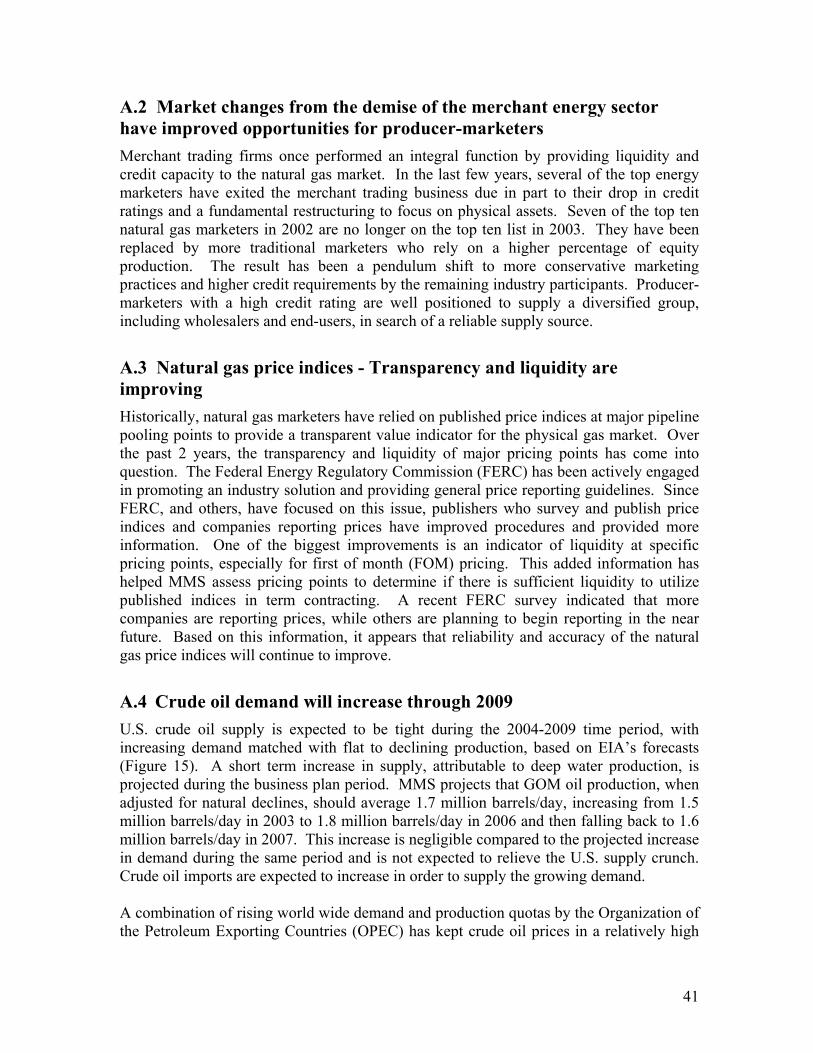
41
A.2 Market changes from the demise of the merchant energy sector have improved opportunities for producer-marketers Merchant trading firms once performed an integral function by providing liquidity and credit capacity to the natural gas market. In the last few years, several of the top energy marketers have exited the merchant trading business due in part to their drop in credit ratings and a fundamental restructuring to focus on physical assets. Seven of the top ten natural gas marketers in 2002 are no longer on the top ten list in 2003. They have been replaced by more traditional marketers who rely on a higher percentage of equity production. The result has been a pendulum shift to more conservative marketing practices and higher credit requirements by the remaining industry participants. Producer-marketers with a high credit rating are well positioned to supply a diversified group, including wholesalers and end-users, in search of a reliable supply source.
A.3 Natural gas price indices - Transparency and liquidity are improving Historically, natural gas marketers have relied on published price indices at major pipeline pooling points to provide a transparent value indicator for the physical gas market. Over the past 2 years, the transparency and liquidity of major pricing points has come into question. The Federal Energy Regulatory Commission (FERC) has been actively engaged in promoting an industry solution and providing general price reporting guidelines. Since FERC, and others, have focused on this issue, publishers who survey and publish price indices and companies reporting prices have improved procedures and provided more information. One of the biggest improvements is an indicator of liquidity at specific pricing points, especially for first of month (FOM) pricing. This added information has helped MMS assess pricing points to determine if there is sufficient liquidity to utilize published indices in term contracting. A recent FERC survey indicated that more companies are reporting prices, while others are planning to begin reporting in the near future. Based on this information, it appears that reliability and accuracy of the natural gas price indices will continue to improve.
A.4 Crude oil demand will increase through 2009 U.S. crude oil supply is expected to be tight during the 2004-2009 time period, with increasing demand matched with flat to declining production, based on EIA’s forecasts (Figure 15). A short term increase in supply, attributable to deep water production, is projected during the business plan period. MMS projects that GOM oil production, when adjusted for natural declines, should average 1.7 million barrels/day, increasing from 1.5 million barrels/day in 2003 to 1.8 million barrels/day in 2006 and then falling back to 1.6 million barrels/day in 2007. This increase is negligible compared to the projected increase in demand during the same period and is not expected to relieve the U.S. supply crunch. Crude oil imports are expected to increase in order to supply the growing demand. A combination of rising world wide demand and production quotas by the Organization of the Petroleum Exporting Countries (OPEC) has kept crude oil prices in a relatively high
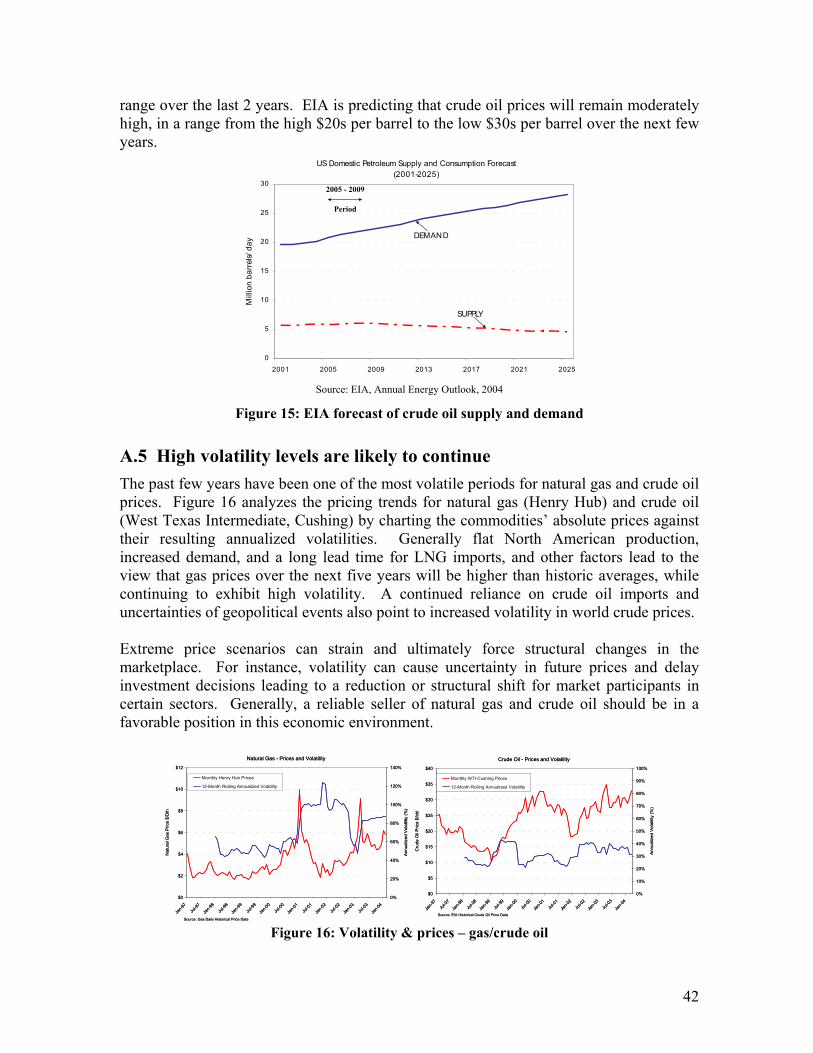
42
range over the last 2 years. EIA is predicting that crude oil prices will remain moderately high, in a range from the high $20s per barrel to the low $30s per barrel over the next few years.
US Domestic Petroleum Supply and Consumption Forecast (2001-2025)
0
5
10
15
20
25
30
2001 2005 2009 2013 2017 2021 2025
Mill
ion
barr
els/
day
SUPPLY
DEMAND
2005 - 2009
Period
Source: EIA, Annual Energy Outlook, 2004
Figure 15: EIA forecast of crude oil supply and demand
A.5 High volatility levels are likely to continue The past few years have been one of the most volatile periods for natural gas and crude oil prices. Figure 16 analyzes the pricing trends for natural gas (Henry Hub) and crude oil (West Texas Intermediate, Cushing) by charting the commodities’ absolute prices against their resulting annualized volatilities. Generally flat North American production, increased demand, and a long lead time for LNG imports, and other factors lead to the view that gas prices over the next five years will be higher than historic averages, while continuing to exhibit high volatility. A continued reliance on crude oil imports and uncertainties of geopolitical events also point to increased volatility in world crude prices. Extreme price scenarios can strain and ultimately force structural changes in the marketplace. For instance, volatility can cause uncertainty in future prices and delay investment decisions leading to a reduction or structural shift for market participants in certain sectors. Generally, a reliable seller of natural gas and crude oil should be in a favorable position in this economic environment.
Natural Gas - Prices and Volatility
$0
$2
$4
$6
$8
$10
$12
Jan-9
7Ju
l-97
Jan-9
8Ju
l-98
Jan-9
9Ju
l-99
Jan-0
0Ju
l-00
Jan-0
1Ju
l-01
Jan-0
2Ju
l-02
Jan-0
3Ju
l-03
Jan-0
4
Nat
ural
Gas
Pric
e $/
Dth
0%
20%
40%
60%
80%
100%
120%
140%
Annu
aliz
ed V
olat
ility
(%)
Monthly Henry Hub Prices
12-Month Rolling Annualized Volatility
Source: Gas Daily Historical Price Data
Crude Oil - Prices and Volatility
$0
$5
$10
$15
$20
$25
$30
$35
$40
Jan-9
7Ju
l-97
Jan-9
8Ju
l-98
Jan-9
9Ju
l-99
Jan-0
0Ju
l-00
Jan-0
1Ju
l-01
Jan-0
2Ju
l-02
Jan-0
3Ju
l-03
Jan-0
4
Cru
de O
il P
rice
$/bb
l
0%
10%
20%
30%
40%
50%
60%
70%
80%
90%
100%
Ann
ualiz
ed V
olat
ility
(%)
Monthly WTI-Cushing Prices
12-Month Rolling Annualized Volatility
Source: EIA Historical Crude Oil Price Data
Natural Gas - Prices and Volatility
$0
$2
$4
$6
$8
$10
$12
Jan-9
7Ju
l-97
Jan-9
8Ju
l-98
Jan-9
9Ju
l-99
Jan-0
0Ju
l-00
Jan-0
1Ju
l-01
Jan-0
2Ju
l-02
Jan-0
3Ju
l-03
Jan-0
4
Nat
ural
Gas
Pric
e $/
Dth
0%
20%
40%
60%
80%
100%
120%
140%
Annu
aliz
ed V
olat
ility
(%)
Monthly Henry Hub Prices
12-Month Rolling Annualized Volatility
Source: Gas Daily Historical Price Data
Crude Oil - Prices and Volatility
$0
$5
$10
$15
$20
$25
$30
$35
$40
Jan-9
7Ju
l-97
Jan-9
8Ju
l-98
Jan-9
9Ju
l-99
Jan-0
0Ju
l-00
Jan-0
1Ju
l-01
Jan-0
2Ju
l-02
Jan-0
3Ju
l-03
Jan-0
4
Cru
de O
il P
rice
$/bb
l
0%
10%
20%
30%
40%
50%
60%
70%
80%
90%
100%
Ann
ualiz
ed V
olat
ility
(%)
Monthly WTI-Cushing Prices
12-Month Rolling Annualized Volatility
Source: EIA Historical Crude Oil Price Data Figure 16: Volatility & prices – gas/crude oil
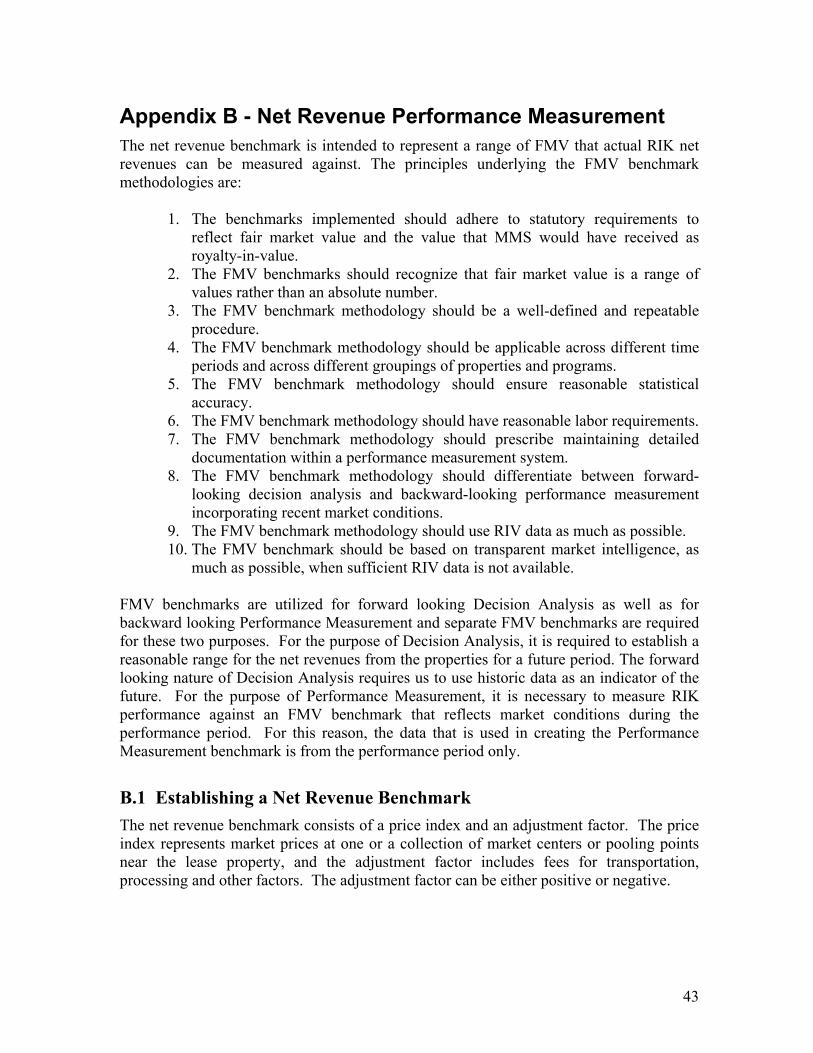
43
Appendix B - Net Revenue Performance Measurement The net revenue benchmark is intended to represent a range of FMV that actual RIK net revenues can be measured against. The principles underlying the FMV benchmark methodologies are:
1. The benchmarks implemented should adhere to statutory requirements to reflect fair market value and the value that MMS would have received as royalty-in-value.
2. The FMV benchmarks should recognize that fair market value is a range of values rather than an absolute number.
3. The FMV benchmark methodology should be a well-defined and repeatable procedure.
4. The FMV benchmark methodology should be applicable across different time periods and across different groupings of properties and programs.
5. The FMV benchmark methodology should ensure reasonable statistical accuracy.
6. The FMV benchmark methodology should have reasonable labor requirements. 7. The FMV benchmark methodology should prescribe maintaining detailed
documentation within a performance measurement system. 8. The FMV benchmark methodology should differentiate between forward-
looking decision analysis and backward-looking performance measurement incorporating recent market conditions.
9. The FMV benchmark methodology should use RIV data as much as possible. 10. The FMV benchmark should be based on transparent market intelligence, as
much as possible, when sufficient RIV data is not available. FMV benchmarks are utilized for forward looking Decision Analysis as well as for backward looking Performance Measurement and separate FMV benchmarks are required for these two purposes. For the purpose of Decision Analysis, it is required to establish a reasonable range for the net revenues from the properties for a future period. The forward looking nature of Decision Analysis requires us to use historic data as an indicator of the future. For the purpose of Performance Measurement, it is necessary to measure RIK performance against an FMV benchmark that reflects market conditions during the performance period. For this reason, the data that is used in creating the Performance Measurement benchmark is from the performance period only.
B.1 Establishing a Net Revenue Benchmark The net revenue benchmark consists of a price index and an adjustment factor. The price index represents market prices at one or a collection of market centers or pooling points near the lease property, and the adjustment factor includes fees for transportation, processing and other factors. The adjustment factor can be either positive or negative.
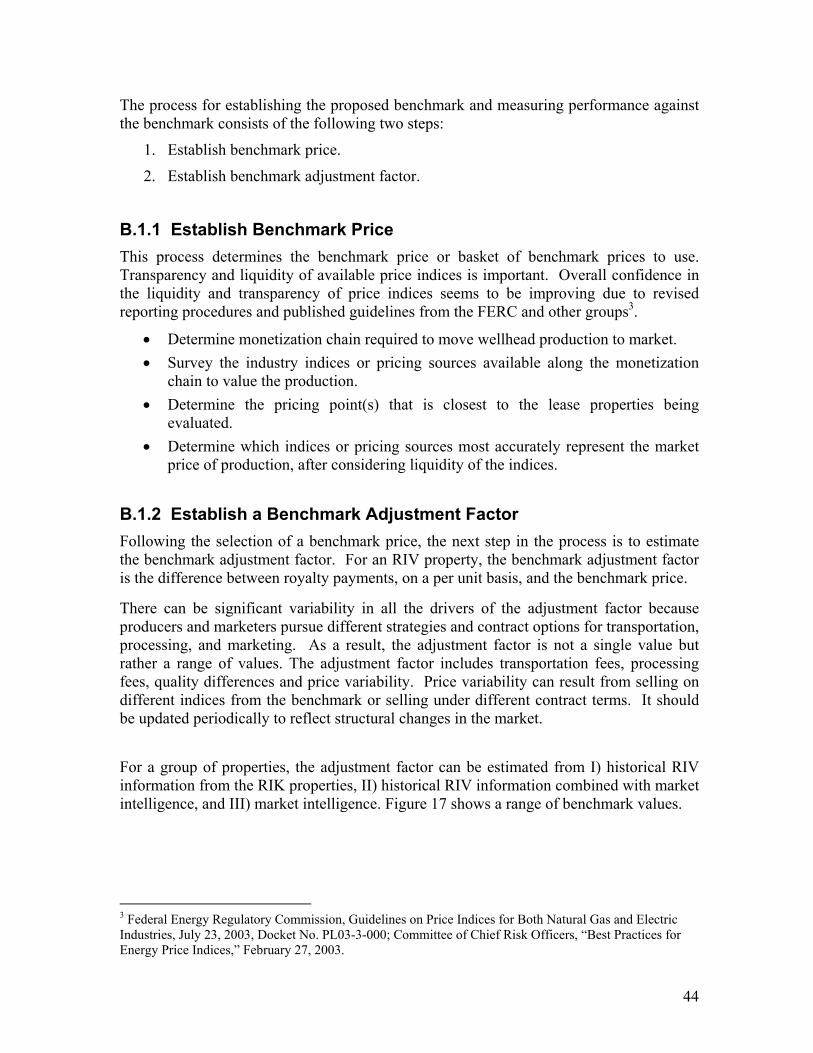
44
The process for establishing the proposed benchmark and measuring performance against the benchmark consists of the following two steps:
1. Establish benchmark price.
2. Establish benchmark adjustment factor.
B.1.1 Establish Benchmark Price This process determines the benchmark price or basket of benchmark prices to use. Transparency and liquidity of available price indices is important. Overall confidence in the liquidity and transparency of price indices seems to be improving due to revised reporting procedures and published guidelines from the FERC and other groups3.
• Determine monetization chain required to move wellhead production to market. • Survey the industry indices or pricing sources available along the monetization
chain to value the production. • Determine the pricing point(s) that is closest to the lease properties being
evaluated. • Determine which indices or pricing sources most accurately represent the market
price of production, after considering liquidity of the indices.
B.1.2 Establish a Benchmark Adjustment Factor Following the selection of a benchmark price, the next step in the process is to estimate the benchmark adjustment factor. For an RIV property, the benchmark adjustment factor is the difference between royalty payments, on a per unit basis, and the benchmark price.
There can be significant variability in all the drivers of the adjustment factor because producers and marketers pursue different strategies and contract options for transportation, processing, and marketing. As a result, the adjustment factor is not a single value but rather a range of values. The adjustment factor includes transportation fees, processing fees, quality differences and price variability. Price variability can result from selling on different indices from the benchmark or selling under different contract terms. It should be updated periodically to reflect structural changes in the market.
For a group of properties, the adjustment factor can be estimated from I) historical RIV information from the RIK properties, II) historical RIV information combined with market intelligence, and III) market intelligence. Figure 17 shows a range of benchmark values.
3 Federal Energy Regulatory Commission, Guidelines on Price Indices for Both Natural Gas and Electric Industries, July 23, 2003, Docket No. PL03-3-000; Committee of Chief Risk Officers, “Best Practices for Energy Price Indices,” February 27, 2003.
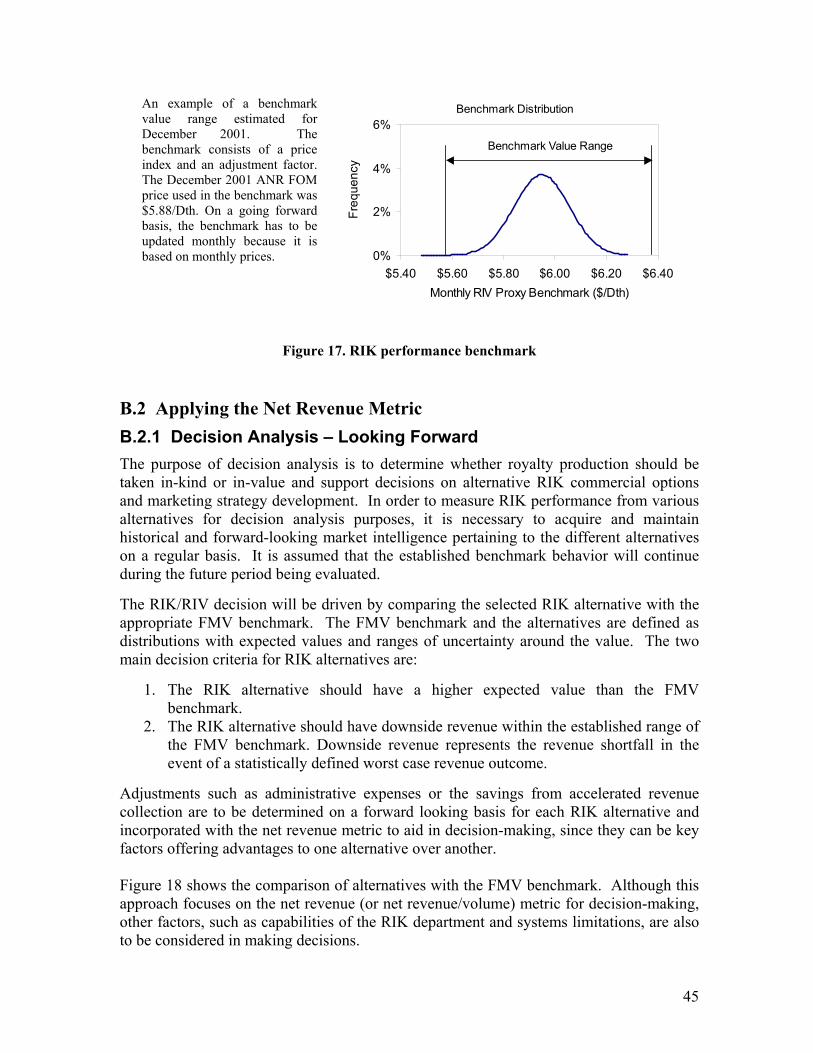
45
An example of a benchmark value range estimated for December 2001. The benchmark consists of a price index and an adjustment factor. The December 2001 ANR FOM price used in the benchmark was $5.88/Dth. On a going forward basis, the benchmark has to be updated monthly because it is based on monthly prices.
Figure 17. RIK performance benchmark
B.2 Applying the Net Revenue Metric B.2.1 Decision Analysis – Looking Forward The purpose of decision analysis is to determine whether royalty production should be taken in-kind or in-value and support decisions on alternative RIK commercial options and marketing strategy development. In order to measure RIK performance from various alternatives for decision analysis purposes, it is necessary to acquire and maintain historical and forward-looking market intelligence pertaining to the different alternatives on a regular basis. It is assumed that the established benchmark behavior will continue during the future period being evaluated.
The RIK/RIV decision will be driven by comparing the selected RIK alternative with the appropriate FMV benchmark. The FMV benchmark and the alternatives are defined as distributions with expected values and ranges of uncertainty around the value. The two main decision criteria for RIK alternatives are:
1. The RIK alternative should have a higher expected value than the FMV benchmark.
2. The RIK alternative should have downside revenue within the established range of the FMV benchmark. Downside revenue represents the revenue shortfall in the event of a statistically defined worst case revenue outcome.
Adjustments such as administrative expenses or the savings from accelerated revenue collection are to be determined on a forward looking basis for each RIK alternative and incorporated with the net revenue metric to aid in decision-making, since they can be key factors offering advantages to one alternative over another. Figure 18 shows the comparison of alternatives with the FMV benchmark. Although this approach focuses on the net revenue (or net revenue/volume) metric for decision-making, other factors, such as capabilities of the RIK department and systems limitations, are also to be considered in making decisions.
Benchmark Distribution
0%
2%
4%
6%
$5.40 $5.60 $5.80 $6.00 $6.20 $6.40Monthly RIV Proxy Benchmark ($/Dth)
Freq
uenc
y
Benchmark Value Range

46
FMV Benchmark and RIK Alternatives - Net Revenue Distribution
0
5
10
15
20
25
30
$0.00 $0.03 $0.06 $0.09 $0.12 $0.15 $0.18 $0.21 $0.24 $0.27
Per Unit Revenue Less Index
Freq
uenc
y
FMV Benchmark
RIK Alternative #1
RIK Alternative #2
RIK Alternative #3
Figure 18. FMV benchmark and RIK alternatives
B.2.2 Measuring RIK Performance – Looking Backward The performance of the RIK program can be measured relative to the FMV benchmark at appropriate measurement levels, time horizons and frequencies. Actual RIK performance is measured using a framework similar to that of the benchmark. Net revenue from the RIK program is calculated as revenue from selling the royalty share of production at the realized market price plus/minus adjustments to achieve the realized market price of the commodity. Adjustments for gas include the cost of transportation, processing, and administration. For oil, they include adjustments for transportation, quality, and administration. Adjustments also include savings such as those from accelerated revenue collection. In order to normalize the comparison for different volumes, the net revenue per unit of production is measured. The net revenue thus calculated is compared against the benchmark to assess the performance of the RIK program.
To assess performance during a year, it is essential that the measurements can at least be conducted on a monthly or quarterly basis. The performance measurement process should provide the flexibility to measure performance on an RIK program level, a commodity level, a geographic level, and a property level.
Figure 19 is an example of measuring the performance of an RIK property relative to an FMV benchmark.
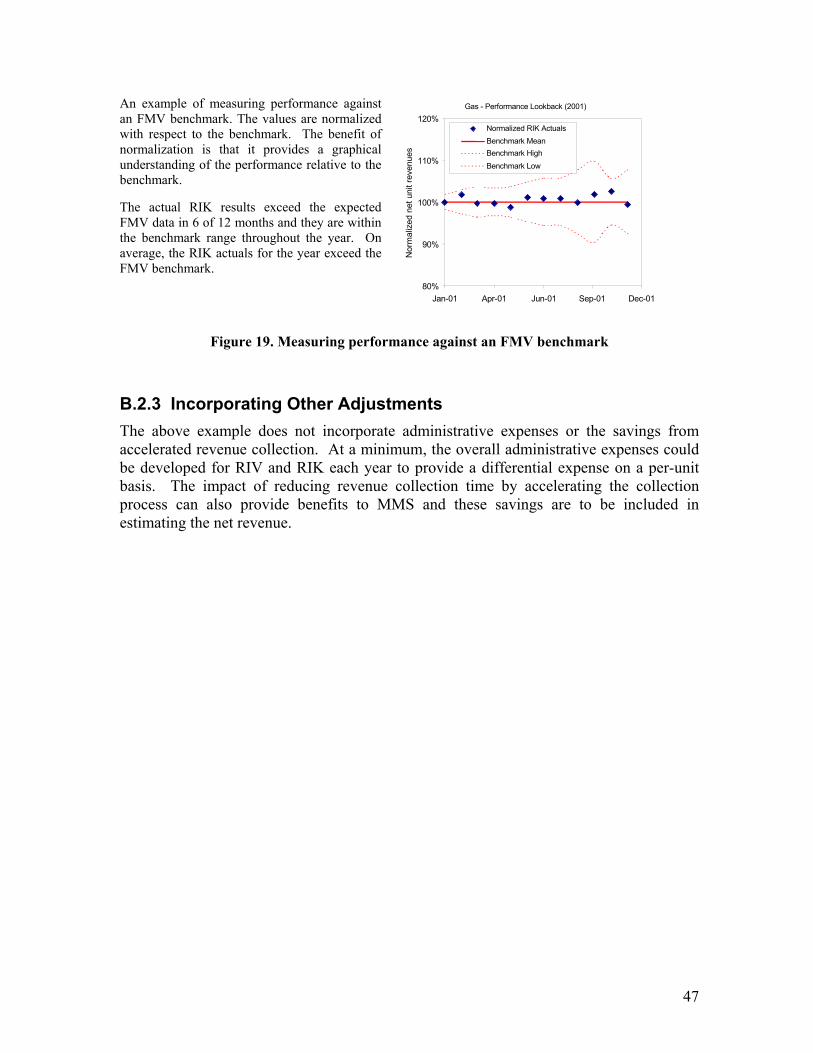
47
An example of measuring performance against an FMV benchmark. The values are normalized with respect to the benchmark. The benefit of normalization is that it provides a graphical understanding of the performance relative to the benchmark.
The actual RIK results exceed the expected FMV data in 6 of 12 months and they are within the benchmark range throughout the year. On average, the RIK actuals for the year exceed the FMV benchmark.
Gas - Performance Lookback (2001)
80%
90%
100%
110%
120%
Jan-01 Apr-01 Jun-01 Sep-01 Dec-01
Nor
mal
ized
net
uni
t rev
enue
s
Normalized RIK ActualsBenchmark MeanBenchmark HighBenchmark Low
Gas - Performance Lookback (2001)
80%
90%
100%
110%
120%
Jan-01 Apr-01 Jun-01 Sep-01 Dec-01
Nor
mal
ized
net
uni
t rev
enue
s
Normalized RIK ActualsBenchmark MeanBenchmark HighBenchmark Low
Figure 19. Measuring performance against an FMV benchmark
B.2.3 Incorporating Other Adjustments The above example does not incorporate administrative expenses or the savings from accelerated revenue collection. At a minimum, the overall administrative expenses could be developed for RIV and RIK each year to provide a differential expense on a per-unit basis. The impact of reducing revenue collection time by accelerating the collection process can also provide benefits to MMS and these savings are to be included in estimating the net revenue.
48
Appendix C - Glossary of Terms Back office – The back office performs functions in support of the front office and mid office and includes administrative and support personnel who maintain all written confirmation and settlement of transactions and record keeping. Bbls – Barrels of crude oil (42 U.S. gallons per barrel); the standard unit of measurement used for crude oil. Bcf – billion cubic feet, a unit of measurement for natural gas. Credit exposure – A measure of the risk that a seller faces due to time lag between delivery of goods or services to a buyer and receiving payment for the same. The seller is exposed to the risk of payment default by the buyer during this period. Derivatives – An instrument that derives its value from the value of other financial instruments. Downside revenue – A statistical worst case net revenue determined by using a defined confidence interval. For example, a 95% confidence interval would imply that there is only a 5% chance that actual net revenue could fall below downside net revenue. Expected revenue – The average net revenue from a range of possible net revenue values FERC – Federal Energy Regulatory Commission. The FERC is an independent agency that regulates the interstate transmission of natural gas, oil, and electricity in the U.S. FERC also regulates natural gas and hydropower projects. FMV – Fair Market Value FOM – First-of-month. A weighted index of natural gas prices at specific locations, established during the bid-week, for the following month. Front office – The front office is comprised of marketing and other personnel who can develop commercial transactions on behalf of the trading arm of an organization. Futures – An exchange traded contract. It is an agreement to purchase an asset at an agreed price on a specified future date, usually settled through cash payments rather than physical delivery. Gas Daily – A publication by Platts that offers detailed coverage of natural gas prices at interstate and intrastate pipeline and pooling points in major U.S. markets in addition to news and developments related to the natural gas industry. GLO – Texas General Land Office
49
GOM – Gulf of Mexico LDCs – Local distribution companies. Refers to companies involved in movement of natural gas within local grids supporting retail energy users LNG – Liquefied natural gas Mid office - The mid office is responsible for risk control and analysis. The mid office provides analysis and oversight for the activities of the front office MLA – Mineral Leasing Act. Under the Mineral Leasing Act of 1920, the Bureau of Land Management grants leases for development of deposits of oil, gas, coal, phosphate, potash, sodium, sulphur and other leasable minerals on public domain lands and on lands having federal reserved minerals. Mmbtu - One million British thermal units, the standard unit of measurement used to characterize the combined volume and energy content of natural gas MMS – Minerals Management Service MRM – Minerals Revenue Management, a program within MMS Net revenue – Total revenue less costs to achieve Net revenue-at-risk – Difference between the expected net revenue and a statistical worst-case net revenue called the downside net revenue. OCSLA – Outer Continental Shelf Lands Act. The Act, created on August 7, 1953 and amended several times, provides guidelines for implementing an OCS oil and gas exploration and development program. Optionality – Value from having multiple alternatives each of which yield outcomes that are not completely correlated to outcomes from other alternatives. For example, if production from a certain lease can be sold at two different markets, then if these two markets do not have identical prices, the production owner will obtain additional value from being able to choose the higher priced market each month. Origination – Activities associated with identifying sources of energy production, transportation, processing and the types/economics of transactions to optimize energy commodity value. Price index – A weighted average price calculated using a statistically valid sample of all transactions. For example, Gas Daily’s FOM price is an index price calculated using a survey to determine prices for individual transactions and aggregating these individual prices using volume weighting.
50
Price liquidity – An indication of the efficiency of a market. A sufficiently liquid market has several buyers and sellers and prices that are determined through the economics of supply and demand. Price volatility – A measure of the fluctuation of the price of a commodity. A highly volatile commodity has frequent and large swings in prices. Pricing point – Selected locations where the number of trades is sufficient enough for transparent price information to be readily available. Price gathering services publish prices at these locations. Processing – Extracting natural gas liquids from wet gas. RCT – Revenue collection time. It is a measure of the number of days after the production month that MMS takes to collect outstanding receivables for the production month. Revenue Netback – The process or end result of adjusting sales price or revenue for transportation, processing, quality, or other factors to arrive at a net price or revenue at the source of energy production. RIK/RIV Decision – The management decision as to whether certain royalties should be taken in kind or in value. Scheduling – All activities associated with arranging for transportation of energy commodities on pipelines. Spot market or cash market – Daily trading market SPR – Strategic Petroleum Reserve. The Strategic Petroleum Reserve is the United States' emergency oil stockpile, and it is the largest emergency petroleum supply in the world. TCT – Transaction cycle time. It measures the time it takes for completing the entire RIK transaction process. Volume imbalances – Differences between volumes initially allocated to or nominated by a mineral lease interest owner and the actual volumes entitled to by the interest owner. Also refers to differences between pipeline scheduled volumes and actual flow volumes. WTI – West Texas Intermediate. A high quality crude oil indigenous to the U.S. Southwest which is considered an informal benchmark for crude oil sold into the U.S. Gulf Coast.
Recommended