NISTEP REPORT No.159
Science Map 22001100&&22001122
Study on Hot Research Area (2005 – 2010 and 2007- 2012) By Bibliometric Method
July 2014
Research Unit for Science and Technology Analysis and Indicators National Institute of Science and Technology Policy (NISTEP)
Ayaka SAKA and Masatsura IGAMI

This highlight is English Translation of the following report
Science Map 2010&2012 –Study on Hot Research Area (2005 ‐ 2010 and 2007 ‐
2012) By Bibliometric Method –
Ayaka SAKA and Masatsura IGAMI, National Institute of Science and Technology
Policy (NISTEP REPORT No. 159), July 2014
1
TABLE OF CONTENTS
TABLE OF CONTENTS ...................................................................................................................................... 1
1. OVERVIEW OF NISTEP’S SCIENCE MAP .................................................................................................... 2
2. OVERVIEW OF CURRENT SCIENCE AND THE STATUS OF JAPAN ................................................................. 4
(1) THE STATUS OF SCIENTIFIC RESEARCH OBSERVED IN SCIENCE MAP 2012 ..................................... 4
(2) INCREASING UBIQUITY OF INTER‐/MULTI‐DISCIPLINARY RESEARCH .............................................. 8
(3) INTERNATIONAL COLLABORATION IS GETTING A COMMON MODE OF CREATION OF
HIGH IMPACT KNOWLEDGE EVEN IN LIFE SCIENCES ........................................................................... 10
(4) JAPAN’S FALLING SHARE AND DIVERSITY IN THE SCIENCE MAP .................................................. 12
3. CATEGORIZATION OF RESEARCH AREAS BY USING THE SCI‐GEO CHART AND
UNDERSTANDING CURRENT ACTIVITIES OF JAPAN ...................................................................................... 14
(1) CURRENT SITUATION OF JAPANESE S&T POLICY AND REASON WHY WE CREATED
THE SCI‐GEO CHART .......................................................................................................................... 14
(2) CATEGORIZATION OF RESEARCH AREAS BY USING THE SCI‐GEO CHART .................................... 14
(3) TRENDS IN RESEARCH ACTIVITIES IN THE WORLD AND BENCHMARKING
COUNTRIES AS SEEN WITH THE SCI‐GEO CHART ............................................................................... 16
(4) TRANSITION OF SCI‐GEO TYPES OVER TIME ................................................................................. 18
(5) ANALYZING CHARACTERISTICS OF FUNDING BY USING THE SCI‐GEO CHART ............................ 20
4. X‐RAY IMAGES OF RESEARCH ACTIVITIES AT THE INSTITUTIONAL LEVEL ON SCIENCE
MAP 2012 ..................................................................................................................................................... 22
5. FUTURE WORKS ........................................................................................................................................ 25
SELECTED REFERENCES ................................................................................................................................ 27
2
1. OVERVIEW OF NISTEP’S SCIENCE MAP
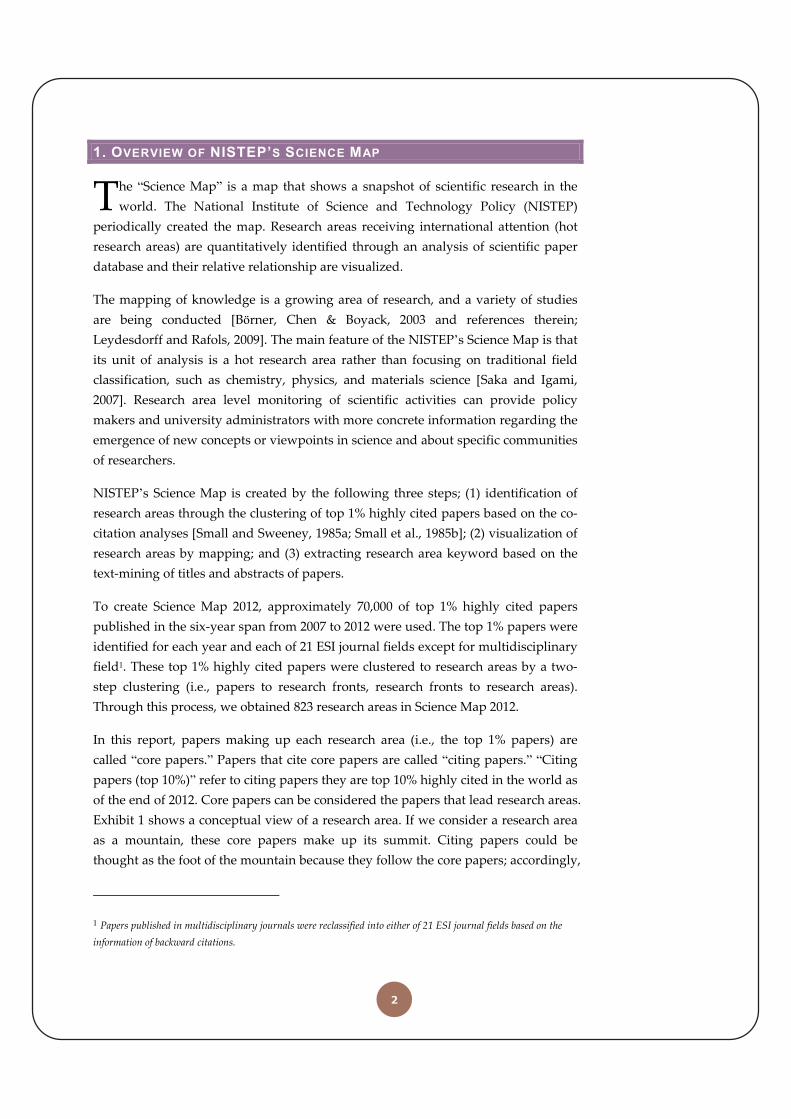
he “Science Map” is a map that shows a snapshot of scientific research in the
world. The National Institute of Science and Technology Policy (NISTEP)
periodically created the map. Research areas receiving international attention (hot
research areas) are quantitatively identified through an analysis of scientific paper
database and their relative relationship are visualized.
The mapping of knowledge is a growing area of research, and a variety of studies
are being conducted [Börner, Chen & Boyack, 2003 and references therein;
Leydesdorff and Rafols, 2009]. The main feature of the NISTEP’s Science Map is that
its unit of analysis is a hot research area rather than focusing on traditional field
classification, such as chemistry, physics, and materials science [Saka and Igami,
2007]. Research area level monitoring of scientific activities can provide policy
makers and university administrators with more concrete information regarding the
emergence of new concepts or viewpoints in science and about specific communities
of researchers.
NISTEP’s Science Map is created by the following three steps; (1) identification of
research areas through the clustering of top 1% highly cited papers based on the co‐
citation analyses [Small and Sweeney, 1985a; Small et al., 1985b]; (2) visualization of
research areas by mapping; and (3) extracting research area keyword based on the
text‐mining of titles and abstracts of papers.
To create Science Map 2012, approximately 70,000 of top 1% highly cited papers
published in the six‐year span from 2007 to 2012 were used. The top 1% papers were
identified for each year and each of 21 ESI journal fields except for multidisciplinary
field1. These top 1% highly cited papers were clustered to research areas by a two‐
step clustering (i.e., papers to research fronts, research fronts to research areas).
Through this process, we obtained 823 research areas in Science Map 2012.
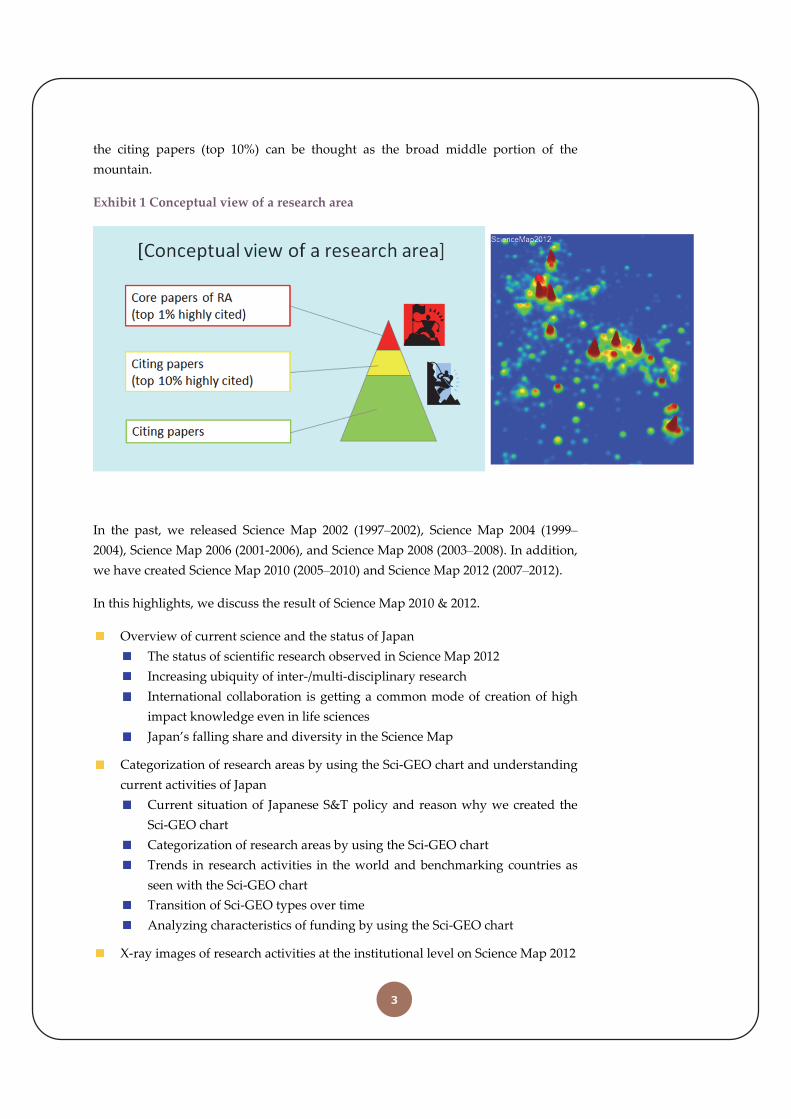
In this report, papers making up each research area (i.e., the top 1% papers) are
called “core papers.” Papers that cite core papers are called “citing papers.” “Citing
papers (top 10%)” refer to citing papers they are top 10% highly cited in the world as
of the end of 2012. Core papers can be considered the papers that lead research areas.
Exhibit 1 shows a conceptual view of a research area. If we consider a research area
as a mountain, these core papers make up its summit. Citing papers could be
thought as the foot of the mountain because they follow the core papers; accordingly,
1 Papers published in multidisciplinary journals were reclassified into either of 21 ESI journal fields based on the
information of backward citations.
T
3
the citing papers (top 10%) can be thought as the broad middle portion of the
mountain.
Exhibit 1 Conceptual view of a research area
In the past, we released Science Map 2002 (1997–2002), Science Map 2004 (1999–
2004), Science Map 2006 (2001‐2006), and Science Map 2008 (2003–2008). In addition,
we have created Science Map 2010 (2005–2010) and Science Map 2012 (2007–2012).
In this highlights, we discuss the result of Science Map 2010 & 2012.
Overview of current science and the status of Japan
The status of scientific research observed in Science Map 2012
Increasing ubiquity of inter‐/multi‐disciplinary research
International collaboration is getting a common mode of creation of high
impact knowledge even in life sciences
Japan’s falling share and diversity in the Science Map
Categorization of research areas by using the Sci‐GEO chart and understanding
current activities of Japan
Current situation of Japanese S&T policy and reason why we created the
Sci‐GEO chart
Categorization of research areas by using the Sci‐GEO chart
Trends in research activities in the world and benchmarking countries as
seen with the Sci‐GEO chart
Transition of Sci‐GEO types over time
Analyzing characteristics of funding by using the Sci‐GEO chart
X‐ray images of research activities at the institutional level on Science Map 2012
4
2. OVERVIEW OF CURRENT SCIENCE AND THE STATUS OF JAPAN
(1) THE STATUS OF SCIENTIFIC RESEARCH OBSERVED IN SCIENCE MAP 2012
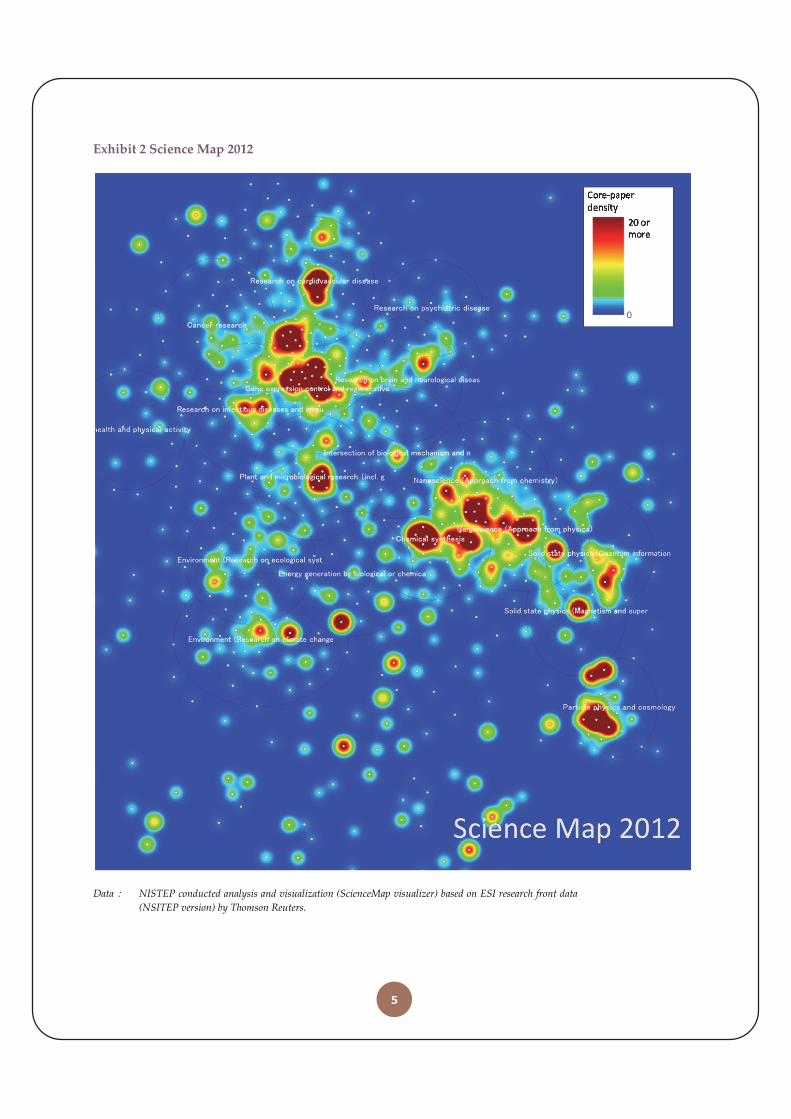
n Science Map 2012 (2007–2012), 823 research areas receiving international
attention (hot research areas) were identified; Exhibit 2 shows Science Map 2012.
The Science Map provides a bird’s eye view of the “mountains of scientific research”
formed by core papers accumulated.
SCIENTIFIC RESEARCH CONTINUES TO EXPAND
823 research areas are identified as hot research areas in Science Map 2012. The
number of research areas shows about 40% increase compared to that in Science
Map 2002 (598 research areas), representing active knowledge creation, an increase
in the number of papers being published, around the world.
TREND OF SCIENTIFIC RESEARCHES
For Science Map 2012, we identified keywords that represent the characteristics of
each of the 823 research areas based on the text‐mining of titles and abstracts of
papers. To make it easier to grasp the outline of Science Map, we developed a
methodology to aggregate research areas sharing common keywords (research area
groups) and depicted those groups on the map.
(Note 1) Since the map is created by a force‐directed placement method, relative location of research areas is
important, there is an arbitrariness in the direction of X and Y axes. In this report, we present maps in
which life sciences are located in the upper left, while particle physics and cosmology are located in the
bottom right.
(Note 2) White circles indicate the centers of research areas. Research areas had a weak linkage with other research
areas were positioned away from the center of the map; therefore they are not depicted in the map. Red
dotted lines show the groups of research areas. They are guides for general understanding of research
content. A research area included in a group is determined by whether the research area shares common
keywords with other research areas on the map. Thus, it is not implied that research areas that are outside
the groups are not important.
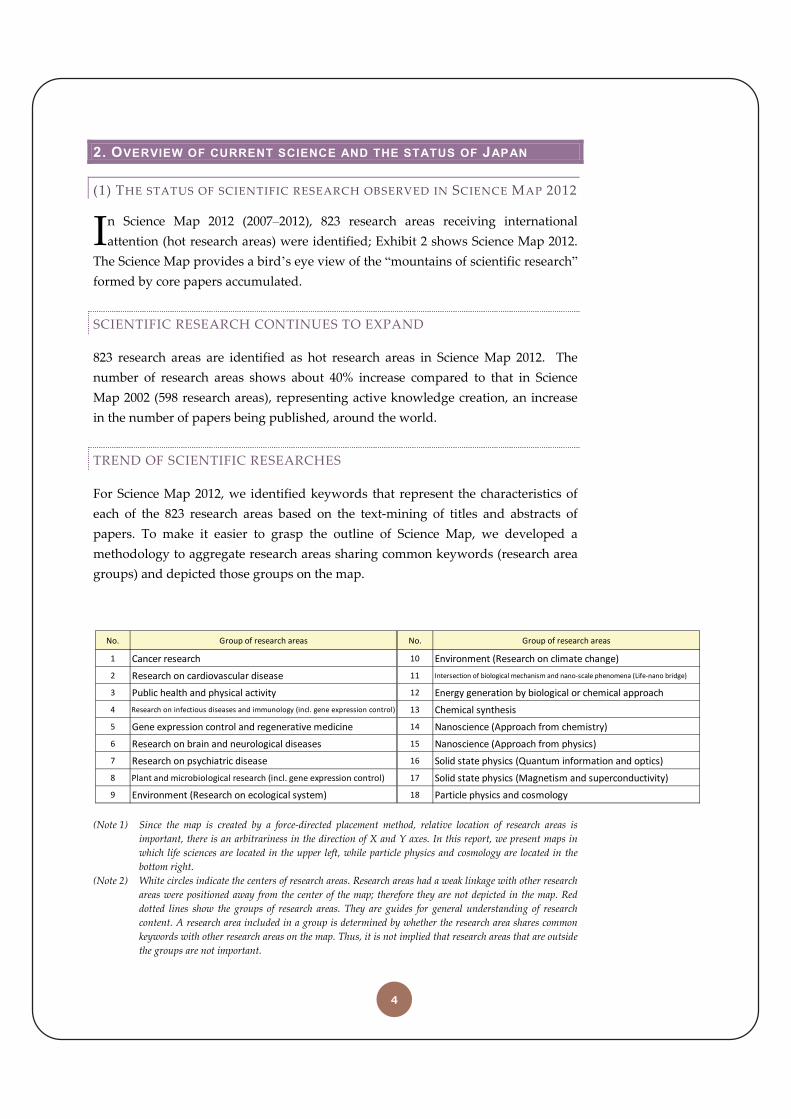
No. Group of research areas No. Group of research areas
1 Cancer research 10 Environment (Research on climate change)
2 Research on cardiovascular disease 11 Intersection of biological mechanism and nano‐scale phenomena (Life‐nano bridge)
3 Public health and physical activity 12 Energy generation by biological or chemical approach
4 Research on infectious diseases and immunology (incl. gene expression control) 13 Chemical synthesis
5 Gene expression control and regenerative medicine 14 Nanoscience (Approach from chemistry)
6 Research on brain and neurological diseases 15 Nanoscience (Approach from physics)
7 Research on psychiatric disease 16 Solid state physics (Quantum information and optics)
8 Plant and microbiological research (incl. gene expression control) 17 Solid state physics (Magnetism and superconductivity)
9 Environment (Research on ecological system) 18 Particle physics and cosmology
I
5
Exhibit 2 Science Map 2012
Data: NISTEP conducted analysis and visualization (ScienceMap visualizer) based on ESI research front data
(NSITEP version) by Thomson Reuters.
6
Research area groups related to life sciences are found in the upper left of the
Science Map, as depicted in Exhibit 2. “Cancer research” and “research on
cardiovascular disease” include keywords related to clinical research. The research
areas of “research on infectious diseases and immunology,” “gene expression control
and regenerative medicine,” and “plant and microbiological research” include
keywords related to gene expression regulation, showing an elucidation of
molecular mechanisms is shared element of research among the three groups. In
addition, “research on brain and neurological diseases” as well as “research on
psychiatric disease” are closely positioned and therefore thought to be developing
cooperatively.
“Public health and physical activity” is located somewhat away from “research on
infectious diseases and immunology.” Other groups of research areas in life sciences
are conducted from the viewpoint of individual mechanisms and their control or
medical treatments, but “public health and physical activity” includes keywords
related to group health and preventative measures for public hygiene, indicating a
difference in the viewpoint from the former.
“Environmental research,” which is located below “plant and microbiological
research” on the Science Map, has shown a visible change from 2002 to 2012. In
Science Map 2012, two research area groups were found, namely “environment
(research on ecological system)” and “environment (research on climate change).”
“Particle physics and cosmology” is located in the bottom right of the Science Map.
Starting from “particle physics and cosmology,” we can find the research area
groups of “solid state physics (magnetism and superconductivity),” “solid state
physics (quantum information and optics),” “nanoscience (approach from physics),”
“nanoscience (approach from chemistry),” and “chemical synthesis” showing inter‐
linkages of these research area groups. Compared with Science Map 2002, the
number of research areas related to nanoscience has shown a sharp increase.
Between the groups of life sciences and nanoscience, there is a group of research
areas presenting the intersection of biological mechanisms and nano‐level
phenomena (i.e., the life‐nano bridge). Looking at changes in the map over time
since Science Map 2002, it is found that knowledge created in the life‐nano bridge is
spreading to both the life sciences and nanoscience rather than some fusion research
appear and grow. In other words, this portion represents a true intersection of
biological mechanisms and nano‐level phenomena.
Another characteristic of Science Map 2012 is that at the intermediate position
between the research areas of “chemical synthesis,” “plant and microbiological
research,” “environment (research on ecological system),” and “environment
7
(research on climate change),” we find a group of research areas related to the
creation of energy through biological and chemical approaches, including research
areas related to biomass and microbial fuel cells.
The Science Map also includes research areas not categorized into any research area
groups. A research area included in a group is determined by whether the research
area shares common keywords with other research areas on the map. Thus, it is not
implied that research areas that are outside the groups are not important.
(COLUMN) THE RELATIONSHIP BETWEEN RESEARCH ACTIVITIES
AND WHAT IS OBSERVED IN NISTEP’S SCIENCE MAP
he Science Map provides a bird’s eye view of hot research areas. It can visualize growth,
integration, and divisions of the research communities for research areas that
continuously exist on the map; however, the Science Map is not a closed world. The Sea of
Science, a source of knowledge made up of all scientific papers produced in the world, exists
outside the Science Map. New notable research areas are formed and emerged from this Sea
of Science and these research areas are monitored on the Science Map.
There are various phases in research, such as a phase heading toward practical application, a
phase summarizing research findings, etc. From this viewpoint, we identify the following
three types of research areas not detected in the Science Map: (1) research areas that have
transitioned into technological phase such as those seen in patents; (2) research areas in a
saturation phase; and (3) research areas in a steady state after the temporary boom. Even in
these undetected research areas, knowledge is still accumulated and does not disappear. In all
these patterns, the research area is expected to reappear on the Science Map if it begins to
receive new attention, for example, if there is a discovery that pushes the research into a new
phase.
Thus, the Science Map extracts those research areas in which research is receiving extensive
attention and is in a progressive phase. This is a “cyclic system” and the system cannot work
without the Sea of Science that surrounds the Science Map. Since research areas represent
activities of the communities of researchers who share common research interests, dynamics
such as changing generations of researchers and movement of researchers across research
areas would have some impacts on a cyclic system of Science Map.
T

8
(2) INCREASING UBIQUITY OF INTER‐/MULTI‐DISCIPLINARY RESEARCH
nderstanding the trends in inter‐/multi‐disciplinary research is crucial to grasp
the present status of science. The proportion of inter‐/multi‐disciplinary
research areas among hot research areas has changed little since Science Map 2002
and stands at 26% in Science Map 2012.
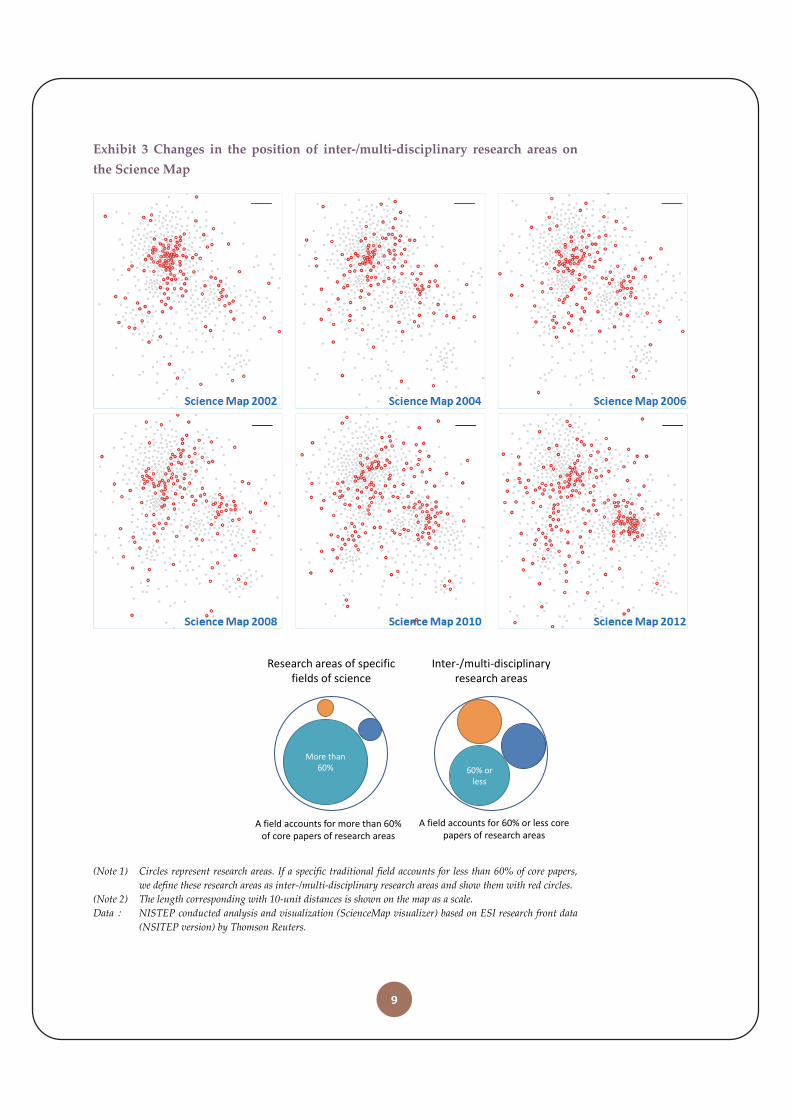
Time‐series observation of the position of inter‐/multi‐disciplinary research areas in
the Science Map (shown in Exhibit 3) revealed that research areas localized in
relatively limited region in Science Map 2002 show gradual expansion over time.
In Science Maps 2002 and 2004, inter‐/multi‐disciplinary research areas were
concentrated in life sciences. After Science Map 2006, many inter‐/multi‐disciplinary
research areas have appeared in nanoscience. The ubiquity of inter‐/multi‐
disciplinary research is increasing over time and these research areas are located
across the entire map in Science Map 2012.
What these findings indicate is that while the exchange of knowledge was common
within life sciences at the time of Science Map 2002, we also witnessed an increase in
such exchanges in non‐life sciences as well as between life sciences and non‐life
sciences. In other words, it remarks growing importance of the combination of
knowledge of different fields of science in the advancement of contemporary science.
U
9
Exhibit 3 Changes in the position of inter‐/multi‐disciplinary research areas on
the Science Map
(Note 1) Circles represent research areas. If a specific traditional field accounts for less than 60% of core papers,
we define these research areas as inter‐/multi‐disciplinary research areas and show them with red circles.
(Note 2) The length corresponding with 10‐unit distances is shown on the map as a scale.
Data: NISTEP conducted analysis and visualization (ScienceMap visualizer) based on ESI research front data
(NSITEP version) by Thomson Reuters.
60% or less
More than 60%
Inter‐/multi‐disciplinary research areas
Research areas of specific fields of science
A field accounts for more than 60% of core papers of research areas
A field accounts for 60% or less core papers of research areas
10
(3) INTERNATIONAL COLLABORATION IS GETTING A COMMON MODE OF
CREATION OF HIGH IMPACT KNOWLEDGE EVEN IN LIFE SCIENCES
nalyses of the type of authorship in scientific papers showed the increasing of
internationally co‐authored papers, which can be considered as an output of
an international collaboration. This observation indicates that research activities are
being conducted across national and regional borders. By overlaying information of
international co‐authorship in core papers of each research area over the Science
Map, we analyzed current status of international collaboration in hot research areas.
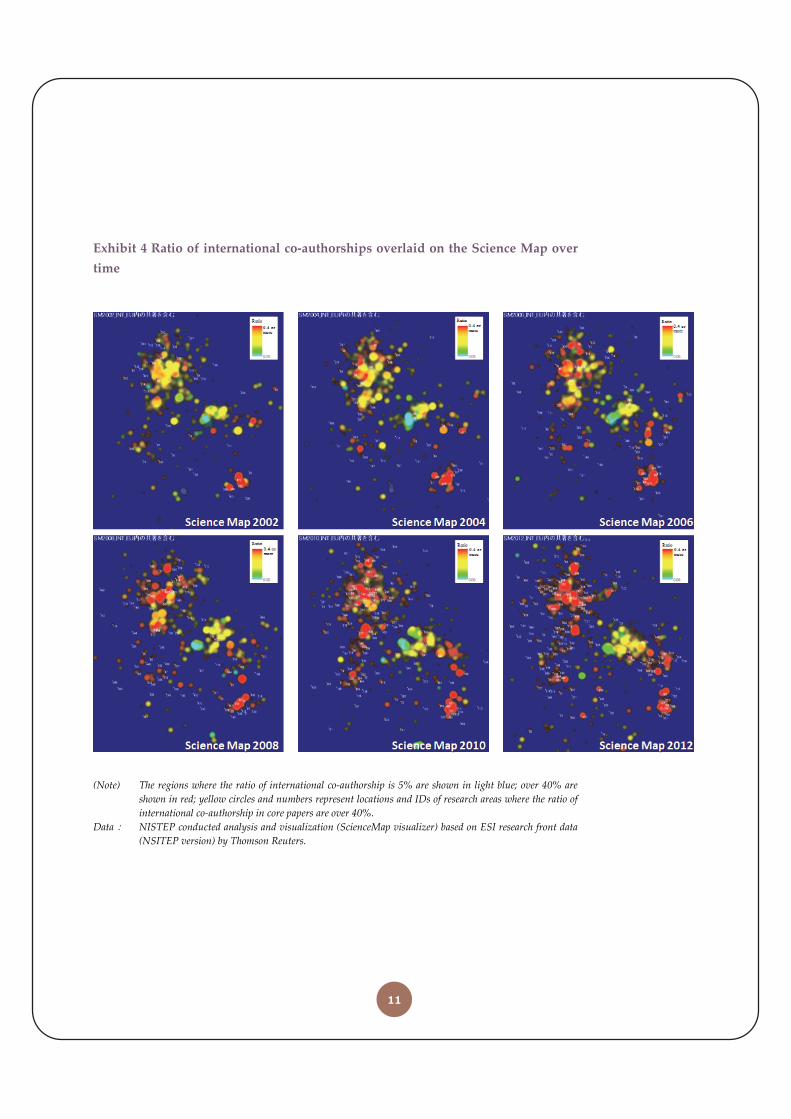
Exhibit 4 displays the ratio of international co‐authorship in core papers overlaid on
Science Maps. The red color represents region where the ratio of international co‐
authorship is 40% or more. In Science Map 2002, the red colored region is
concentrated in “particle physics and cosmology;” however, the ratio of
international collaborations shows a gradual increase on the entire Science Map over
time.
An increase in the ratio of international co‐authorships has especially been clear in
life sciences. In contrast, the ratio of international collaboration has remained low in
“chemical synthesis” and “nanoscience” from Science Maps 2002 to 2012. This shows
that the forms of research activities vary depending on the content of research and
that the ratio of international co‐authorships is not uniform on the Science Map.
A
11
Exhibit 4 Ratio of international co‐authorships overlaid on the Science Map over
time
(Note) The regions where the ratio of international co‐authorship is 5% are shown in light blue; over 40% are
shown in red; yellow circles and numbers represent locations and IDs of research areas where the ratio of
international co‐authorship in core papers are over 40%.
Data: NISTEP conducted analysis and visualization (ScienceMap visualizer) based on ESI research front data
(NSITEP version) by Thomson Reuters.
12
(4) JAPAN’S FALLING SHARE AND DIVERSITY IN THE SCIENCE MAP
e monitored three indicators to analyze Japan’s presence in scientific
research.
The first indicator is the share of Japan and benchmarking countries in
core papers that made up of all research areas (see Exhibit 5A). This is an indicator
that shows a volume of papers that lead hot research areas. On Science Map 2012,
the UK (6.9%) and Germany (7.2%) lead Japan (4.1%). Furthermore, we observe that
Japan’s share is falling over time.
Second, by looking at the number of research areas Japan participating2 on Science
Maps, we analyzed Japan’s diversity in scientific research as shown in Exhibit 5B.
While the number of research areas in the Science Map increases, the number of
research areas Japan participating has stagnated, leading to a decline in the coverage
on Science Maps (41% as of Science Map 2008 and 33% as of Science Map 2012).
There is a significant difference between the number of research areas Japan
participating and the UK and Germany participating.
Third, by analyzing the coverage in citing papers (top 10%), i.e., followers of the core
papers, we can check the size of research community of the second tier group. The
number of research areas each country participating in citing papers (top 10%) was
higher than that in core papers for all three countries, but the UK (720) and Germany
(702) still show large advantage over Japan (607). This result indicates a lack of the
second tier group in Japan compared to the UK and Germany.
Moreover, if we compare the ratio of the coverage in core and citing papers (top
10%), we find that while Japan stands at 45% (274/607), the UK and Germany are at
70% (504/720) and 65% (455/702), respectively. How to facilitate the transition of
researchers of the second tier group to the first tier group is another issue for Japan.
2 The participation to a research area is determined by whether or not a core paper (or a top 10% citing paper) of a
target country is included in a research area.
W
13
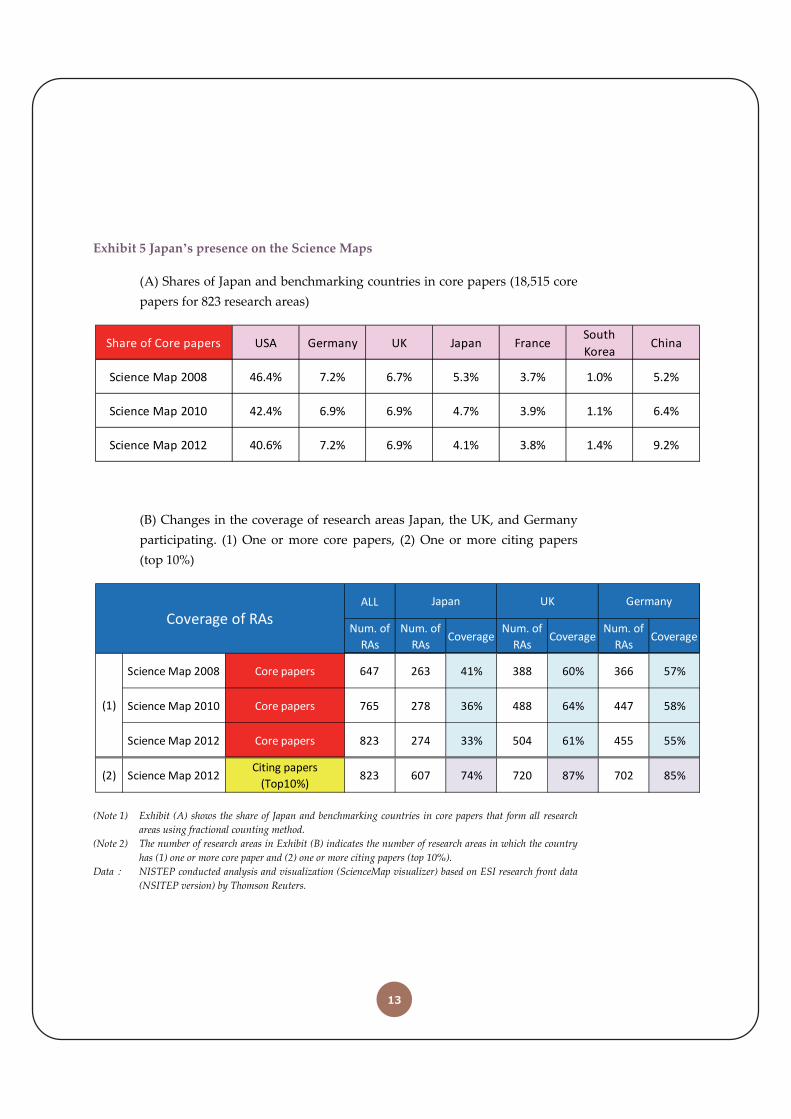
Exhibit 5 Japan’s presence on the Science Maps
(A) Shares of Japan and benchmarking countries in core papers (18,515 core
papers for 823 research areas)
(B) Changes in the coverage of research areas Japan, the UK, and Germany
participating. (1) One or more core papers, (2) One or more citing papers
(top 10%)
(Note 1) Exhibit (A) shows the share of Japan and benchmarking countries in core papers that form all research
areas using fractional counting method.
(Note 2) The number of research areas in Exhibit (B) indicates the number of research areas in which the country
has (1) one or more core paper and (2) one or more citing papers (top 10%).
Data: NISTEP conducted analysis and visualization (ScienceMap visualizer) based on ESI research front data
(NSITEP version) by Thomson Reuters.
Share of Core papers USA Germany UK Japan FranceSouth
KoreaChina
Science Map 2008 46.4% 7.2% 6.7% 5.3% 3.7% 1.0% 5.2%
Science Map 2010 42.4% 6.9% 6.9% 4.7% 3.9% 1.1% 6.4%
Science Map 2012 40.6% 7.2% 6.9% 4.1% 3.8% 1.4% 9.2%
ALL
Num. of
RAs
Num. of
RAsCoverage
Num. of
RAsCoverage
Num. of
RAsCoverage
Science Map 2008 Core papers 647 263 41% 388 60% 366 57%
Science Map 2010 Core papers 765 278 36% 488 64% 447 58%
Science Map 2012 Core papers 823 274 33% 504 61% 455 55%
(2) Science Map 2012Citing papers
(Top10%)823 607 74% 720 87% 702 85%
Germany
(1)
Coverage of RAsJapan UK
14
3. CATEGORIZATION OF RESEARCH AREAS BY USING THE SCI-GEO
CHART AND UNDERSTANDING CURRENT ACTIVITIES OF JAPAN
(1) CURRENT SITUATION OF JAPANESE S&T POLICY AND REASON WHY WE
CREATED THE SCI‐GEO CHART
n recent discussions of science and technology policies in context of research
activities that produce scientific papers as an output of research, various issues
have been raised, including basic research as a seedbed of innovation, diversity in
basic research, and selection and concentration of resources; however, these policy
discussions are often conducted without sufficient quantitative evidences, and
policies are often advanced based on past experience or measures taken abroad.
Unfortunately, Japan’s presence grasped on the Science Map is falling over the past
decade.
Due to current financial situation of Japan, the allocation strategy is critical in S&T
policy. In such a context, quantitative evidences should be constructed and policy
discussions and decisions should be made based on these evidences.
What research areas are responsible for diversity in basic research? Which research
areas are candidates for selection and concentration of resources? How should we
think about the balance between diversity in basic research and selection and
concentration of resources? To answer these questions, this Science Map introduces
the concept of Sci‐GEO chart (Chart represents geographical characteristics of
Research Areas on Science Map).
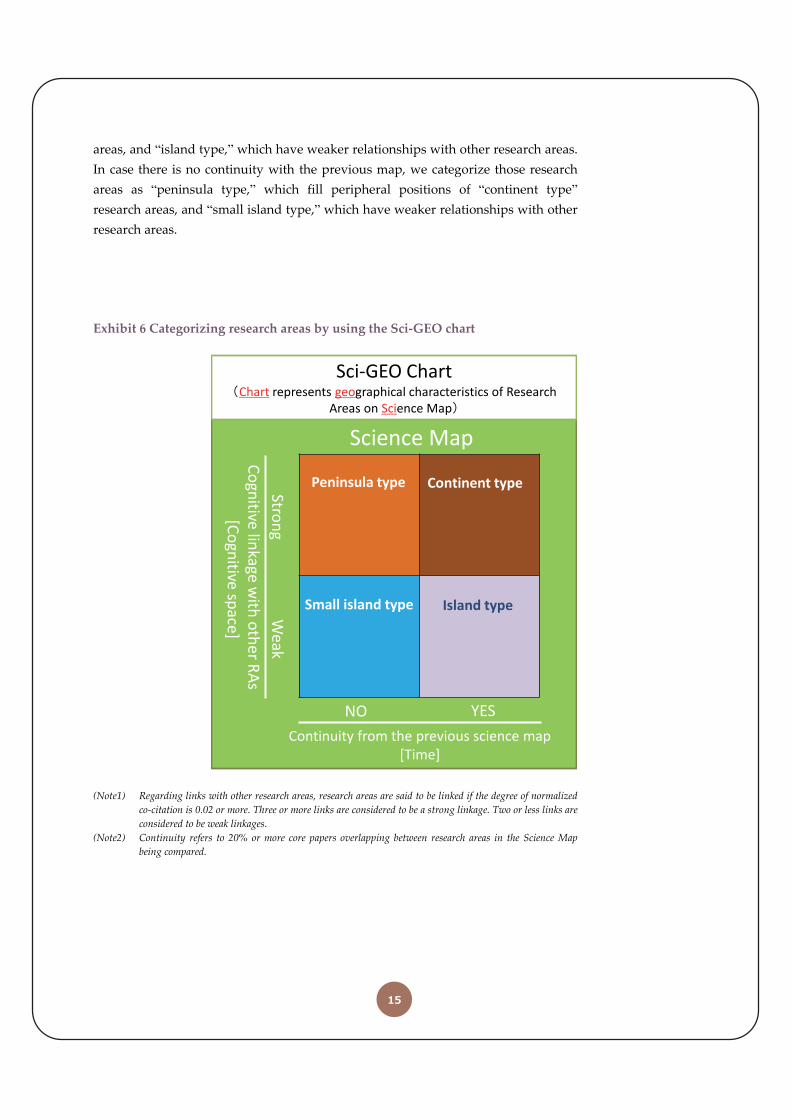
(2) CATEGORIZATION OF RESEARCH AREAS BY USING THE SCI‐GEO CHART
Looking at the dynamic changes on the Science Map3, the mountain of scientific
research can be classified into two portions. The first are relatively “hard” portions,
where scientific research is continuously taking place and strong relationships with
other research areas exist. The second are “soft” portions showing continuous
changes. To categorize these “hard” and “soft” portions, we introduced the concept
of the Sci‐GEO chart on the Science Map, as shown in Exhibit 6.
In the Sci‐GEO chart, research areas are categorized using continuity (time axis) and
the strength of relationships with other research areas (cognitive axis). As shown in
Exhibit 6, when there is continuity with the previous map, we categorize the
research areas into “continent type,” which are strongly related to other research
3 A movie showing dynamic changes from Science Map 2002 to Science Map 2012 is available at
https://www.youtube.com/watch?v=ZjgvboKRE1o (in Japanese)
I
15
areas, and “island type,” which have weaker relationships with other research areas.
In case there is no continuity with the previous map, we categorize those research
areas as “peninsula type,” which fill peripheral positions of “continent type”
research areas, and “small island type,” which have weaker relationships with other
research areas.
Exhibit 6 Categorizing research areas by using the Sci‐GEO chart
(Note1) Regarding links with other research areas, research areas are said to be linked if the degree of normalized
co‐citation is 0.02 or more. Three or more links are considered to be a strong linkage. Two or less links are
considered to be weak linkages.
(Note2) Continuity refers to 20% or more core papers overlapping between research areas in the Science Map
being compared.
Continuity from the previous science map[Time]
Cognitive lin
kage with
other R
As
[Cognitive
space]
NO YES
Strong
Weak
Continent type
Small island type Island type
Peninsula type
Science Map
Sci‐GEO Chart(Chart represents geographical characteristics of Research
Areas on Science Map)
16
(3) TRENDS IN RESEARCH ACTIVITIES IN THE WORLD AND BENCHMARKING
COUNTRIES AS SEEN WITH THE SCI‐GEO CHART
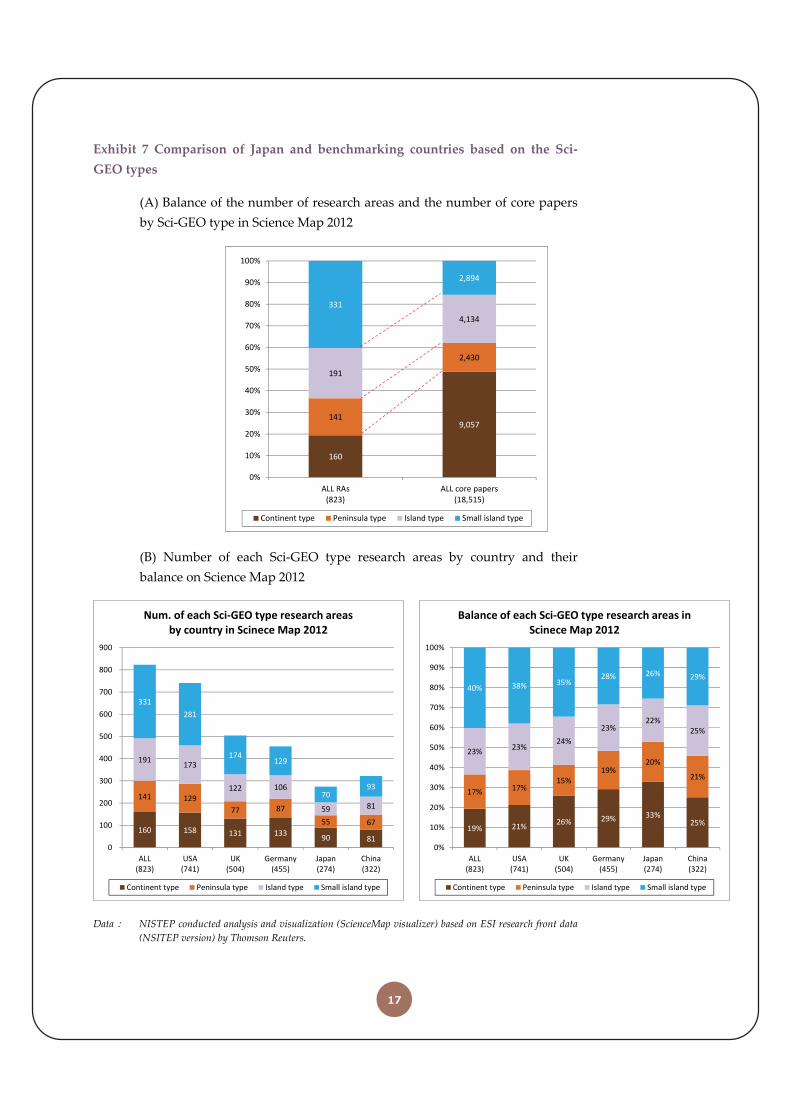
mong the 823 hot research areas obtained in Science Map 2012, it is found that
40% of the research areas are small island type and 20% are continent type, as
depicted in Exhibit 7A. In contrast, looking at the number of core papers in the
research areas, we find that 50% are in continent type and less than 20% are in small
island type, reflecting large size of continent type research areas relative to small
island type research areas (60 core papers for continent type vs. 10 core papers for
small island type)
Among the 274 research areas Japan participating, 90 are continent type, 55 are
peninsula type, 59 are island type, and 70 are small island type, as shown in Exhibit
7B. Comparing Japan, the UK, and Germany, we find the largest difference in the
number of small island type research areas. Looking at the balance of Sci‐GEO types,
it is found that 26% of Japan’s participating research areas are small island type and
33% are continent type. The balance shows striking difference compared with the
balance of Sci‐GEO types in the world (40% small island type, 19% continent type).
These evidences pose crucial questions regarding how Japan should think of its
“presence” in scientific research. Dose Japan need to increase research diversity as
seen through the number of research areas Japan participating? Or does Japan need
to increase the volume of high impact papers to secure its share in the world?
Depending on this choice, desirable balance in Sci‐GEO chart will differ.
A
17
Exhibit 7 Comparison of Japan and benchmarking countries based on the Sci‐
GEO types
(A) Balance of the number of research areas and the number of core papers
by Sci‐GEO type in Science Map 2012
(B) Number of each Sci‐GEO type research areas by country and their
balance on Science Map 2012
Data: NISTEP conducted analysis and visualization (ScienceMap visualizer) based on ESI research front data
(NSITEP version) by Thomson Reuters.
160
9,057141
2,430
191
4,134
331
2,894
0%
10%
20%
30%
40%
50%
60%
70%
80%
90%
100%
ALL RAs(823)
ALL core papers(18,515)
Continent type Peninsula type Island type Small island type
160 158 131 133 90 81
141 129
77 87
55 67
191 173
122 106
59 81
331
281
174 129
70 93
0
100
200
300
400
500
600
700
800
900
ALL(823)
USA(741)
UK(504)
Germany(455)
Japan(274)
China(322)
Num. of each Sci‐GEO type research areas by country in Scinece Map 2012
Continent type Peninsula type Island type Small island type
19% 21%26% 29% 33%
25%
17% 17%15%
19%20%
21%
23%23%
24%
23%22%
25%
40% 38% 35%28% 26% 29%
0%
10%
20%
30%
40%
50%
60%
70%
80%
90%
100%
ALL(823)
USA(741)
UK(504)
Germany(455)
Japan(274)
China(322)
Balance of each Sci‐GEO type research areas in Scinece Map 2012
Continent type Peninsula type Island type Small island type
18
(4) TRANSITION OF SCI‐GEO TYPES OVER TIME
o look at the evolution of research areas by using the Sci‐GEO chart, we
analyzed the transitions of Sci‐GEO types of research areas between the
successive two Science Maps, as illustrated in Exhibit 8.
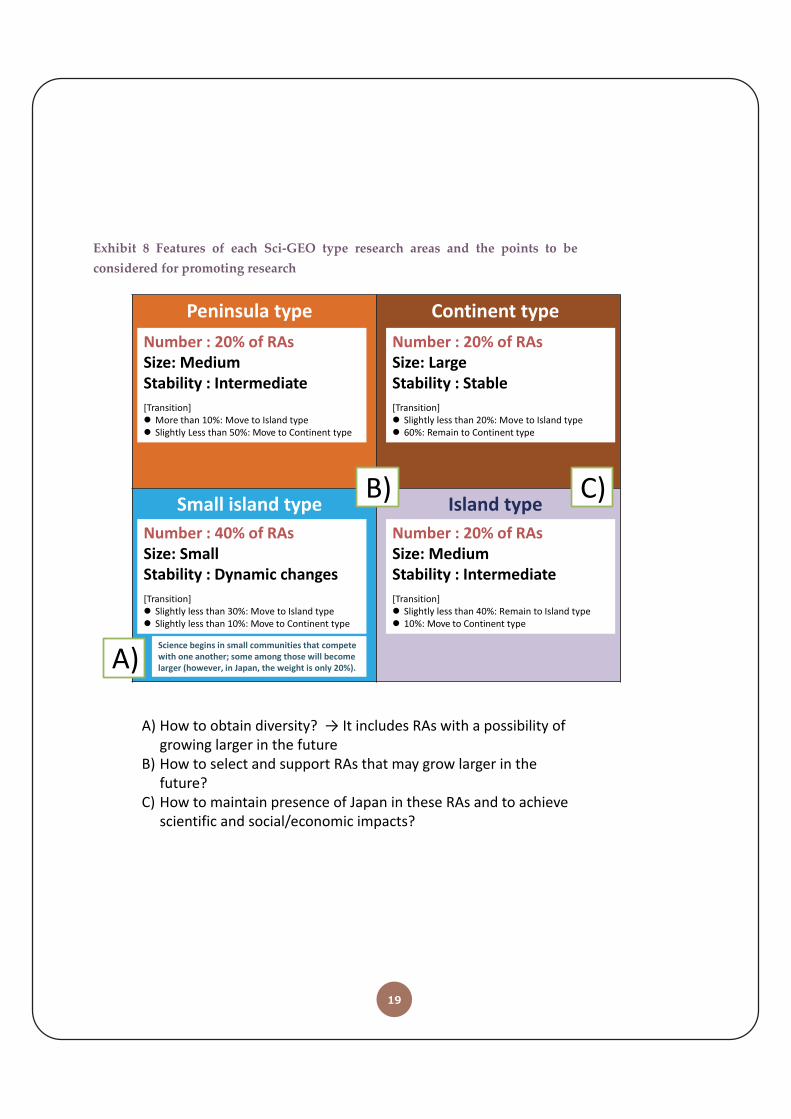
Small island type research areas account for 40% of research areas and therefore
they play major role in the diversity of research. Analyses of transitions among Sci‐
GEO types revealed that small island type research areas evolve to other Sci‐GEO
types over time, such as island type (slightly less than 30%) and continent type
(slightly less than 10%); however, approximately 60% of the small island type
research areas are not detected on the subsequent Science Map, showing highly
active replacements. These facts suggest that the two points are crucial for
promoting research of small island type. First, an environment in which these
research areas can be actively generated must be created. Second, to allow the
continuous development of promising small island type research areas, support
should be provided at proper timing in order to increase the size of the community
participating in these research areas.
Approximately 60% of the continent type research areas also appear on the
subsequent Science Map as continent type. Slightly less than 20% of them shows
transition to island type and those slightly more than 20% are not found on the
subsequent Science Map. Overall, 70% of continent type research areas continue,
showing a high degree of stability. Looking at continent type research areas from the
viewpoint of continuity, we find that these research areas are more stable targets for
research promotion in comparison with other type of research areas. However, large
size of research areas relative to the other Sci‐GEO types indicates fierce
international competition in the research areas. Therefore any measures to promote
research must consider the scale of resources to be invested as well as a balance
between competition and collaboration.
T
19
Exhibit 8 Features of each Sci‐GEO type research areas and the points to be
considered for promoting research
Continent type
Small island type Island type
Peninsula type
Number : 40% of RAsSize: SmallStability : Dynamic changes
[Transition] Slightly less than 30%: Move to Island type Slightly less than 10%: Move to Continent type
Science begins in small communities that compete with one another; some among those will become larger (however, in Japan, the weight is only 20%).
Number : 20% of RAsSize: LargeStability : Stable
[Transition] Slightly less than 20%: Move to Island type 60%: Remain to Continent type
Number : 20% of RAsSize: MediumStability : Intermediate
[Transition] Slightly less than 40%: Remain to Island type 10%: Move to Continent type
Number : 20% of RAsSize: MediumStability : Intermediate
[Transition] More than 10%: Move to Island type Slightly Less than 50%: Move to Continent type
C)B)
A)
A) How to obtain diversity? → It includes RAs with a possibility ofgrowing larger in the future
B) How to select and support RAs that may grow larger in thefuture?
C) How to maintain presence of Japan in these RAs and to achievescientific and social/economic impacts?
20
(5) ANALYZING CHARACTERISTICS OF FUNDING BY USING THE SCI‐GEO
CHART
esults presented so far suggested that optimal policies for promoting research
(number of projects, research team scale, amount of research budget, etc.) differ
across the type of a research area as found through the Sci‐GEO chart. Next, we
analyzed the relationship between funding and the Sci‐GEO types on the Science
Map. In particular, we overlaid the positions of scientific papers that got support
from Japan’s two major competitive funds — grants‐in‐aid for scientific research
(“KAKENHI”) and the ones by Japan Science and Technology Agency (JST) — on
the Science Map. In the following results, “WoS‐KAKEN paper” refers to a paper
that is listed in a report of a research project supported by KAKENHI. “JST paper”
refers to a paper in which JST is listed as one of affiliation of authors.
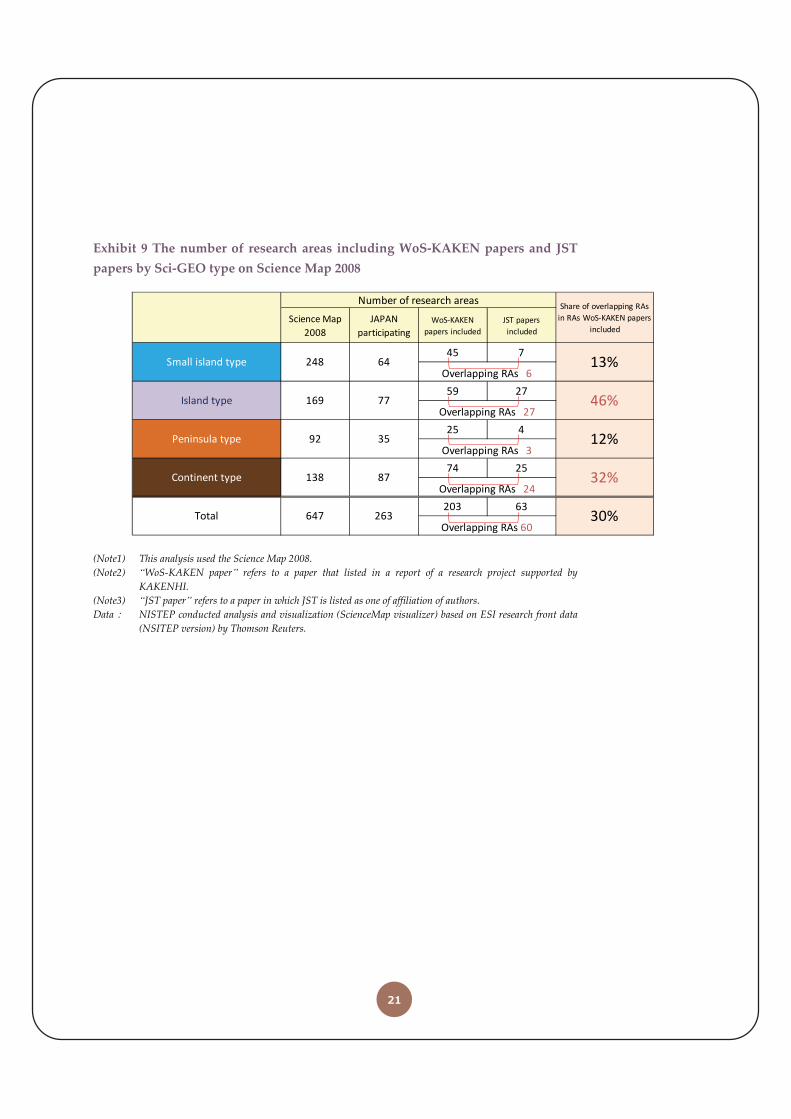
Research areas including WoS‐KAKEN papers account for approximately 70% of the
research areas Japan participating, as shown in Exhibit 9. In other words, KAKENHI
is responsible for a large portion of the diversity of research in Japan. Research areas
including JST papers largely overlap with research areas including WoS‐KAKEN
papers; among them, the more overlapping is found in island and continent type
research areas. While it has often been pointed out that KAKENHI supports the
diversity of Japanese research and JST strategically promotes research, we have now
shown this picture quantitatively.
As shown in previous analyses, Japan’s share of papers is decreasing and diversity
of research is not catching up the expansion of scientific research in the world.
Discussions should be made regarding how to effectively bridge funding agencies in
order to increase the presence of Japanese research and how to provide appropriate
amount of research funds reflecting stage of evolution and characteristics of research
areas. At the same time, the effort to accumulate additional evidences for further
policy discussions is inevitable as described in future works.
R
21
Exhibit 9 The number of research areas including WoS‐KAKEN papers and JST
papers by Sci‐GEO type on Science Map 2008
(Note1) This analysis used the Science Map 2008.
(Note2) “WoS‐KAKEN paper” refers to a paper that listed in a report of a research project supported by KAKENHI.
(Note3) “JST paper” refers to a paper in which JST is listed as one of affiliation of authors. Data: NISTEP conducted analysis and visualization (ScienceMap visualizer) based on ESI research front data
(NSITEP version) by Thomson Reuters.
Science Map
2008
JAPAN
participating
WoS‐KAKEN
papers included
JST papers
included
45 7
59 27
25 4
74 25
203 63
Number of research areasShare of overlapping RAs
in RAs WoS‐KAKEN papers
included
13%
46%
248
169
Small island type
Island type
12%
32%
30%
64
77
35
87
263
Overlapping RAs 6
Overlapping RAs 27
Overlapping RAs 3
Overlapping RAs 24
Overlapping RAs 60
Peninsula type
Continent type
Total
92
138
647
22
4. X-RAY IMAGES OF RESEARCH ACTIVITIES AT THE INSTITUTIONAL
LEVEL ON SCIENCE MAP 2012
s shown in Exhibit 10, we include information regarding each of the 823
research areas found on Science Map 2012, such as the information of the
number of core papers, the share of benchmarking countries, keywords, and the
proportion of internationally co‐authored papers4.
We also visualize research activities of 153 Japanese universities and public research
institutions on Science Map 2012. It is a kind of X‐ray image enabling us to capture
institutional‐level research activities in Japan. By using this data, we compare the
characteristics of Japan’s universities and public research institutions from a
quantitative viewpoint. Exhibit 11 presents the Science Map Research Activity Sheet
of University of Tokyo.
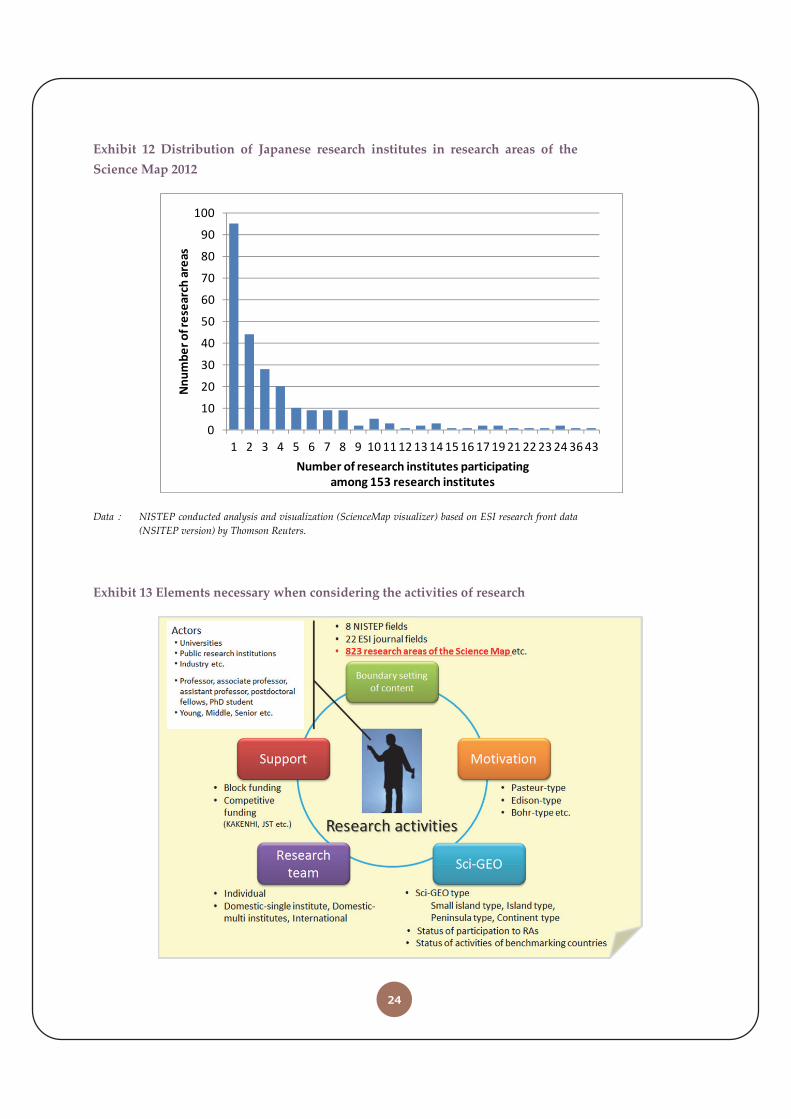
We analyze how research activities of the 153 universities and public research
institutions overlapped on the Science Map and find that there are research areas
over 20 institutions participating (as shown in Exhibit 12). We also find that there
are approximately 90 research areas in which only one institution are participating,
indicating the research area level analysis well reveals an individual characteristic of
universities and public research institutions.
Here, we will provide examples of how to utilize the data. In a situation where an
institution sets integrated research agenda to promote research, they can confirm if
their institution covers research areas that would fit the research agenda or how
distant are the candidate researchers on the map, using the tool as a common basis
of discussion. In addition, this report includes accession number (unique ID of
papers in the Web of Science) of core and citing papers (top 10%) of 153 universities
and public institutions for searching publications. If the institution contributes in
various research areas, it could classify publications by department or research units
and analyze their locations on the map in order to visualize the characteristics of the
institution.
We hope that utilization of this quantitative monitoring tool will deepen discussion
and will increase the good practices at individual research institutions.
Consequently, we will see an accumulation of knowledge related to research
planning based on such evidence. The experience would be beneficial for further
advancement of Science Map research, thus we would be grateful to hear about
practical cases on how this tool is being utilized.
4 The information is only available in Japanese.
A

23
Exhibit 10 Detailed research area data on the Science Map 2012
Exhibit 11 Science Map Research Activity Sheet
Data: NISTEP conducted analysis and visualization (ScienceMap visualizer) based on ESI research front data
(NSITEP version) by Thomson Reuters.
24
Exhibit 12 Distribution of Japanese research institutes in research areas of the
Science Map 2012
Data: NISTEP conducted analysis and visualization (ScienceMap visualizer) based on ESI research front data
(NSITEP version) by Thomson Reuters.
Exhibit 13 Elements necessary when considering the activities of research
0
10
20
30
40
50
60
70
80
90
100
1 2 3 4 5 6 7 8 9 101112131415161719212223243643
Nnumber of research areas
Number of research institutes participating among 153 research institutes
25
5. FUTURE WORKS
inally, we discuss future work. In Exhibit 13, we summarized the elements
necessary when considering the activities of research based on our past studies
and discussions with government officials and high‐level policy makers. When
analyzing research activities, the following five elements should be taken into
consideration; (1) boundary setting of content, (2) motivation, (3) Sci‐GEO type, (4)
the composition of research team, and (5) the kind of supporting funds.
In this report, we tried to overlay various information of the above mentioned
research activities on the Science Map. In other words, by linking the five elements
to the Science Map, we attempt to obtain an integrated understanding of research
activities. It is expected that our understanding of these factors will bring a
qualitative change on our discussions of S&T policies. For example, in discussing
internationalization of research, the Science Map shows how the status of
internationalization differs depending on a research area and how the UK and
Germany have gained their coverage of research areas through internationalization.
In addition, another study suggests that compared with Edison‐type research, in
which solving specific issues in real life is the primary motivation of research, Bohr‐
type research projects, which is motivated by the pursuit of basic principles, have a
higher likelihood of evolving to an international collaboration. These data is
expected to clarify the meaning of internationalization in S&T policies.
Linking data of the types and amounts of research funding to the Science Map will
lead to the in‐depth understanding of the appropriate funding and team sizes for
promoting research. As seen in the Sci‐GEO chart analysis, 40% of research areas
receiving global attention are classified as small island type, which are often to be
replaced, and approximately 20% are continent type, which have strong
relationships with neighboring research areas. The allocation of research funding
should be re‐examined; depending on the balance between these two types of
research Japan would pursuit.
After around ten years of trial and error, we have obtained effective tools and
indicators to analyze research activities, such as that given in this report. In future
work, by linking various elements of research activities such as those shown in
Exhibit 13 to the Science Map, we would be able to further deepen our analysis.
F
26
In summary, we outline three issues for future work as following.
LINKING THE SCIENCE MAP AND FUNDING DATA
Adding funding data to the Science Map will provide valuable information. By
overlaying WoS‐KAKEN paper data on Science Map 2008, it becomes clear that
KAKENHI plays an important role in the diversity of Japan’s research. Adding
information about the amounts of research funding in addition to the names of
funding programs, it would be possible to obtain various data regarding the effects
of research funding on the progress of scientific research by analyzing its
relationship with funding over time.
Achieving this requires information of funding data and outputs of the funding;
however in Japan, KAKEN database (https://kaken.nii.ac.jp/) is the only publicly
available database that chronologically collects such information regarding funding
and its outputs. Currently, there is a time lag between the filing of reports of
research projects and the registration of the reports to the KAKEN database.
Furthermore, matching of papers registered in KAKEN database and records in the
Web of Science are needed. At present, it is technically difficult to put the latest
information of various research funds on the Science Map.
A method for linking funding information to the Science Map in real‐time would be
to utilize the acknowledgments described in papers. Some paper databases are
beginning to record acknowledgment information for papers dating back to the late‐
2000s; however, acknowledgments are not always written in the same format and
often cannot be utilized as original expression. Standardized way to describe the
funding information in the acknowledgment should be determined in each funding
agency.
In the future, by introducing the “standardized acknowledgment codes” in all
funding agencies in Japan, similar to the patent application numbers, it should be
possible to perform real‐time monitoring of output data through paper databases.
LINKING SCIENCE AND TECHNOLOGY
The observable range of the Science Map is limited to science where research results
can be presented in the form of papers. To observe science and technology from a
bird’s eye view perspective, we had better to construct a technology map that can
grasp the trends of technology development through information such as patents.
By using the paper information cited in patent documentation, we could link a
technology map to the Science Map and observe the transfer of knowledge from
science to technology and vice versa.
27
By combining this with the funding information mentioned above, we could
measure the real effects of public funding on the development of science and
technology.
UTILIZING SCIENCE MAP AS AN ARENA FOR DISCUSSION
This report lists information, such as the number of core papers, the shares of
benchmarking countries, and the ratio of international collaborations in each of the
823 research areas on Science Map 2012; such information is to be utilized by those
individuals involved in Japan’s science and technology policymaking as well as the
management of Japan’s universities and public research institutions. We also
constructed the “Science Map Research Activity Sheet,” which visualizes how 153
universities and public research institutions are participating in the research areas
found on Science Map 2012.
We hope that by deepening the discussion of research management through
utilizing this kind of quantitative monitoring tool, we can increase good practices,
and consequently, Japan’s universities and public research institutions will
accumulate knowledge about management at the organizational level.
When discussing research agenda setting, individual researchers and policymakers
tend to express their opinions based on their backgrounds as a member of advisory
board. We believe that providing common information of discussion such as the
Science Map would help discussion among them with different backgrounds, where
they can utilize the map as a common basis for discussing research planning. By
sharing the same “arena,” researchers and policymakers can conduct discussions
while properly considering the distance among them. The experience of these
discussions would be beneficial for further advancement of Science Map research,
thus we would be grateful to hear about practical cases on how this tool is being
utilized.
SELECTED REFERENCES
Börner, K., Chen, C., and Boyack, K. W. (2003), Visualizing Knowledge Domains, Annual Review of Information Science and Technology, 37 : 179‐255.
Leydesdorff, L., and Rafols, I. (2009), A Global Map of Science Based on the ISI Subject Categories, Journal of the
Association for Information Science and Technology, 60 : 348‐362.
Saka, A., and Igami, M. (2007), Mapping Modern Science Using Co‐citation Analysis, 11th International
Conference Information Visualization (IV ʹ07), 453‐458.
Small, H. and Sweeney, E. (1985a), Clustering the Science Citation Index using Co‐citations. I. A Comparison of
Methods, Scientometrics, 7 : 391‐409.
Small, H., Sweeney, E., and Greenlee, E. (1985b), Clustering the Science Citation Index using Co‐citations. II.
Mapping Science, Scientometrics, 8 : 321‐340.

SCIENCE MAP 2010 & 2012
Recommended