VVVVVeeele leler,r, ffououndndinnng-gg papap rtrrrr neeenenerr CoCoCoCoC ol EEEEndndddeeae vovovooururururu1818181888881881818181818888-000-0-00-0-0-0-0-0-0000000000000011111-1-1-11-1-11 22020202020202020200002002000200002200002011112212212112212121222, , , ,,, AaAAAaAAAA rtrttttr v vvanannan VVVVV

WHY
HOW
WHAT


2011 NO RIGHTS RESERVED ©
“”
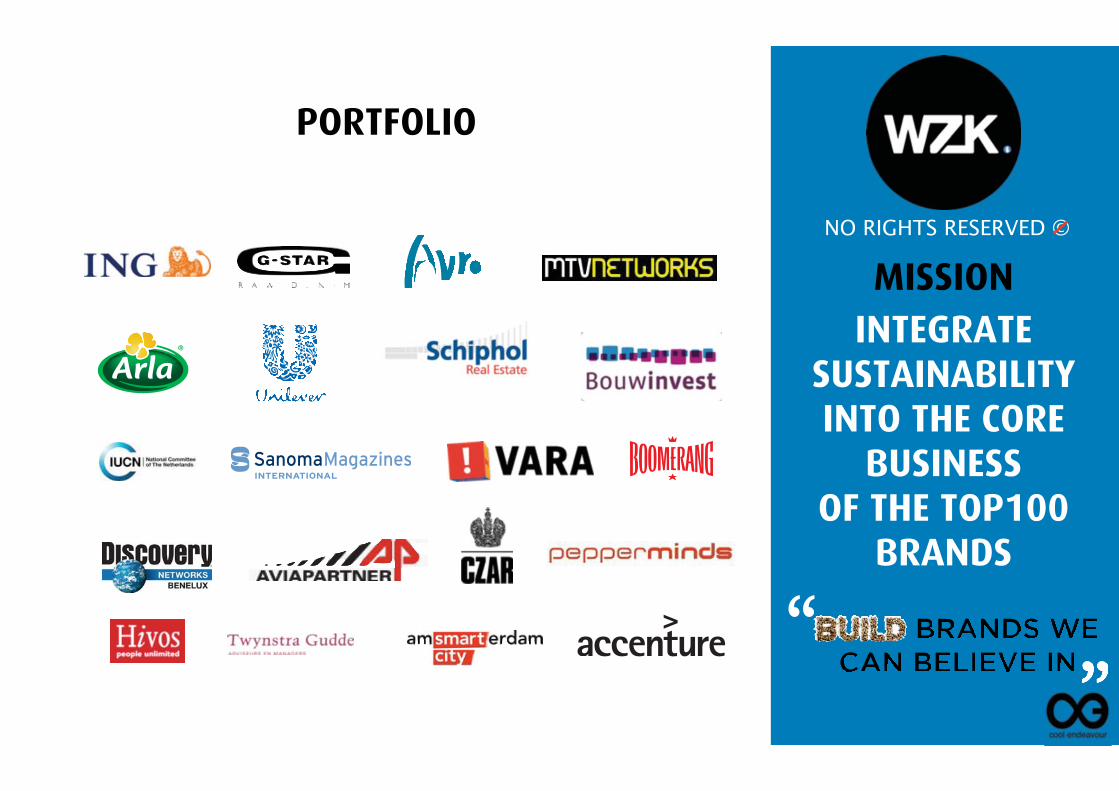
BUILD BRANDS WECAN BELIEVE IN
PORTFOLIO
INTEGRATE SUSTAINABILITY INTO THE CORE
BUSINESS OF THE TOP100
BRANDS
MISSIONNO RIGHTS RESERVED ©
IN
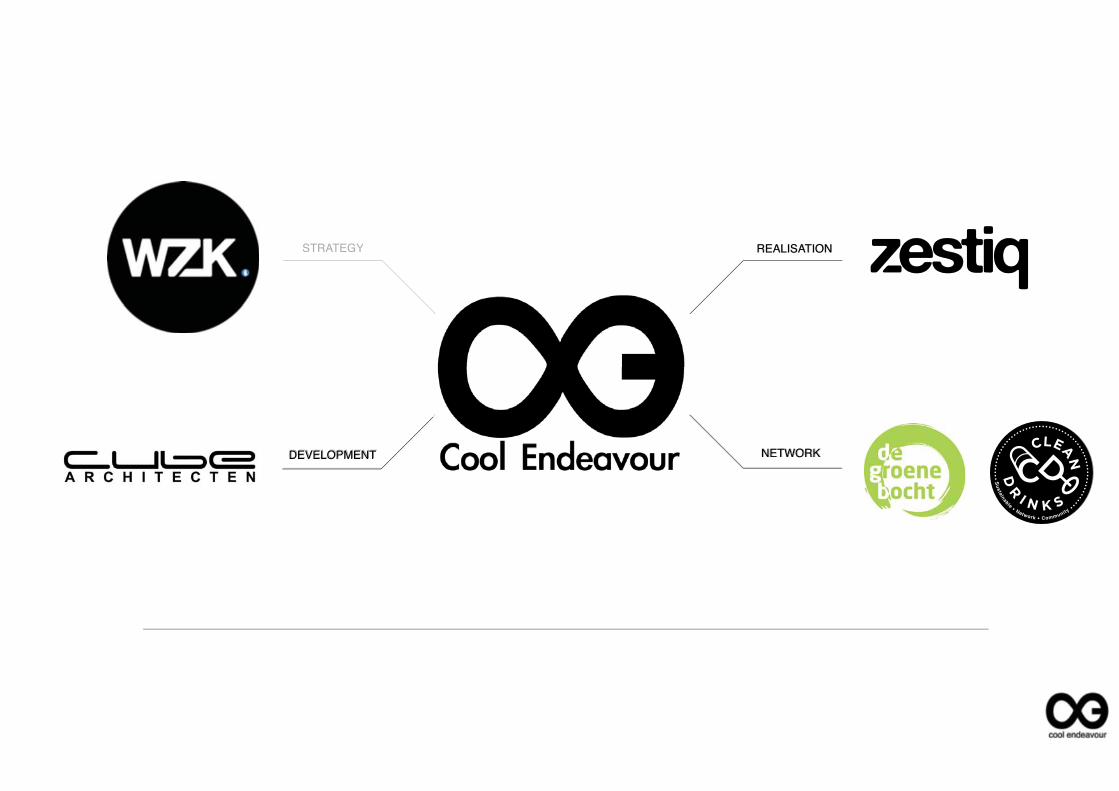
NETWORK
STRATEGY
DEVELOPMENT
REALISATION
DEVELOPMENT NETWORK
REALISATION

MISSIONACCELERATE THE TRANSITION TO A
SUSTAINABLE ECONOMY
FOR THE BENEFIT OF ALL

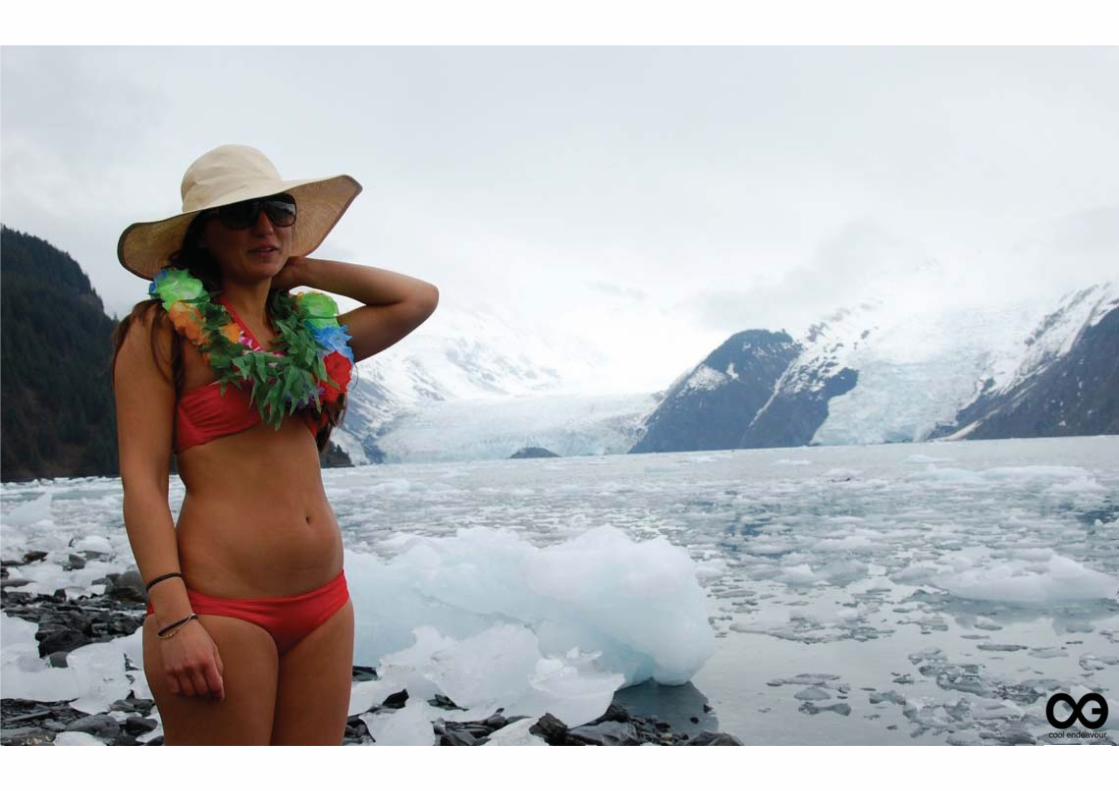
WHY?
Things = Working
Human Development Index
IndiaChina
Brazil
South Africa,Rep.
Hungary
AustraliaUnited Statesof America
Italy
Korea,Rep.
Exceeds biosphere’s average capacityper person, low development
Exceeds biosphere’s averagecapacity per person,
high development
Within biosphere’s average capacityper person, low development
Meets minimum criteriafor sustainability
World average biocapacity available per person, ignoring the needs of wild species
Thre
shol
d fo
r hi
gh h
uman
dev
elop
men
t
Ecological Footp
rint (2003 global hectares p
er person)
11
10
12
9
8
7
6
5
4
3
2
1
00 0.1 0.2 0.3 0.4 0.5 0.6 0.7 0.8 0.9 1.0
North AmericaEurope EUEurope Non-EULatin America and the Caribbean
Middle East andCentral Asia
Asia-PacificAfrica More than
1 billion100 million–1 billion
30 million–100 million
10 million–30 million
5 million –10 million
less than5 million
Country population (coloured by region): Historical trends for named selected countries(2003 dot coloured by region and sized by population):
1975 1980 1985 1990 1995 2000 2003
19
while living within the carrying capacity ofsupporting ecosystems” (IUCN et al., 1991).
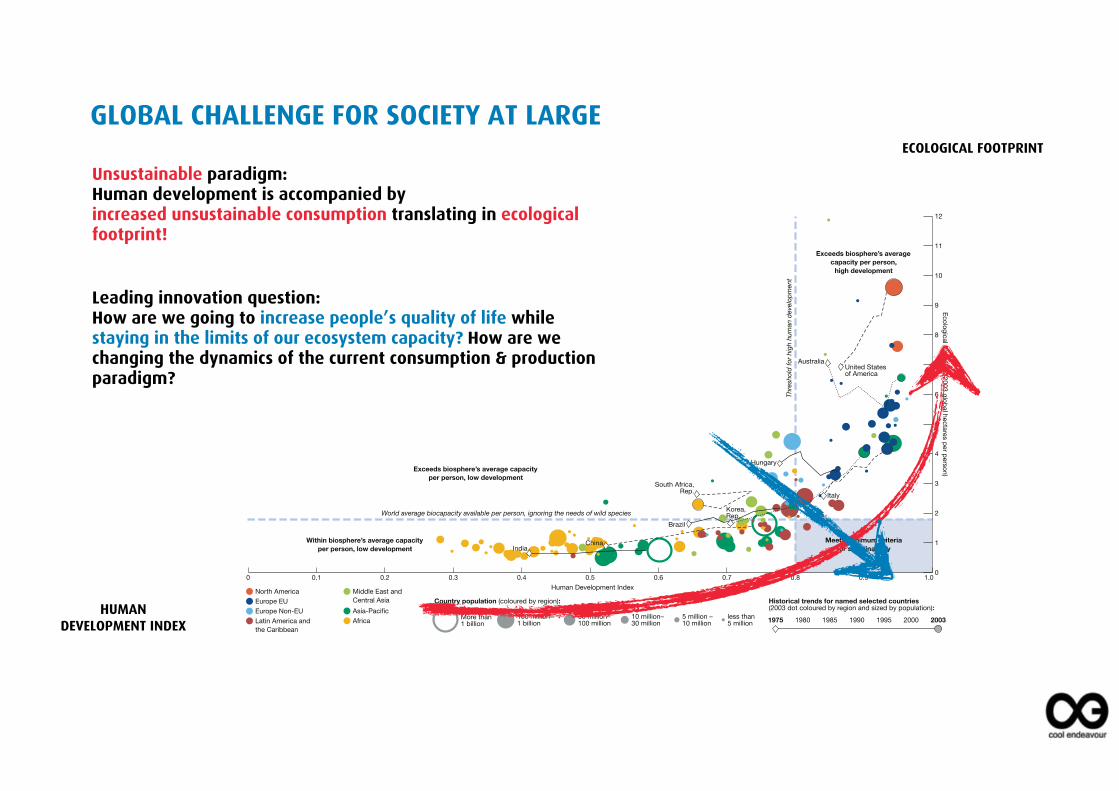
Countries’ progress towards sustainabledevelopment can be assessed using the UnitedNations Development Programme’s (UNDP)Human Development Index (HDI) as anindicator of well-being, and the footprint as a measure of demand on the biosphere. TheHDI is calculated from life expectancy,literacy and education, and per capita GDP.UNDP considers an HDI value of more than 0.8 to be “high human development”.Meanwhile, a footprint lower than 1.8 globalhectares per person, the average biocapacityavailable per person on the planet, coulddenote sustainability at the global level.
at a minimum these two criteria, withcountries moving into the blue quadrantshown in Figure 22. As world populationgrows, less biocapacity is available perperson and the quadrant’s height shrinks.
In 2003, Asia-Pacific and Africa wereusing less than world average per personbiocapacity, while the EU and North Americahad crossed the threshold for high humandevelopment. No region, nor the world as a whole, met both criteria for sustainabledevelopment. Cuba alone did, based on thedata it reports to the United Nations. Changesin footprint and HDI from 1975 to 2003 areillustrated here for some nations. During thisperiod, wealthy nations such as the United
quality of life. This did not hold for poorernations, notably China or India, wheresignificant increases in HDI were achievedwhile their per person footprints remainedbelow global per person biocapacity.
Comparing a country’s average per personfootprint with global average biocapacitydoes not presuppose equal sharing ofresources. Rather it indicates which nations’consumption patterns, if extended worldwide,would continue global overshoot, and whichwould not. The footprint and the HDI needsupplementing by other ecological andsocioeconomic measures – freshwaterscarcity and civic engagement, for example –to more fully define sustainable development.
ECOLOGICAL FOOTPRINT
GLOBAL CHALLENGE FOR SOCIETY AT LARGE
HUMAN DEVELOPMENT INDEX
Unsustainable paradigm: Human development is accompanied by increased unsustainable consumption translating in ecological footprint!
Leading innovation question:How are we going to increase people’s quality of life while staying in the limits of our ecosystem capacity? How are we changing the dynamics of the current consumption & production paradigm?


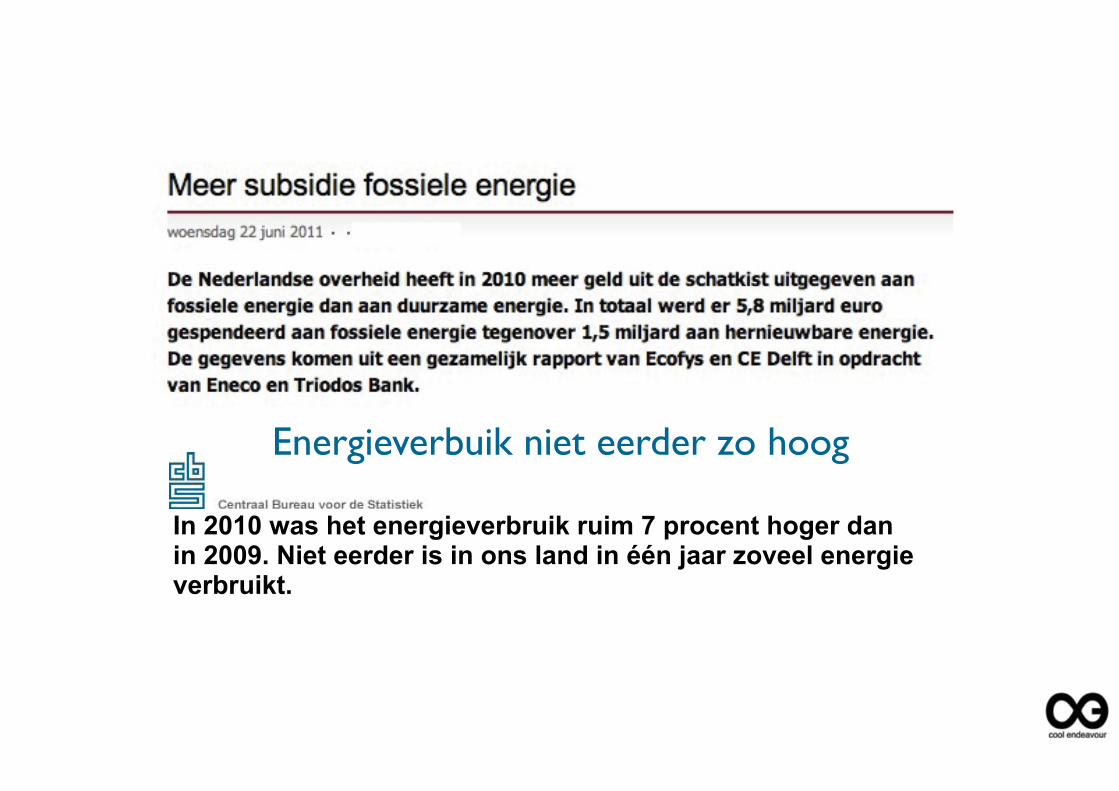
Energieverbuik niet eerder zo hoog
In 2010 was het energieverbruik ruim 7 procent hoger dan in 2009. Niet eerder is in ons land in één jaar zoveel energie verbruikt.
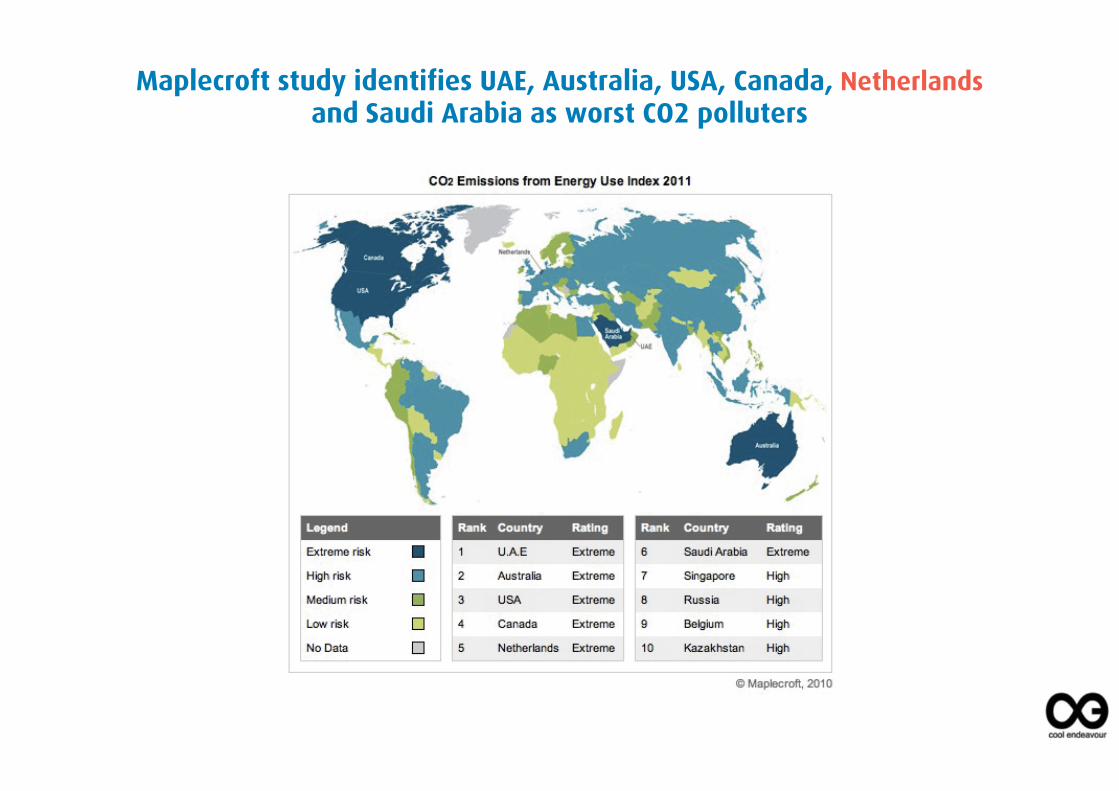
Maplecroft study identifies UAE, Australia, USA, Canada, Netherlands and Saudi Arabia as worst CO2 polluters


[THINK in OPPORTUNITIES]
93% of CEOs believe that sustainability issues will be critical to the future success of their business*
96% of CEOs believe that sustainability issues should be fully integrated into the strategy and operations of a company**
*UN Global Compact-Accenture CEO Study 2010 **McKinsey Global Survey 2010
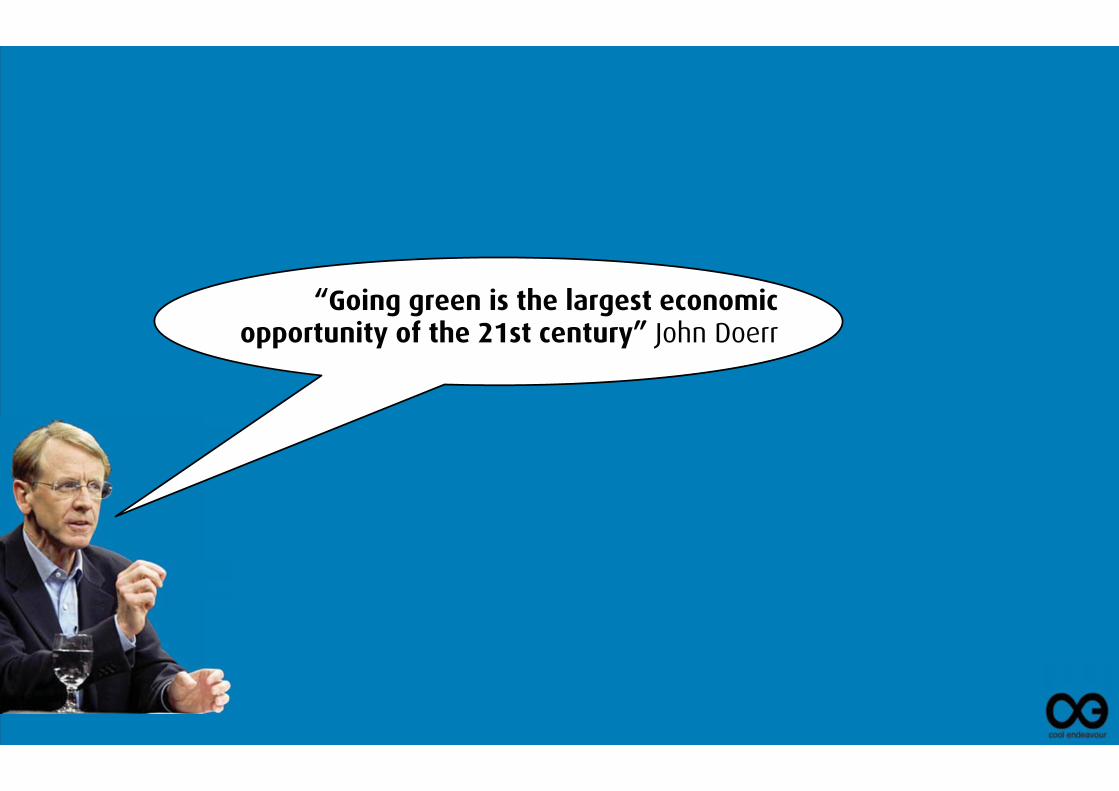
“Going green is the largest economic opportunity of the 21st century” John Doerr

UI
TE
DN
IT
ED
NT
IO
NA
TI
OS
EN
VI
RO
NM
EN
TN
PR
OG
RA
MM
EM
E
GLOBAL TRENDS INR ABLEENEWA ENERGYI ENTNVESTM 2011
Trends and AnAnala ysis of e Financing IsIssusuese in th
ble Energyoff R Renenewab
New York, 12 January 2012
Global investment in clean energy reached a new record of $260bn in 2011, up 5% on 2010 and almost five times the total of $53.6bn in 2004.
KEY FINDINGS

CDP Global 500 Report 2011Accelerating Low Carbon Growth
On behalf of 551 investors with assets of US$71 trillion
Report written for Carbon Disclosure Project by:
Carbon Disclosure [email protected]+44 (0) 20 7970 5660www.cdproject.net
CDP Global 500 Report 2011Accelerating Low Carbon Growth
On behalf of 551 investors with assets of US$71 trillion
Report written for Carbon Disclosure Project by:
Carbon Disclosure [email protected]+44 (0) 20 7970 5660www.cdproject.net
KEY FINDINGS
Companies in the 2011 Carbon Disclosure Leadership Index (CDLI) provide approximately double the average total return of the Global 500 between January 2005 and May 2011.
Global 500 CDLITotal return % (US$) from January 2005 to May 2011
42.71% 82.44%
Source data: Bloomberg
Car battery tycoon Wang Chuanfu from BYD becomes China's richest man
HOW?

STRATEGY

CSR TO CSV
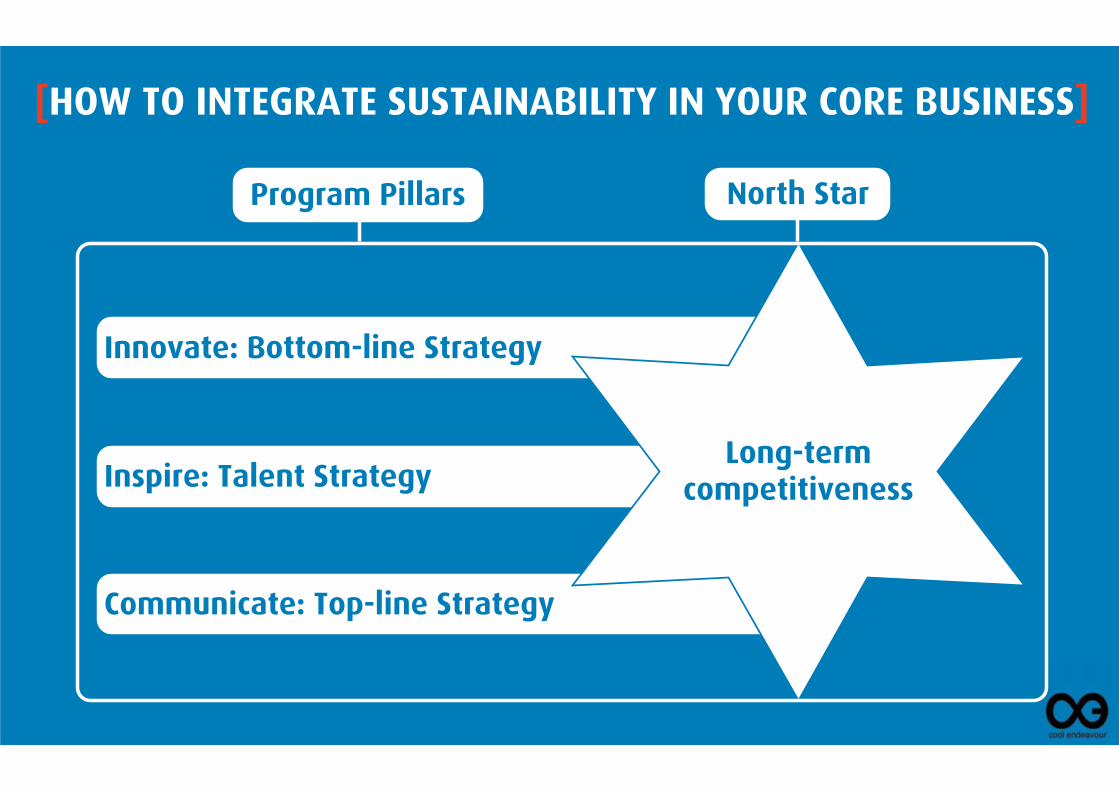
[HOW TO INTEGRATE SUSTAINABILITY IN YOUR CORE BUSINESS]
Program Pillars North StarProgram Pillars
Innovate: Bottom-line Strategy
Inspire: Talent Strategy
Communicate: Top-line Strategy
Long-term competitiveness
North Star
[NORTH STAR]
BEST PRACTICES

“Make cars that never crash and clean the air as they drive”
To inspire and financially support the creation of the next industrial
revolution.
“Every book, ever printed, in any language, all available in less
than 60 seconds”
[INNOVATE]
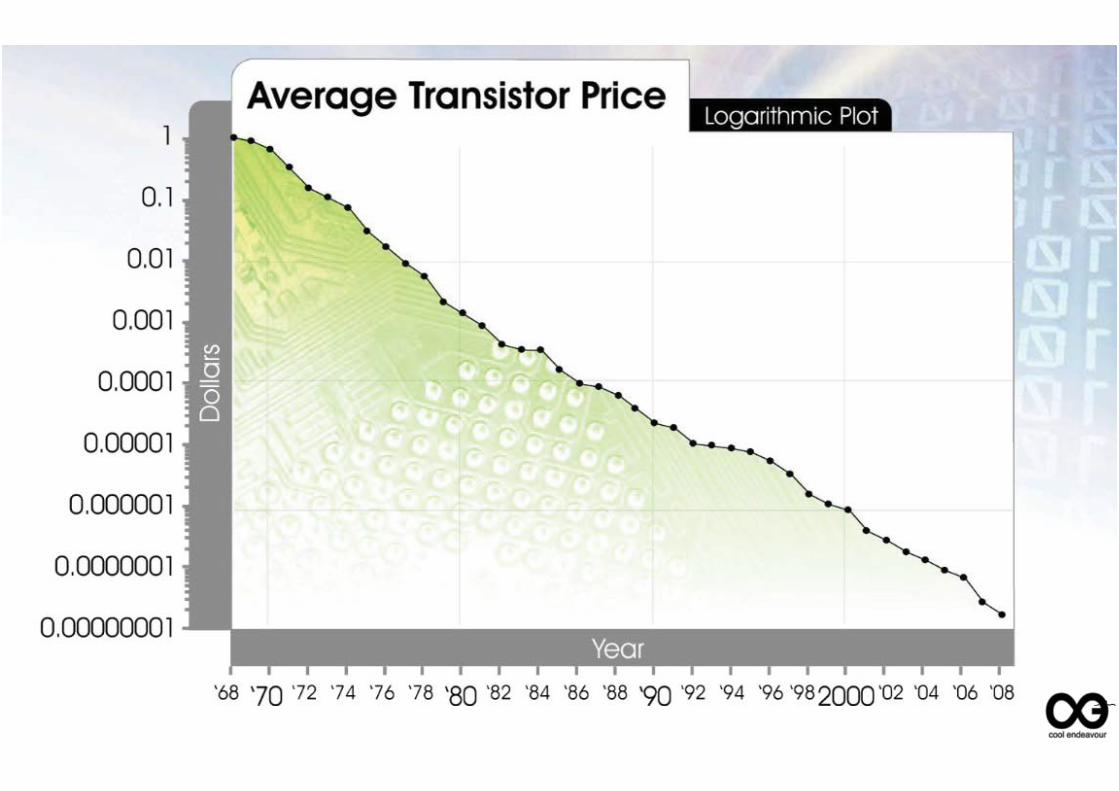
Singularity presentation Ray Kurzweil at Google
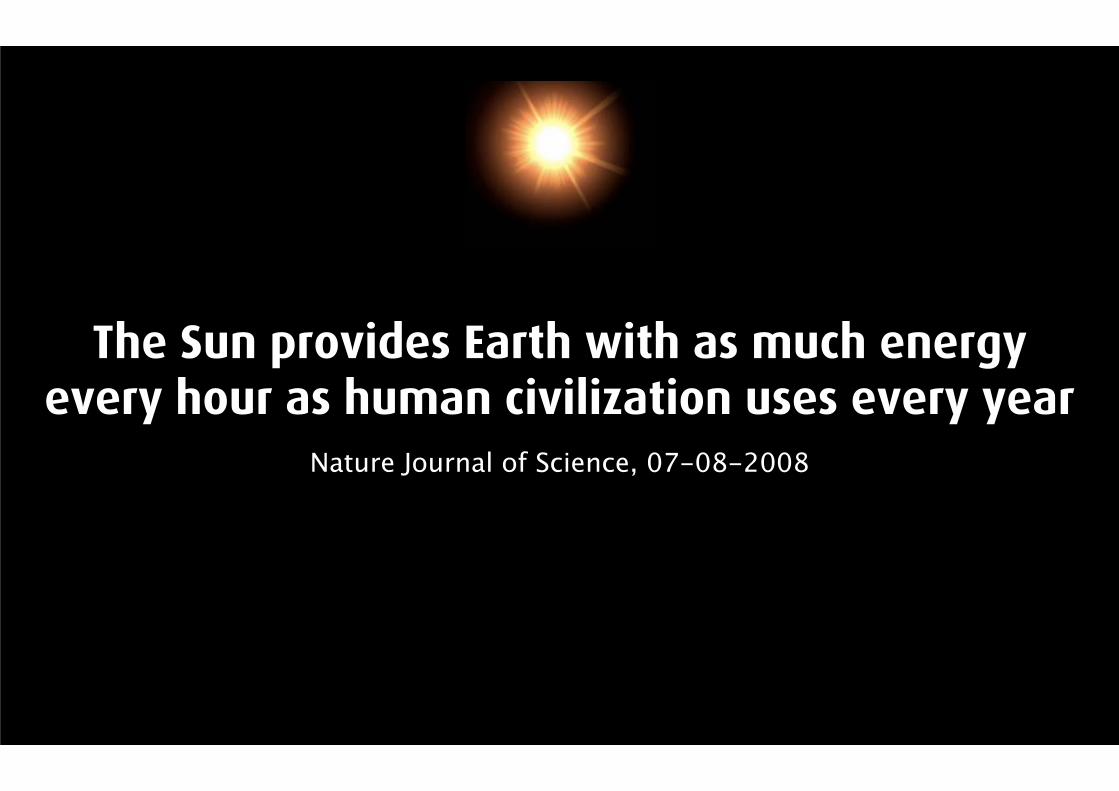
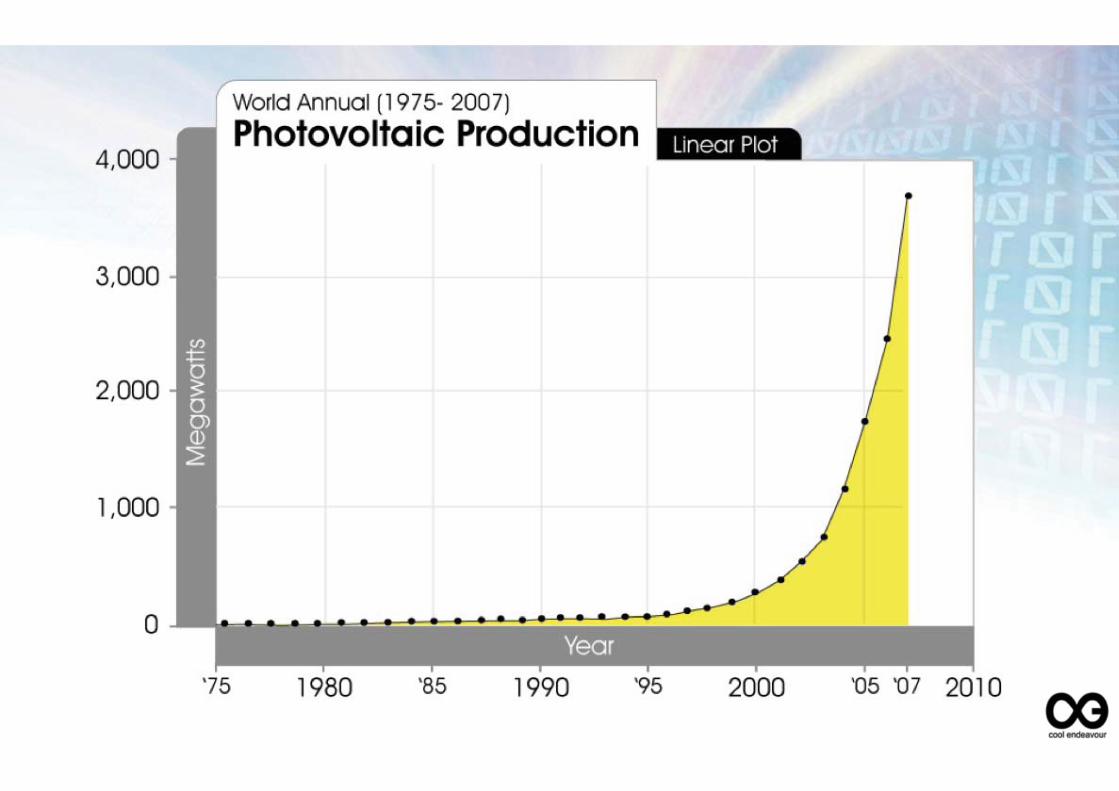
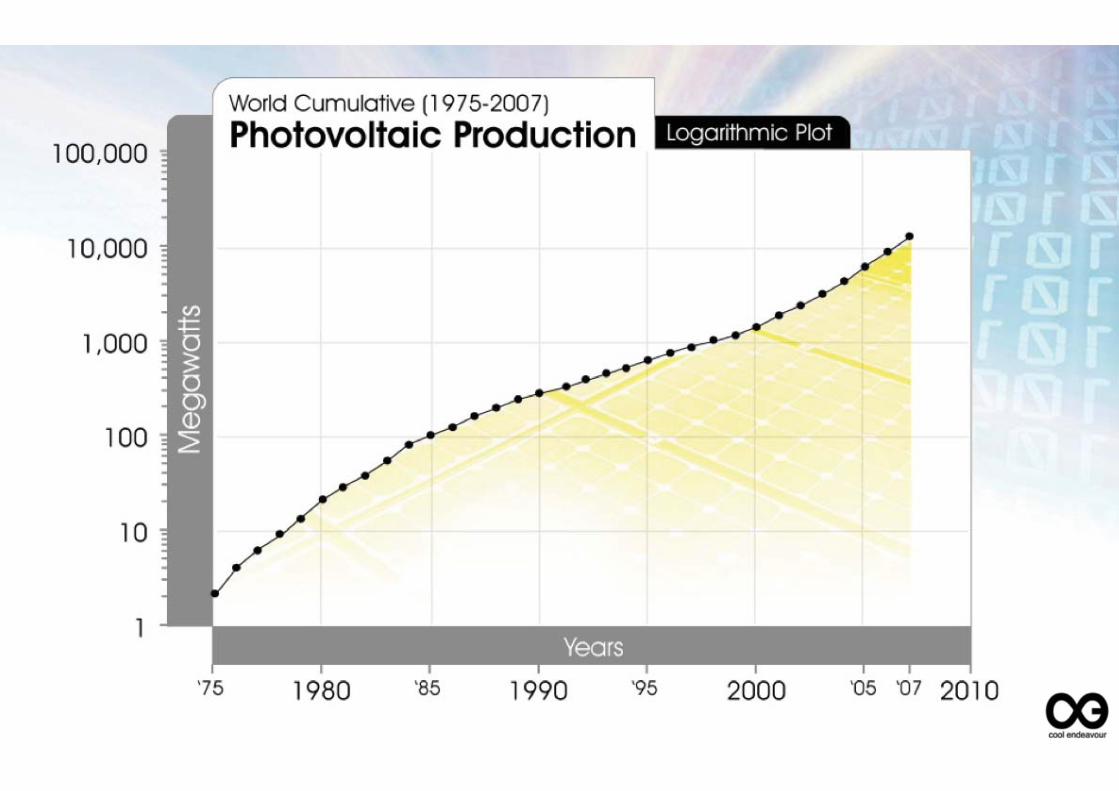
The Sun provides Earth with as much energy every hour as human civilization uses every year
Nature Journal of Science, 07-08-2008


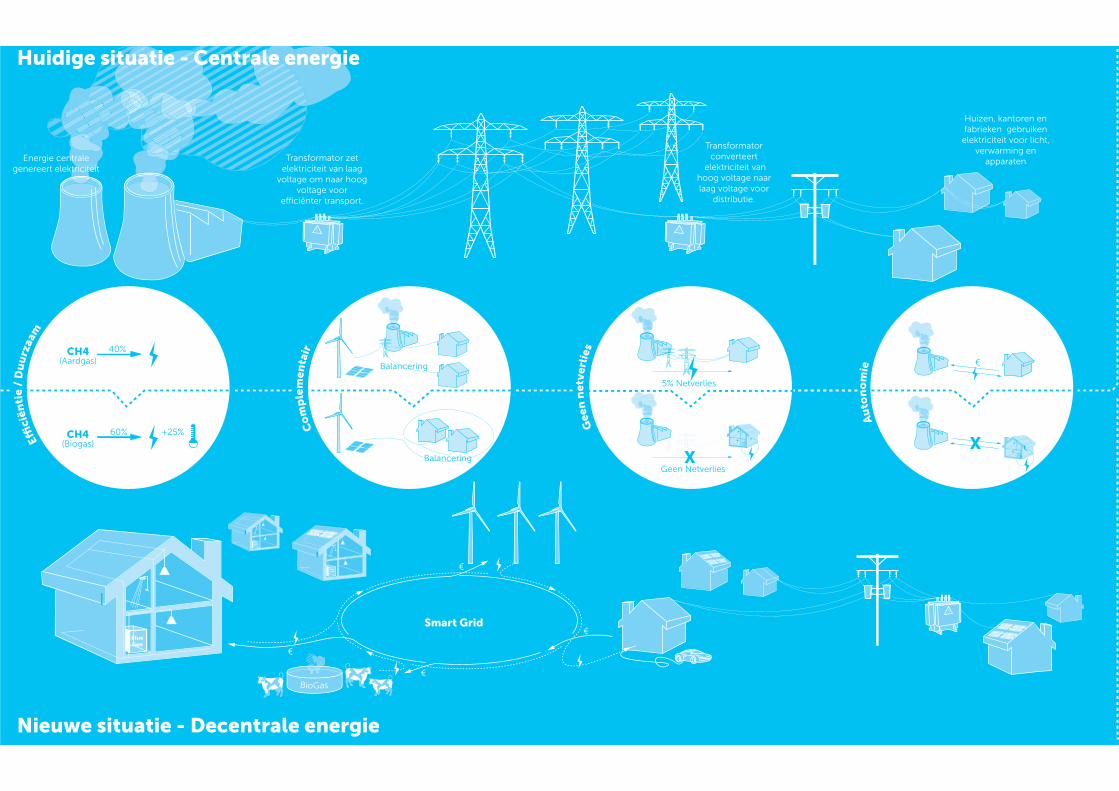
[BUILDING A SHOWCASE OF DECENTRAL POWER GENERATION,
ENERGY MANAGEMENT AND EFFICIENCY]
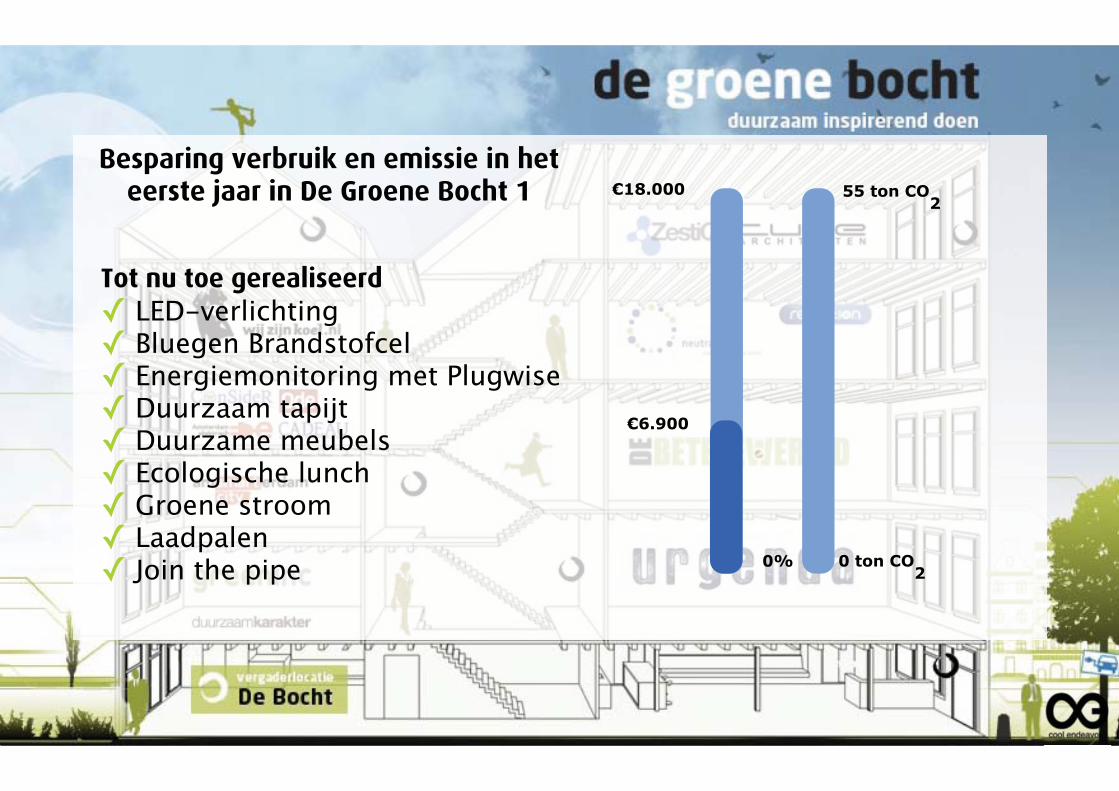
Besparing verbruik en emissie in het eerste jaar in De Groene Bocht 1 €18.000
€6.900
0%
55 ton CO2
0 ton CO2
Tot nu toe gerealiseerd✓ LED-verlichting✓ Bluegen Brandstofcel✓ Energiemonitoring met Plugwise✓ Duurzaam tapijt✓ Duurzame meubels✓ Ecologische lunch✓ Groene stroom✓ Laadpalen✓ Join the pipe

Energiemanagement:✓ Gebouw volledig monitoren✓ Centrale aansturing✓ Individuele aansturing ruimtes met bijv. iPhone
Brandstofcel:✓ Nieuwe technologie op methaan (aardgas of biogas) (DGB eerste in Europa)✓ Vermogen 1.5 kW en 200 liter warm water p/dag.✓ 50% goedkoper / 60% minder CO2 (bij biogas zelfs 0%)✓ Elektrisch rendement van 60% (hoger dan de modernste centrales
LED-verlichting:✓80% besparing ten opzichte van oude situatie met behoud van kwaliteit van licht
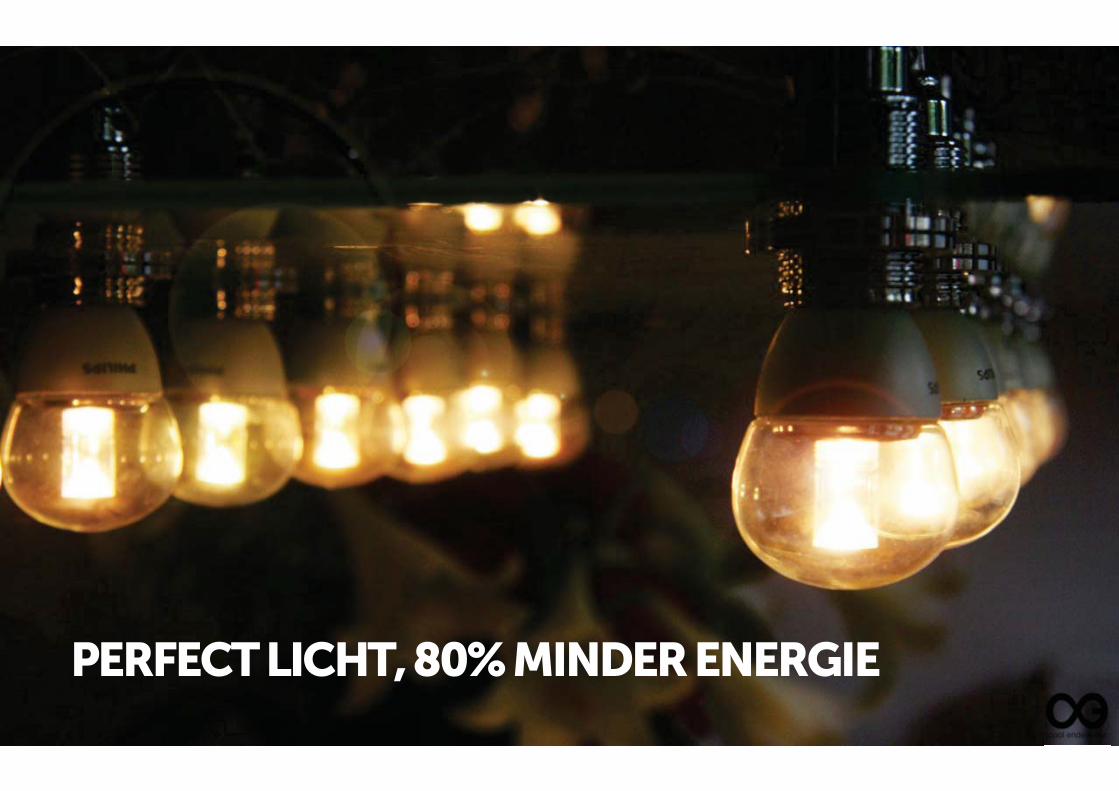
PERFECT LICHT, 80% MINDER ENERGIE

TOTAL COST OF OWNERSHIP GRAFISCH
€-
€50.000,00
€100.000,00
€150.000,00
€200.000,00
€250.000,00
€300.000,00
0 1 2 3 4 5 6 7 8 9 10 11 12 13 14 15 16 17 18 19 20
HUIDIGE SITUATIE
FINANCIEREN
KOOP
Netto financiele besparing: €70.510

Smart GridBlueGen
Huidige situatie - Centrale energie
Nieuwe situatie - Decentrale energie
BlueGen
BlueGen
CH4
CH4
XX
Au
ton
om
ie
Gee
n n
etve
rlie
s
Co
mp
lem
enta
ir
Effici
ënti
e /
Du
urz
aam


�������������� ���������������
[INSPIRE]

PrinciplesThe
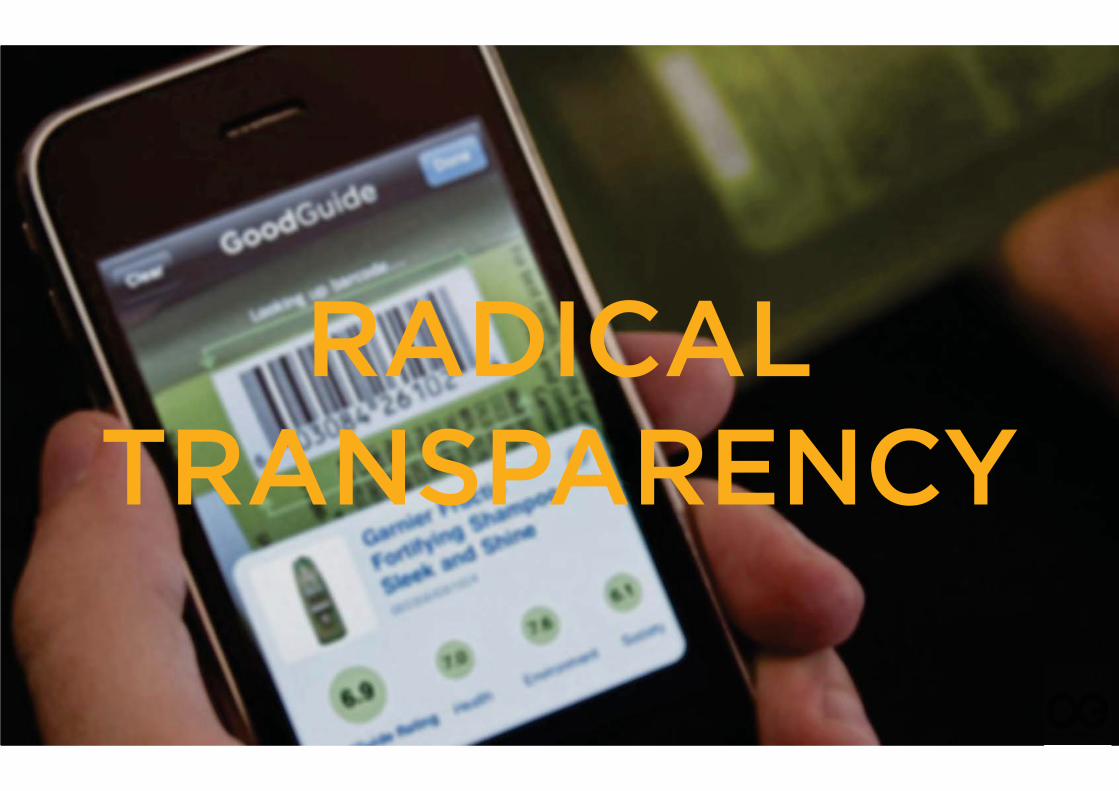
RADICAL TRANSPARENCY
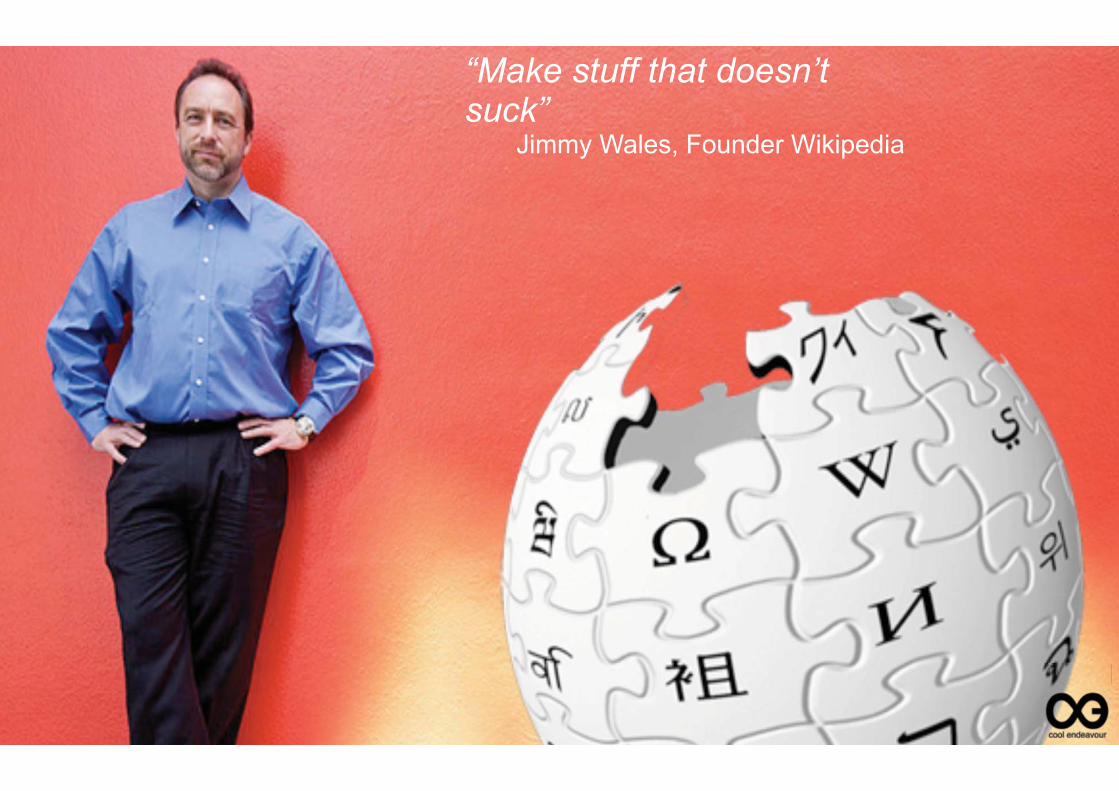
“Make stuff that doesn’t suck”
Jimmy Wales, Founder Wikipedia
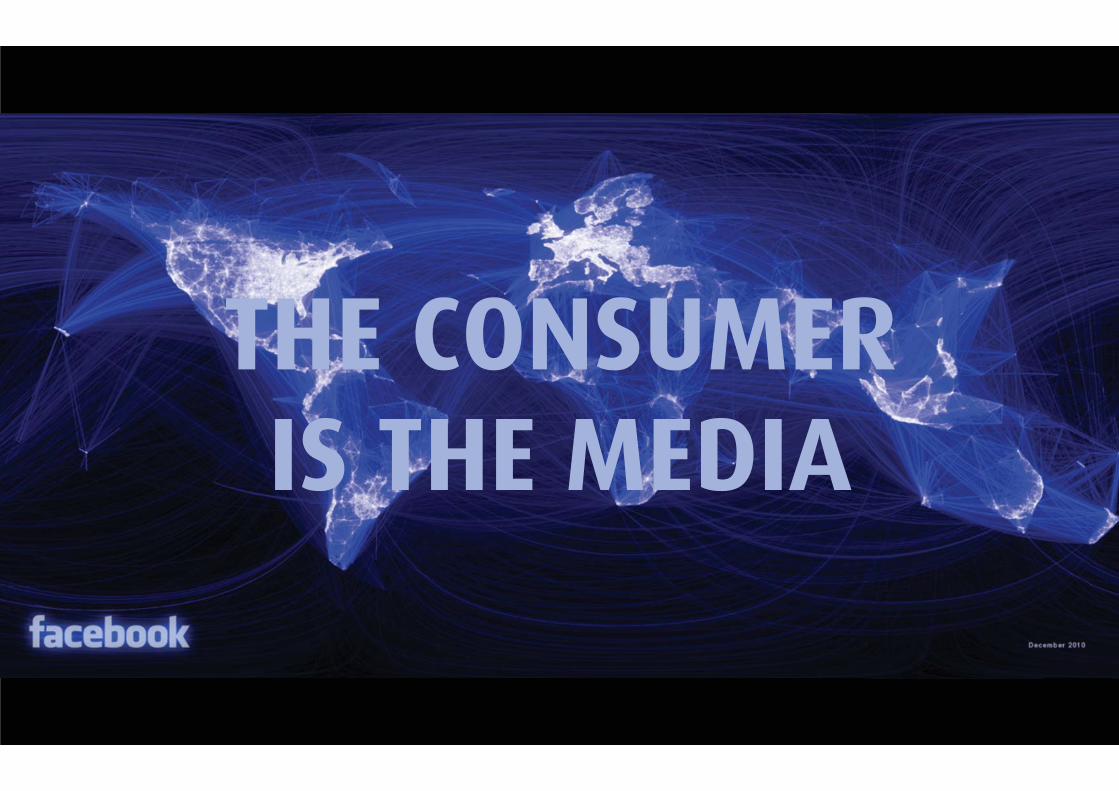
THE CONSUMER IS THE MEDIA


[COMMUNICATE]

4 things to hate about
sustainability communications

1: Being unnecessarily complicated
2: Nagging people
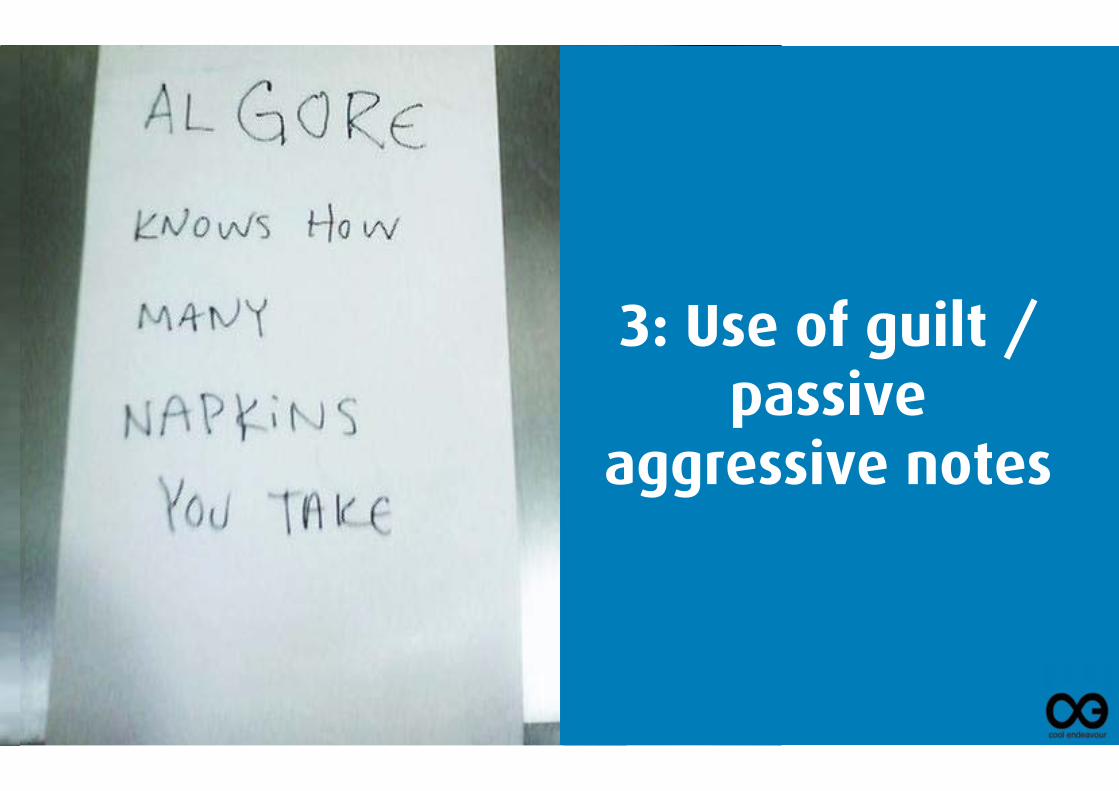
3: Use of guilt / passive
aggressive notes
4. Being Boring

SELL THE SIZZLE

TERUGBIK

VOORUITBLIK

WHAT?
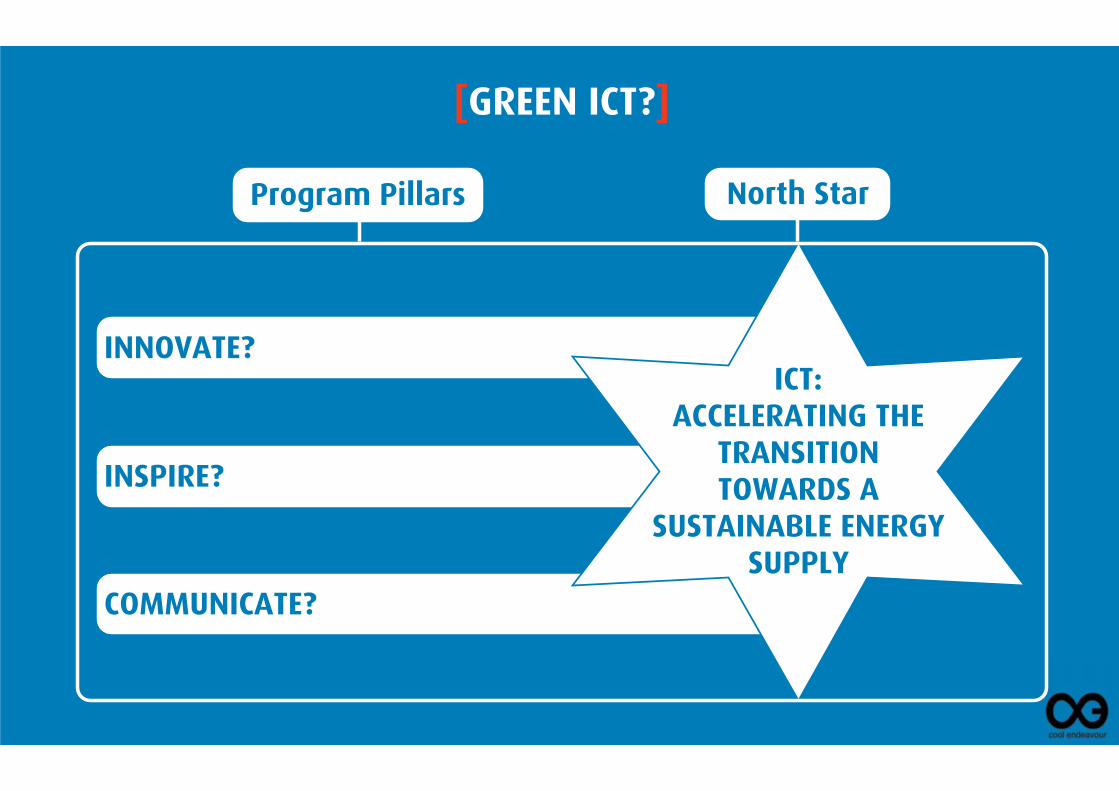
[GREEN ICT?]
Program Pillars North StarProgram Pillars
INNOVATE?
INSPIRE?
COMMUNICATE?
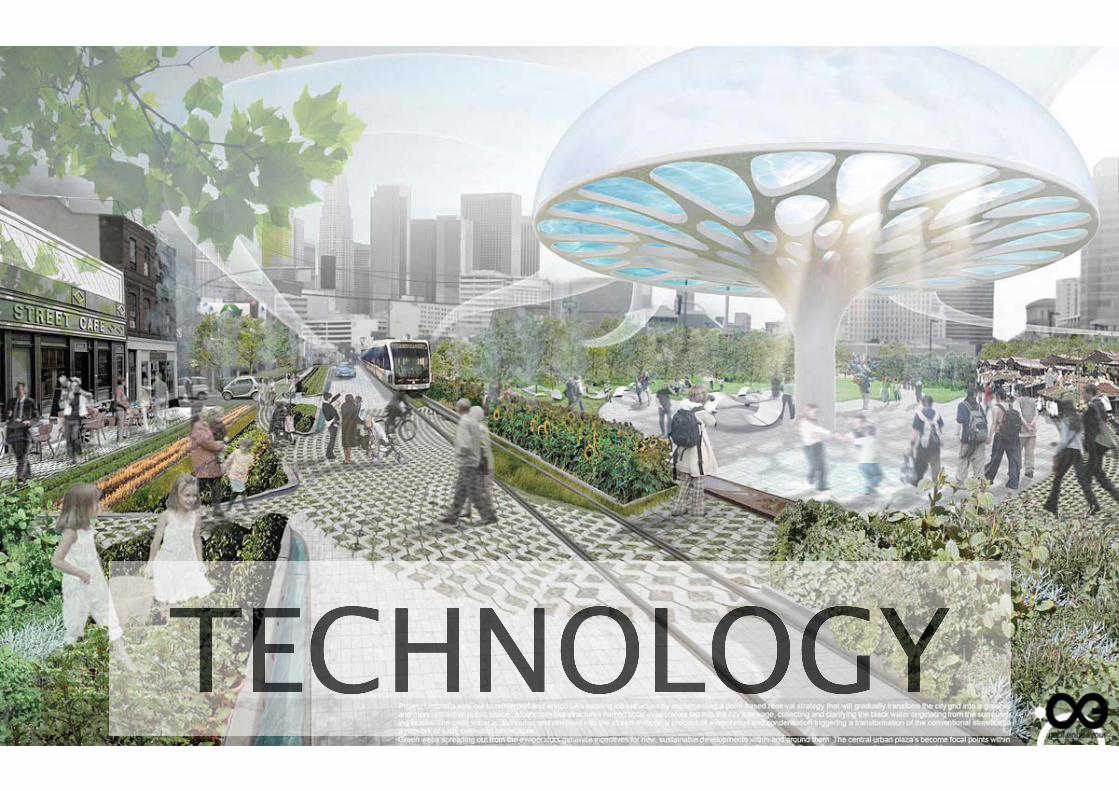
ICT:ACCELERATING THE
TRANSITION TOWARDS A
SUSTAINABLE ENERGY SUPPLY
North Star
[ACTION SPEAKS LOUDER THAN WORDS]

Recommended