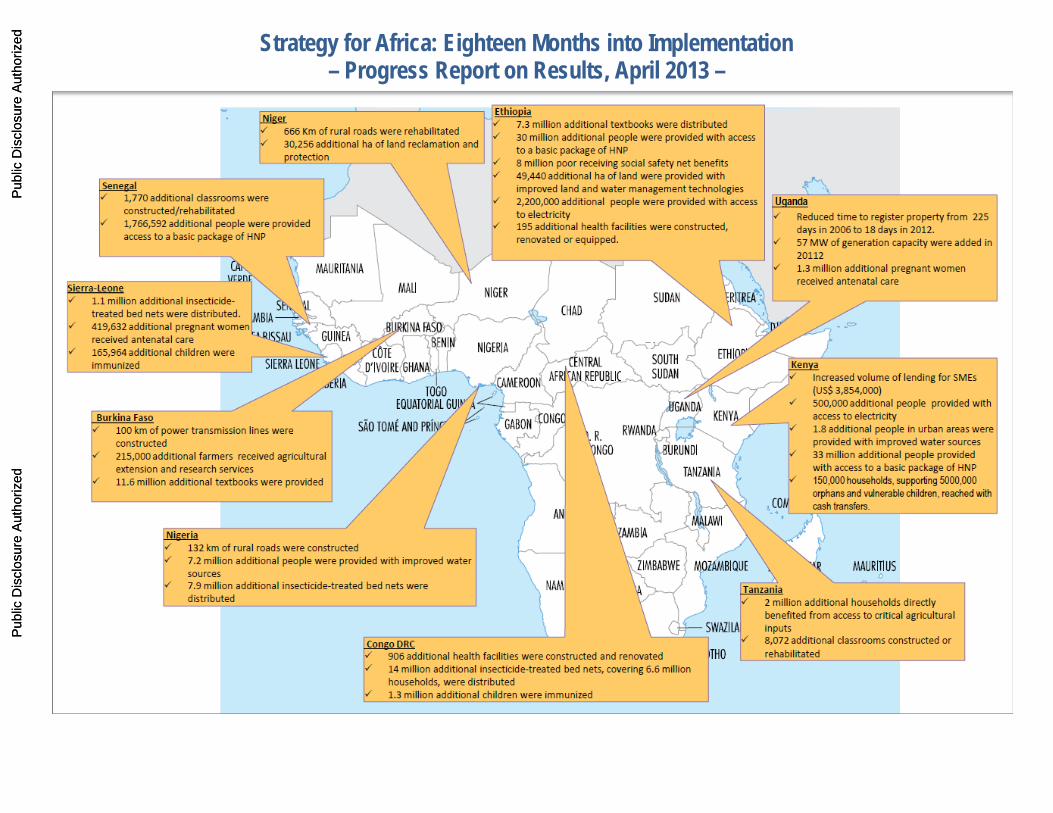
Strategy for Africa: Eighteen Months into Implementation – Progress Report on Results, April 2013 –
Pub
lic D
iscl
osur
e A
utho
rized
Pub
lic D
iscl
osur
e A
utho
rized
Pub
lic D
iscl
osur
e A
utho
rized
Pub
lic D
iscl
osur
e A
utho
rized
Pub
lic D
iscl
osur
e A
utho
rized
Pub
lic D
iscl
osur
e A
utho
rized
Pub
lic D
iscl
osur
e A
utho
rized
Pub
lic D
iscl
osur
e A
utho
rized
1
Africa Results Monitoring Framework (AFRMF) The Africa Strategy includes the Africa Results Monitoring Framework (AFRMF) to monitor progress in results areas relevant to the strategic outcomes based on a set of agreed indicators. The AFRMF is built on the existing Bank information systems and is aligned with the IDA16 results measurement system and the Corporate Score Card. Outcome reporting is organized into a three‐tiered structure to address key results and performance aspects along the results chain. Tier 1: Regional Progress on Key Regional Development Outcomes. This tier represents the
high‐level development outcomes that countries in Africa are achieving. Bank-supported programs as well as government and other development partners contribute to the achievement of these country development outcomes, such as MDGs and GDP growth. This tier provides a context for the Bank’s efforts in development in Africa. Progress reporting on these regional, high-level outcomes depends on statistical sources of data which becomes available only on an annual or even multi-year basis. Given that the strategy was launched in March 2011, it is too early to report progress for most of the Tier 1 indicators.
Tier 2: Outputs and Outcomes Supported by Bank Operations. This tier measures the Bank’s contribution to regional development outcomes and focuses on sector outputs and outcomes supported by Bank operations. Data collected through project ISRs using standardized core sector indicators or other customized project indicators are used to report on results in this tier. Contents of this tier are also accessible online at http://RIMsys. Results in this tier will contribute to the achievement of the long-term regional development outcomes (Tier 1 indicators). The results indicators were developed in consultation with sector teams so as to ensure specific linkages to the strategic priorities and the availability of reliable data (mostly from ISRs) for reporting progress.
Tier 3. Organizational and Development Effectiveness. This tier focuses on the quality of the Bank’s portfolio and services enabling effective delivery of operations and their intended development objectives.
This 18-month results update contains a brief summary of results and a full update on the Results Framework in table format. The brief summary of results in the next section focuses on Tier 2 indicators, i.e. results supported by Bank operations and other activities, as well as Tier 3 indicators, i.e. organizational and development effectiveness. The results table covers all the three tiers. The Africa Strategy continues to make steady progress toward several of its anticipated outputs and outcomes and most of the Tier 2 indicators continue to show a positive upwards trend in 2012. While Tier 2 indicators rely on twice-yearly updates of the project’s Implementation Status and Results Report (ISR), data for many project indicators are updated only once a year. Due to these limitations, progress under the Tier 2 indicators may be under-reported.
2
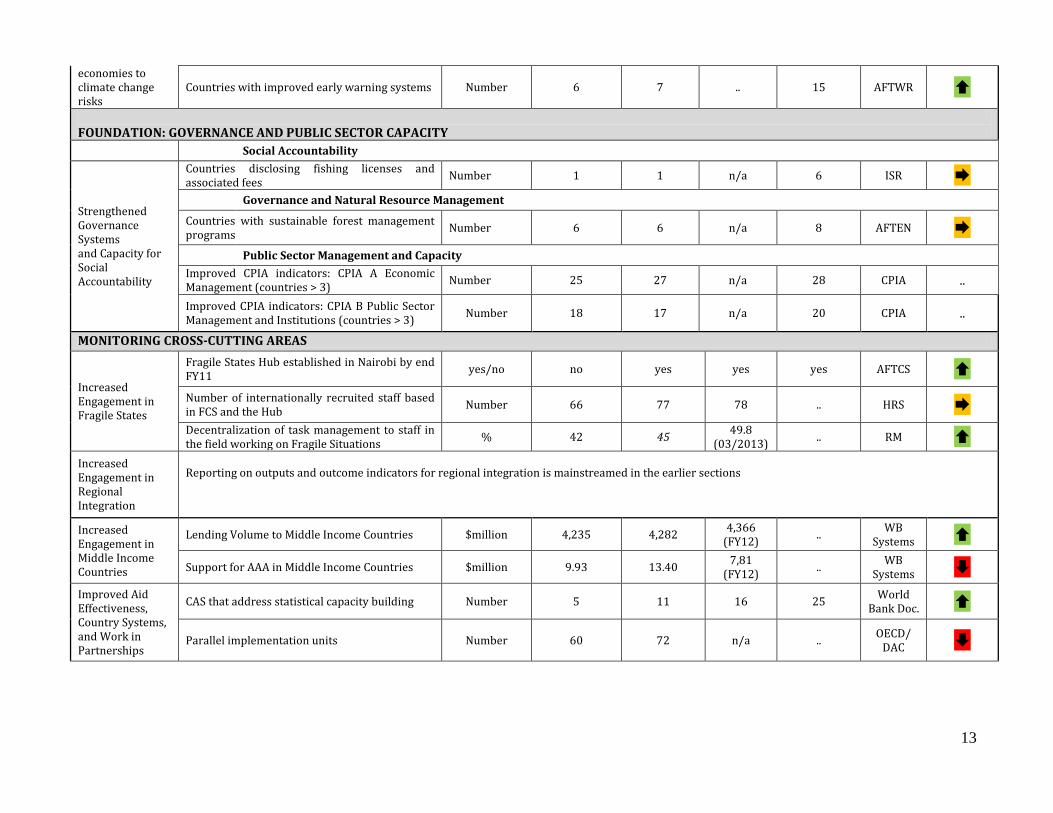
The Foundation: Governance and Public Sector Capacity The strategy focuses on building public sector management capacity, strengthening incentives within the civil service, and improving governance on the demand as well as the supply side. Progress in the area of Public Sector Management and Capacity is measured by improvement in the Economic Management and Public Sector Management CPIA indicators. From 2010 to 2011, the number of countries with CPIA Economic Management above 3 has increased from 25 to 27 showing some improvement.
Strategy Pillar One: Competitiveness and Employment
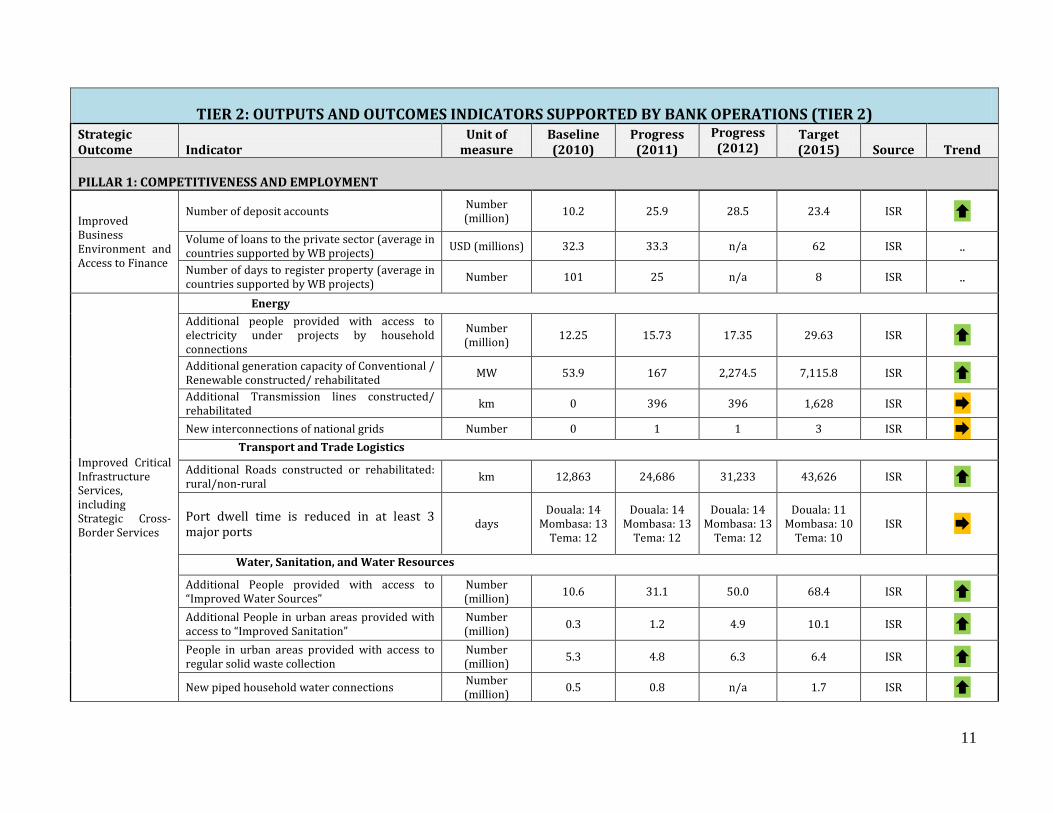
Improving the Business Environment and Access to Finance is critical in achieving sustained outcomes in competitiveness and employment at the regional level. One key aspect of improving the business environment is streamlining the processes to register property. Bank projects have been instrumental in reducing the average number of days to register property across targeted countries from an average of 101 days in 2010 to 25 days in 2011, thus being on track to reach the target of 8 days in 2015. Similarly, the strategy has made continued progress in increasing the number of deposit accounts in targeted countries, from 10.2 million in 2010 to 25.9 million in 2011 and 28.5 million in 2012, surpassing the original target of 23.4 million accounts. These are promising steps in helping to increase the share of formally banked population on the continent. Improved Infrastructure, including Strategic Cross‐Border Services. The first 18 months of implementing the new Strategy for Africa showed largely positive signs of improving critical infrastructure services. - Energy. While most energy indicators show progress, they are advancing at a pace that
continues to be too slow to achieve the 2015 targets. Additional household connections have shown steady progress since 2010, from 12.3 million people having access to electricity to 15.7 million in 2011 and 17.4 million in 2012. However, this is not yet supported by enough increase in generation capacity to serve the growing demand; similarly, interconnection of national grids through regional transmission lines happens only at a very slow pace, thus delaying regional power trade. Nevertheless, it is expected to see steep progress in generation capacity with some large projects reaching implementation stage. For instance, the Board of Directors approved in FY12 a $ 132 million loan for the Cameroon
The Kenya Private Sector Power Generation Support Project (P122671) benefits from complementary World Bank Group support, in the form of International Development Association (IDA) and Multilateral Investment Guarantee Agency (MIGA) guarantees and International Finance Corporation (IFC) financing to expand power supply and generation to Kenyan beneficiaries, including households, commercial entities and industry, by mobilizing long-term financing for private sector investment in urgently needed power generation capacity. The project consists of three thermal power generation projects and one geothermal project that have all been developed and financed by the private sector. In just over a year since approval by the World Bank Board of Executive Directors, and under challenging global financial market conditions, three of the four Independent Power Producer (IPP) projects have achieved financial closure and the first projects are under construction.
3
Lom Pangar Hydropower Project, which, together with co-financiers, aims at increasing generation capacity by 120 MW. In addition, innovative Private-Public Partnership approaches are showing promising results, such as the Kenya Private Sector Power Generation Support Project (see boxed text).
- Transport. In 2012, an additional 6547km (2011: 11,823 km) of rural and non-rural roads were constructed or rehabilitated, thus putting this indicator on track of achieving its 2015 target. Even though the port‐dwell‐times for three targeted ports of Douala, Mombasa and Tema have yet to be reduced, project implementation progress gives reason to expect that the targets will be met.
- Water and Sanitation. Indicators in this area continue to show strong performance and the region was able to revise the 2015 targets upwards for people provided with access to “Improved Water Sources” to 68.4 million. In FY12, this indicator reported to have reached 50 million people. Similar strong performance was seen for the total of additional people with access to “Improved Sanitation”. The number of people in urban areas with access to regular solid waste collection, was 6.3 million in 2012 compared to 4.8 in 2011.
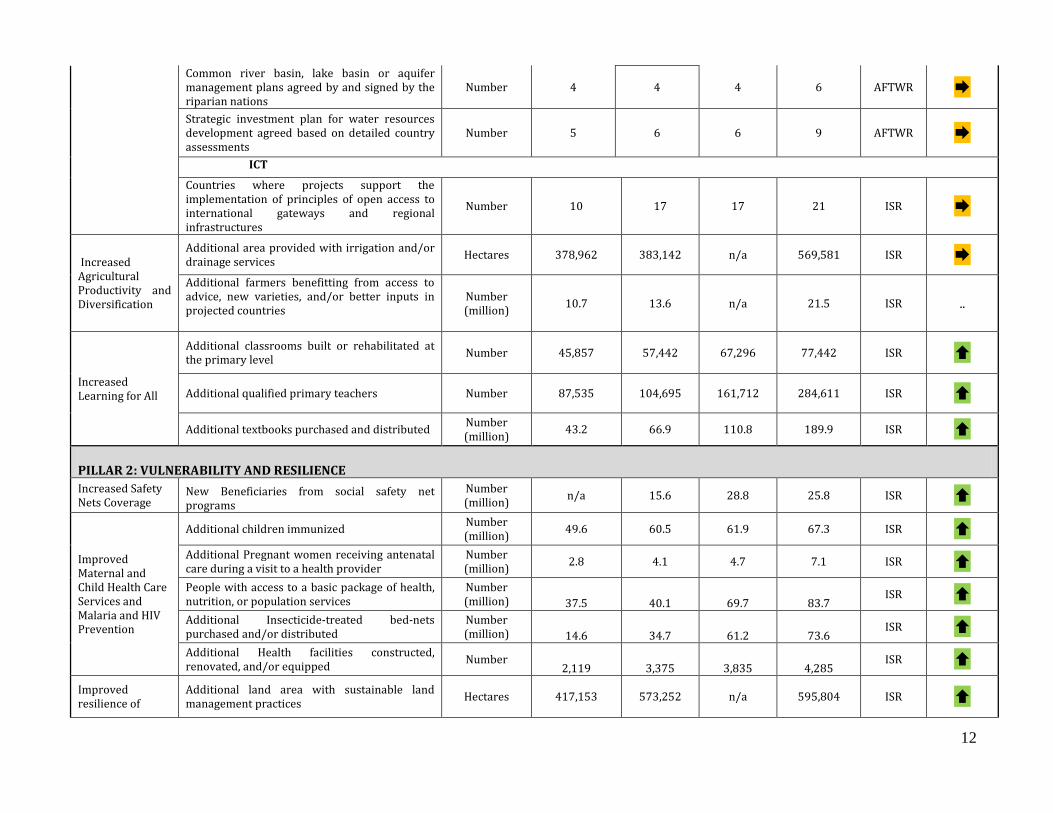
- ICT. While significant progress has been achieved for ICT in 2011, results have stagnated in 2012. In 2011 the number of countries where projects support the implementation of principles of open access to international gateways and regional infrastructures has grown from 10 to 17. No additional countries were added in 2012.
Increased Learning for All. The Africa Strategy recognizes that increasing Africa’s competitiveness and employment hinges on a skilled workforce. Building on the success with access to primary education, the strategy emphasized the need to improve overall education quality. With the support of Bank-financed projects, the number of classrooms built or rehabilitated at the primary level increased from a baseline of 45,857 in 2010 to 57,442 in 2011 and 67,296 in 2012. There is a high likelihood of achieving the target of 77,442 in 2015. The Strategy has also well progressed in providing support to targeted client countries to reach the goal of having some 280,000 additionally qualified teachers in 2015: From a baseline of 87,535 in 2010, this number has already increased to 161,712 in 2012. In addition, Bank supported projects also assisted client countries to purchase and distribute 67.6 million additional textbooks since 2010.
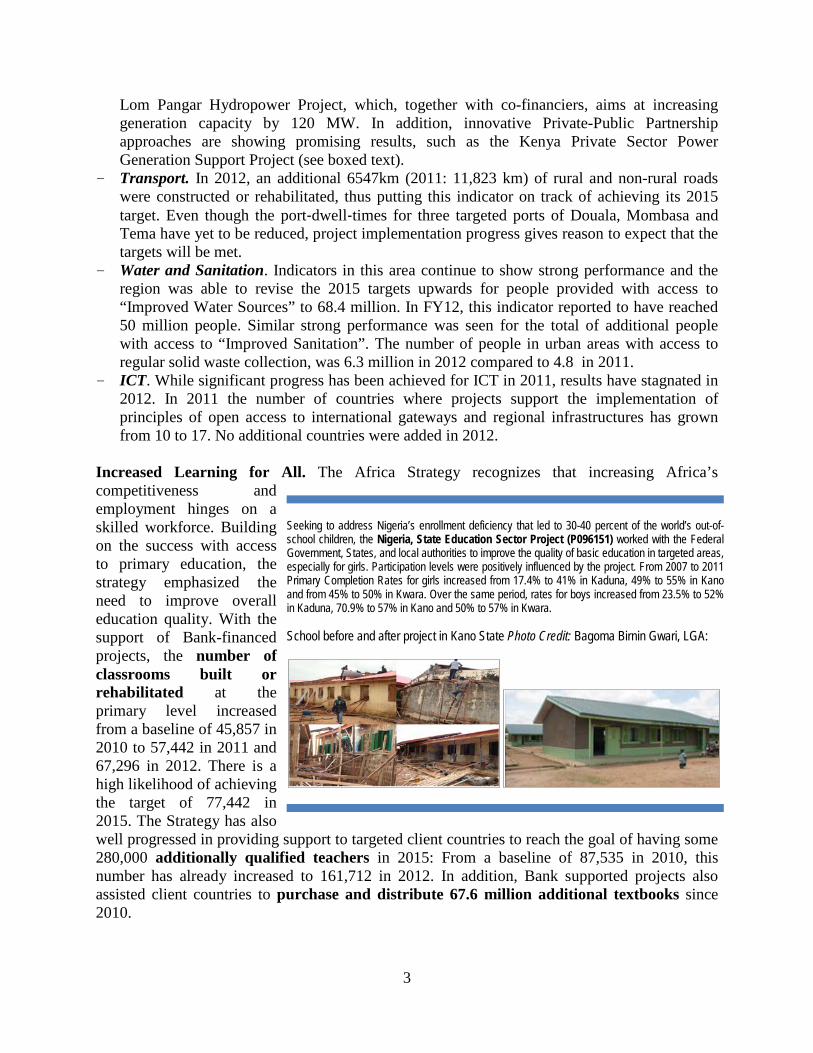
Seeking to address Nigeria’s enrollment deficiency that led to 30-40 percent of the world’s out-of-school children, the Nigeria, State Education Sector Project (P096151) worked with the Federal Government, States, and local authorities to improve the quality of basic education in targeted areas, especially for girls. Participation levels were positively influenced by the project. From 2007 to 2011 Primary Completion Rates for girls increased from 17.4% to 41% in Kaduna, 49% to 55% in Kano and from 45% to 50% in Kwara. Over the same period, rates for boys increased from 23.5% to 52% in Kaduna, 70.9% to 57% in Kano and 50% to 57% in Kwara. School before and after project in Kano State Photo Credit: Bagoma Birnin Gwari, LGA:
4
Increased Agricultural Productivity and Diversification were identified by the Africa Strategy as key areas to improve competitiveness and employment. According to the Update on Agricultural Development in Sub-Saharan Africa produced for the Spring Meetings 2013 by the Sustainable Development Department in the Africa Region, ”of the 183 million hectares (ha) of cultivated land in SSA, 95 percent is rain-fed and less than 5 percent benefits from some type of Agricultural Water Management (AWM)—by far the lowest irrigation development rate of any region in the world.” The Bank supported client efforts by helping to increase the area provided with irrigation and/or drainage services from 378,732 hectares in 2010 to 383,142 hectares in 2011. Progress in this area has registered at a slow pace and strong efforts are necessary to achieve the 2015 target of some 570,000 ha. Similarly, progress in reaching farmers with access to advice, new varieties, and/or better inputs in projected countries, is slow, and strong implementation efforts will be necessary to achieve target in 2015 - by 2011 an additional 13.6 million farmers were reached against a target of 21.5 million farmers in 2015.
Strategy Pillar Two: Vulnerability and Resilience Increased Social Safety Nets Coverage. Countries in the Africa Region are subject to a number of shocks such as droughts, floods, food shortages and macroeconomic crises and diseases like malaria and HIV/AIDS continue to heavily impact on human capacity. Reducing these vulnerabilities and building resilience to these shocks is therefore a prominent area of the Africa Strategy and is reflected under pillar 2. In this spirit, Bank-financed projects successfully continued to broaden the coverage of people with safety nets and the number of new beneficiaries from social safety net programs has risen to 15.6 million people in 2011 to 28.8 million in 2012. Improved Maternal and Child Health Care Services and Malaria and HIV Prevention. Despite the progress made over the past 15 years, Africa still faces large challenges with respect to meeting the MDGs and continues to see some of the highest maternal and under-five mortality rates worldwide. For instance, in 2011, out of 1000, 109 did not live to their fifth birthday. Under the new strategy, Bank-financed operations focus on improved service delivery in order to influence these development outcomes. By end 2012, the Bank has supported the construction, renovation and equipment of 3,835 additional health facilities over a baseline of 2,119 in 2010. The significant progress in providing additional people with access to a basic package of Health, Nutrition and Population Services continued, and with Bank-financing, the number of people with access increased from a baseline of 37.5 million in 2010 to 69.7 million people in 2012. The Bank has also continued to support client countries to purchase and distribute an additional 26.5 million insecticide‐treated bed‐nets in 2012. Further, in 2012, additional 600,000 pregnant women were provided with antenatal care during a visit to a health care provider, through projects supported by the Bank. Progress on this indicator has slowed down compared to 2011, when additional 1.3 million pregnant women were reached by this service, although implementation schedules suggest that the target of reaching an additional 7.1 million pregnant women by 2015 will be achieved. In addition, the Bank’s support enabled clients to immunize additional 1.4 million children in 2012, adding to the substantial increase in 2011, and making progress toward the expected goal of additional 67.3 million children immunized in 2015.
5
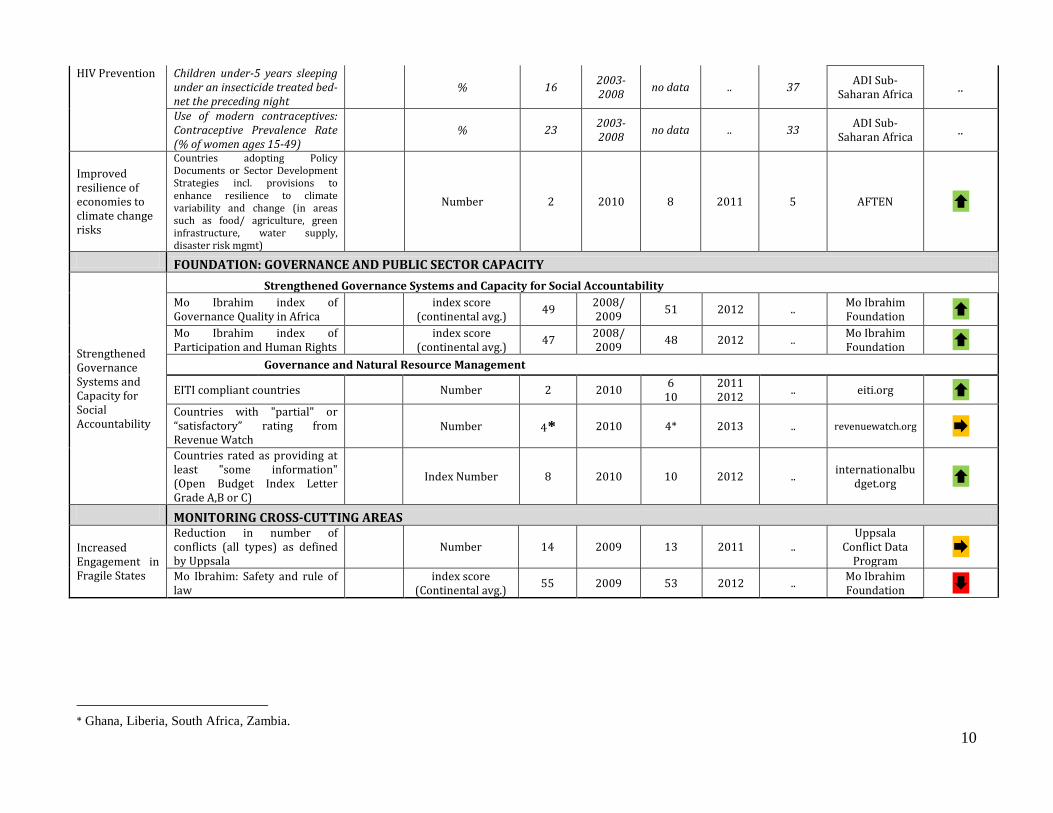
Improved Resilience of Economies to Climate Change Risks. The strategy tracks progress of the support toward improving resilience of economies to climate change risks at the Tier 1 and Tier 2 levels. At the Tier 1 level, the strategy recorded an increase of 6 countries, from 2 in 2010 to 8 in 2011, who have adopted policy documents of sector development strategies to enhance resilience to climate variability and climate change, in areas such as food/agriculture, green infrastructure, water supply, disaster risk management. 2011 is the most recent data point available and the 8 countries are: Burkina Faso, Gabon, Mali, Niger, Ghana, Uganda, Ethiopia, and Togo. While there is no updated information available on the increase in area with sustainable land management practices, the previous trend (from 147,153 ha in 2010 to 573,252 ha in 2011) suggests that the strategy will be able to meet its 2015 target through Bank supported projects. While the previous Strategy update was able to report one additional country with improved early warning systems, bringing the total number of countries with improved early warning systems to 7 (Mozambique, Ethiopia, Sudan, Togo, Kenya, Tanzania, and Uganda), progress on this indicator seems slow. Additional effort will be necessary to achieve the target of 15 countries by 2015. It is noteworthy however that recently approved operations in the area of climate change (most notably the first Climate Change DPO for Mozambique, or the Multi-Sector Emergency Recovery Project for Madagascar with mainstreamed disaster risk management activities) underscore the focus on the climate change agenda in the Africa Region.
Cross Cutting Areas The Africa Strategy Monitoring System tracks progress in four cross cutting outcome areas: (i) Increased Engagement in Fragile States, (ii) Increased Engagement in Regional Integration (results monitoring in the areas Power, Transport and ICT mainstreamed in the earlier sector results sections above), (iii) Increased Engagement in Middle Income Countries, and (iv) Improved Aid Effectiveness, Country Systems, and Work in Partnerships.
Horn of Africa Emergency Health and Nutrition Project (P127949)
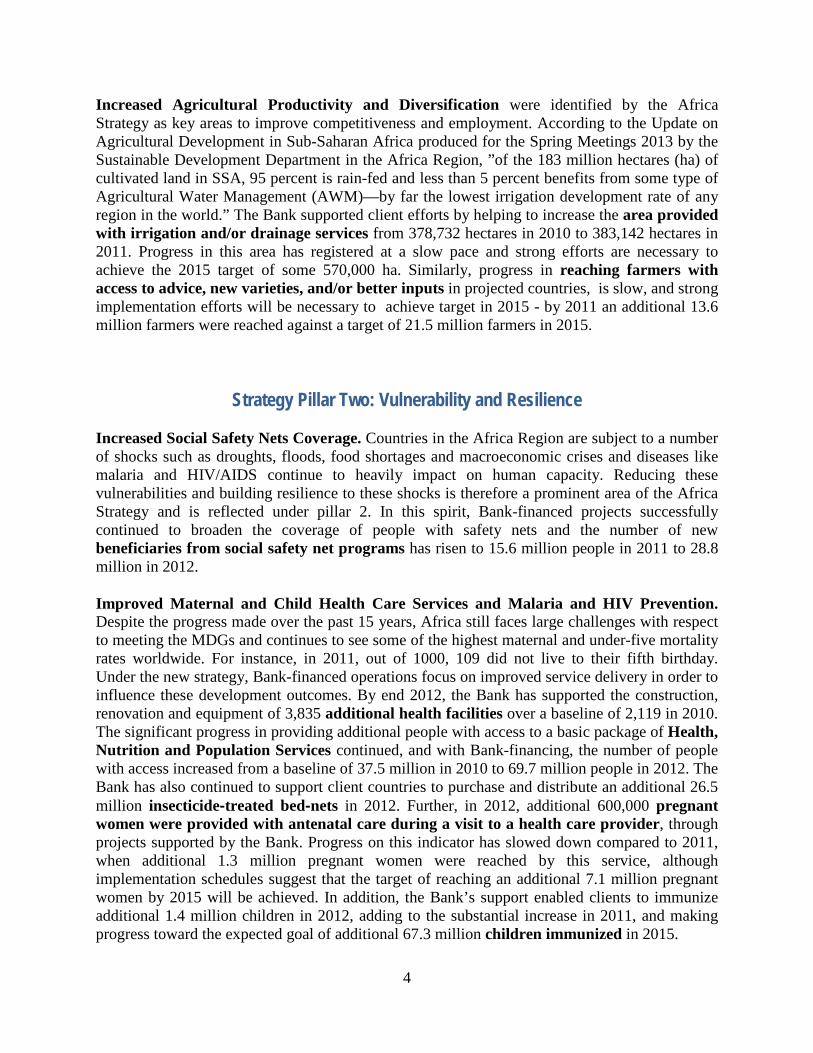
In response to a crippling humanitarian crisis in the Horn of Africa and the corresponding outpouring of Somali refugees, food security and health were supported in the world’s two largest refugee camps, Dabaab in Kenya and Dollo Ado in Ethiopia. IDA contributed $30 million to support UNHCR’s delivery of emergency services, benefitting over one million individuals. Over 76,000 children were treated for severe malnutrition and 113,000 pregnant and lactating women received food or micronutrient supplements.
Dadaab Refugee Camp in Kenya Photo Credit: WB
Results Between September 2011 and September 2012, the project achieved the following results (aggregate data for Kenya and Ethiopia refugee camps): • Over one million direct project beneficiaries
(of which 50 percent are female) • Over 200,000 children (6-59 months)
received a dose of Vitamin A supplements • Over 76,000 children were treated for
severe acute malnutrition • Over 113,000 pregnant and lactating
women received food or micronutrient supplements
• Over 135,000 children under five years were treated for acute respiratory infections
• Over 57,000 children (6-59 months) immunized against measles
• Over 15,000 latrines constructed or renovated for improved sanitation services
• Over 60,000 children under five years were treated for watery diarrhea
6
Increased Engagement in Fragile States. The Bank has established a Fragile States Hub in Nairobi in 2011. It is fully operational, serving fragile countries across all regions. Overall, the number of internationally recruited staff based in FCS and the Hub increased from 66 in 2010 to 77 in 2011 and 78 in 2012. Decentralization of task management to staff in the field working on Fragile Situations increased from 42% (of projects in FCS managed by TTLs based in the field) in 2010 to 45% in 2011 and further to 50% in March 2013. Increased Engagement in Middle Income Countries. The Bank is monitoring support for increased engagement in Middle Income Countries through overall volume of lending. Commitments have steadily increased from $4,235 million in FY10 to $ 4,282 million in FY11 and $4,366 million in 2012. Overall Support for AAA (Bank Budget funded only), has decreased from $9.9 million in 2010 to $7.8 million in 2012, after it spiked in FY11 to $13.4 million. Improved Aid Effectiveness, Country Systems, and Work in Partnerships. The number of CASs that address statistical capacity building increased from 5 in 2010 to 11 in 2011 and 16 in 2012. There is no update from the OECD DAC available at this point on progress in reducing the number of project parallel implementation units. However, there was an increase from 60 in 2010 to 72 in 2011. The Africa region, however, witnessed that parallel implementation units proofed to be critical entities in facilitating continued – if limited – support to a client countries slipping into fragility or uncertain political times requiring to act under the OP 7.30 regime. Madagascar is one example were PIUs enabled critical support to the poorest population.
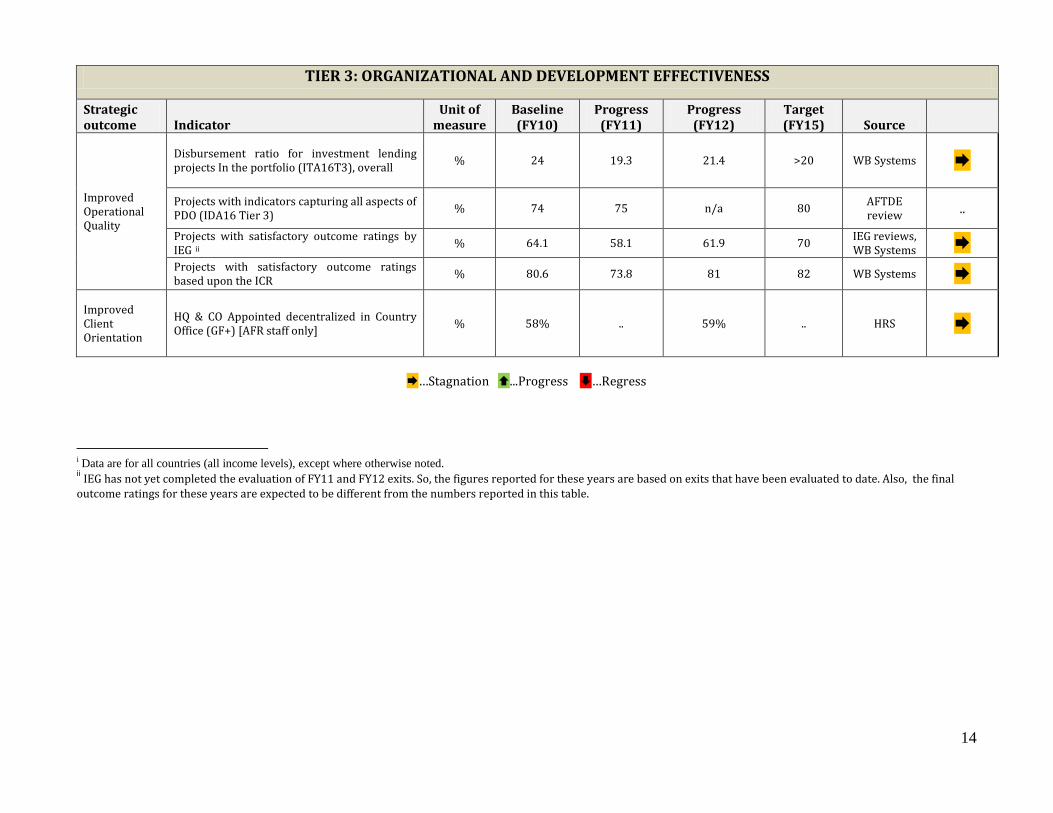
Tier 3: Organizational and Operational Effectiveness The Africa Strategy’s success depends to a large extent on the quality, timeliness and efficacy of the operations mapped to its outcome areas. Therefore the Africa Strategy Results Monitoring System also tracks a few critical process indicators related to operational efficiency. The disbursement ratio for investment lending projects in the Africa portfolio has recovered in 2012 to 21.4 % after it had slumped from 24% in 2010 to 19.4% in 2011, thus exceeding the regional target of 20%. The share of projects with indicators capturing all aspects of the project development objective (PDO) is about 75%. The update for operations approved in FY12 has not been available. The ratio of projects with satisfactory outcome ratings by IEG in FY11 and FY12 are respectively 58.1% and 61.9% compared to 64.1% in FY10. However, some FY11 and FY12 exits are yet to be evaluated by IEG, and the Region expects the final outcome ratings for FY11 and 12 to be in the same range as FY10. In terms of achievement based on self-evaluation, 81% of Implementation Completion Reports (ICRs) reported their outcomes to be satisfactory in FY12, up from 73.8% in FY11 and very close to the FY10 level of 80.6%. Numbers of HQ and CO Appointed staff who are decentralized to country offices remained largely at the same level with 58% in 2010 and 59% in 2012. Starting in FY13, however, the region started rethinking its approach to improving client orientation and associated levels of decentralization in particular.
7
Africa Results Monitoring Framework: Progress and Challenges How does the region monitor Africa Strategy Results? The primary responsibility for reporting on the AFRMF indicators rests with Sector Departments in the AFR Region. Sectors have dedicated Results Focal Points (RFP) to work closely with the Africa Core Operations Services Department (AFTOS)/the Development Effectiveness Unit (AFTDE) and the Chief Economist’s Office to ensure overall coordination. The RFPs are responsible for data collection and aggregation from their sector units, culling data from ISRs and other appropriate sources.. Challenges to Monitoring Results. The Africa Results Monitoring Framework builds on existing monitoring and information systems and largely relies on corporate systems. Most importantly, it captures data on outputs and outcomes supported by Bank operations from project ISRs. Although ISRs are required to be updated twice a year, the results sections of ISRs do not always receive enough attention. Sources of data, units of measurement and frequency of data collection are not always identified or consistent, making it difficult to measure progress and identify trends. While the Corporate Reform and Strategy Department (OPSRS) has put in place the Results Integration and Management System (RIMsys), mapping projects, aggregating information and reporting progress on project indicators remains by and large a manual effort. Data aggregation on the Africa results indicators involves time‐consuming follow up with project task teams. In addition, the system also offers little help to ensure data consistency. Development of the system has taken a long time. Additional efforts are now needed to improve its functionality to allow more effective and timely progress reporting of the Africa Strategy. In the future, the Africa Results Monitoring System will also have to include results and information form the Bank’s rich suite of Knowledge Services in the region.
8
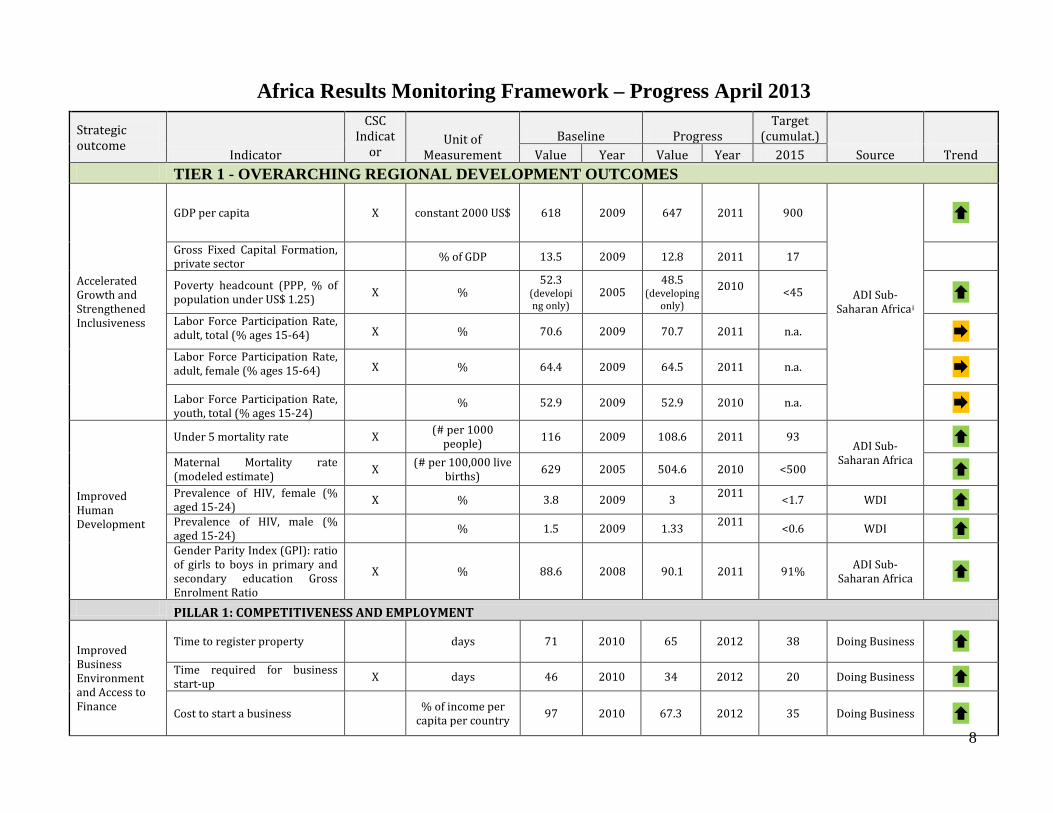
Africa Results Monitoring Framework – Progress April 2013
Strategic outcome
Indicator
CSC Indicat
or Unit of
Measurement Baseline Progress
Target (cumulat.)
Value Year Value Year 2015 Source Trend TIER 1 - OVERARCHING REGIONAL DEVELOPMENT OUTCOMES
Accelerated Growth and Strengthened Inclusiveness
GDP per capita X constant 2000 US$ 618 2009 647 2011 900
ADI Sub-Saharan Africai
Gross Fixed Capital Formation, private sector % of GDP 13.5 2009 12.8 2011 17
Poverty headcount (PPP, % of population under US$ 1.25) X %
52.3 (developing only)
2005 48.5
(developing only)
2010 <45
Labor Force Participation Rate, adult, total (% ages 15-64) X % 70.6 2009 70.7 2011 n.a. Labor Force Participation Rate, adult, female (% ages 15-64) X % 64.4 2009 64.5 2011 n.a.
Labor Force Participation Rate, youth, total (% ages 15-24)
% 52.9 2009 52.9 2010 n.a.
Improved Human Development
Under 5 mortality rate X (# per 1000 people) 116 2009 108.6 2011 93
ADI Sub-Saharan Africa
Maternal Mortality rate (modeled estimate) X (# per 100,000 live
births) 629 2005 504.6 2010 <500 Prevalence of HIV, female (% aged 15-24) X % 3.8 2009 3 2011
<1.7 WDI Prevalence of HIV, male (% aged 15-24) % 1.5 2009 1.33 2011
<0.6 WDI Gender Parity Index (GPI): ratio of girls to boys in primary and secondary education Gross Enrolment Ratio
X % 88.6 2008 90.1 2011 91% ADI Sub-Saharan Africa
PILLAR 1: COMPETITIVENESS AND EMPLOYMENT
Improved Business Environment and Access to Finance
Time to register property
days 71 2010 65 2012 38 Doing Business
Time required for business start-up X days 46 2010 34 2012 20 Doing Business
Cost to start a business % of income per capita per country 97 2010 67.3 2012 35 Doing Business
9
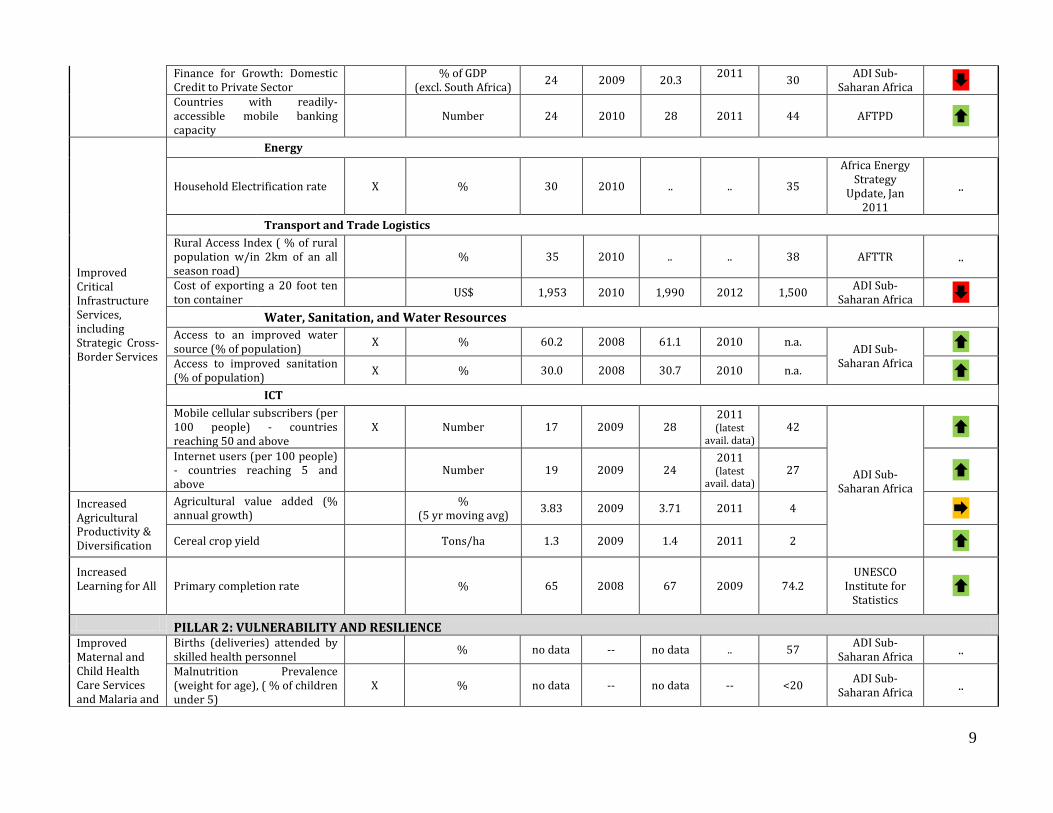
Finance for Growth: Domestic Credit to Private Sector % of GDP
(excl. South Africa) 24 2009 20.3 2011 30 ADI Sub-
Saharan Africa Countries with readily-accessible mobile banking capacity
Number 24 2010 28 2011 44 AFTPD
Improved Critical Infrastructure Services, including Strategic Cross-Border Services
Energy
Household Electrification rate X % 30 2010 .. .. 35
Africa Energy Strategy
Update, Jan 2011
..
Transport and Trade Logistics Rural Access Index ( % of rural population w/in 2km of an all season road)
% 35 2010 .. .. 38 AFTTR ..
Cost of exporting a 20 foot ten ton container
US$ 1,953 2010 1,990 2012 1,500 ADI Sub-Saharan Africa
Water, Sanitation, and Water Resources Access to an improved water source (% of population) X % 60.2 2008 61.1 2010 n.a. ADI Sub-
Saharan Africa
Access to improved sanitation (% of population) X % 30.0 2008 30.7 2010 n.a. ICT Mobile cellular subscribers (per 100 people) - countries reaching 50 and above
X Number 17 2009 28 2011 (latest
avail. data) 42
ADI Sub-Saharan Africa
Internet users (per 100 people) - countries reaching 5 and above
Number 19 2009 24 2011 (latest
avail. data) 27
Increased Agricultural Productivity & Diversification
Agricultural value added (% annual growth) %
(5 yr moving avg) 3.83 2009 3.71 2011 4
Cereal crop yield Tons/ha 1.3 2009 1.4 2011 2
Increased Learning for All
Primary completion rate % 65 2008 67 2009 74.2 UNESCO
Institute for Statistics
PILLAR 2: VULNERABILITY AND RESILIENCE Improved Maternal and Child Health Care Services and Malaria and
Births (deliveries) attended by skilled health personnel % no data -- no data .. 57 ADI Sub-
Saharan Africa .. Malnutrition Prevalence (weight for age), ( % of children under 5)
X % no data -- no data -- <20 ADI Sub-Saharan Africa ..
10
* Ghana, Liberia, South Africa, Zambia.
HIV Prevention Children under-5 years sleeping under an insecticide treated bed-net the preceding night
% 16 2003-2008 no data .. 37 ADI Sub-
Saharan Africa ..
Use of modern contraceptives: Contraceptive Prevalence Rate (% of women ages 15-49)
% 23 2003-2008 no data .. 33 ADI Sub-
Saharan Africa ..
Improved resilience of economies to climate change risks
Countries adopting Policy Documents or Sector Development Strategies incl. provisions to enhance resilience to climate variability and change (in areas such as food/ agriculture, green infrastructure, water supply, disaster risk mgmt)
Number 2 2010 8 2011 5 AFTEN
FOUNDATION: GOVERNANCE AND PUBLIC SECTOR CAPACITY
Strengthened Governance Systems and Capacity for Social Accountability
Strengthened Governance Systems and Capacity for Social Accountability Mo Ibrahim index of Governance Quality in Africa
index score (continental avg.) 49 2008/
2009 51 2012 .. Mo Ibrahim Foundation
Mo Ibrahim index of Participation and Human Rights
index score (continental avg.) 47 2008/
2009 48 2012 .. Mo Ibrahim Foundation
Governance and Natural Resource Management
EITI compliant countries Number 2 2010 6 10
2011 2012 .. eiti.org
Countries with "partial" or “satisfactory” rating from Revenue Watch
Number 4* 2010 4* 2013 .. revenuewatch.org
Countries rated as providing at least "some information" (Open Budget Index Letter Grade A,B or C)
Index Number 8 2010 10 2012 .. internationalbudget.org
MONITORING CROSS-CUTTING AREAS
Increased Engagement in Fragile States
Reduction in number of conflicts (all types) as defined by Uppsala
Number 14 2009 13 2011 ..
Uppsala Conflict Data
Program
Mo Ibrahim: Safety and rule of law
index score (Continental avg.) 55 2009 53 2012 .. Mo Ibrahim
Foundation
11
TIER 2: OUTPUTS AND OUTCOMES INDICATORS SUPPORTED BY BANK OPERATIONS (TIER 2) Strategic Outcome Indicator
Unit of measure
Baseline (2010)
Progress (2011)
Progress (2012)
Target (2015) Source Trend
PILLAR 1: COMPETITIVENESS AND EMPLOYMENT
Improved Business Environment and Access to Finance
Number of deposit accounts Number (million) 10.2 25.9 28.5 23.4 ISR
Volume of loans to the private sector (average in countries supported by WB projects) USD (millions) 32.3 33.3 n/a 62 ISR ..
Number of days to register property (average in countries supported by WB projects) Number 101 25 n/a 8 ISR ..
Improved Critical Infrastructure Services, including Strategic Cross-Border Services
Energy Additional people provided with access to electricity under projects by household connections
Number (million) 12.25 15.73 17.35 29.63 ISR
Additional generation capacity of Conventional / Renewable constructed/ rehabilitated MW 53.9 167 2,274.5 7,115.8 ISR Additional Transmission lines constructed/ rehabilitated km 0 396 396 1,628 ISR
New interconnections of national grids Number 0 1 1 3 ISR Transport and Trade Logistics
Additional Roads constructed or rehabilitated: rural/non-rural km 12,863 24,686 31,233 43,626 ISR
Port dwell time is reduced in at least 3 major ports days
Douala: 14 Mombasa: 13
Tema: 12
Douala: 14 Mombasa: 13
Tema: 12
Douala: 14 Mombasa: 13
Tema: 12
Douala: 11 Mombasa: 10
Tema: 10 ISR
Water, Sanitation, and Water Resources
Additional People provided with access to “Improved Water Sources”
Number (million) 10.6 31.1 50.0 68.4 ISR
Additional People in urban areas provided with access to “Improved Sanitation”
Number (million) 0.3 1.2 4.9 10.1 ISR
People in urban areas provided with access to regular solid waste collection
Number (million) 5.3 4.8 6.3 6.4 ISR
New piped household water connections Number (million) 0.5 0.8 n/a 1.7 ISR
12
Common river basin, lake basin or aquifer management plans agreed by and signed by the riparian nations
Number 4 4 4 6 AFTWR
Strategic investment plan for water resources development agreed based on detailed country assessments
Number 5 6 6 9 AFTWR
ICT
Countries where projects support the implementation of principles of open access to international gateways and regional infrastructures
Number 10 17 17 21 ISR
Increased Agricultural Productivity and Diversification
Additional area provided with irrigation and/or drainage services Hectares 378,962 383,142 n/a 569,581 ISR
Additional farmers benefitting from access to advice, new varieties, and/or better inputs in projected countries
Number (million) 10.7 13.6 n/a 21.5 ISR ..
Increased Learning for All
Additional classrooms built or rehabilitated at the primary level Number 45,857 57,442 67,296 77,442 ISR
Additional qualified primary teachers Number 87,535 104,695 161,712 284,611 ISR
Additional textbooks purchased and distributed Number (million) 43.2 66.9 110.8 189.9 ISR
PILLAR 2: VULNERABILITY AND RESILIENCE Increased Safety Nets Coverage
New Beneficiaries from social safety net programs
Number (million) n/a 15.6 28.8 25.8 ISR
Improved Maternal and Child Health Care Services and Malaria and HIV Prevention
Additional children immunized Number (million) 49.6 60.5 61.9 67.3 ISR
Additional Pregnant women receiving antenatal care during a visit to a health provider
Number (million) 2.8 4.1 4.7 7.1 ISR
People with access to a basic package of health, nutrition, or population services
Number (million) 37.5 40.1 69.7 83.7
ISR
Additional Insecticide-treated bed-nets purchased and/or distributed
Number (million) 14.6 34.7 61.2 73.6
ISR
Additional Health facilities constructed, renovated, and/or equipped Number
2,119 3,375 3,835 4,285 ISR
Improved resilience of
Additional land area with sustainable land management practices Hectares 417,153 573,252 n/a 595,804 ISR
13
economies to climate change risks
Countries with improved early warning systems Number 6 7 .. 15 AFTWR
FOUNDATION: GOVERNANCE AND PUBLIC SECTOR CAPACITY
Social Accountability
Strengthened Governance Systems and Capacity for Social Accountability
Countries disclosing fishing licenses and associated fees Number 1 1 n/a 6 ISR Governance and Natural Resource Management
Countries with sustainable forest management programs Number 6 6 n/a 8 AFTEN
Public Sector Management and Capacity Improved CPIA indicators: CPIA A Economic Management (countries > 3) Number 25 27 n/a 28 CPIA ..
Improved CPIA indicators: CPIA B Public Sector Management and Institutions (countries > 3) Number 18 17 n/a 20 CPIA ..
MONITORING CROSS-CUTTING AREAS
Increased Engagement in Fragile States
Fragile States Hub established in Nairobi by end FY11 yes/no no yes yes yes AFTCS
Number of internationally recruited staff based in FCS and the Hub Number 66 77 78 .. HRS
Decentralization of task management to staff in the field working on Fragile Situations % 42 45 49.8
(03/2013) .. RM
Increased Engagement in Regional Integration
Reporting on outputs and outcome indicators for regional integration is mainstreamed in the earlier sections
Increased Engagement in Middle Income Countries
Lending Volume to Middle Income Countries $million 4,235 4,282 4,366 (FY12) .. WB
Systems
Support for AAA in Middle Income Countries $million 9.93 13.40 7,81 (FY12) .. WB
Systems
Improved Aid Effectiveness, Country Systems, and Work in Partnerships
CAS that address statistical capacity building Number 5 11 16 25 World Bank Doc.
Parallel implementation units Number 60 72 n/a .. OECD/ DAC
14
TIER 3: ORGANIZATIONAL AND DEVELOPMENT EFFECTIVENESS
Strategic outcome Indicator
Unit of measure
Baseline (FY10)
Progress (FY11)
Progress (FY12)
Target (FY15) Source
Improved Operational Quality
Disbursement ratio for investment lending projects In the portfolio (ITA16T3), overall % 24 19.3 21.4 >20 WB Systems
Projects with indicators capturing all aspects of PDO (IDA16 Tier 3) % 74 75 n/a 80 AFTDE
review ..
Projects with satisfactory outcome ratings by IEG ii % 64.1 58.1 61.9 70 IEG reviews,
WB Systems Projects with satisfactory outcome ratings based upon the ICR % 80.6 73.8 81 82 WB Systems
Improved Client Orientation
HQ & CO Appointed decentralized in Country Office (GF+) [AFR staff only] % 58% .. 59% .. HRS
…Stagnation ...Progress …Regress
i Data are for all countries (all income levels), except where otherwise noted. ii IEG has not yet completed the evaluation of FY11 and FY12 exits. So, the figures reported for these years are based on exits that have been evaluated to date. Also, the final outcome ratings for these years are expected to be different from the numbers reported in this table.
Recommended