qwertyuiopasdfghjklzxcvbnmqw
ertyuiopasdfghjklzxcvbnmqwert
yuiopasdfghjklzxcvbnmqwertyui
opasdfghjklzxcvbnmqwertyuiopa
sdfghjklzxcvbnmqwertyuiopasdf
ghjklzxcvbnmqwertyuiopasdfghj
klzxcvbnmqwertyuiopasdfghjklz
xcvbnmqwertyuiopasdfghjklzxcv
bnmqwertyuiopasdfghjklzxcvbn
mqwertyuiopasdfghjklzxcvbnmq
wertyuiopasdfghjklzxcvbnmqwer
tyuiopasdfghjklzxcvbnmqwertyui
opasdfghjklzxcvbnmqwertyuiopa
Swan Mattress
A Critical Analysis of the Mattress Sector
Executive Summary
Swan Mattress
A Critical Analysis of the Mattress Sector
PREPARED FOR:
Dr. Syed Ferhat Anwar
Professor
M302: Marketing Management
PREPARED BY:
M.M. Shahnewaz Kabir Shawon (ZR-04)
Alim Md. Noor (ZR-12)
Saif Ahmed (ZR-21)
Damil Alam Prakash (ZR-34)
Khandaker Ahad Ahmed (ZR-48)
BBA – 15th Batch (A)
INSTITUTE OF BUSINESS ADMINISTRATION
UNIVERSITY OF DHAKA
June 02, 2008
June 02, 2008
Dr. Syed Ferhat Anwar
Professor
Institute of Business Administration (IBA)
University of Dhaka.
Dear Sir:
We would like to submit this report titled “Swan Mattresses: A Critical Analysis of the Mattress
Sector” prepared as a part of the requirement for the course of Marketing Management.
In the process of preparing this report we had the opportunity to practically implement our
knowledge of marketing as well as to gain insight into the mattress sector of our country. We
tried our best to follow your guidelines in every step of preparing this report.
The whole project has been a huge learning experience for us. We hope you will find this report
objective, precise and reliable. Thank you for this assignment.
Sincerely,
___________________
Damil Alam Prakash
(On behalf of the group)
CONTENTS
Executive Summary......................................................................................................................vii
1. Introduction...............................................................................................................................1
1.1 Origin of the report..............................................................................................................1
1.2 Objectives............................................................................................................................ 1
1.3 Scope................................................................................................................................... 2
1.4 Methodology....................................................................................................................... 2
1.5 Limitations........................................................................................................................... 3
2. Swan Group Overview...............................................................................................................4
2.1 History..................................................................................................................................4
2.2 Swan Group Overview......................................................................................................... 5
2.3 Organization Structure.........................................................................................................8
2.4 Management Team..............................................................................................................9
3. Market Analysis....................................................................................................................... 11
3.1 Market Shares....................................................................................................................11
3.2 Competitive Forces............................................................................................................11
3.3 Mattress Market Type........................................................................................................13
3.4 Current trends....................................................................................................................13
4. Competitor Analysis.................................................................................................................14
4.1 Coirex Company Profile......................................................................................................14
4.2 Karmo Company Profile.....................................................................................................16
4.3 Other Competitors.............................................................................................................18
5. Swan Mattress Model Analysis................................................................................................19
5.1 SWOT Analysis................................................................................................................... 19
5.2 Strengths and Weakness Analysis......................................................................................20
5.3 Opportunity and Threat Analysis.......................................................................................23
5.4 Swan Marketing Mix..........................................................................................................25
5.5 GE Model Analysis..............................................................................................................27
5.6 Extended BCG Matrix.........................................................................................................31
5.7 Porter’s Five Forces Analysis for Swan Mattress................................................................33
5.8 Conjoint Matrix..................................................................................................................35
6. Strategies................................................................................................................................. 36
6.1 Goal Setting........................................................................................................................36
6.2 Demand forecasting...........................................................................................................40
6.3 Memory foam....................................................................................................................41
6.4 Customer awareness..........................................................................................................45
6.5 Customer retention............................................................................................................46
7. Conclusion............................................................................................................................... 50
Appendix A – References.............................................................................................................51
Appendix B– Sample Questionnaire............................................................................................52
Appendix C – Sample Swan Print Ads..........................................................................................63
Appendix D – Sales Data Analysis................................................................................................66
List of Illustrations
Figure 1. Swan Group.....................................................................................................................5
Figure 2. Corporate structure of Swan Industries..........................................................................9
Figure 3. Mattress industry market shares..................................................................................11
Figure 4. Strength & Weakness Analysis......................................................................................24
Figure 5. Opportunity & Threat Analysis......................................................................................24
Figure 6. The BCG Matrix.............................................................................................................31
List of Tables
Table 1. SWOT analyis of Swan mattresses..................................................................................19
Table 2. Strength & Weakness Analysis.......................................................................................20
Table 3. GE Model Business Strength Rating...............................................................................28
Table 4. GE Market Attractiveness Rating....................................................................................29
Table 5. Yearly Forecasted Sales..................................................................................................37
Table 6. Periodic Forecasted Sales...............................................................................................37
Table 7. Rebonded Mattress Sales Analysis.................................................................................39
Table 8. Chi-Square Analysis........................................................................................................39
Table 9. WACC Calculation...........................................................................................................42
Table 10. ROI Calculation.............................................................................................................44
Table 11. ROI Calculation.............................................................................................................48
Table 12. Projected sales figures.................................................................................................49
Executive Summary
Swan Industries have been operating in Bangladesh for a long time. Although they are the clear
market leader, Swan is currently facing decreasing profits. This report attempts to identify
those problems and propose strategies to resolve those.
The report is limited to Dhaka city only. Data was collected through repeated interviews with
manufacturing company executives and surveys of both consumers and retailers.
The mattress industry of Dhaka city is oligopolistic in nature. Swan is the market leader (32%)
and the main competitors include Karmo (15%) and Coirex (5%). Swan Industries currently offer
five kinds of mattresses: foam, coir, spring, PE (tight and light) and re-bonded mattresses.
Swan Industries have a few considerable strengths which include: largest portfolio of products,
international certification, corporate structure and continuous R&D. The weaknesses include:
lowest retailer commission, higher costs and lack of information systems. Some of the biggest
threats are the headhunting of employees, powerful new entrants like Otobi, Akhter Furnishers,
etc. and specialization of niche marketing companies.
According to the GE model, Swan lies on the bottom-left grid of the GE matrix. So, the strategy
of Swan should be to ‘protect and refocus’. Also, BCG matrix analysis reveals that Swan
mattress division as a whole is a cash cow.
To resolve the problems of Swan Industries, the following strategies have been proposed: (I)
goal setting, (II) demand forecasting, (III) memory foam PR strategy, (IV) print ad modification
and (V) customer retention strategy. If Swan Industries invest in the right areas and implement
effective strategies, then they should be able to maintain their position and market share in the
long term.
Executive Summary vii
Swan Mattress
A Critical Analysis of the Mattress Sector
1. Introduction
Swan Industries have been operating in Bangladesh for a long time. Now, they are a
powerhouse in the Bangladesh foam and mattress sectors. Despite having the biggest portfolio
of products and the widest distribution channel, Swan is currently facing declining sales and
diminishing profits. This report attempts to identify those problems and propose strategies to
counter those.
1.1 Origin of the report
This report has been prepared to fulfill the partial course requirement of Marketing
Management (M302), for Dr. Syed Ferhat Anwar, Professor, Institute of Business
Administration.
1.2 Objectives
The objectives of the report are:
Identify problems of Swan Industries – to find out which issues are pressing and which
components of the business need to be focused on.
Identify the trends of the mattress industry – to recognize the patterns of the mattress
sales in this industry.
1. Introduction 1
Develop strategies for Swan Industries – after identification of the companies problems,
formulate strategies that will resolve the problems for Swan.
1.3 Scope
The information of the report is based on the data collected from retailers and the producers in
Dhaka city only. This report includes basic and relevant information that are needed to have an
overall idea of sales of mattresses and their preferences. To fulfill our objective we have
gathered information from retailers. The products offered by Swan Industries can be broadly
classified as into foams, mattresses and hometex (comforters, pillows, etc.). We have narrowed
down our study only to the mattress division. Though the mattress companies have distribution
and retail outlets in major cities like Dhaka, Chittagong, Khulna, only demand in Dhaka city has
been discussed here.
1.4 Methodology
Collection of data
To learn about the sales of mattresses, we have gathered information from various sources.
They are as follows:
I. Surveys – two types of surveys were conducted.
a. Consumer survey - a top-of-the-mind survey directed towards consumers
to find out their awareness level about the mattress industry.
b. Retailer survey – retailers were surveyed to find out more about the
value delivery network and consumer preferences. Surveys were
1. Introduction 2
conducted in the three main mattress markets in Dhaka city (Elephant
Road, Gulshan and Mirpur) and over a total of 22 retailers .
II. Interviews – management personnel from the mattress companies were
interviewed to compare between the manufacturing and delivery processes of
competitors.
Analysis of data
The data gathered from the surveys have been arranged according to their categories and
analyzed to fulfill our objectives. For better understanding, we have also included graphical
representation. Quantitative techniques like Chi-square analysis and financial measures like
Return on Investment (ROI) have been used to analyze sales trends and forecast sales.
1.5 Limitations
During the preparation of the report, various limitations were encountered. They are:
Since none of the retailers or manufacturers maintain any consumer database, too
many consumers could not contacted for an extensive survey.
Mattress is a durable product. So, one consumer use the same mattress for around
10 years, and thus might have no idea about existing products.
The scope of the report has been limited to Dhaka city only due to time and resource
constraints.
1. Introduction 3
2. Swan Group Overview
2.1 History
The journey of Swan Group started when Mr. Khabeer Uddin Khan started Khan Trading
Company. He used to buy foams and mattresses from foreign countries like China and sell them
in Bangladesh. After some years Mr. Khan recognized the potential of this sector and started his
own foam production business called Swan Foam (industrial name poly-urethane foam) in
1988. Swan Foam was a great success and eventually Khan Trading Company was absorbed.
Slowly, Swan Foam started to grow and within a few years achieved complete backward linkage
for foam products. The foam was mainly sold for sitting purposes (sofa-sets, cushions, etc.) but
also, there was a growing demand for foam mattresses. The market for mattresses was
increasing steadily.
In the meantime, Swan was already diversifying its operations. A chemical called synthetic
rubber adhesive was required for the production of foam. Sensing a demand for this product,
Swan started manufacturing it commercially. In 1994, a separate division named Swan
Chemicals was launched.
By this time, the mattress industry had grown in size. There were importers who brought
different types of mattresses like spring, felt, etc. to the country. Finding that a sizeable demand
existed, Swan group started making spring mattresses in 2001-02. Thus, Swan Mattresses was
born. Its first product was Spring Mattress which was a huge success.
Building on the success of the mattress division, Swan went for complementary products and
created Swan Hometex. As a result Swan’s costs came down for mattress production and profit
went up. These surviving industries now create the modern Swan Group.
1. Introduction 4
The latest addition to the Swan Group is the introduction of a real estate business named Swan
Properties. It is a completely separate entity and has a different managerial staff for the running
of the business.
2.2 Swan Group Overview
Swan Group is divided into three main divisions. The divisions are largely independent of each
other, though at times the same resources are used by multiple departments. For example, the
research and development facilities of both the Swan Chemicals division and the Swan
Industries are overlapping.
Figure 1. Swan Group
Swan Industries
Swan industries is comprised of three strategic business units (SBUs). They are:
1. Introduction 5
SWAN Group
SWAN Industries
SWAN Foam
SWAN Mattress
SWAN Hometex
SWAN Chemicals
LA
UPR
SR
PU
SWAN Properties
Swan Foam
Swan Mattress
Swan Hometex
Though the management shows these three as being separate operations, the boundaries of
the departments are blurred. One operation might use assets from another when the need
arises. For example, the same people who package the foam also package the mattresses.
Even though management recognized three SBUs, actually the foam and the mattress
operations are very much related. For example, to manufacture a foam mattress, the same
machinery and the human resources are used who produce foam cushions and other foam
products.
Swan Foam
Swan Foam mainly produces foams of four grades. The three main grades in terms of quality
are Swan (Regular Quality), Comfort (Better Quality) and Super (Best Quality). There is also
another thin type of foam called YS grade.
Currently Swan Supplies to both consumers and business buyers. Business buyers use various
types of foam as Raw Materials for their products. Some business buyers sectors where Swan
delivers are Furniture, Transportation, Footwear, Toy Sector, Luggage etc.
Swan Mattress
Swan is the pioneer mattress manufacturing company in Bangladesh. Their initial product was
the Spring Mattress. Now, they create five types of Mattresses. These are:
1. Introduction 6
Foam Mattress
Coir Mattress
Spring Mattress
PE Mattress (tight and light)
Re-bonded Mattress
They are the current market leaders and they try to keep their leadership through superior
product quality and service.
Swan Hometex
Swan Hometex division makes a variety of products which includes comforter, pillow, oven
mitts, etc.
Swan Industries Ltd. has produced quality product for its customer for the last 21 years. It
currently has 12 showrooms and almost 700 retail outlets.
Swan Chemicals
The initial product of Swan Chemicals was Synthetic Rubber Adhesive (SRA), more commonly
known in the market as “Solution”. Currently, they create four types of Adhesives. They are
Lamination Adhesive (LA)
Unsaturated Polyester Regine (UPR)
Synthetic Rubber Adhesive (SRA)
Poly Urethane Adhesive(PUA)
1. Introduction 7
They are the market leaders in SR adhesive but they are still developing their UPR, PUA and LA.
Bu they still cannot achieve the target sales. The manufacturing plant of Swan Chemicals is
located in Gazipur.
Swan Properties
Recently, Swan Industries Limited Started this developers business. For that purpose they have
taken a director who has 12 years of professional experience in this field. Swan Properties office
is situated in Prime View, Gulshan Avenue.
2.3 Organization Structure
The organizational Hierarchy is blurred in SWAN Group. But broadly Its head is the owners
which is the Mr. Khabeer Uddin Khan’s family. Under them there is the General Manager
(Corporate). This post is equivalent of CEO. Then there are several posts. They are
General Manager (Marketing)
Head of Accounts
Head of Commercial
Head of VAT
General Manager Production
1. Introduction 8
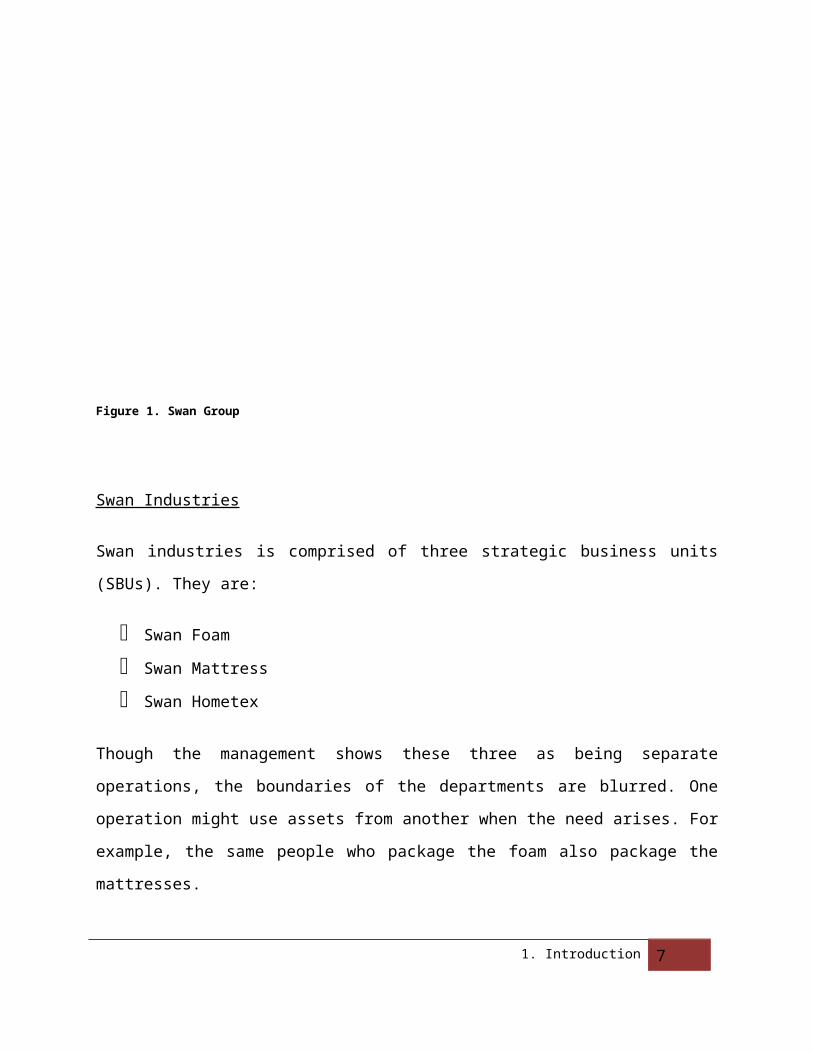
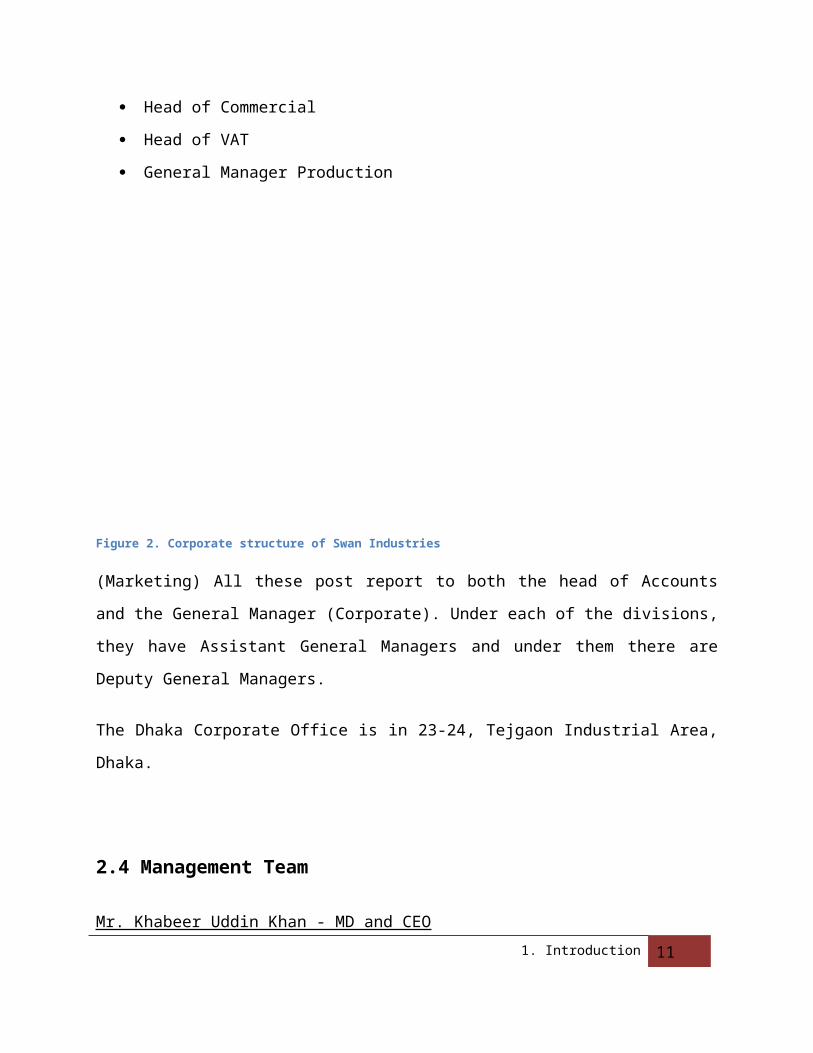
Figure 2. Corporate structure of Swan Industries
(Marketing) All these post report to both the head of Accounts and the General Manager
(Corporate). Under each of the divisions, they have Assistant General Managers and under
them there are Deputy General Managers.
The Dhaka Corporate Office is in 23-24, Tejgaon Industrial Area, Dhaka.
2.4 Management Team
Mr. Khabeer Uddin Khan - MD and CEO
Mr. Khabeer Uddin Khan has passed his Honors and Masters from the Accounting Department
of Dhaka University. After graduation he did not attempt to go into a job. He began Khan
Trading Company which eventually gave birth to Swan group of Industries Ltd.
1. Introduction 9
Owner
GMC
GMMHead of
Commercial
Head of VAT
GMProductio
n
Head of Accounts
Mr. Zinnat A. Montu - General Manager (Corporate)
Mr. Montu has been with Swan Group of Industries for the last 30 years. He is an expert in all
the sectors that swan operate in e.g. Servicing, Customs, Income Tax, Financial Institutions etc.
He is supporting other executives to perform their activities smoothly.
Mr. Mozibur Rahman - General Manager (Production)
Mr. Mozibur has been with Swan for more than 20 years. He ensures timely production and
supply of Swan Products. He also ensures quality of the products produced. He is also an expert
in related sectors like local procurement of Raw Materials, transportation of Raw Material and
transporting finished goods to valued customers. He also ensures proper storage of Raw
Materials and finished goods.
Mr. Ali Ahmed - General Manager (Marketing)
Mr. Ali has completed his Honors and Masters from the Marketing Department of Dhaka
University. He started his career with Singer Company.
Mr. Zinder Ali - Assistant General Manager (Marketing)
Mr. Zinder has worked with Swan for more than 16 years. He has personally sat with many
customers and his liaison skills are irreplaceable.
1. Introduction 10
3. Market Analysis
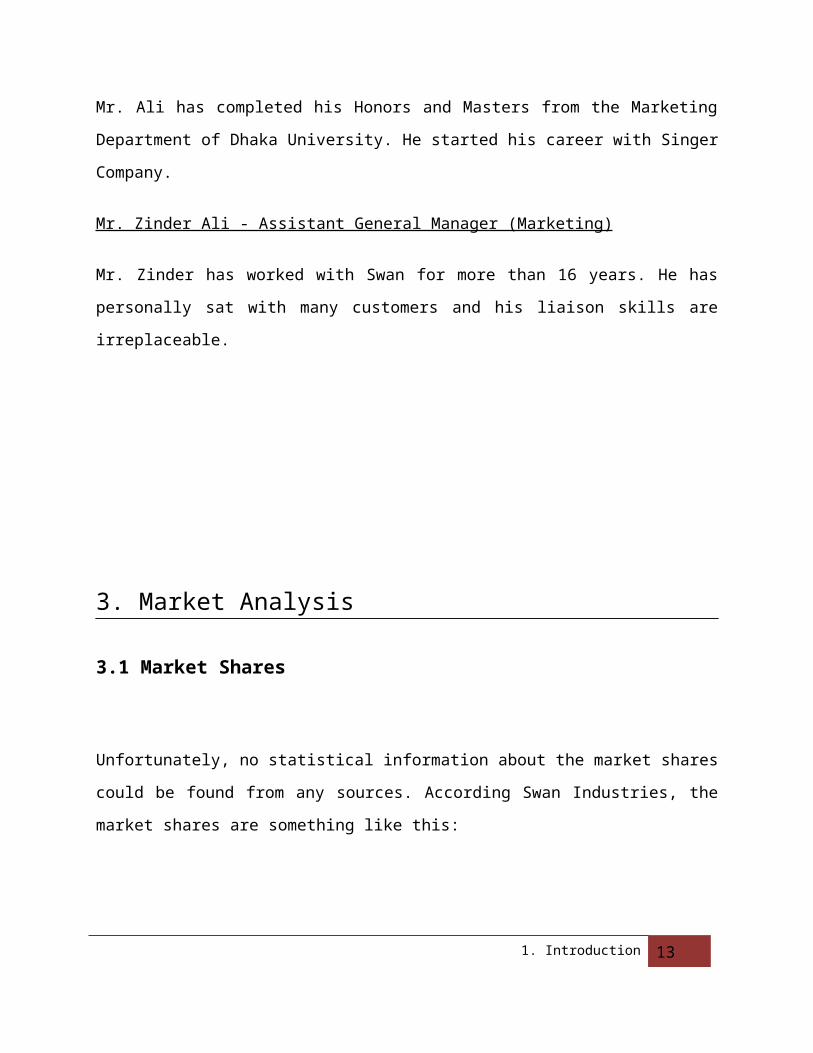
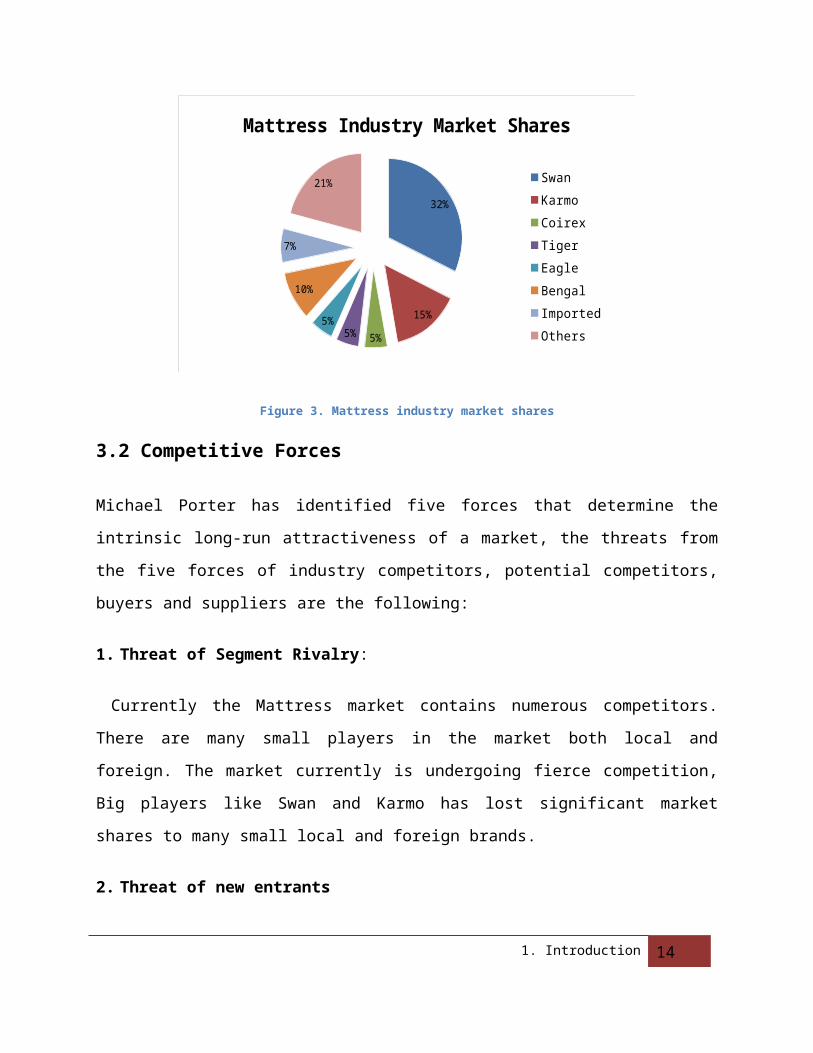
3.1 Market Shares
Unfortunately, no statistical information about the market shares could be found from any
sources. According Swan Industries, the market shares are something like this:
32%
15%
5%5%5%
10%
7%
21%
Mattress Industry Market Shares
Swan Karmo
Coirex Tiger
Eagle Bengal
Imported Others
Figure 3. Mattress industry market shares
3.2 Competitive Forces
Michael Porter has identified five forces that determine the intrinsic long-run attractiveness of a
market, the threats from the five forces of industry competitors, potential competitors, buyers
and suppliers are the following:
1. Threat of Segment Rivalry:
Currently the Mattress market contains numerous competitors. There are many small players
in the market both local and foreign. The market currently is undergoing fierce competition, Big
1. Introduction 11
players like Swan and Karmo has lost significant market shares to many small local and foreign
brands.
2. Threat of new entrants
Some mattress products like Foam and spring mattress requires expensive equipments and
technological expertise.
It is also difficult for new entrant to establish a functional network system of dealership and
retails to reach customer all over Bangladesh. Only Swan and Karmo have managed to develop
an extensive network all over the country
Because of heavy investment required in equipment and production expertise the industry has
high entry and exit barriers.
3. Threat of Substitute Products
In Bangladesh local made Quilt mattress (Zajim) is the most popular. Quilt mattress are more
widely available than branded factory produced ones. Quilt mattresses are 3 times cheaper
than most Foam and Coir mattresses.
4. Threat of buyers’ growing bargaining power
Buyers don’t have lot of bargaining power in the mattress market. Prices are fixed by retailers
and the companies have not focused on any other channels. Through our surveys of retail
markets we have seen that retailers charge varying prices in different retail locations, and
customers are not sensitive to such price variance.
5. Threat of suppliers’ growing power
Swan has most extensive backward linkages of all companies. Swan itself procures most of its
raw materials required for Mattress production; therefore only international price changes on
1. Introduction 12
raw materials can affect its profitability. However other companies don’t have a strong
backward linkage and has to depend on Swan for many raw material imports.
3.3 Mattress Market Type
A small number of large firms control more than half of the market share this includes Swan,
Karmo and Bengal. All the companies find it hard to charge significantly higher as their products
in each category are homogenous. The competitors match on prices and services the only way
to gain competitive advantage is by lowering costs. So, the market type can be assumed to be
an oligopoly.
3.4 Current trends
Sufficient data could not found on the mattress industry. This was mainly because of two
factors; firstly, none of the statistics bureaus consist of data focused fully on the mattress
industry, and secondly, none of the companies have any customer database which could be
used for survey purposes. Based on interviews of retailers and executives, they admitted the
following trends:
Foam mattress sales are extremely low in summer, but very high in winter.
General decline in coir mattress sales.
Growing demand of rebonded mattresses.
Specialized firms making more profits.
1. Introduction 13
4. Competitor Analysis
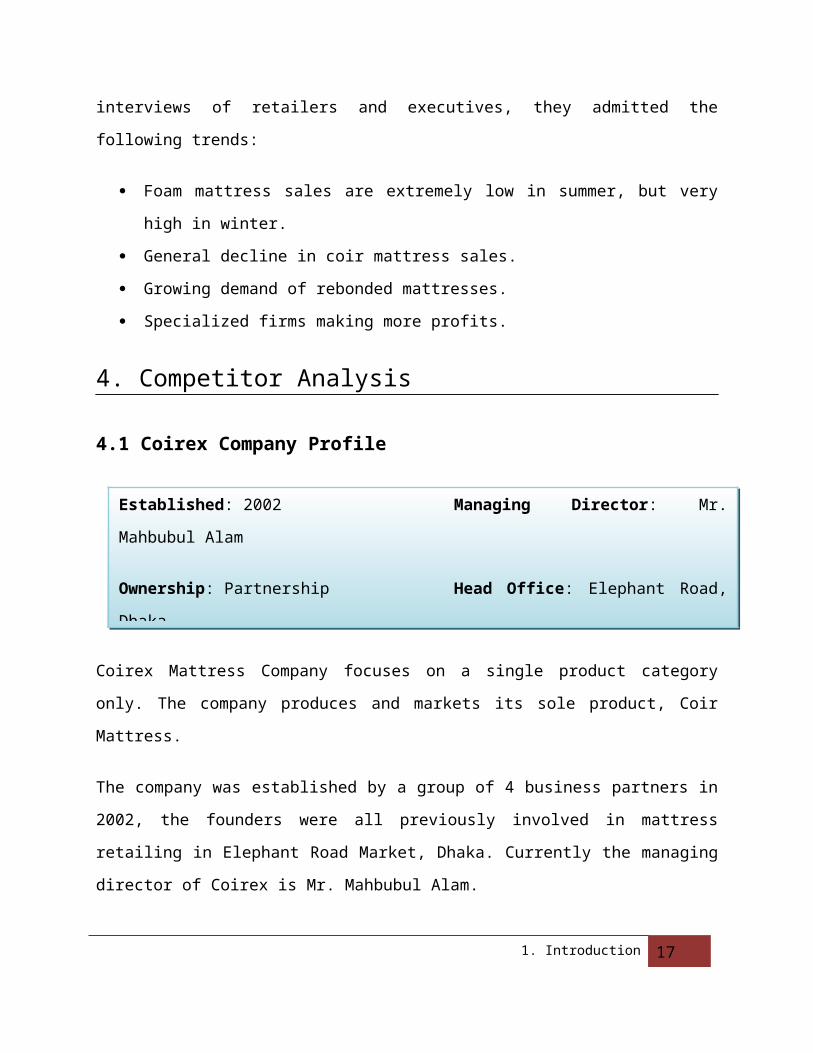
4.1 Coirex Company Profile
Established: 2002 Managing Director: Mr. Mahbubul Alam
Ownership: Partnership Head Office: Elephant Road, Dhaka
Products: Coir Mattresses
Coirex Mattress Company focuses on a single product category only. The company produces
and markets its sole product, Coir Mattress.
The company was established by a group of 4 business partners in 2002, the founders were all
previously involved in mattress retailing in Elephant Road Market, Dhaka. Currently the
managing director of Coirex is Mr. Mahbubul Alam.
Coirex only produces coir mattresses. The coir is procured through suppliers who import it
from different countries like Malaysia. Coir has a factory where mattresses are stitched. Quality
control is very high the owners themselves are responsible for quality checks as inspection.
Due to its superior quality and niche marketing, Coirex has become very reputed brand among
customers in Dhaka Metro region. Coirex has very well after sales services; it has prompt
response time to customer complaints.
Coirex has very high variable costs compared to competitors like Swan and Karmo, therefore
Coirex has lower profit margins that its competitors. Due to high variable costs and low profit
margins Coirex can only give its retailers a commission of 10%-15%, the lowest among its
competitors.
1. Introduction 14
Coirex is facing many problems in the market, its competitors are moving very fast in the Coirex
mattress category, making Coirex lose its niche in the market.
7 P Analysis of Coirex
Product
Coirex from its inception has produced and market only one category of mattress, which the
Coir Mattress. Coirex focus on a single product category has enabled it to specialize in
producing the highest quality coir mattress in the company.
Price
Prices the customer pay for mattresses is not fixed and depends upon the retailers. The price of
Coirex in any retail location should vary little when compared with another brand.
Coirex pays a commission of 10-15% to the retailers; they pay the lowest in the market because
they have the higher production cost compared to their competitors Swan and Karmo
Place
Coirex does not distribute outside Dhaka Metro. Its retail is limited to only Dhaka City. Coirex
has a small production capacity. Coirex entered the mattress market in 2002 therefore it has
not built a distribution network outside Dhaka City.
Promotion
Coirex till now has not undertaken any promotional activities. The reasons are high variable
cost per unit in the production process, Coirex rivals due their bigger size have scale of
economy which brings their per unit variable costs down
1. Introduction 15
Coirex Strategies
Coirex focused on single product category, Coir Mattress, because it easy to setup up
production plants and completion was very little in coir mattress category.
Focusing on single product category enables Coirex to produce higher quality products
than rivals Swan and Karmo. Quality control checks and supervision is done by the
Coirex owners themselves.
Single product focus has helped Coirex to stay closer to retailers and customers than
rivals Swan and Karmo. Coirex has maintained good relations with retailers all over
Dhaka City, who despite Coirex’s least commission percentage are more than willing to
sell Coirex Mattress.
Coirex has better after sales service than its rivals Swan and Karmo. It promptly
responds to any customer complaints.
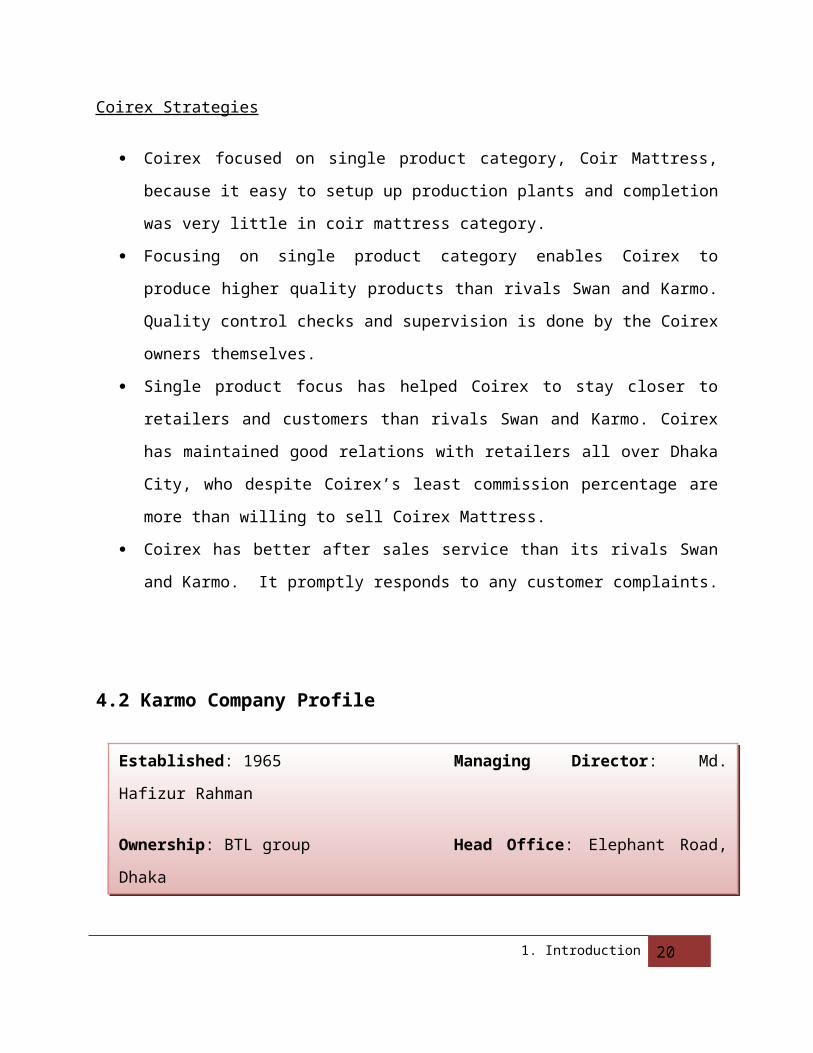
4.2 Karmo Company Profile
Established: 1965 Managing Director: Md. Hafizur Rahman
Ownership: BTL group Head Office: Elephant Road, Dhaka
Products: Spring, Foam, Coir, and Rebonded Mattresses
Karmo was established in 1965 at a time when Bangladesh was part of Pakistan. The company
has been pioneer in Foam market; Karmo was the first company to manufacture foams for
furniture. Karmo later lost its market leader position to Swan, but still it holds a competitive
position in the market as of fiscal year 2008 Karmo had 15% share in the mattress market.
1. Introduction 16
The company maintains good relations with dealers and retailers by giving the highest
commission in the market commission of 15-20%(exact amount with held). The company’s
main strength in the market is its brand reputation, claimed by the company officials because
they being the oldest in the mattress market.
Karmo is also has another division, Karmo Chemicals which mostly produced adhesives,
because the raw material for Foam petro chemicals is complementary for adhesive making.
7 P Analysis of Karmo
Product
Karmo foam produces three different types of mattresses currently. Those are foam, coir, and
spring mattress. They have done quite good but are not market leader in any of the categories.
Recently Karmo is trying to start producing rebounded mattress.
Price
Prices the customer pay for mattresses is not fixed and depends upon the retailers. The price of
Karmo in any retail location should vary little when compared with another brand. Karmo pays
the maximum amount of commission to the retailers in the market. They have very good
retailer relationship and satisfaction.
Place
Karmo has a very good distribution channel throughout the country. They have sufficient
number of retail outlets. These outlets are located in convenient locations in both Dhaka city
and other areas. And they are very fast at delivering on time.
1. Introduction 17
Promotion
Karmo stresses on advertisement for promotional activities. They run TV commercials on a
seasonal basis. They have billboards on different spots of Dhaka city and highways. Karmo also
gives advertisement in print media. They do not apply other promotional tools like sales
promotion, PR etc.
Karmo Strategies
Karmo is the oldest in the market and has sufficient brand reputation.
Karmo because the oldest in the market, they have developed an extensive dealer and
retailer network throughout Bangladesh.
Karmo has good relationship with channel members. They rely on high commission to
win retailers who influence customers to buy their products.
4.3 Other Competitors
Among the other competitors, currently the most prominent is Eurasia. They only produce felt
mattresses which has an increasing demand right now. However, they have been in business for
a very short time and so data is insufficient to determine whether felt mattress is riding on a fad
or a trend.
1. Introduction 18
5. Swan Mattress Model Analysis
5.1 SWOT Analysis
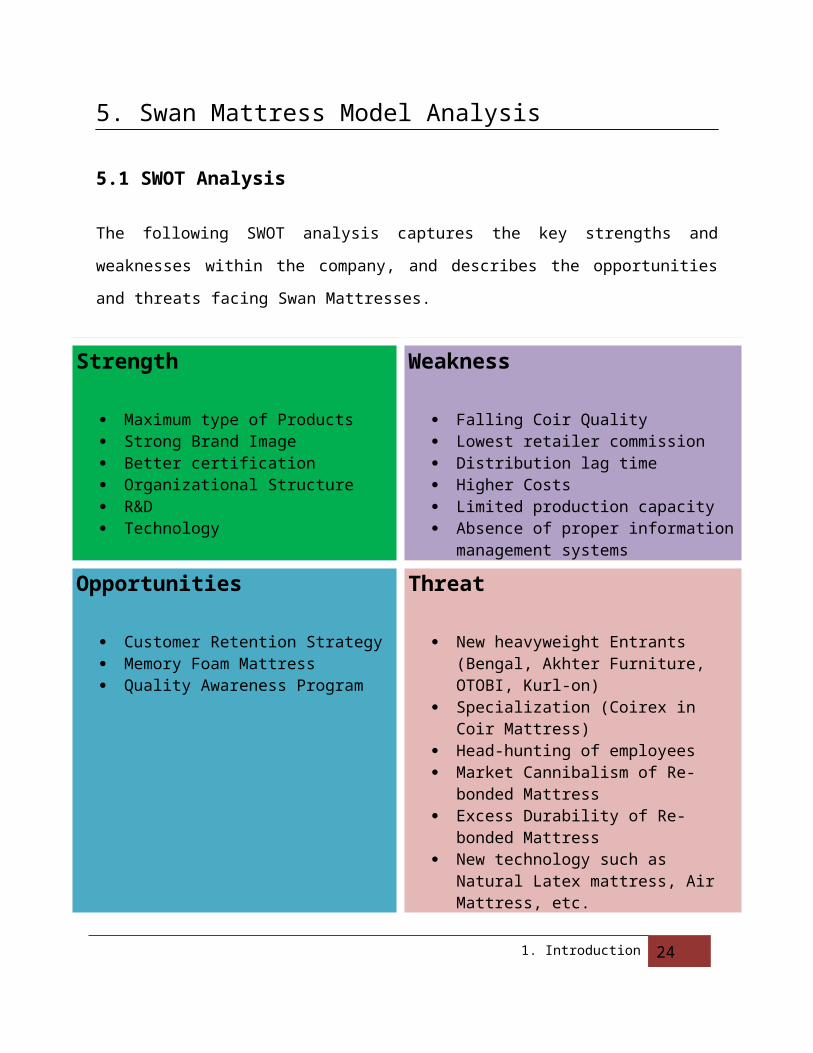
The following SWOT analysis captures the key strengths and weaknesses within the company,
and describes the opportunities and threats facing Swan Mattresses.
Strength
Maximum type of Products Strong Brand Image Better certification Organizational Structure R&D Technology
Weakness
Falling Coir Quality Lowest retailer commission Distribution lag time Higher Costs Limited production capacity Absence of proper information
management systems
Opportunities
Customer Retention Strategy Memory Foam Mattress Quality Awareness Program
Threat
New heavyweight Entrants (Bengal, Akhter Furniture, OTOBI, Kurl-on)
Specialization (Coirex in Coir Mattress) Head-hunting of employees Market Cannibalism of Re-bonded
Mattress Excess Durability of Re-bonded Mattress New technology such as Natural Latex
mattress, Air Mattress, etc.
Table 1. SWOT analyis of Swan mattresses
1. Introduction 19
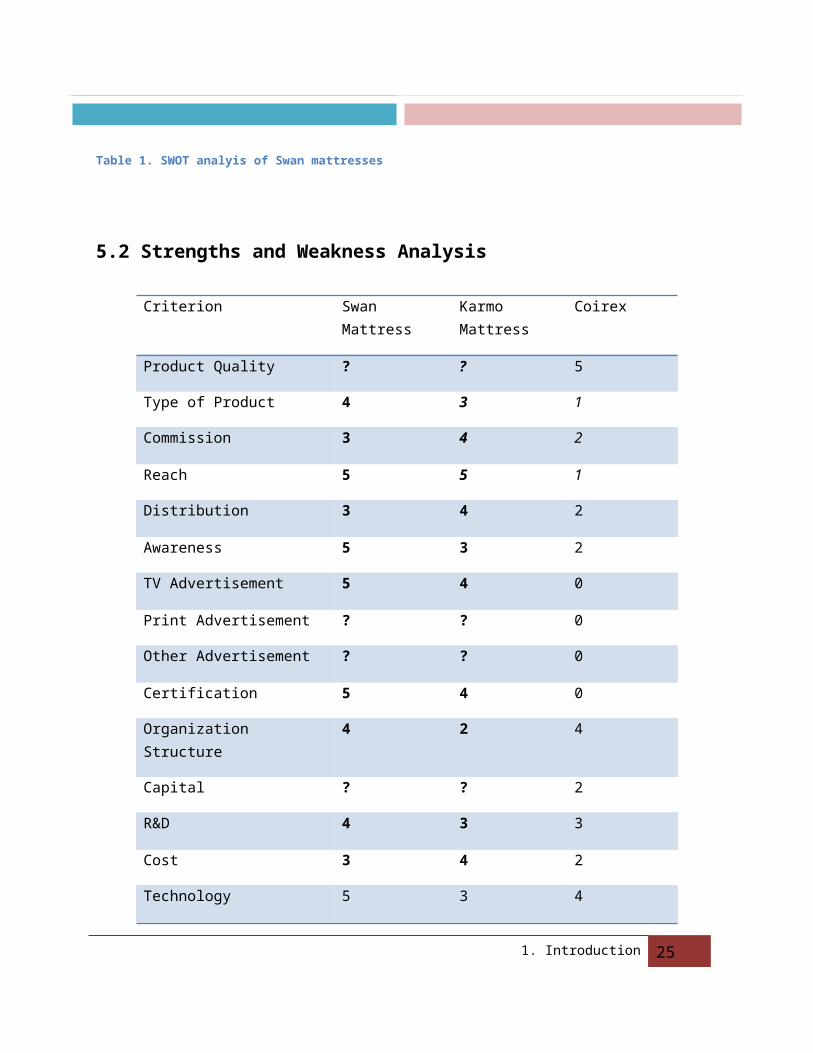
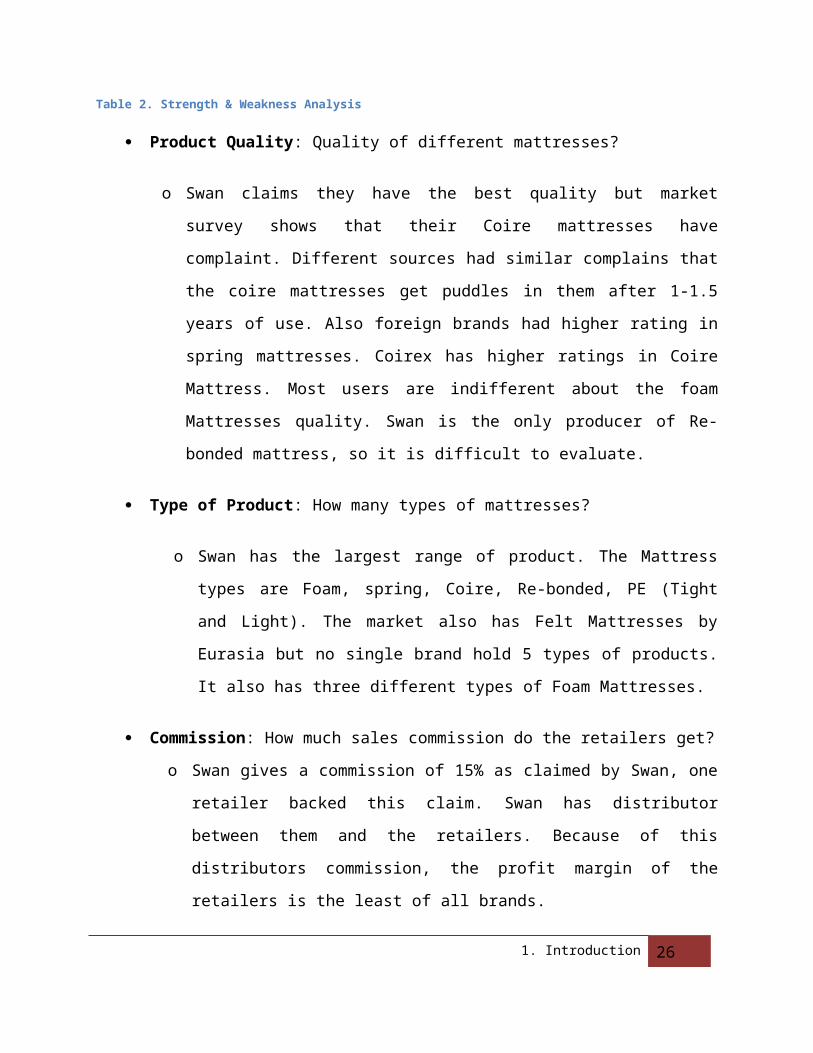
5.2 Strengths and Weakness Analysis
Criterion Swan Mattress Karmo Mattress Coirex
Product Quality ? ? 5
Type of Product 4 3 1
Commission 3 4 2
Reach 5 5 1
Distribution 3 4 2
Awareness 5 3 2
TV Advertisement 5 4 0
Print Advertisement ? ? 0
Other Advertisement ? ? 0
Certification 5 4 0
Organization Structure 4 2 4
Capital ? ? 2
R&D 4 3 3
Cost 3 4 2
Technology 5 3 4
Table 2. Strength & Weakness Analysis
Product Quality: Quality of different mattresses?
o Swan claims they have the best quality but market survey shows that their Coire
mattresses have complaint. Different sources had similar complains that the coire
mattresses get puddles in them after 1-1.5 years of use. Also foreign brands had
higher rating in spring mattresses. Coirex has higher ratings in Coire Mattress. 1. Introduction 20
Most users are indifferent about the foam Mattresses quality. Swan is the only
producer of Re-bonded mattress, so it is difficult to evaluate.
Type of Product: How many types of mattresses?
o Swan has the largest range of product. The Mattress types are Foam, spring,
Coire, Re-bonded, PE (Tight and Light). The market also has Felt Mattresses by
Eurasia but no single brand hold 5 types of products. It also has three different
types of Foam Mattresses.
Commission: How much sales commission do the retailers get?
o Swan gives a commission of 15% as claimed by Swan, one retailer backed this
claim. Swan has distributor between them and the retailers. Because of this
distributors commission, the profit margin of the retailers is the least of all
brands.
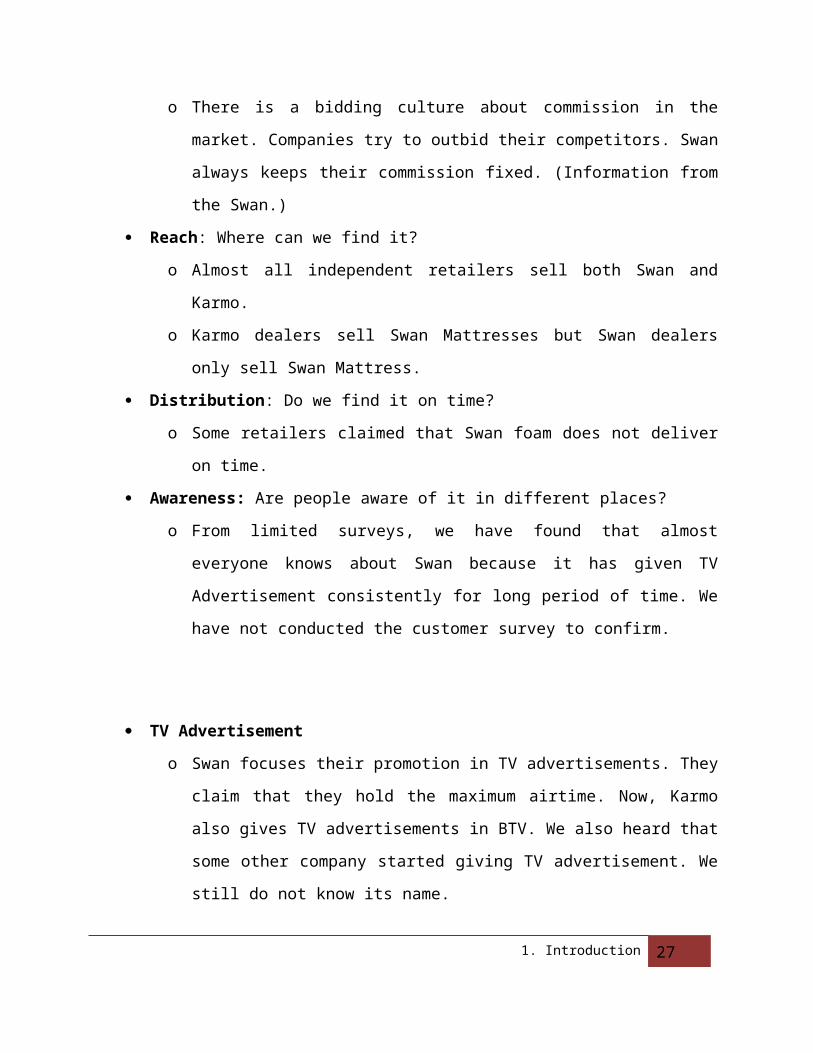
o There is a bidding culture about commission in the market. Companies try to
outbid their competitors. Swan always keeps their commission fixed.
(Information from the Swan.)
Reach: Where can we find it?
o Almost all independent retailers sell both Swan and Karmo.
o Karmo dealers sell Swan Mattresses but Swan dealers only sell Swan Mattress.
Distribution: Do we find it on time?
o Some retailers claimed that Swan foam does not deliver on time.
Awareness: Are people aware of it in different places?
o From limited surveys, we have found that almost everyone knows about Swan
because it has given TV Advertisement consistently for long period of time. We
have not conducted the customer survey to confirm.
1. Introduction 21
TV Advertisement
o Swan focuses their promotion in TV advertisements. They claim that they hold
the maximum airtime. Now, Karmo also gives TV advertisements in BTV. We also
heard that some other company started giving TV advertisement. We still do not
know its name.
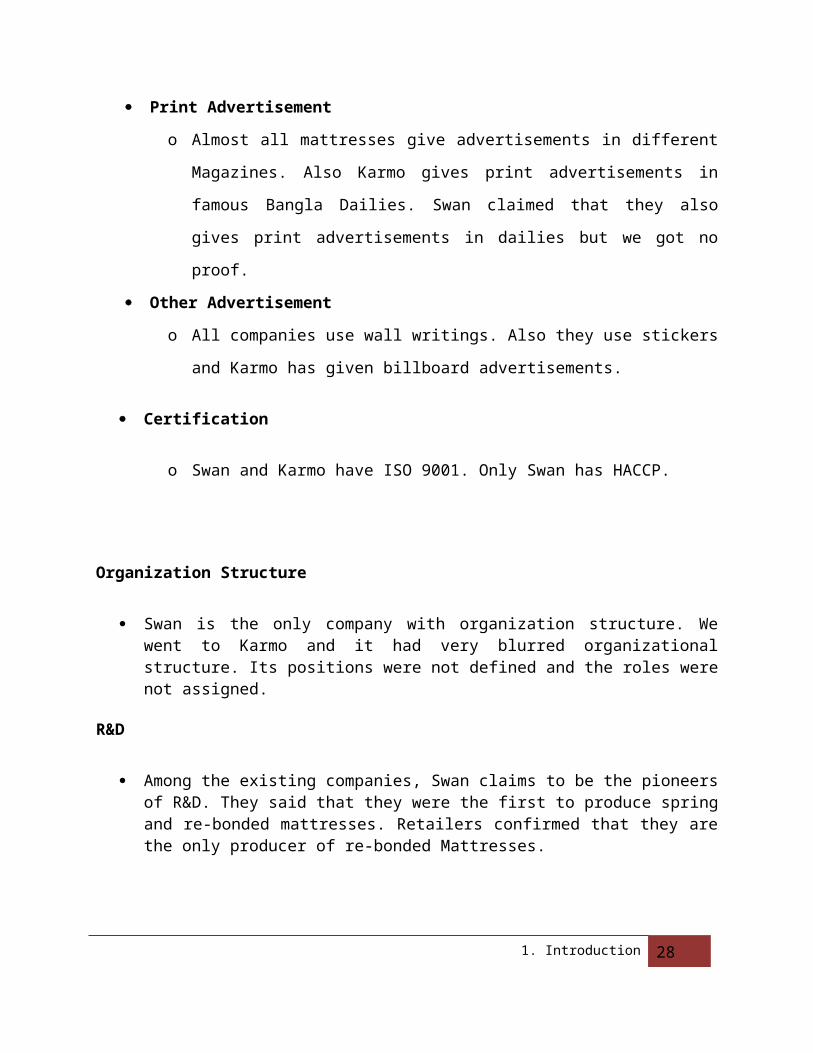
Print Advertisement
o Almost all mattresses give advertisements in different Magazines. Also Karmo
gives print advertisements in famous Bangla Dailies. Swan claimed that they also
gives print advertisements in dailies but we got no proof.
Other Advertisement
o All companies use wall writings. Also they use stickers and Karmo has given
billboard advertisements.
Certification
o Swan and Karmo have ISO 9001. Only Swan has HACCP.
Organization Structure
Swan is the only company with organization structure. We went to Karmo and it had very blurred organizational structure. Its positions were not defined and the roles were not assigned.
R&D
Among the existing companies, Swan claims to be the pioneers of R&D. They said that they were the first to produce spring and re-bonded mattresses. Retailers confirmed that they are the only producer of re-bonded Mattresses.
1. Introduction 22
Strengths
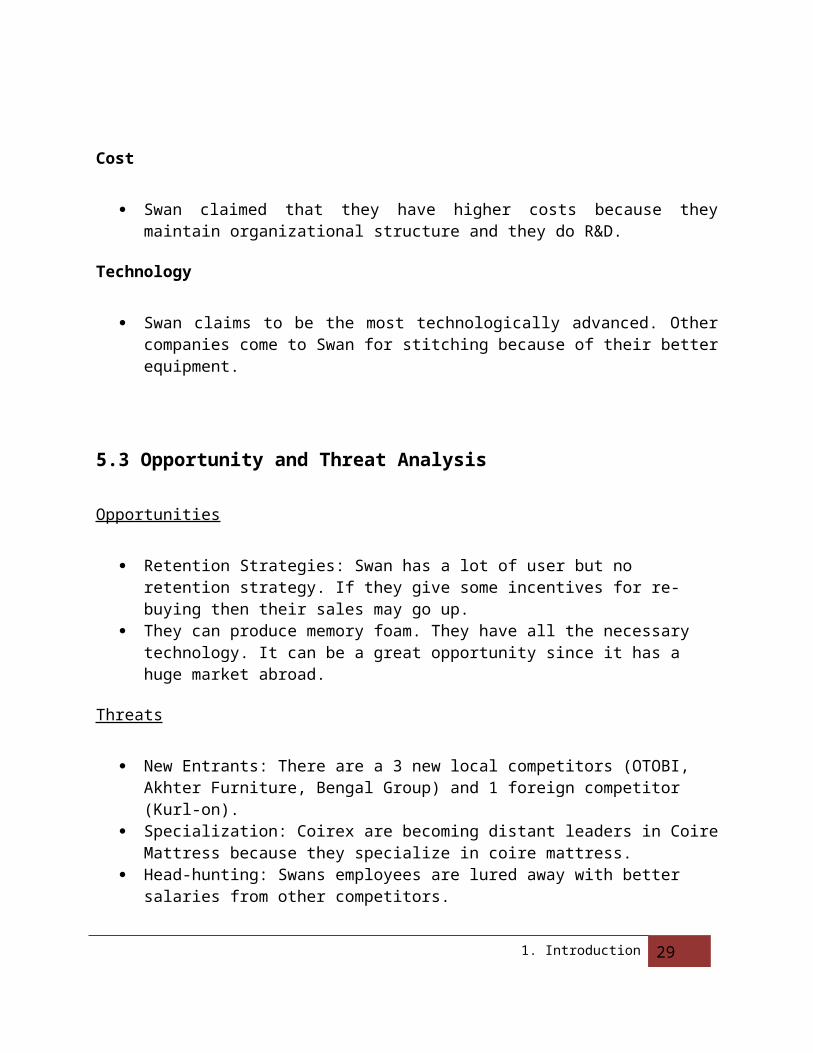
Cost
Swan claimed that they have higher costs because they maintain organizational structure and they do R&D.
Technology
Swan claims to be the most technologically advanced. Other companies come to Swan for stitching because of their better equipment.
5.3 Opportunity and Threat Analysis
Opportunities
Retention Strategies: Swan has a lot of user but no retention strategy. If they give some incentives for re-buying then their sales may go up.
They can produce memory foam. They have all the necessary technology. It can be a great opportunity since it has a huge market abroad.
Threats
New Entrants: There are a 3 new local competitors (OTOBI, Akhter Furniture, Bengal Group) and 1 foreign competitor (Kurl-on).
Specialization: Coirex are becoming distant leaders in Coire Mattress because they specialize in coire mattress.
Head-hunting: Swans employees are lured away with better salaries from other competitors.
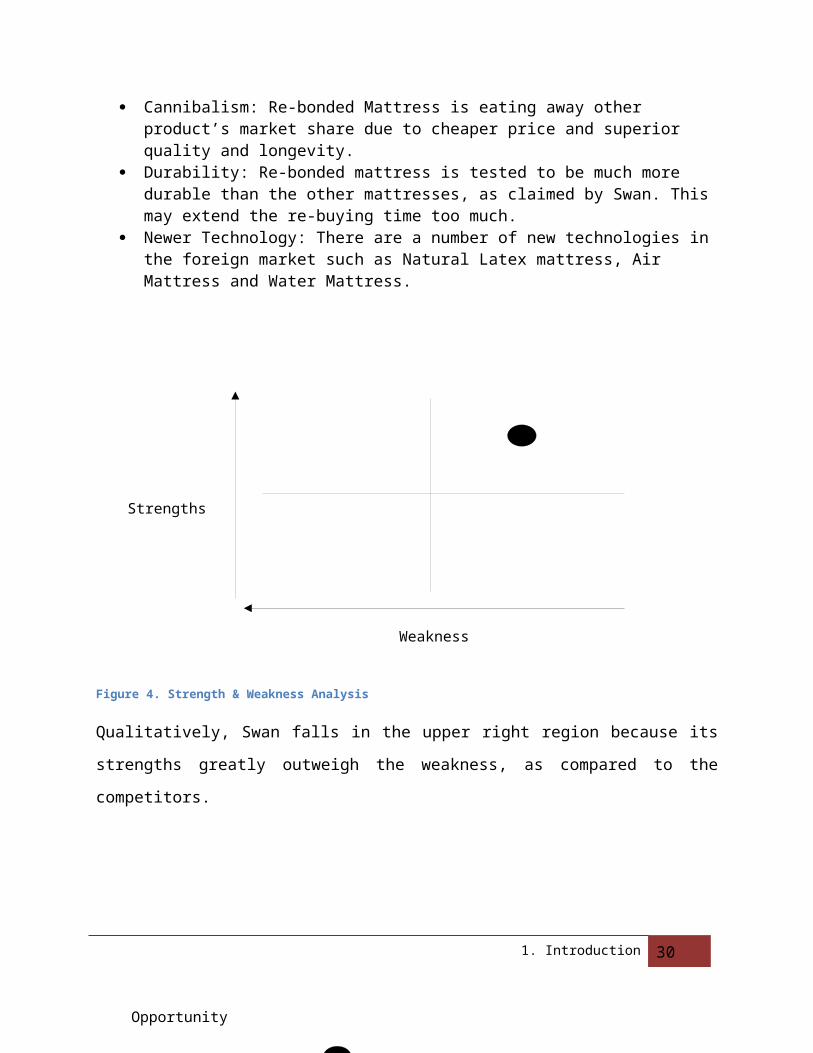
Cannibalism: Re-bonded Mattress is eating away other product’s market share due to cheaper price and superior quality and longevity.
Durability: Re-bonded mattress is tested to be much more durable than the other mattresses, as claimed by Swan. This may extend the re-buying time too much.
Newer Technology: There are a number of new technologies in the foreign market such as Natural Latex mattress, Air Mattress and Water Mattress.
1. Introduction 23
Threats
Opportunity
Figure 4. Strength & Weakness Analysis
Qualitatively, Swan falls in the upper right region because its strengths greatly outweigh the
weakness, as compared to the competitors.
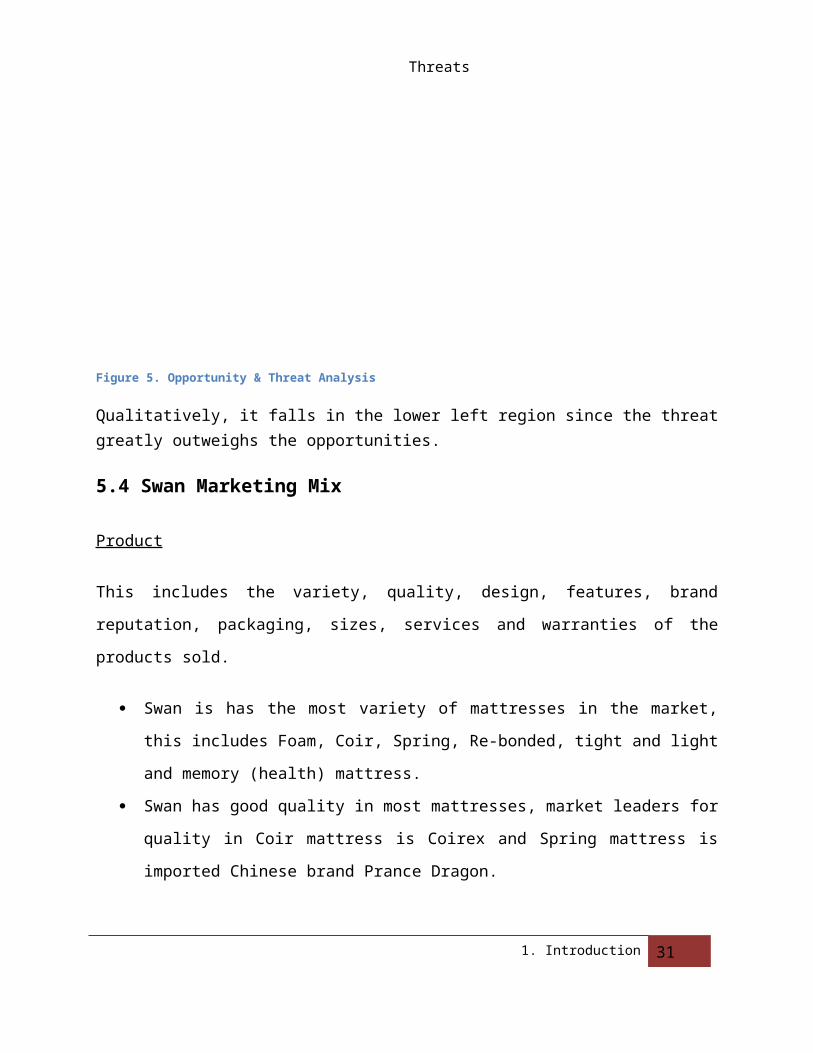
Figure 5. Opportunity & Threat Analysis
Qualitatively, it falls in the lower left region since the threat greatly outweighs the opportunities.
1. Introduction 24
5.4 Swan Marketing Mix
Product
This includes the variety, quality, design, features, brand reputation, packaging, sizes, services
and warranties of the products sold.
Swan is has the most variety of mattresses in the market, this includes Foam, Coir,
Spring, Re-bonded, tight and light and memory (health) mattress.
Swan has good quality in most mattresses, market leaders for quality in Coir mattress is
Coirex and Spring mattress is imported Chinese brand Prance Dragon.
All the mattresses in the market have similar design and features
Swan has the best brand reputation in the market
Swan has excellent after sales services regarding customer complaints, responses to
customer complaints are prompt
Warranties on all categories of mattresses are same for all brands.
Price
List prices of products, discounts and sales, payment periods and Credit terms
Prices of products vary according to location and retailer’s bargaining, the market price
for each mattress category varies very little for all local brands. Imported brands are
charged a bit higher by retailers.
Swan never offers any discounts on sales price to customer, the sales discount practice
is almost absent in the mattress market
Swan gives a commission of 15% as claimed by Swan, one retailer backed this claim. Swan has distributor between them and the retailers. Because of this distributors commission, the profit margin of the retailers is the least of all brands.
There is a bidding culture about commission in the market. Companies try to outbid their competitors. Swan always keeps their commission fixed. (Information from the Swan.)
1. Introduction 25
Promotion
This includes promotional activities such as sales promotion, advertising, sales force, public
relations, Direct Marketing.
Swan has now yet undertaken any sales promotion. The practice of sales promotion is
absent in the market.
Swan regularly advertises in Newspapers and magazines. It also advertises in T.V but less
frequently than its competitors like Karmo and Bengal.
Swan has a dedicated sales force of 33 marketing executives who are actively involved
distribution and selling process.
Swan is doing Direct Marketing with Business buyers, direct marketing with consumer
buyer is still at experimental stage.
Place
This includes the channels of distribution, geographical coverage, available locations, and
inventory management.
Currently, Swan has the largest distribution network with around 700 retailers spread
throughout the country.
People
All people involved in the consumption of a service or a good.
Regarding technical expertise, Swan is the market leader. Swan Industries have highly trained
workers and a functional R&D department. Also, they have the highest number of employees
among other mattress companies and the largest sales force.
Among the mattress companies, only Swan Industries have an organized corporate structure.
However, the responsibilities of each position are not always clearly defined.
1. Introduction 26
Process
Procedure, mechanism and flow of activities by which goods or services are consumed.
Swan Industries is the clear technological leader in the market. Most of the new mattress types
have been pioneered by Swan in the market. Consumers can buy their products from any of
three existing mechanisms: Swan office, distributors and retailers.
Also, Swan has 33 marketing executives who roam around the country to identify sales
opportunities and provide after-sales service. Swan readily repairs any mattress brought by a
customer and also, has an easily accessible help service.
Physical Evidence
The ability and the environment in which the service or good is delivered.
Since all types of mattresses are sold at the same retail outlets, the tangible experience is
largely the same for all the companies. Also, since the retailers are the sales people here, the
intangible aspect is also irrelevant.
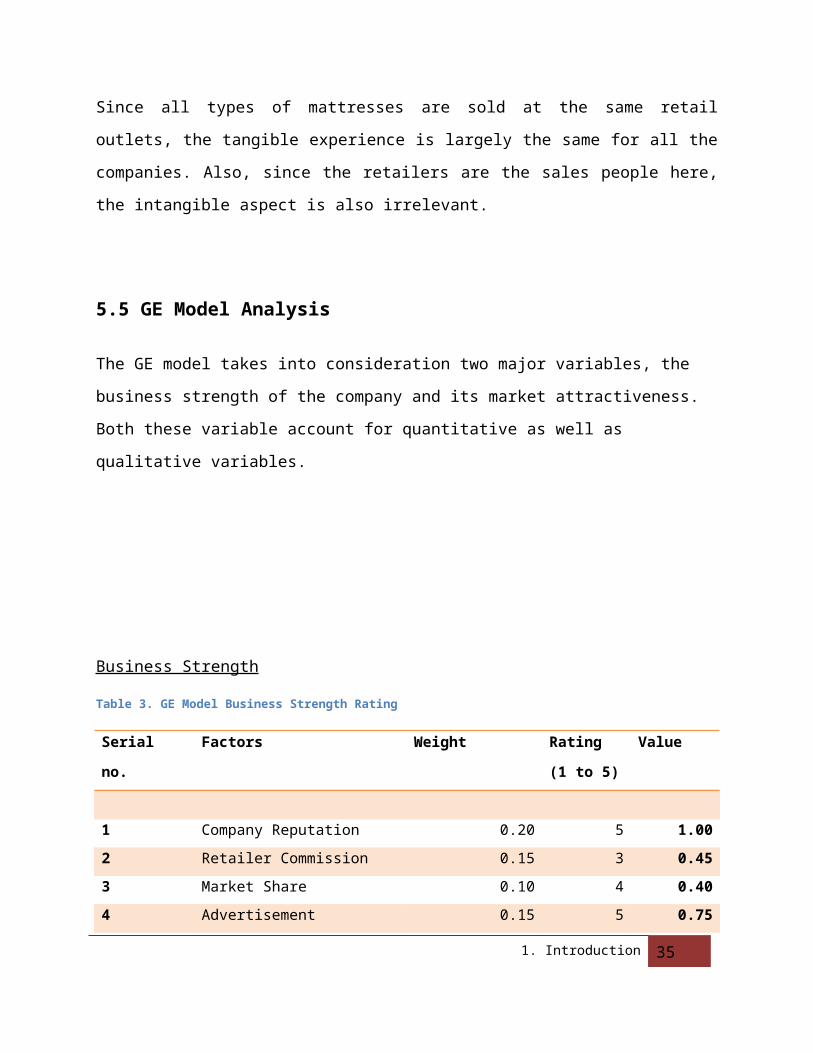
5.5 GE Model Analysis
The GE model takes into consideration two major variables, the business strength of the
company and its market attractiveness. Both these variable account for quantitative as well as
qualitative variables.
1. Introduction 27
Business Strength
Table 3. GE Model Business Strength Rating
Serial no. Factors Weight Rating (1 to
5)
Value
1 Company Reputation 0.20 5 1.00
2 Retailer Commission 0.15 3 0.45
3 Market Share 0.10 4 0.40
4 Advertisement 0.15 5 0.75
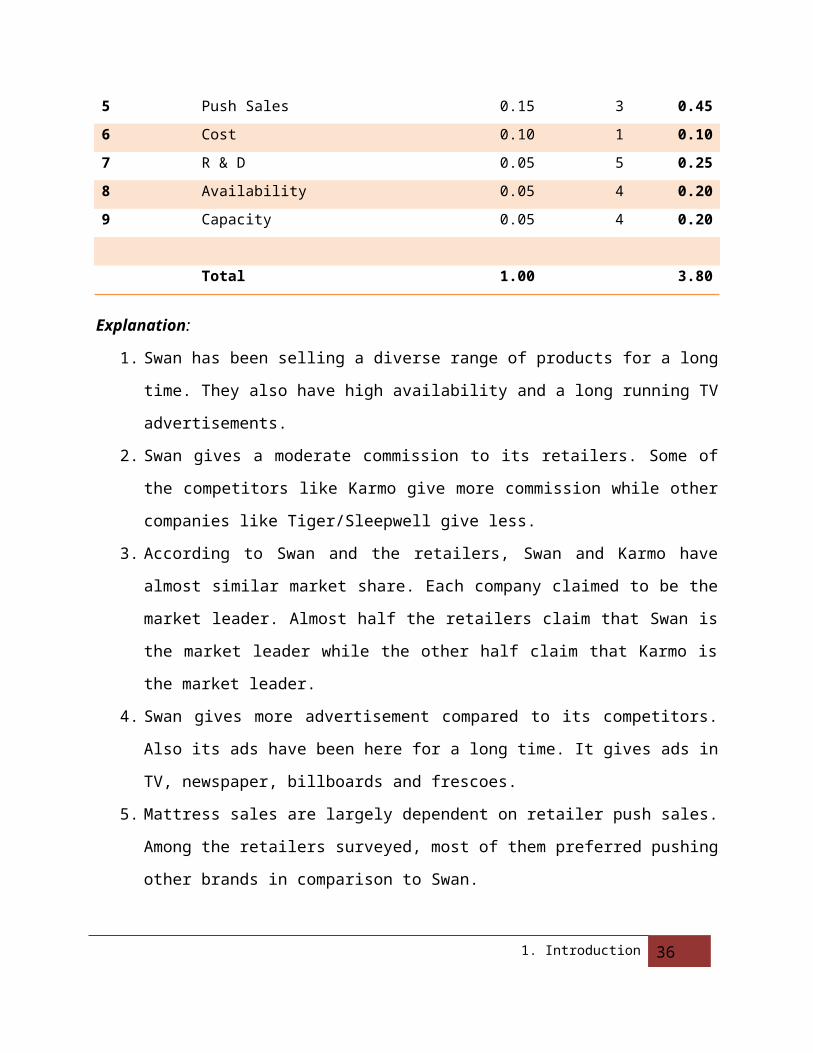
5 Push Sales 0.15 3 0.45
6 Cost 0.10 1 0.10
7 R & D 0.05 5 0.25
8 Availability 0.05 4 0.20
9 Capacity 0.05 4 0.20
Total 1.00 3.80
Explanation:
1. Swan has been selling a diverse range of products for a long time. They also have high
availability and a long running TV advertisements.
2. Swan gives a moderate commission to its retailers. Some of the competitors like Karmo
give more commission while other companies like Tiger/Sleepwell give less.
3. According to Swan and the retailers, Swan and Karmo have almost similar market share.
Each company claimed to be the market leader. Almost half the retailers claim that Swan
is the market leader while the other half claim that Karmo is the market leader.
4. Swan gives more advertisement compared to its competitors. Also its ads have been here
for a long time. It gives ads in TV, newspaper, billboards and frescoes.
5. Mattress sales are largely dependent on retailer push sales. Among the retailers surveyed,
most of them preferred pushing other brands in comparison to Swan.
6. Swan admitted that compared to other companies, they had the highest cost.
1. Introduction 28
7. Among the local mattress companies, only Swan has an organized R & D department.
Most types of mattresses were pioneered by Swan in Bangladesh.
8. All retailers sell Swan. Swan is available in the maximum number of places.
9. Swan has a very large production capacity. However, they fail to deliver their products to
their customers on time.
Market AttractivenessSerial no. Factors Weight Rating (1
to 5)
Value
1 Target Market Size 0.15 3 0.45
2 Sales Promotion Requirement 0.15 1 0.15
3 Dependency on Retailer 0.15 1 0.15
4 Annual Market Growth Rate 0.10 2 0.20
5 Competitive Intensity 0.10 1 0.10
6 Consumer Income Level 0.10 3 0.30
7 Substitutes 0.05 4 0.20
8 Complementary Products Sales 0.05 4 0.20
9 Consumer Awareness 0.10 4 0.40
10 Entry/Exit Barrier 0.05 2 0.10
Total 1.00 2.25
Table 4. GE Market Attractiveness Rating
Explanation:
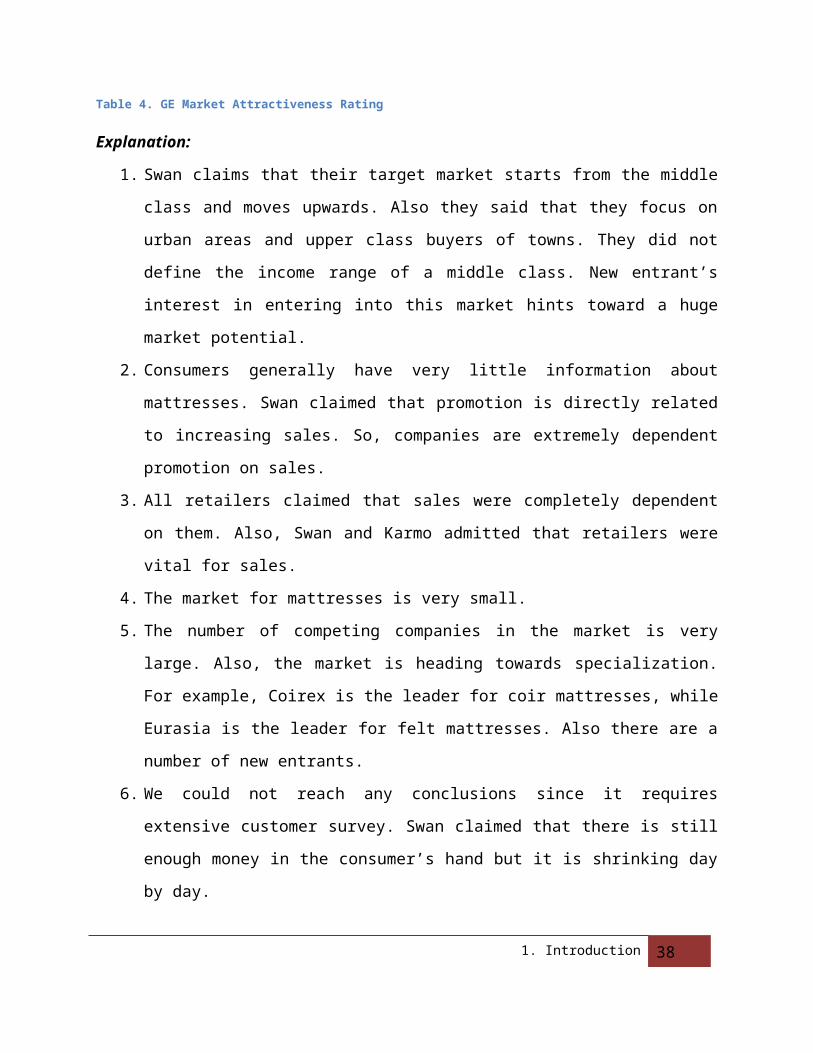
1. Swan claims that their target market starts from the middle class and moves upwards.
Also they said that they focus on urban areas and upper class buyers of towns. They did
not define the income range of a middle class. New entrant’s interest in entering into this
market hints toward a huge market potential.
1. Introduction 29
2. Consumers generally have very little information about mattresses. Swan claimed that
promotion is directly related to increasing sales. So, companies are extremely dependent
promotion on sales.
3. All retailers claimed that sales were completely dependent on them. Also, Swan and
Karmo admitted that retailers were vital for sales.
4. The market for mattresses is very small.
5. The number of competing companies in the market is very large. Also, the market is
heading towards specialization. For example, Coirex is the leader for coir mattresses,
while Eurasia is the leader for felt mattresses. Also there are a number of new entrants.
6. We could not reach any conclusions since it requires extensive customer survey. Swan
claimed that there is still enough money in the consumer’s hand but it is shrinking day by
day.
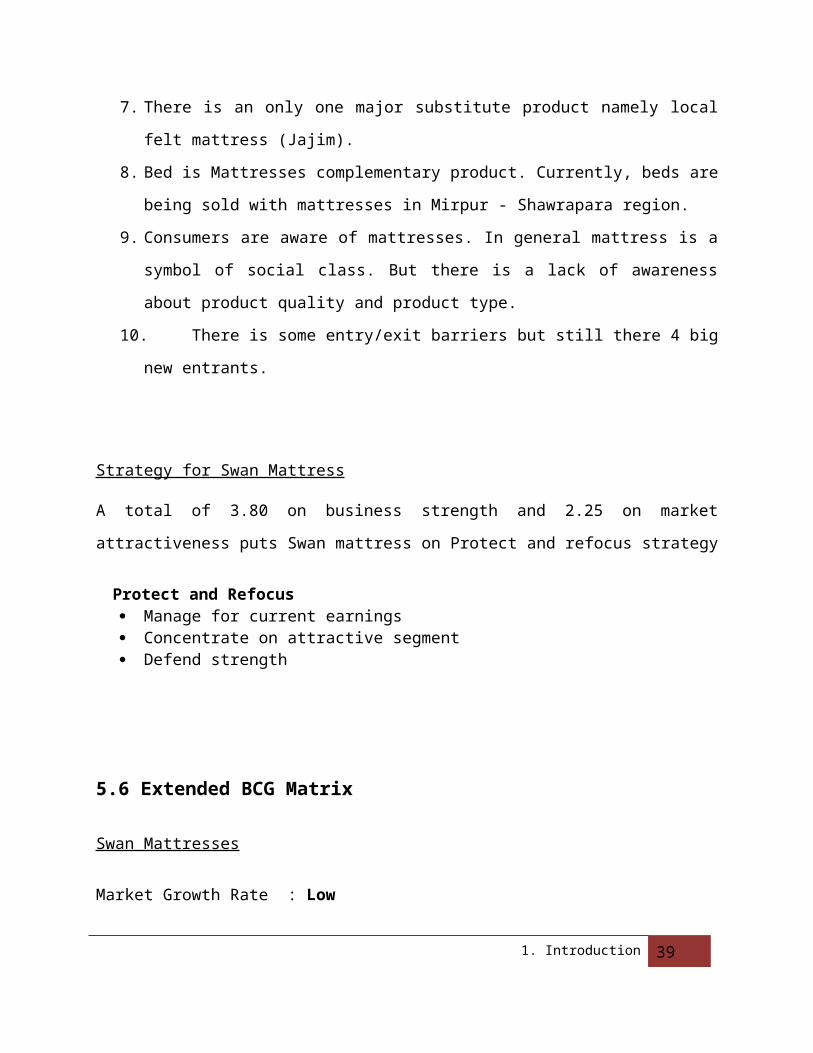
7. There is an only one major substitute product namely local felt mattress (Jajim).
8. Bed is Mattresses complementary product. Currently, beds are being sold with mattresses
in Mirpur - Shawrapara region.
9. Consumers are aware of mattresses. In general mattress is a symbol of social class. But
there is a lack of awareness about product quality and product type.
10. There is some entry/exit barriers but still there 4 big new entrants.
Strategy for Swan Mattress
A total of 3.80 on business strength and 2.25 on market attractiveness puts Swan mattress on
Protect and refocus strategy
Protect and Refocus Manage for current earnings Concentrate on attractive segment Defend strength
1. Introduction 30
Relative Market Share
Market Growth Rate
High Growth Rate
Low Growth Rate
Negative Growth Rate
Star Question Mark
Cash Cow Under-developed
Orphan Dead
Low Market ShareHigh Market Share
5.6 Extended BCG Matrix
Swan Mattresses
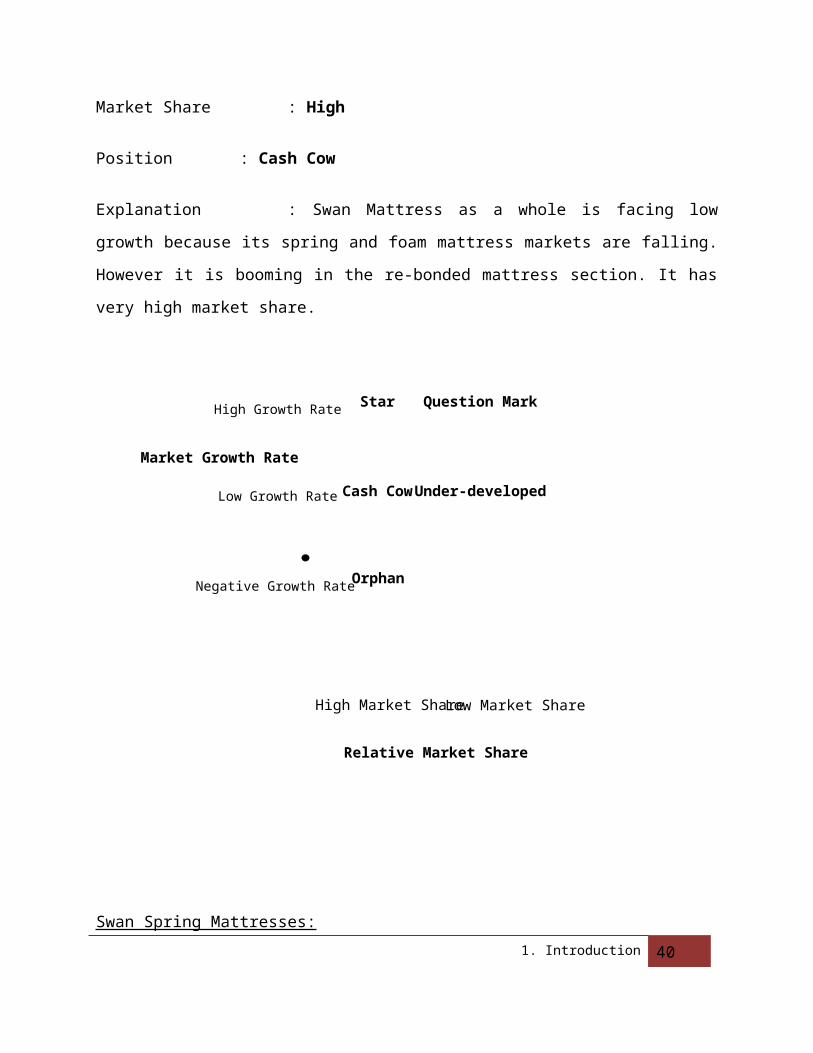
Market Growth Rate : Low
Market Share : High
Position : Cash Cow
Explanation : Swan Mattress as a whole is facing low growth because its spring and
foam mattress markets are falling. However it is booming in the re-bonded mattress section. It
has very high market share.
1. Introduction 31Figure 6. The BCG Matrix
Swan Spring Mattresses:
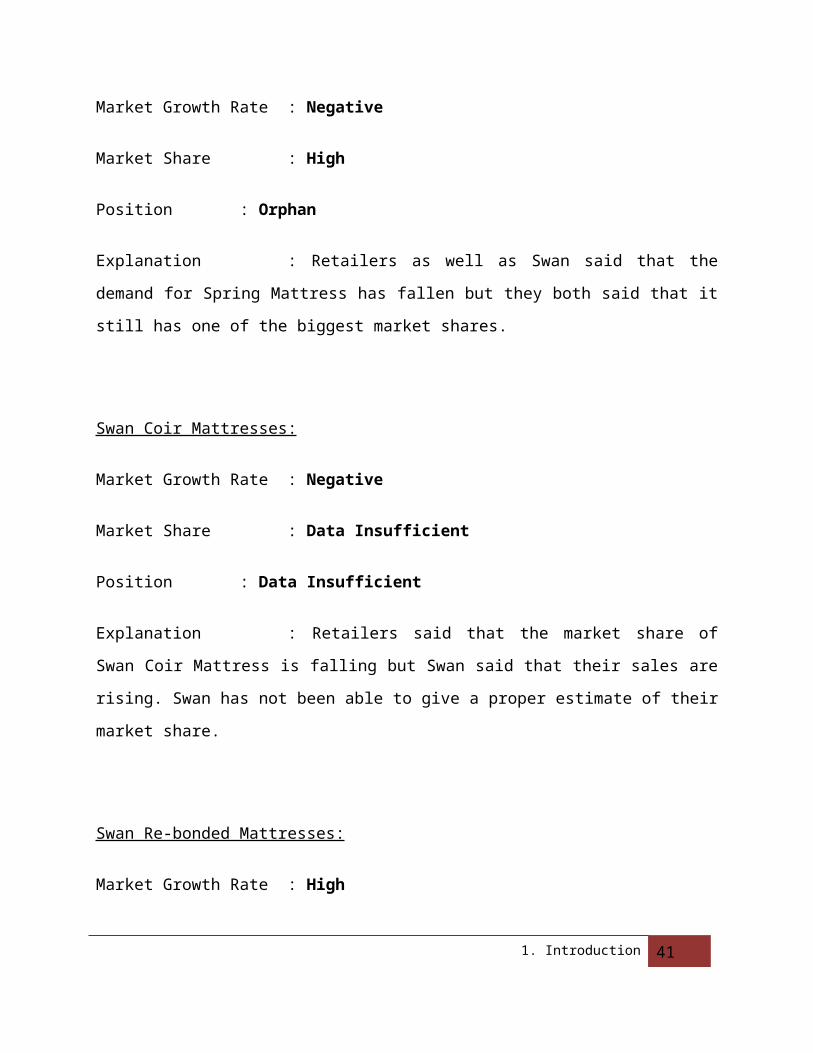
Market Growth Rate : Negative
Market Share : High
Position : Orphan
Explanation : Retailers as well as Swan said that the demand for Spring Mattress has
fallen but they both said that it still has one of the biggest market shares.
Swan Coir Mattresses:
Market Growth Rate : Negative
Market Share : Data Insufficient
Position : Data Insufficient
Explanation : Retailers said that the market share of Swan Coir Mattress is falling but
Swan said that their sales are rising. Swan has not been able to give a proper estimate of their
market share.
Swan Re-bonded Mattresses:
Market Growth Rate : High
Market Share : High
1. Introduction 32
Position : Star
Explanation : Swan as well as their distributor’s claims that re-bonded mattress is
their star product. They are the only producer in Bangladesh and thus hold almost all of the
market share.
Swan Foam Mattresses:
Market Growth Rate : Negative
Market Share : High
Position : Orphan
Explanation : Sales of Foam mattress is very low in the summer, so appropriate data
was hard to get. Overall growth rate is negative because of the introduction of new products.
Swan still holds the highest market share in the foam mattress market.
5.7 Porter’s Five Forces Analysis for Swan Mattress
New Market Entrants
Entry ease/barrier: The initial investment is very high but the market is very big. So, this
market attracts big investment players such as Akhter Furniture, Bengal Group, OTOBI, and
Curl-on Mattress.
Geographical Factors: The recent entrants have some form of geographical specialization.
For instance, LOCO coir Mattress Company specializes in selling in the Chittagong region.
Only Swan and Karmo has extensive network in most of Bangladesh. Most other companies
1. Introduction 33
still have untapped areas. Eurasia has mattresses in Dhaka and Khulna. There network in the
other divisions are not that strong.
New Entrant Strategy: The last big new entrant was Coirex. They focused on Specialization
into coir mattresses. Currently they have a very good image about their coir mattresses in the
market.
Routes to Market: Swan uses three routes to the market.
1. For corporate buyers, they sell directly via personal negotiation. This includes their
sales with OTOBI.
2. For Distributors, they sell their mattress to their distributors who sell to the retailers.
3. They also have 33 Marketing executives roaming around Bangladesh. They find
potential distributors or retailers.
These are three potential routes to market that the new entrants can avail.
Buyer Power
Buyer size/number: Since mattress is a luxury product, the number of buyers is very limited
in Bangladesh as it is costly compared to the available substitutes.
Bargaining leverage: In a particular market, there is very little option for bargaining.
However, the prices vary from area to area. Such as, elephant road markets sell at a lower
price than the gulshan markets.
Product differentiation: Consumers have more than one choice for mattress types.
Buyer incentives: None of the companies provide any incentives for returning customers.
Price sensitivity: In a retail market in a particular area, the prices of the different brands of
mattresses are the same. So, there is no option for price sensitivity in relation to brands.
Substitutes available: There is only one significant substitute, which are the local felt
mattresses.
Product/Technology Development
1. Introduction 34
Alternatives’ price/quality: The local felt mattresses are very cheap compared to the factory
mattresses. However, they are not as long lasting as the factory ones.
Fashion and trends: Coir mattresses are becoming very popular with older customers. Also,
foam mattresses are rapidly declining in demand due to health hazards.
Potential alternatives: There are many different types of mattresses in other countries not
sold in Bangladesh.
Supplier Power
Supplier concentration: There are only two suppliers of coir mattresses in Bangladesh. For
the other types, most of the raw materials are imported from China.
Geographical coverage: Since communication in Bangladesh is sufficient, so coverage is
not an issue in this regard. Most of the raw materials are imported in Chittagong port, so the
coverage is similar for all the competitors.
Competitive Rivalry
Number and size of firms: There are many small and big players in the market.
Industry size and trend: The market is not that big. The industry is growing but at a very
low rate.
Costs: There is a huge establishment cost, but unit costs are not very high.
Products ranges: There are many different types of products like spring, coir, felt, re-
bonded, foam, etc.
Differentiation: The perceived differences are made by the retailers and the advertisements.
The companies claim quality differentiation but customers are largely unaffected by it
according to retailers.
1. Introduction 35
5.8 Conjoint Matrix
The data for the conjoint matrix could not be collected because the customers could not be
identified. The retailers did not have any database and because the product has a huge lifetime
so one customer could tell us about one brand at a time.
6. Strategies
6.1 Goal Setting
There are problems with the organization goals of Swan Industries. They subjectively set the
targets for each month. They have incentives for people who achieve their targets and
punishment systems if they fail to reach 80% of their target mark. However, the goals are
largely unrealistic and seldom met. Also, the company does not take into account the
variability of sales on a per month basis, even though the management recognizes that there
are some off-seasons. As a result, the employees are not motivated enough to achieve the
organization targets.
Also, they assign sales quotas on retailers and dealers. They have 15% commission on sales
below target and extra commissions for every unit sold above target. This sales quota is often
1. Introduction 36
Problem Identification:
Unrealistic periodic targets
Limited production capacity
Retailer Dissatisfaction
Proposed Strategy:
Goal Setting
very unrealistic to attain. Also, the 15% commission is the lowest amongst all the other
competitors. So, the retailers are largely de-motivated to sell Swan products. So, retailers try to
push brands with higher commission rates.
So, realistic goals need to be defined. This will not only help improve employee performance
but also serve as the benchmark against which employee performance can be evaluated. For
this purpose, sales forecasting needs to be done. If sales are predicted accurately, then realistic
targets can be set for the firm, retailers and the employees will be motivated to work harder.
Also, if employees can actually achieve their targets and get the associated benefits, the
turnover rate of employees will also decrease.
From the retailers, realistic targets will ensure achievement of goal if they give proper effort.
Then they can get the extra incentive regularly. This will motivate them to sell Swan products.
Survey on 22 retail outlets has shown that almost all retailers have dissatisfaction over Swan’s
commission. But, the commission cannot be changed because the price of the market is set
according to Swan’s product prices. If, Swan cut down their price, the competitors immediately
respond to place themselves below Swan’s price.
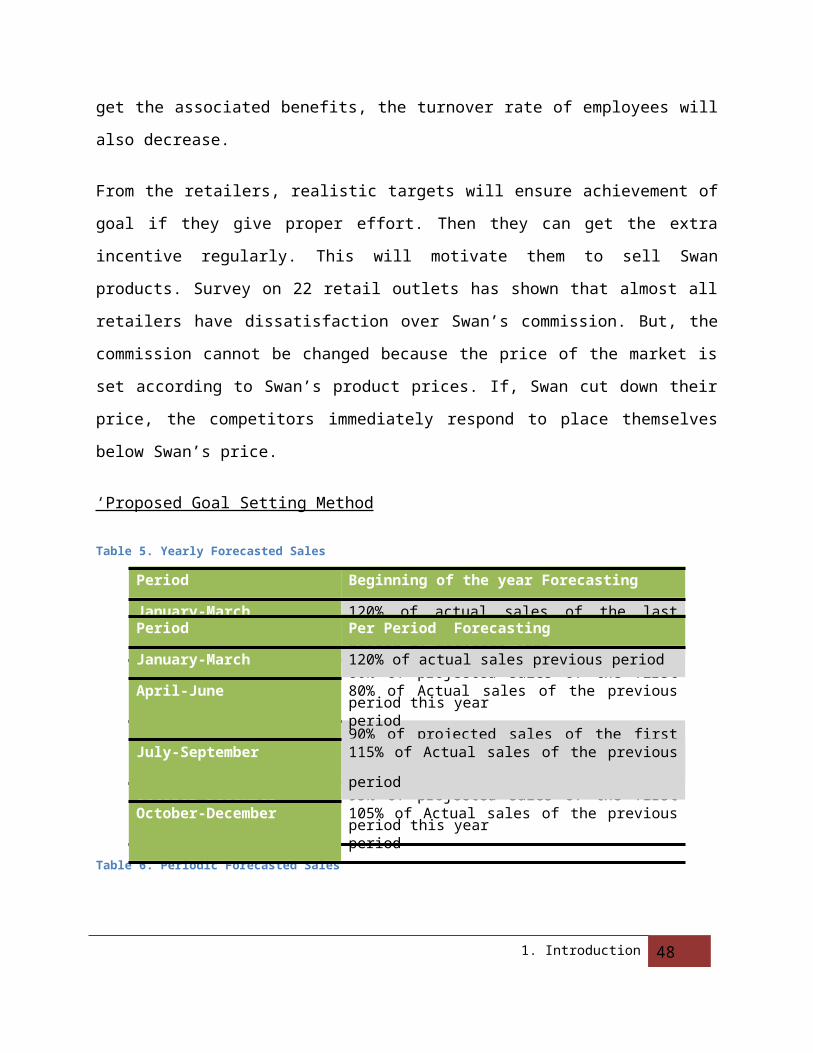
‘Proposed Goal Setting Method
Table 5. Yearly Forecasted Sales
Table 6. Periodic Forecasted Sales
1. Introduction 37
Period Beginning of the year Forecasting
January-March 120% of actual sales of the last period of previous year
April-June 80% of projected sales of the first period this year
July-September 90% of projected sales of the first period this year
October-December 95% of projected sales of the first period this year
Period Per Period Forecasting
January-March 120% of actual sales previous period
April-June 80% of Actual sales of the previous period
July-September 115% of Actual sales of the previous period
October-December 105% of Actual sales of the previous period
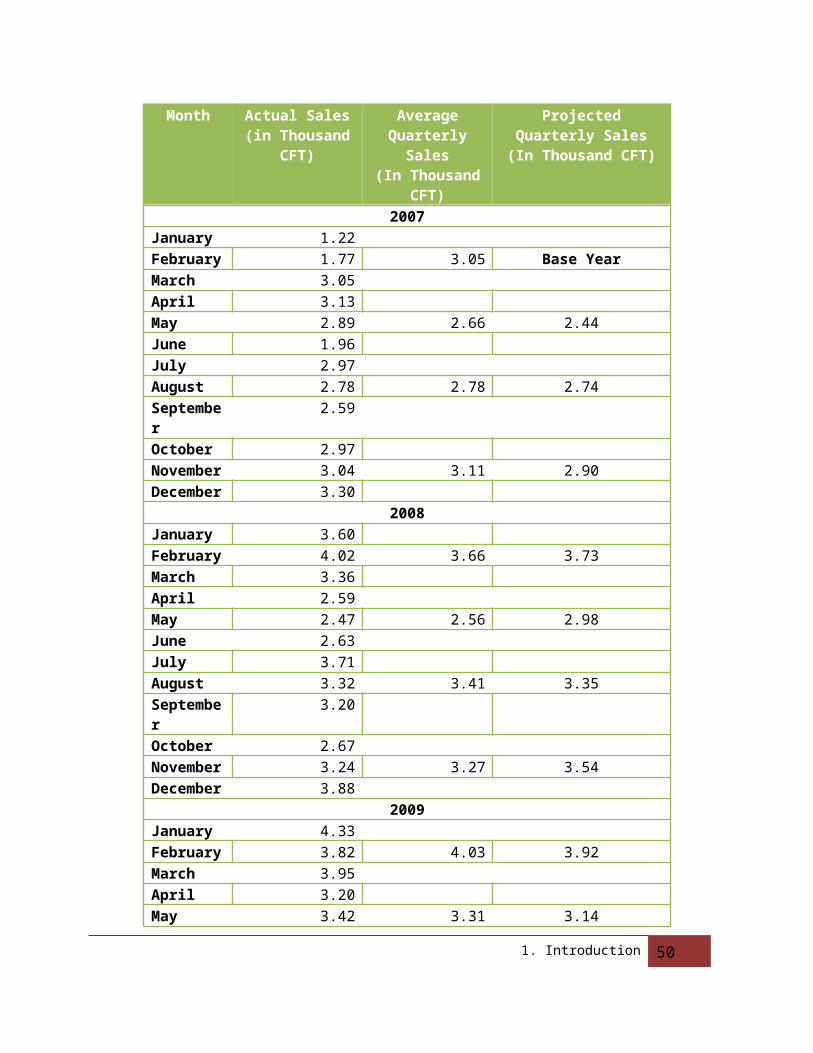
We are proposing to implement a quarterly Goal Setting strategy. In their sales graph, we can
see a vague cyclic pattern. There are two rises in the sales graph of most of their products. One
starts from around November and goes downhill towards the February. Then there is a spike of
sales during June-July. To broadly incorporate these changes, we propose a quarterly sales
target setting. For each quarter, the per-month target should be fixed. For that purpose, we
have analyzed the re-bonded mattresses sales data and came up with these ratios. Some of the
actual analysis is given below
1. Introduction 38
Month Actual Sales(in Thousand CFT)
AverageQuarterly Sales
(In Thousand CFT)
Projected Quarterly Sales(In Thousand CFT)
2007January 1.22 February 1.77 3.05 Base YearMarch 3.05 April 3.13 May 2.89 2.66 2.44June 1.96 July 2.97 August 2.78 2.78 2.74September 2.59 October 2.97 November 3.04 3.11 2.90December 3.30
2008January 3.60 February 4.02 3.66 3.73March 3.36 April 2.59 May 2.47 2.56 2.98June 2.63 July 3.71 August 3.32 3.41 3.35September 3.20 October 2.67 November 3.24 3.27 3.54December 3.88
2009January 4.33 February 3.82 4.03 3.92March 3.95 April 3.20 May 3.42 3.31 3.14
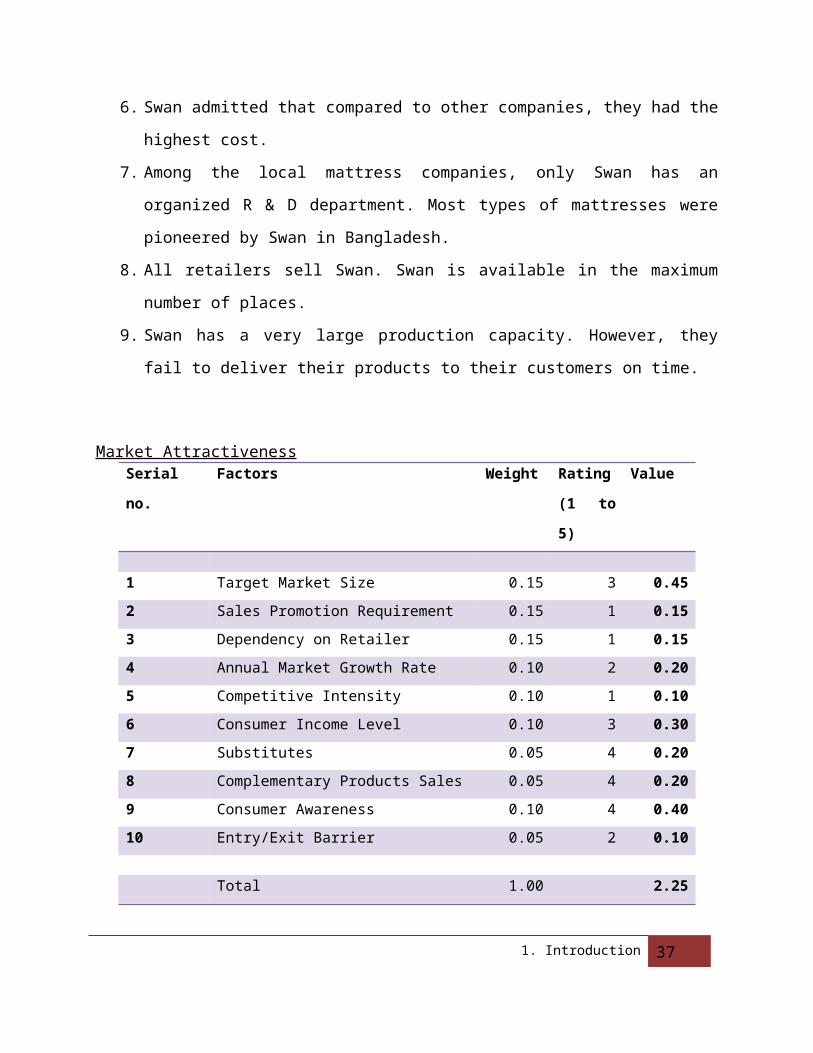
Table 7. Rebonded Mattress Sales Analysis
We have also conducted the chi-square analysis for this data.
ω2=( f o−f e)
2
f e
Degree of Freedom ω2 from the ω2 table at
95% confidence interval
Result
2.04 8 2.73 Accepted
Table 8. Chi-Square Analysis
Currently, Swan Industries have a lot of pending orders for business buyer in both the foam and
the mattress divisions. The negative implications of this scenario are two-fold; firstly, existing
buyers become unhappy, thus hampering future relationships and secondly, Swan Industries
loses out on a lot of potential buyers and orders.
With a proper method of forecasting demand, Swan can find a value of expected sales and thus
adjust their production capacity accordingly.
1. Introduction 39
6.2 Demand forecasting
Mattress is a product which is bought most by people when they are starting a family or moving
into a new home. According to retailers and manufacturers, people buy mattresses mostly
when a wedding is about to take place sometime in the near future.
(See appendix for sales data and histograms)
So, if data can be found which foretells during which months most weddings take place, then
promotional activities can be directed to hit those opportunities. Sales Data shows huge sales in
June-July and in December-January. Interestingly, these are the times when wedding usually
take place.
For this purpose, the propose strategy is to elicit wedding cycle trends by collecting information
from different community centers. Data will be collected from different community centers and
the collective trends will be analyzed to find out the most appropriate time for the promotional
activities. Since people start shopping for weddings a months prior to the event, so promotion
should be highest around that time.
Also, there is a problem that data is not recorded about those orders which are not accepted.
So, the actual demand cannot be fully understood. Swan already employs an operator service.
1. Introduction 40
Opportunity Identification:
High demand seasons
Proposed Strategy:
Demand forecasting of occasions
Change in order receiving method
What we propose is that the operator records every order data before diverting the call to the
sales executive. This way every order data will be recorded even if the executives do not record
it. This will help forecast future demands and prepare production capacities accordingly.
6.3 Memory foam
Swan Industries has the technology and the capacity to manufacture a special type of foam
named Memory Foam (industrial name Visco-elastic foam). The uniqueness of this foam is that
it has therapeutic qualities. People who have orthopedic problems can use this foam to relieve
pain. Since Swan Industries is the only company who produces this product in Bangladesh, this
product has enormous market potential.
To promote this product, Swan should use Public Relations (PR) as the initial marketing
strategy. Doctors who specialize in orthopedics should be provided free samples so that they
can see the beneficial effects of this foam. If the product gives significant benefits to the ailing
patients, then this product could be recommended by doctors to patients, thus increasing
demand and subsequently, sales.
Since Swan already has the machineries for manufacturing memory foam, no extra fixed costs
will be incurred.
1. Introduction 41
Opportunity Identification:
Blue Ocean for therapeutic foam
Proposed Strategy:
Marketing public relations
Project Evaluation
We have analyzed the Project of taking Memory Foam Mattresses. For that we had to calculate
Weighted Average cost of capital = WACC. For Swan Mattresses the WACC=23.52%. The
Calculation is shown below:
Return on Debt rd=14 % Return on Equity re=30 %
Debt/Value d / v=30 % Equity/Value e /v=70 %
Tax Rate t=40 %
Weighted Average
Cost of CapitalWACC=
r d∗(1−t )∗d
v+
r e∗e
v
WACC=23.52 %
Table 9. WACC Calculation
In this project, there are three main cash flows.
1. Cash Inflow = Contribution Margin generated through seller
2. Cash Outflow = Initial Investment
3. Cash Outflow = Tax Effects of All related cash flows
4. Cash Inflow = Tax Benefits of Additional Strategy
5. Cash Outflow = Erosion Effect of Swan Foam
After Calculation, Net return for Memory Foam for two year in Swan is 26.25 Lac. Here, we have
assumed that Memory-foam Mattress will follow the same promotional pattern as their re-
bonded mattress. Also, we took Contribution Margin to incorporate cost into revenues. Total
project evaluation is shown in the next page.
1. Introduction 42
Calculation of Return on Investment for two years
0 Q1-Y1 Q2-Y1 Q3-Y1 Q4-Y1 Q1-Y2 Q2-Y2 Q3-Y2 Q4-Y2
Cost to provide Sample
foams to Doctors
৳
(105,000)
Misc. Cost for Initial
Promotion
৳
(100,000)
Tax Benefits of Cost ৳
82,000
Projected Profits ৳
30,043
৳
525,193
৳
810,164
৳
676,880
৳
898,099
৳
1,187,406
৳
1,240,455
৳
1,385,679
Discounted Profits ৳
5,088,972
৳
28,527
৳
473,543
৳
693,638
৳
550,291
৳
693,305
৳
870,402
৳
863,419
৳
915,847
Tax (40%) ৳
(12,017)
৳
(210,077)
৳
(324,066)
৳
(270,752)
৳
(359,239)
৳
(474,962)
৳
(496,182)
৳
(554,271)
Discounted Taxation ৳
(2,035,589)
৳
(11,411)
৳
(189,417)
৳
(277,455)
৳
(220,116)
৳
(277,322)
৳
(348,161)
৳
(345,368)
৳
(366,339)
10% Erosion Effect on
Swan Super
৳
3,004
৳
52,519
৳
81,016
৳
67,688
৳
89,810
৳
118,741
৳
124,046
৳
138,568
Discounted Erosion
Effect
৳ ৳
2,853
৳
47,354
৳
69,364
৳
55,029
৳
69,331
৳
87,040
৳
86,342
৳
91,585
1. Introduction 43
508,897
Tax Advantage Erosion
(40%)
৳
1,202
৳
21,008
৳
32,407
৳
27,075
৳
35,924
৳
47,496
৳
49,618
৳
55,427
Discounted Tax
Advantage
৳
203,559
৳
1,141
৳
18,942
৳
27,746
৳
22,012
৳
27,732
৳
34,816
৳
34,537
৳
36,634
NPV (Dollar ROI) ৳
2,625,045
Percentage ROI 1380.51%
Table 10. ROI Calculation
NPV =∑ PV of allCashFlows=−105000−100000+82000+5088972−2035589+508897+203559=BDT 2,625,045
Percentage Return on Investment=∑ PV of allCashFlows related ¿ project except initial investment ¿∑ Initial Investments
=82000+5088972−2035589+508897+203559105000+100000
=1380.51 %
1. Introduction 44
6.4 Customer awareness
From the people interviewed and consumer surveys conducted, it was found out that most
consumers know little or almost nothing about mattresses. They are unaware of the types of
mattresses and their qualities and most of the time; their purchase decision is affected by the
retailers who tend to push sale other brands for more profit.
Swan has the biggest portfolio of products. They are the pioneers of most of the different types
of mattresses in Bangladesh. Also, Swan Industries is the only organization which organizes
periodic consumer-manufacturer forums. The most recent of them was held on May 24, 2009.
In these forums, the views and suggestions of the consumers are noted so that they can be
used to improve the quality of the products. Also they supply to various manufacturing giants
such as OTOBI and Akhter Furniture. Swan can use these companies Brand Equity by
mentioning this information in their advertisements. It will be a win-win situation for all of the
companies as Swan itself has a large Brand Equity.
Swan’s advertisements do not reflect their strengths. (See appendix for sample print ad). Most
consumers do not have any knowledge about their consumer-manufacturer forums. For this
reason, our proposed strategy is to redesign their advertisements. If consumers are made
aware of Swan’s advantages over other companies, this can significantly improve their brand
image.
1. Introduction 45
Problem Identification:
Low consumer knowledge
Proposed Strategy:
Revamping advertisements
We also propose that they make specialized advertisements for different product divisions.
Currently, all their advertisements are focused on mass marketing. They try to sell adhesives to
woodworkers with the same advertisement which tells modern high range income group to buy
Swan’s mattresses. This strategy is very unlikely to work.
Proposed Swan Advertisement
Swan Mattresses
Catch Phrase
How far can you go for your best nap? It pays to sleep well. Good sleep, great day.
Supporting Data
Certification related data (Swan has ISO-9001) Famous Suppliers of Swan (Akhter Furniture, Bengal etc) Quality Ensuring data Warranty Information about Forum
Since Swan mattresses already give print ads in newspapers regularly, the new ads will not cause any additional costs.
6.5 Customer retention
1. Introduction 46
Opportunity Identification:
No retention strategies offered by any company
Proposed Strategy:
Exchange offer
Swan Industries is the pioneer in the mattress industry. Although quantitative market share
data could not be determined, according to retailers Swan has the highest market share and
the largest base of existing customers.
Currently, none of the mattress companies have any sort of retention strategy for the
consumers. The old mattresses are made of materials that can be reused and incorporated into
new mattresses.
So, our proposed strategy is introducing an exchange offer for the consumers. They can give
their old mattresses back to Swan and take new mattresses in exchange. This will help retain
old consumers and improve sales.
To develop this strategy, we need the price of the old foam mattress which Swan buys from
others. Also we need the demand state of re-bonded mattress so that we can assess the
amount of leverage we can attain. We have used project analysis to assess the NPV and the
Percentage ROI from this campaign for rebounded Mattress. We only assessed the effect of
retaining foams and selling re-bonded mattresses at a discount. The actual project can retain
foam, rebounded and spring mattresses and sell any mattresses. The discount will be in the
form of a buy-back offer. Discount will be equal to the buy-back rate of the mattress.
This will also have some retailer benefits which will exceed their cost for retaining one of these
old mattresses. This will further motivate them to sell Swan products.
Since almost all competitors still cannot produce Re-bonded mattresses themselves. So, this
move will be hard to mirror for the competitors.
(See overleaf for calculations) Assumptions include:
1. 20% of the required foam for rebounded mattress will come from this retention campaign.
2. Re-bonded mattress price will be fixed at BDT 790 till the second quarter of 2011.3. There will be a 10% synergy effect on sales of mattresses for this campaign.
1. Introduction 47
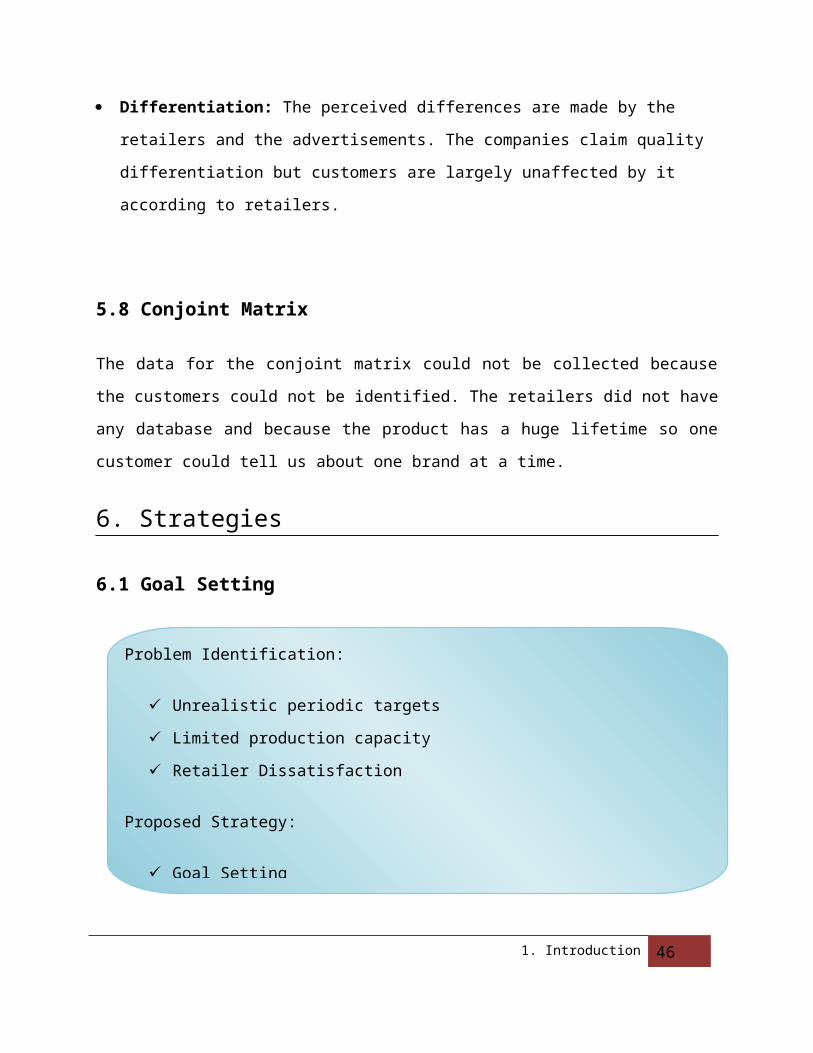
Table 11. ROI Calculation
0 Q3-Y2009
Q4-Y2009
Q1-Y2010 Q2-Y2010
Q3-Y2010 Q4-Y2010
Q1-Y2011
Q2-Y2011
Cost Retailer advertising ৳(300,000)
Tax Benefit on Cost ৳120,000
Value of Foam Acquired (Cost Saving)
৳359,254
৳ 379,212
৳ 455,055
৳ 364,044
৳ 409,549
৳ 432,302
৳ 518,763
৳ 415,010
Commission ৳(119,751)
৳(126,404)
৳ (151,685)
৳ (121,348)
৳ (136,516)
৳ (144,101)
৳ (172,921)
৳ (138,337)
Cost of Acquisition ৳ (71,851)
৳ (75,842)
৳ (91,011)
৳ (72,809)
৳ (81,910)
৳ (86,460)
৳ (103,753)
৳ (83,002)
Benefits from Campeign ৳ 167,652
৳ 176,966
৳ 212,359
৳ 169,887
৳ 191,123
৳ 201,741
৳ 242,089
৳ 193,671
Discounted Benefits ৳ 1,230,621
৳ 159,195
৳ 159,562
৳ 181,815
৳ 138,115
৳ 147,541
৳ 147,882
৳ 168,506
৳ 128,005
Tax on Benefits ৳ (67,061)
৳ (70,786)
৳ (84,944)
৳ (67,955)
৳ (76,449)
৳ (80,696)
৳ (96,836)
৳ (77,469)
Discounted Tax ৳(492,248)
৳(63,678)
৳ (63,825)
৳ (72,726)
৳ (55,246)
৳ (59,017)
৳ (59,153)
৳ (67,402)
৳ (51,202)
Synergy Contribution Margin
৳ 182,757
৳ 192,910
৳ 231,492
৳ 185,194
৳ 208,343
৳ 219,917
৳ 263,901
৳ 211,121
Discounted Synergy ৳ 1,341,497
৳ 173,538
৳ 173,938
৳ 198,197
৳ 150,559
৳ 160,834
৳ 161,206
৳ 183,688
৳ 139,538
Tax on Synergy ৳ (73,103)
৳ (77,164)
৳ (92,597)
৳ (74,077)
৳ (83,337)
৳ (87,967)
৳ (105,560)
৳ (84,448)
Discounted Tax ৳(536,599)
৳ (69,415)
৳ (69,575)
৳ (79,279)
৳ (60,224)
৳ (64,334)
৳ (64,482)
৳ (73,475)
৳ (55,815)
NPV (Doller return on Investment)
৳ 1,363,271
1. Introduction 48
Percentage ROI 554.42%
NPV =∑ PV of allCashFlows for 2 years=−300000+120000+1230621−492248+1341497−536599=BDT 1,363,271
P ercentage Return on Investment=∑ PV of allCashFlows related t o project except initial investment
∑ Initial Investments=
120000+1230621−492248+1341497−536599300000
=554.42 %
Projected
Quantity
Projected Sales
Volume
Quantity after
Synergy
Sales Volume
after Synergy
Value of Foam
Required
Value of Foam
Acquired
Synergy Quantity
Synergy Sales
Volume
Synergy CM
Q3 -Y2009
10886.48 ৳ 8,600,320
11975.13
৳ 9,460,352
৳ 1,796,269
৳ 359,254
1088.65 ৳ 860,032
৳ 182,757
Q4-Y2009
11491.29 ৳ 9,078,116
12640.41
৳ 9,985,927
৳ 1,896,062
৳ 379,212
1149.13 ৳ 907,812
৳ 192,910
Q1-Y2010
13789.54 ৳ 10,893,739
15168.50
৳ 11,983,113
৳ 2,275,275
৳ 455,055
1378.95 ৳ 1,089,374
৳ 231,492
Q2-Y2010
11031.63 ৳ 8,714,991
12134.80
৳ 9,586,490
৳ 1,820,220
৳ 364,044
1103.16 ৳ 871,499
৳ 185,194
Q3-Y2010
12410.59 ৳ 9,804,365
13651.65
৳ 10,784,801
৳ 2,047,747
৳ 409,549
1241.06 ৳ 980,436
৳ 208,343
Q4-Y2010
13100.07 ৳ 10,349,052
14410.07
৳ 11,383,957
৳ 2,161,511
৳ 432,302
1310.01 ৳ 1,034,905
৳ 219,917
Q1-Y2011
15720.08 ৳ 12,418,86
17292.09
৳ 13,660,74
৳ 2,593,81
৳ 518,763
1572.01 ৳ 1,241,886
৳ 263,901
1. Introduction 49
2 8 3 Q2-
Y201112576.06 ৳
9,935,090 13833.6
7 ৳ 10,928,599
৳ 2,075,050
৳ 415,010
1257.61 ৳ 993,509
৳ 211,121
Table 12. Projected sales figures
1. Introduction 50
7. Conclusion
The market for mattresses is growing at a very slow rate. Recent trends indicate that firms that
specialize in a single type are making profit than larger firms with more diverse portfolios. Also,
the high rate of imitation among competitors is a detriment towards the introduction of new
products. This is because the firms that bear the cost of R&D cannot recover their investment if
their technology is adapted by competitors too quickly. So, the government needs to impose
certain restrictions in this regard.
Swan Industries have the largest resources among the manufacturing firms. If they invest in the
right areas and implement effective strategies, then they should be able to maintain their
position and market share in the long term.
1. Introduction 50
Appendix A – References
Bibliography
Principles of Marketing 10th edition by Philip Kotler and Gary Armstrong
Marketing Management 12th edition by Philip Kotler and Kevin Lane Keller
Foundations of Marketing Theory (2002) Shelby D. Hunt
Bangladesh Bureau of Statistics Year book 2006
Blue Ocean Strategy by W.Chan Kim & Renee Mauborgne
Jack Trout & Steve Rivkin “Differentiate or Die”
John P Maggard“Positioning Revisited”, Journal of Marketing, vol.40 1976
Syed Ferhat Anwar, Sharif RayhanSiddique, Shakil Huda, “ Extending the BCG matrix:
strengthening the Portfolio Analysis, Journal of Business Adminstration, 1998
www.marketingpower.com
www.wikipedia.com
www.valuebasedmanagment.com
List of People Interviewed
Mr. Khabeer Uddin Khan – CEO (Swan Industries)
Mr. Tarin Khan – MD (Swan Industries)
Mr. Ali Ahmed - General Manager Marketing (Swan Industries)
Mr. Md. Hafizur Rahman – MD (Karmo Mattresses)
Mr. Mahbubul Alam – MD (Coirex Mattress Company)
1. Introduction 51
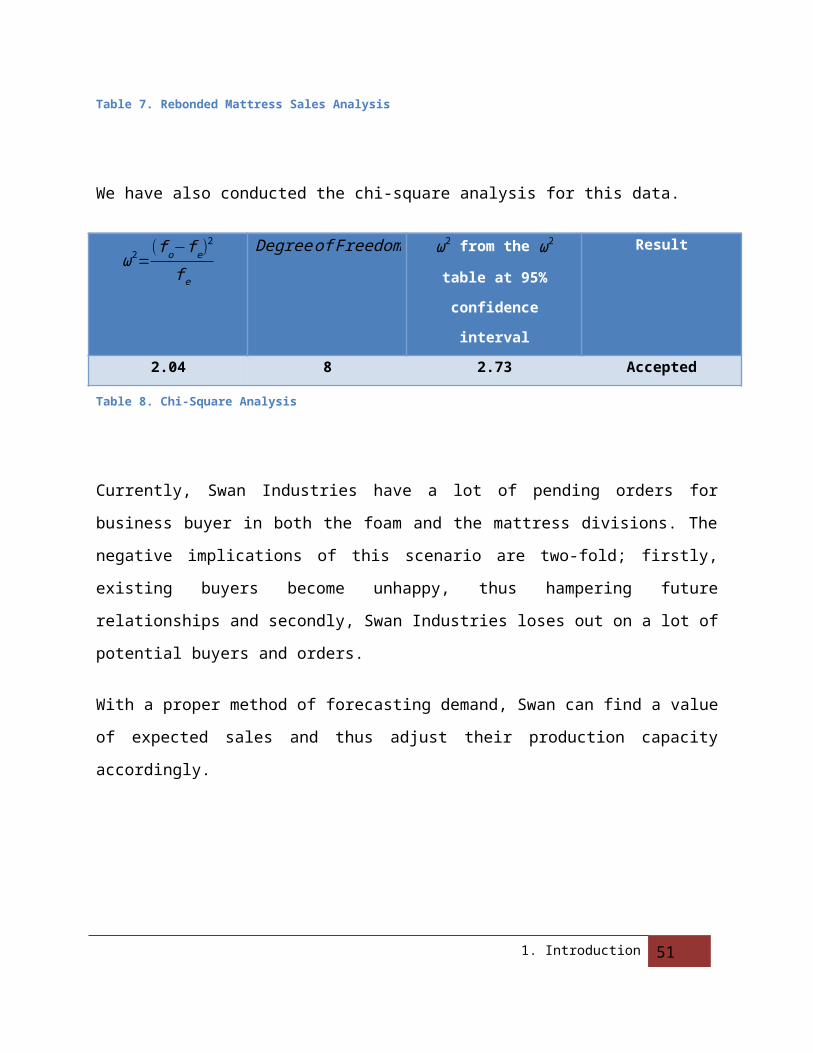
Appendix B– Sample Questionnaire
Company Analysis Questionnaire 1
Mattress Industry Analysis
1. When was the last time you modified your product?
-------------------------------------------------------------------------------------------------------------------------------
-------------------------------------------------------------------------------------------------------------------------------
2. What technologies do you use?
-------------------------------------------------------------------------------------------------------------------------------
-------------------------------------------------------------------------------------------------------------------------------
-------------------------------------------------------------------------------------------------------------------------------
3. How long does your product last?
-------------------------------------------------------------------------------------------------------------------------------
-------------------------------------------------------------------------------------------------------------------------------
4. Where does the Raw Material (Coir, Fabrics etc) come from?
-------------------------------------------------------------------------------------------------------------------------------
-------------------------------------------------------------------------------------------------------------------------------
1. Introduction 52
Important: This survey is being conducted by students of the University of Dhaka for the
course Marketing Management. The data collected will be used solely for educational
purposes.
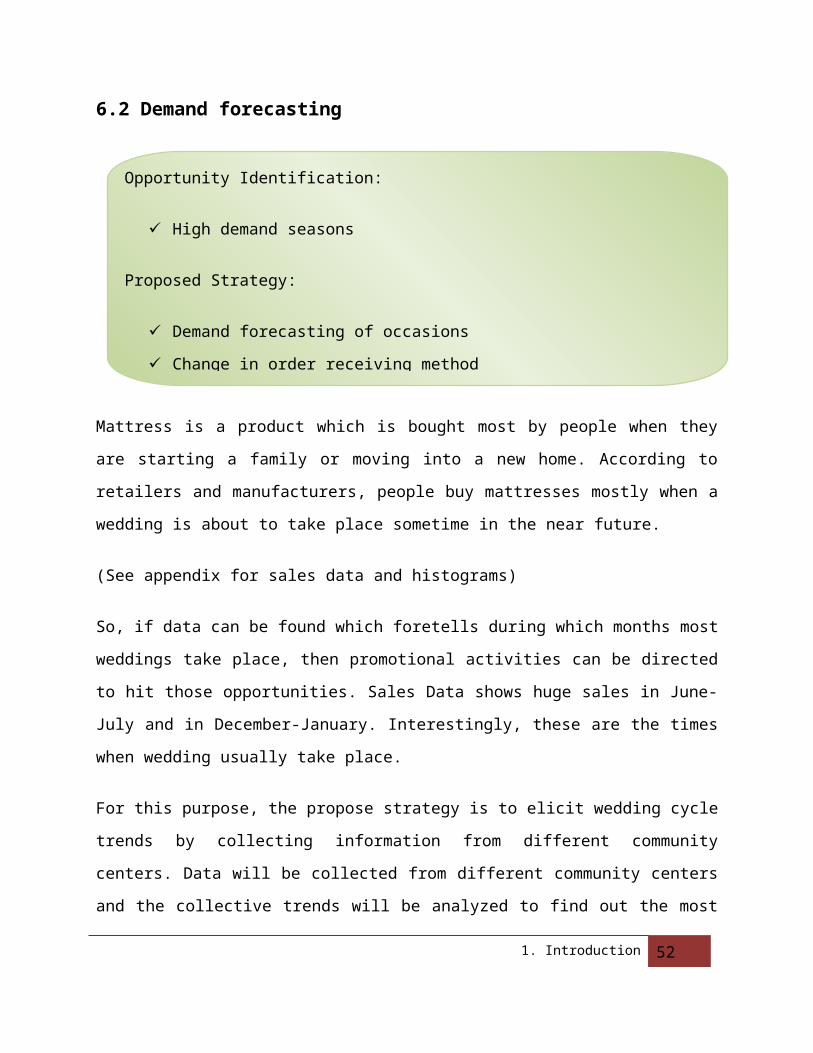
5. Who are your competitors? Rank Them according to their competitiveness.
-------------------------------------------------------------------------------------------------------------------------------
-------------------------------------------------------------------------------------------------------------------------------
6. What type of products do you have?
-------------------------------------------------------------------------------------------------------------------------------
-------------------------------------------------------------------------------------------------------------------------------
7. What are their prices?
-------------------------------------------------------------------------------------------------------------------------------
-------------------------------------------------------------------------------------------------------------------------------
-------------------------------------------------------------------------------------------------------------------------------
8. Do you have any control over market prices?
-------------------------------------------------------------------------------------------------------------------------------
-------------------------------------------------------------------------------------------------------------------------------
-------------------------------------------------------------------------------------------------------------------------------
9. Rate your commission in terms of competitors?
-------------------------------------------------------------------------------------------------------------------------------
-------------------------------------------------------------------------------------------------------------------------------
10. Rate your dealership network and distribution channels in comparison to your
competitors.
-------------------------------------------------------------------------------------------------------------------------------
-------------------------------------------------------------------------------------------------------------------------------
-------------------------------------------------------------------------------------------------------------------------------
1. Introduction 53
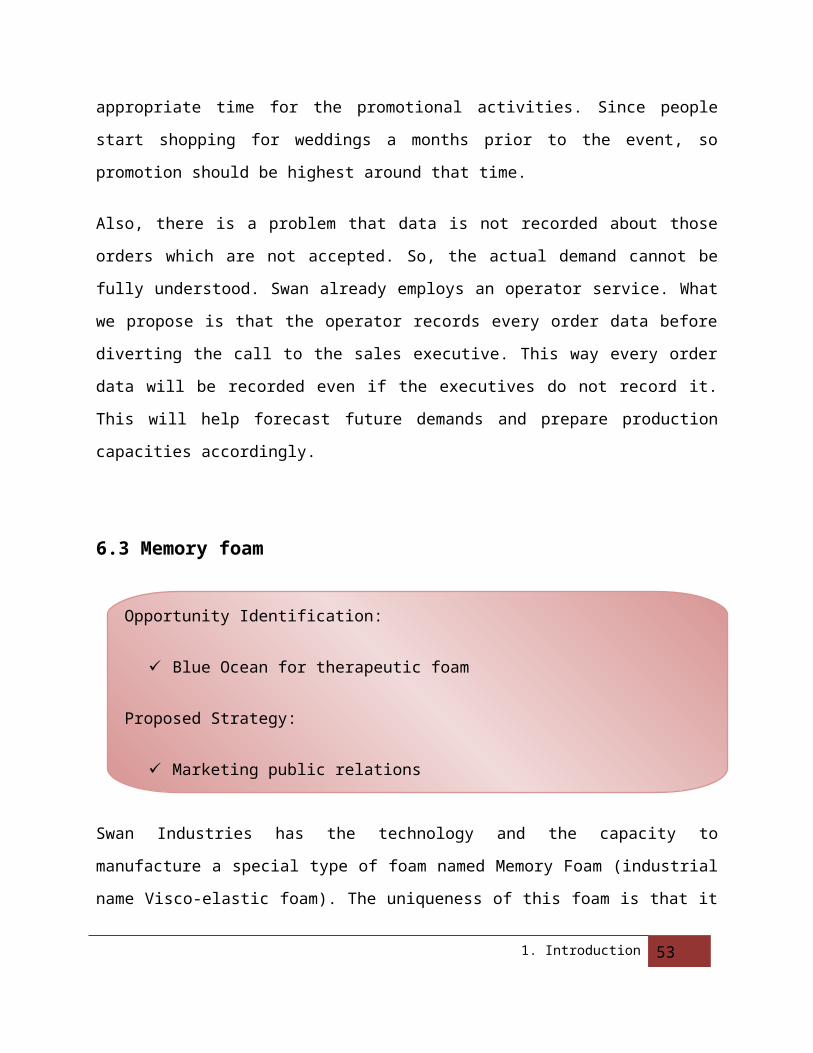
11. What are the Sales Method you employ (check the appropriate box):
Do you sell to Distributors
Do you sell to Dealers Directly
Do you sell to Corporate Buyers
12. Do you sell on Credit?
-------------------------------------------------------------------------------------------------------------------------------
-------------------------------------------------------------------------------------------------------------------------------
-------------------------------------------------------------------------------------------------------------------------------
13. Are you advertising using any form of media? If yes what are the medias, Do you have
any advertising campaign or Media?
-------------------------------------------------------------------------------------------------------------------------------
-------------------------------------------------------------------------------------------------------------------------------
-------------------------------------------------------------------------------------------------------------------------------
14. What is overall company image you want to create in the market?
-------------------------------------------------------------------------------------------------------------------------------
-------------------------------------------------------------------------------------------------------------------------------
1. Introduction 54
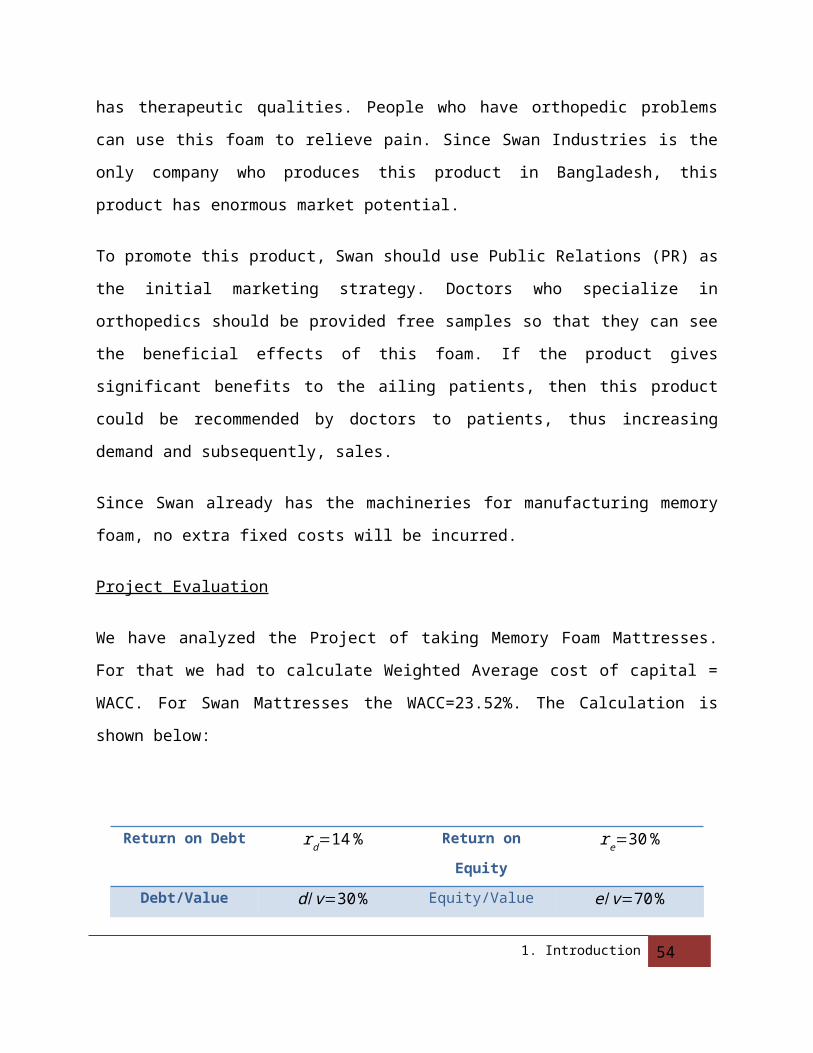
Company Analysis Questionnaire 2
Mattress Industry Analysis
1. Sort the following factors in terms of your company performance.
Factor Strength Weakness
Company reputation
Market share
Customer service
Customer retention
Product quality
Availability
Sales force
Innovation
Cost
Type of products
Delivery time
Administration
Promotion
1. Introduction 55
Important: This survey is being conducted by students of the University of Dhaka for the
course Marketing Management. The data collected will be used solely for educational
purposes.
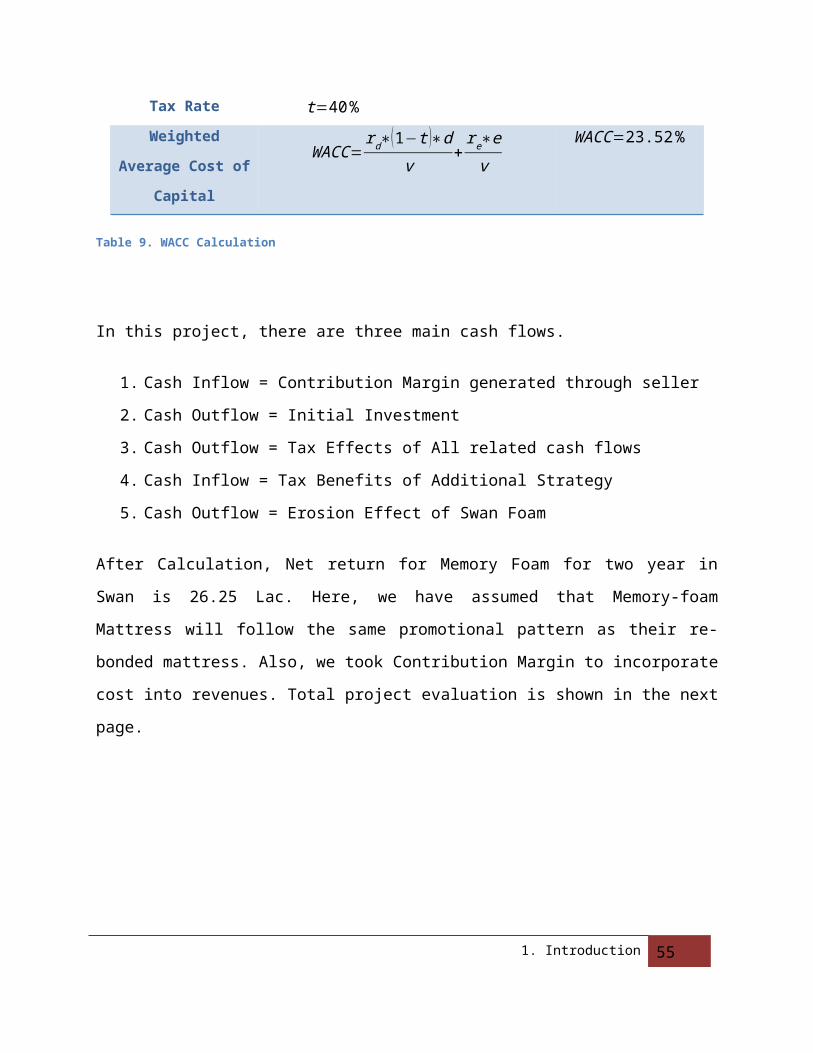
2. What are opportunities could your company avail in the future?
-------------------------------------------------------------------------------------------------------------------------------
-------------------------------------------------------------------------------------------------------------------------------
-------------------------------------------------------------------------------------------------------------------------------
-------------------------------------------------------------------------------------------------------------------------------
3. What factors could become threats to your business in the future?
-------------------------------------------------------------------------------------------------------------------------------
-------------------------------------------------------------------------------------------------------------------------------
-------------------------------------------------------------------------------------------------------------------------------
-------------------------------------------------------------------------------------------------------------------------------
1. Introduction 56
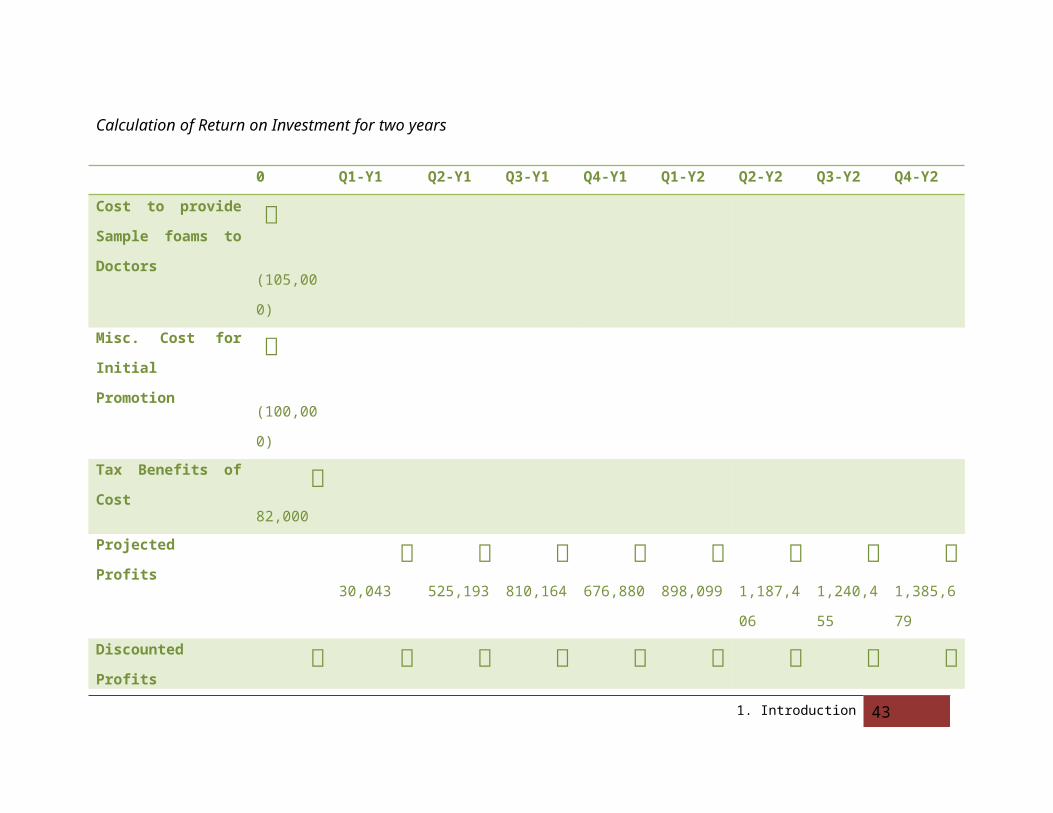
Consumer Top-of-the-Mind Awareness Survey Questionnaire
Mattress Industry Analysis
1. Name a mattress company.
-------------------------------------------------------------------------------------------------------------------------------
2. What types of mattresses are available in Bangladesh?
-------------------------------------------------------------------------------------------------------------------------------
-------------------------------------------------------------------------------------------------------------------------------
1. Introduction 57
Important: This survey is being conducted by students of the University of Dhaka for the
course Marketing Management. The data collected will be used solely for educational
purposes.
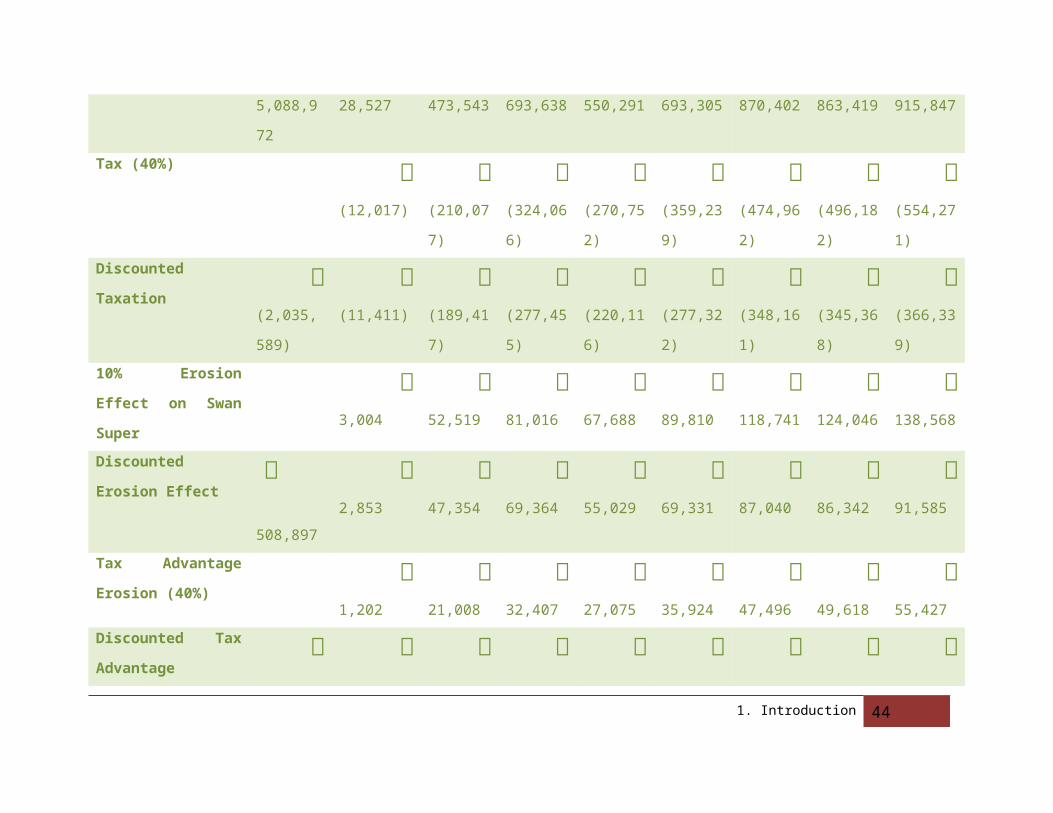
Retailer Questionnaire
Mattress Industry Analysis
1. Which do you think is the best mattress brand?
-------------------------------------------------------------------------------------------------------------------------------
-------------------------------------------------------------------------------------------------------------------------------
-------------------------------------------------------------------------------------------------------------------------------
2. If you sell 10 mattresses, what would be ratio of each brand?
-------------------------------------------------------------------------------------------------------------------------------
-------------------------------------------------------------------------------------------------------------------------------
-------------------------------------------------------------------------------------------------------------------------------
3. Do you have any regrets about any brand?
-------------------------------------------------------------------------------------------------------------------------------
-------------------------------------------------------------------------------------------------------------------------------
-------------------------------------------------------------------------------------------------------------------------------
1. Introduction 58
Important: This survey is being conducted by students of the University of Dhaka for the
course Marketing Management. The data collected will be used solely for educational
purposes.
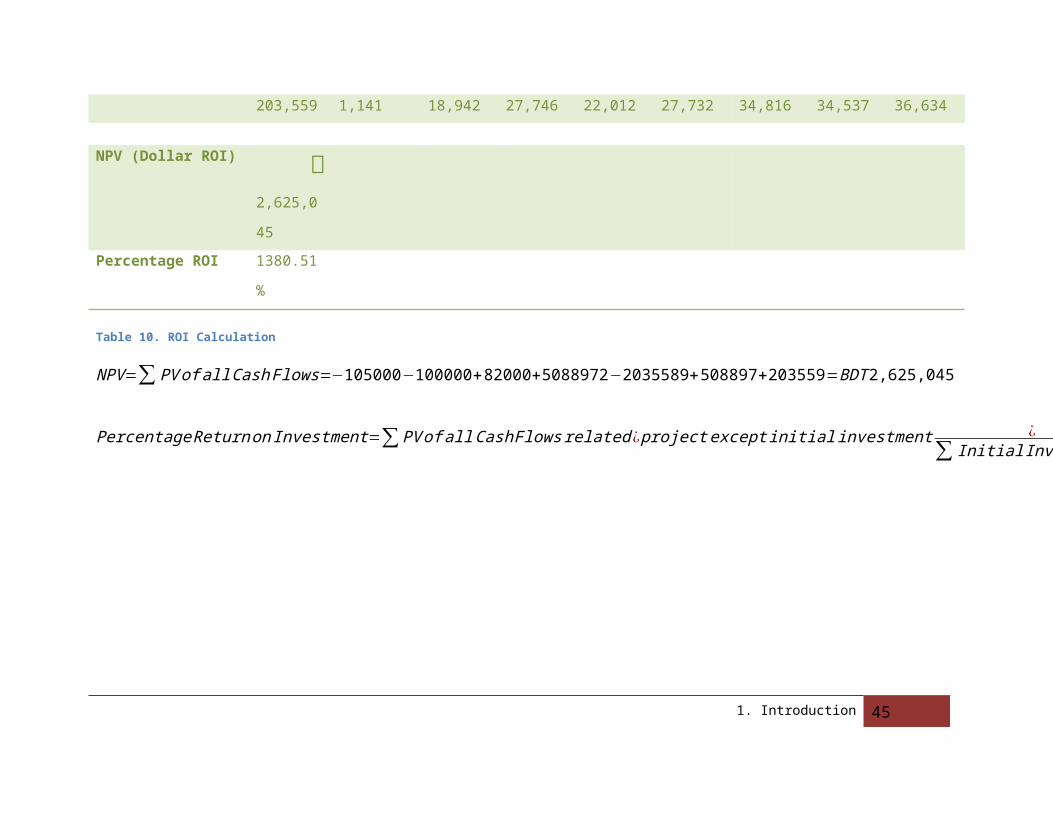
4. Rate the brands?
-------------------------------------------------------------------------------------------------------------------------------
-------------------------------------------------------------------------------------------------------------------------------
-------------------------------------------------------------------------------------------------------------------------------
5. What do the customers ask?
-------------------------------------------------------------------------------------------------------------------------------
-------------------------------------------------------------------------------------------------------------------------------
-------------------------------------------------------------------------------------------------------------------------------
6. In case of commission, rate the brand?
-------------------------------------------------------------------------------------------------------------------------------
-------------------------------------------------------------------------------------------------------------------------------
-------------------------------------------------------------------------------------------------------------------------------
7. In case of sales volume, rate the brand?
-------------------------------------------------------------------------------------------------------------------------------
-------------------------------------------------------------------------------------------------------------------------------
-------------------------------------------------------------------------------------------------------------------------------
8. What brands do you have?
-------------------------------------------------------------------------------------------------------------------------------
-------------------------------------------------------------------------------------------------------------------------------
-------------------------------------------------------------------------------------------------------------------------------
9. What are the new companies?
1. Introduction 59
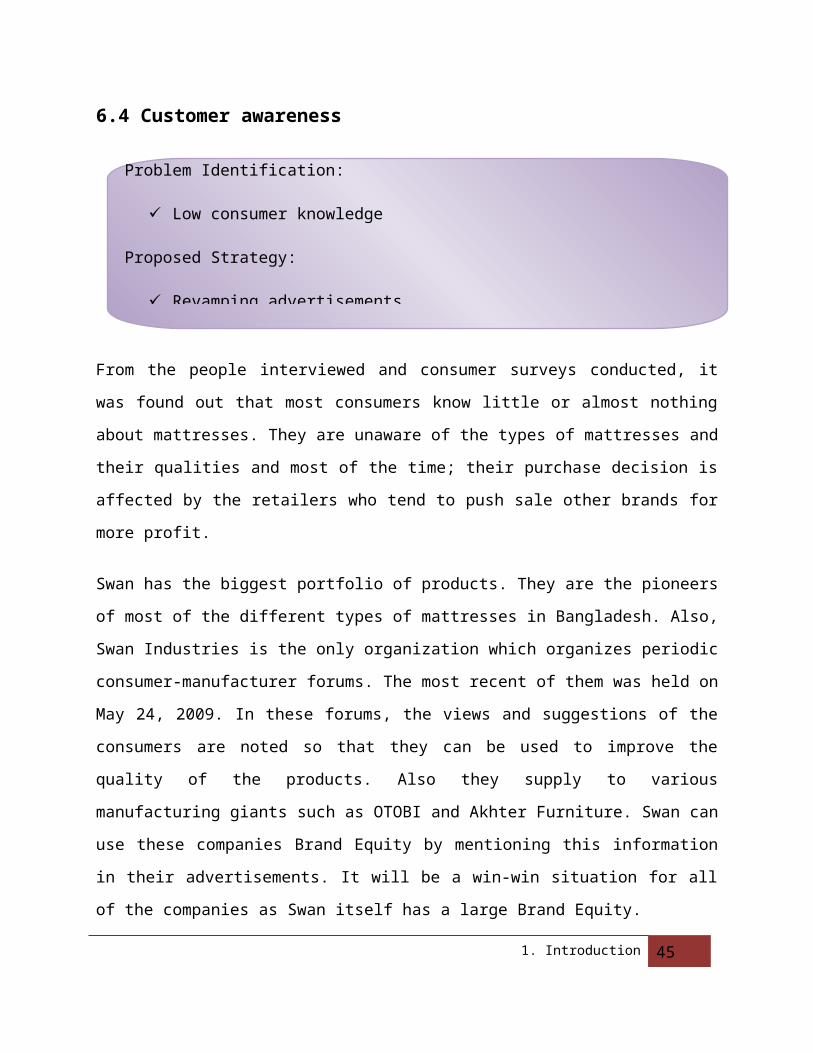
-------------------------------------------------------------------------------------------------------------------------------
-------------------------------------------------------------------------------------------------------------------------------
-------------------------------------------------------------------------------------------------------------------------------
10. What are the new technologies available?
-------------------------------------------------------------------------------------------------------------------------------
-------------------------------------------------------------------------------------------------------------------------------
-------------------------------------------------------------------------------------------------------------------------------
11. Who gives what benefits?
-------------------------------------------------------------------------------------------------------------------------------
-------------------------------------------------------------------------------------------------------------------------------
-------------------------------------------------------------------------------------------------------------------------------
1. Introduction 60
Extensive Questionnaire for Swan Industries
Mattress Industry Analysis
1. Company profile
a. When did Swan Mattress Start?
b. What products were offered initially?
c. How was each product introduced?
d. What is your organizational hierarchy?
e. How many products do they currently offer?
f. How many employees do you have?(Corporate, Factory, Sales)
2. Product
a. What measures do you take to ensure quality from production to sales?
b. What services do you offer with the product?
c. How do you differentiate your products to customers?
3. Pricing
a. What is Swan Mattresses sales volume? Can we have the data for the past year
b. Can we get a cost breakdown for each type of mattress?
c. What type of market research does Swan Mattress do?
d. How do you decide on the price?
4. Distribution
a. What is your distribution channel (Forward Linkage)?
b. How good is your backward linkage?
c. How much does it cost Swan to distribute?
1. Introduction 61
Important: This survey is being conducted by students of the University of Dhaka for the
course Marketing Management. The data collected will be used solely for educational
purposes.
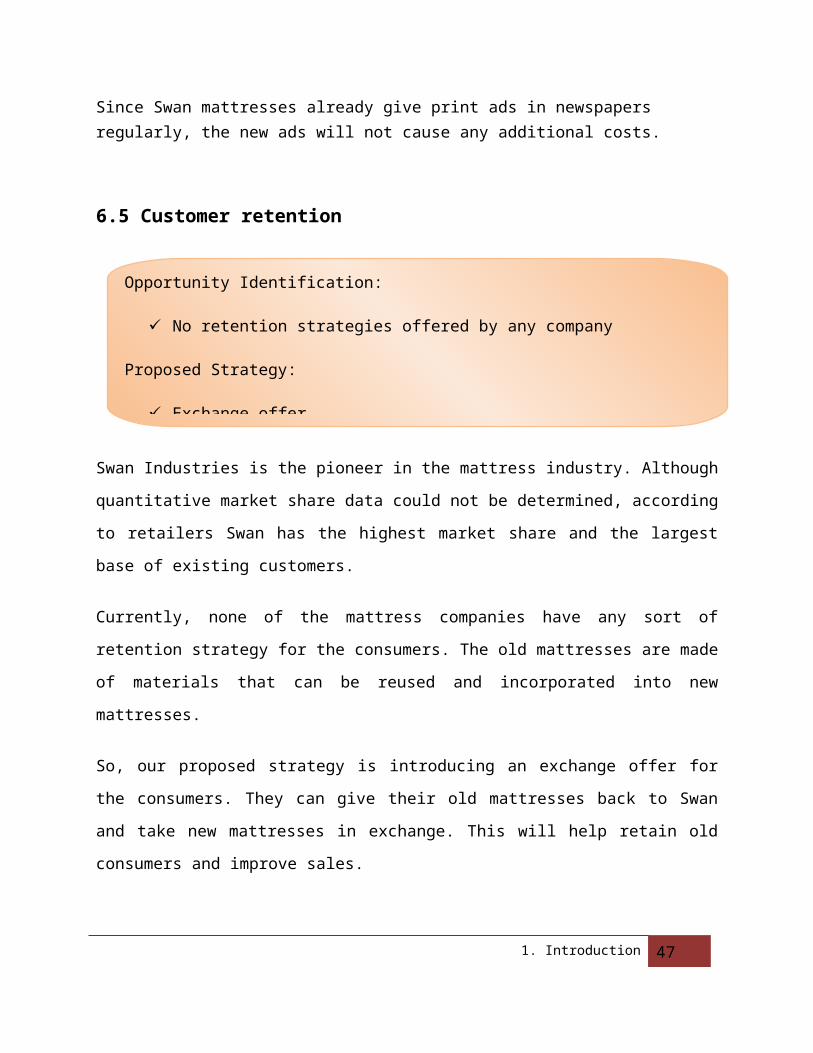
d. What is your incentive plan?
5. Promotion
a. What Promotional activities to do you have? (Sponsorship, trade fair,
advertisement etc)
b. What packaging do you have?
c. Is your sales force effective? What kind of motivation do you offer for them?
d. What customer retention strategies do you have?
6. Branding
a. How do rate your competitor brands?
b. What measures do you take to ensure brand position?
c. What benefits do you get for your brand?
d. What do you provide for your brand?
7. Competitor Analysis
a. Who are your competitors?
b. Do you know about the competitor’s price and cost?
c. What distribution channels do your competitors use?
d. Who are the new entrants that you know of?
e. What promotional activities do your competitors do?
f. Evaluate the competitor’s product quality in comparison to yours.
g. Do you have company’s sales information?
8. Market situation
a. Did you get hit by global recession?
b. Can you describe your customers in terms of knowledge, buying pattern, taste
etc?
c. What are the characteristics of customers you target(Income, demographics)
d. What are the market trends,(How has customer preferences changed).
1. Introduction 62
Appendix C – Sample Swan Print Ads
1. Introduction 63
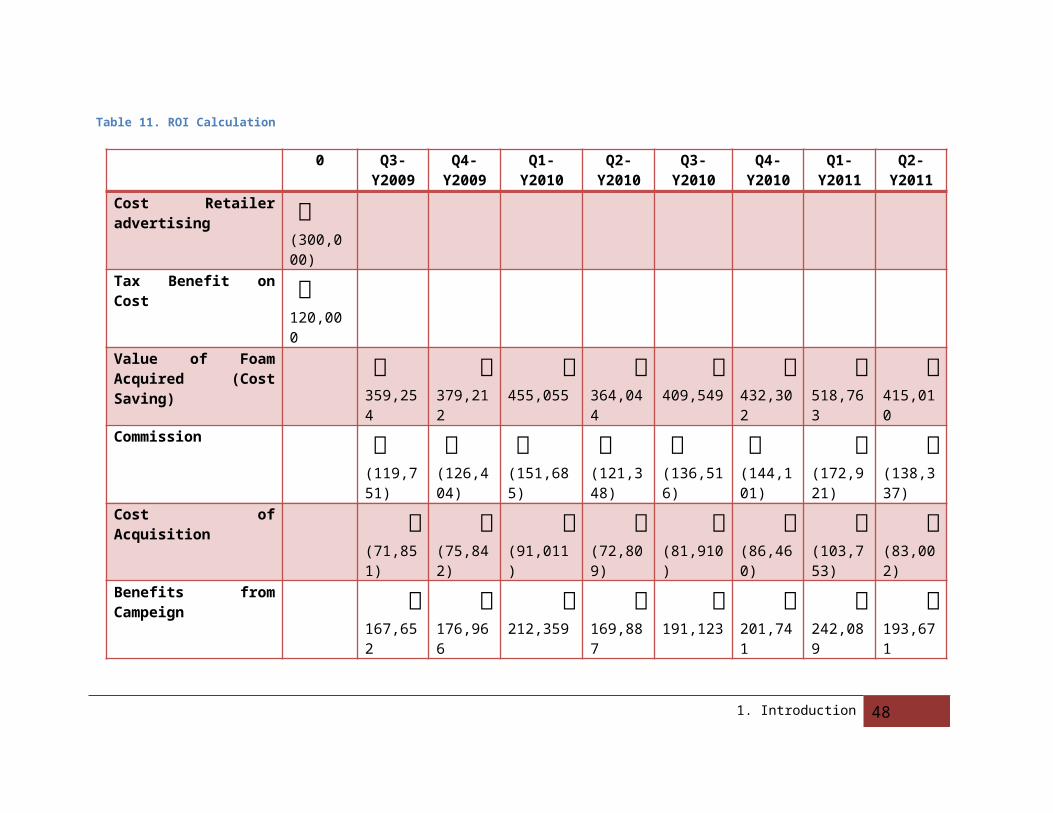
1. Introduction 64
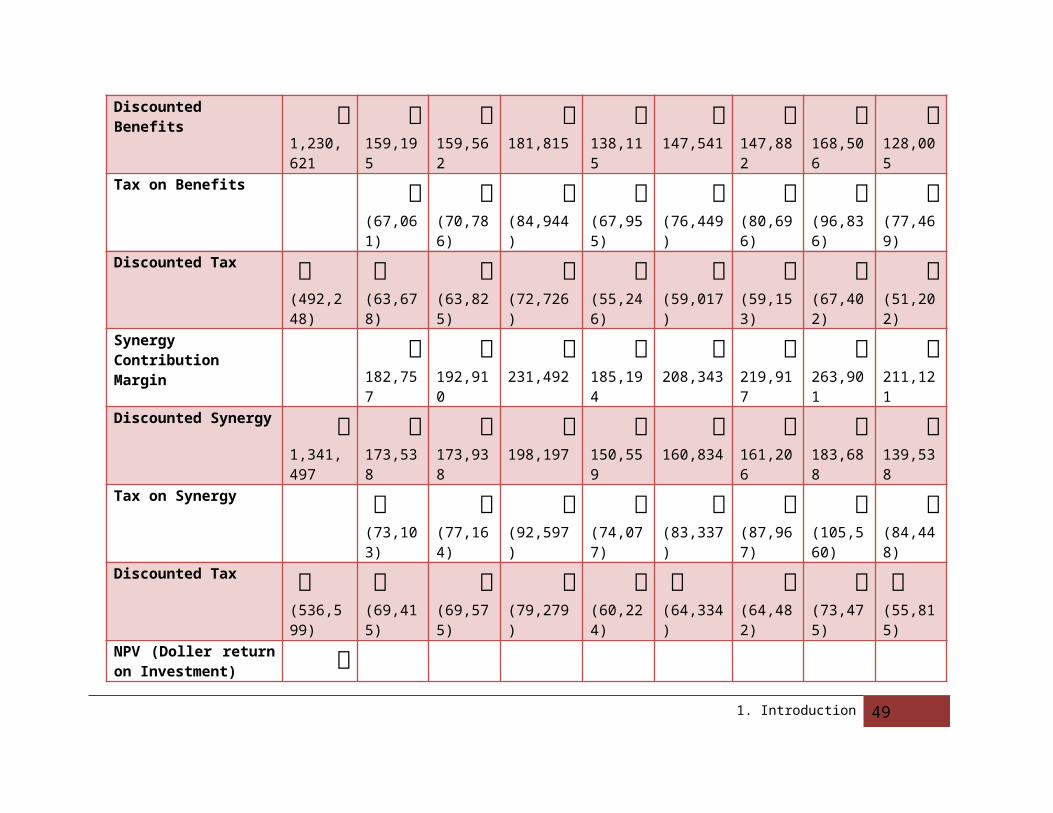
1. Introduction 65
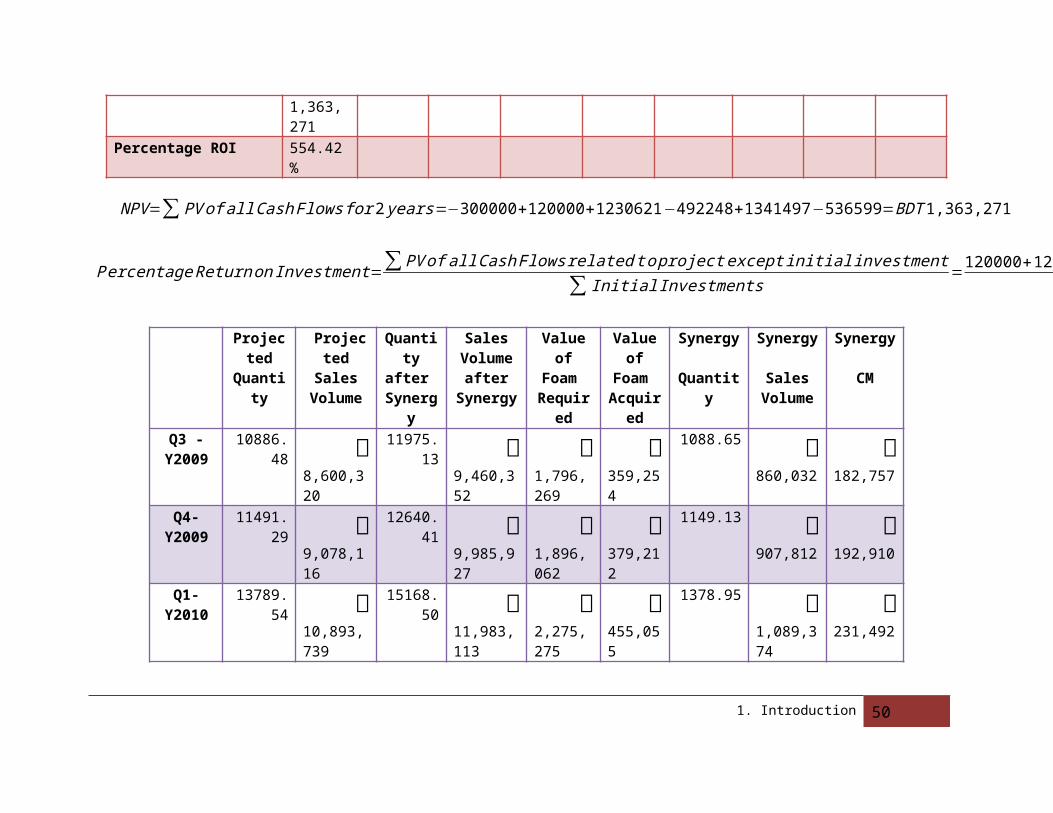
Appendix D – Sales Data Analysis
Total Mattress Sales Histogram
1. Introduction 66
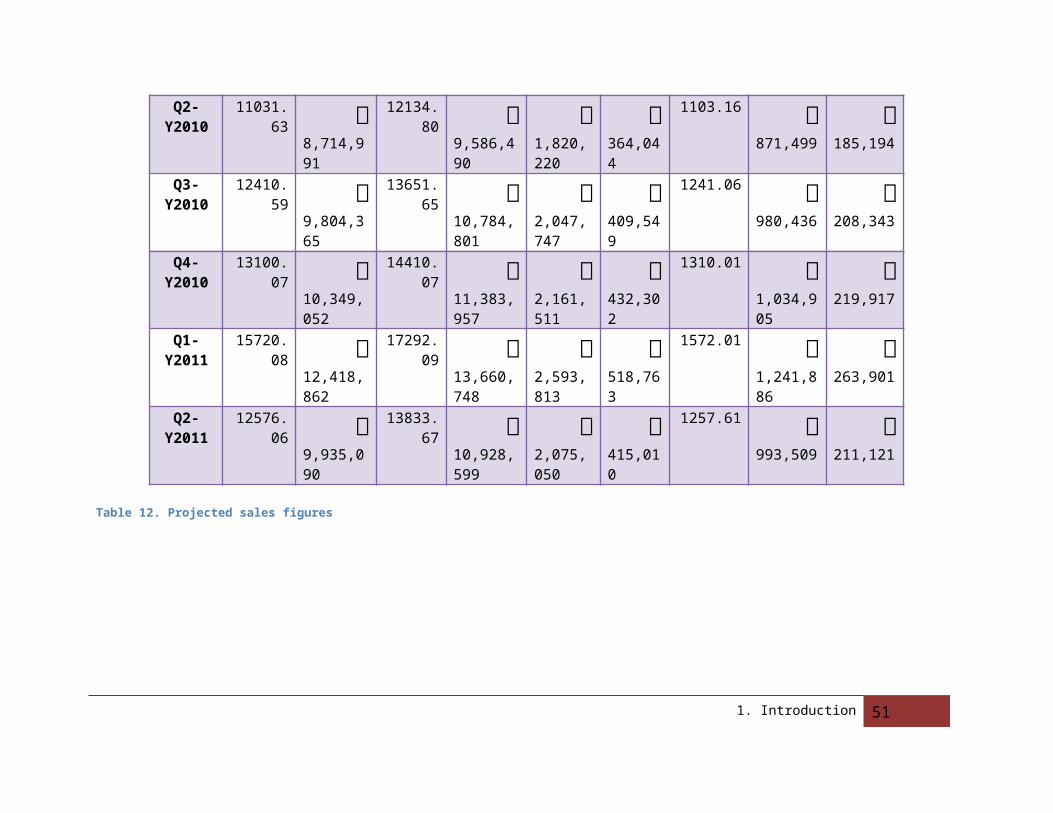
January
"07
Febru
aryMarc
hApril
MayJune
July
August
Septem
ber
October
November
December
January
"08
Febru
aryMarc
hApril
MayJune
July
August
Septem
ber
October
November
December
0
1000000
2000000
3000000
4000000
5000000
6000000
7000000
1. Introduction 67
Total Mattress Sales Data
Sales Of Rebonded Mattress Sales Of T&L Sales Of Spring Mattress Sales Of Coir Mattress Total
Units Rate Value Units Rate Value Units Rate Value Units Rate Value
January"06 0 650 207.7794 825 171418 6630.582 325 2154939 2821.389 650 1833903
February 0 650 286.1879 825 236105 4430.96 325 1440062 2235.377 650 1452995
March 218 650 141378 169.1806 825 139574 6193.662 325 2012940 2831.852 650 1840704
April 940 650 611265 194.1467 825 160171 5122.932 325 1664953 1855.762 650 1206245
May 1176 650 764445 190.7564 825 157374 6608.874 325 2147884 1336.038 650 868425
June 1686 650 1095786 127.2267 825 104962 3775.16 325 1226927 730.8431 650 475048
July 1907 650 1239327 127.7891 825 105426 5394.828 325 1753319 1601.766 650 1041148
August 2328 650 1513460 124.0315 825 102326 4693.068 325 1525247 1529.245 650 994009
September 1630 650 1059749 125.3358 825 103402 4509.551 325 1465604 1094.003 650 711102
October 1548 650 1006073 68.28121 825 56332 3670.892 325 1193040 1044.452 650 678894
November 1581 650 1027329 205.6788 825 169685 6419.105 325 2086209 1293.885 650 841025
December 1772 650 1151916 223.9442 825 184754 4787.951 325 1556084 2053.64 650 1334866
January"07 1217 700 851875 228.0582 825 188148 4125.197 375 1546949 1602.273 700 1121591 3708563
February 1772 700 1240327 232.7879 825 192050 3542.888 375 1328583 1716.854 700 1201798 3962758
March 3049 700 2134145 213.377 825 176036 3213.955 375 1205233 9.647143 700 6753 3522167
April 3126 700 2188435 302.84 825 249843 3332.968 375 1249863 51.40714 700 35985 3724126
May 2892 700 2024567 242.5042 825 200066 3118.84 375 1169565 685.8829 700 480118 3874316
June 1964 700 1374792 183.8788 825 151700 3046.459 375 1142422 1365.09 700 955563 3624477
1. Introduction 67
July 2966 700 2075912 246.5612 825 203413 4156.144 375 1558554 1714.446 700 1200112 5037991
August 2783 700 1947953 286.857 825 236657 4039.416 375 1514781 1392.156 700 974509 4673900
September 2591 700 1813572 300.3552 825 247793 4097.891 375 1536709 1640.75 700 1148525 4746599
October 2972 700 2080713 258.7733 825 213488 3806.237 375 1427339 1105.473 700 773831 4495371
November 3042 700 2129051 294.4279 825 242903 4845.643 375 1817116 962.7629 700 673934 4863004
December 3302 700 2311077 488.657 825 403142 5402.485 375 2025932 1098.914 700 769240 5509391
January"08 3604 790 2846822 343.0551 925 317326 4986.515 390 1944741 1607.023 815 1309724 6418613
February 4025 790 3179680 274.7762 925 254168 3879.181 390 1512881 1727.125 815 1407607 6354336
March 3362 790 2656189 274.5741 925 253981 4590.656 390 1790356 1415.087 815 1153296 5853822
April 2589 790 2045145 299.9168 925 277423 3534.482 390 1378448 2160.558 815 1760855 5461871
May 2465 790 1947703 248.7232 925 230069 3805.815 390 1484268 1350.75 815 1100861 4762901
June 2632 790 2079107 177.5589 925 164242 3684.821 390 1437080 1384.013 815 1127971 4808400
July 3711 790 2932070 417.2314 925 385939 4548.797 390 1774031 1620.844 815 1320988 6413028
August 3317 790 2620278 236.8768 925 219111 4153.133 390 1619722 1474.917 815 1202057 5661168
September 3204 790 2531293 337.9892 925 312640 4522.659 390 1763837 1762.402 815 1436358 6044128
October 2673 790 2111762 194.1254 925 179566 2420.331 390 943929 1253.499 815 1021602 4256859
November 3241 790 2560463 346.5429 925 320552.2 4868.921 390 1898879 1174.585 815 957287 5737181
December 3884 790 3068270 277.947 925 257101 3310.31 390 1291021 929.173 815 757276 5373668
62361929 7568886 56589447 37176205
1. Introduction 68
Re-bonded Mattress Sales Histogram
March
May July
Septem
ber
November
January
"07
March
May July
Septem
ber
November
January
"08
March
May July
Septem
ber
November
January
March
May0.00
500.00
1000.00
1500.00
2000.00
2500.00
3000.00
3500.00
4000.00
4500.00
5000.00
Sales Quantity
Re-bonded Mattress Sales Data
Sales Of Rebonded Mattress Quarter Average (Overall) Units Rate Value January"06 0.00 650 February 0.00 650 March 217.50 650 141378 April 940.41 650 611265 May 1176.07 650 764445 1267.43 June 1685.82 650 1095786 July 1906.66 650 1239327 August 2328.40 650 1513460 1955.15 September 1630.38 650 1059749
Appendix D – Sales Data Analysis 69
October 1547.80 650 1006073 November 1580.51 650 1027329 1633.50 December 1772.18 650 1151916 January"07 1216.96 700 851875 February 1771.90 700 1240327 2012.55 March 3048.78 700 2134145 April 3126.34 700 2188435 May 2892.24 700 2024567 2660.85 June 1963.99 700 1374792 July 2965.59 700 2075912 August 2782.79 700 1947953 2779.73 104.47%September 2590.82 700 1813572 October 2972.45 700 2080713 November 3041.50 700 2129051 3105.16 111.71%December 3301.54 700 2311077 January"08 3603.57 790 2846822 February 4024.91 790 3179680 3663.58 117.98%March 3362.26 790 2656189 April 2588.79 790 2045145 May 2465.45 790 1947703 2562.01 69.93%June 2631.78 790 2079107 July 3711.48 790 2932070 August 3316.81 790 2620278 3410.82 133.13%September 3204.17 790 2531293 October 2673.12 790 2111762 November 3241.09 790 2560463 3266.03 95.76%December 3883.89 790 3068270 January 4330.40 790 3421016 February 3817.52 790 3015841 4032.03 123.45%March 3948.18 790 3119062 April 3199.62 790 2527700 May 3417.22 790 2699604 3300.00 81.84%
Appendix D – Sales Data Analysis 70
Spring Mattress Sales Histogram
January
"06
March
May July
Septem
ber
November
January
"07
March
May July
Septem
ber
November
January
"08
March
May July
Septem
ber
November
January
"09
March
May0.00
1000.00
2000.00
3000.00
4000.00
5000.00
6000.00
7000.00
Spring Mattress Sales Data
Date Actual Quantit
y
Quarterly
Data
Projected Quantity
E=(fo-fe)^2
E/fe
January"06
6630.58 5460.36 Base Period
February 4430.96March 6193.66April 5122.93May 6608.87June 3775.16July 5394.83 4912.57 5648.56 541692.87 95.8992
3August 4693.07September
4509.55
October 3670.89Novembe 6419.10
Appendix D – Sales Data Analysis 71
rDecember
4787.95
January"07
4125.20 3396.72 4629.57 1519918.94
328.3069
February 3542.89March 3213.95April 3332.97May 3118.84June 3046.46July 4156.14 4391.30 3513.79 770024.69 219.143
5August 4039.42September
4097.89
October 3806.24November
4845.64
December
5402.49
January"08
4986.52 4080.25 4138.33 3374.23 0.815359
February 3879.18March 4590.66April 3534.48May 3805.82June 3684.82July 4548.80 3970.69 4280.97 96271.83 22.4883
3August 4153.13September
4522.66
October 2420.33November
4868.92
December
3310.31
January"09
5855.87 4966.88 3741.95 1500447.58
400.9799
February 4601.59March 4336.92April 5491.55May 4548.47
Appendix D – Sales Data Analysis 72

Coir Mattress Sales Histogram
January
"06
March
May July
Septem
ber
November
January
"07
March
May July
Septem
ber
November
January
"08
March
May July
Septem
ber
November
January
"09
March
May0
500
1000
1500
2000
2500
3000
Coir Mattress Sales Data
Date Actual Quantit
y
Quarterly
Data
Projected
Quantity
E=(fo-fe)^2
E/fe
January"06
2821.389
February 2235.377
2629.54 Base Year
Appendix D – Sales Data Analysis 73
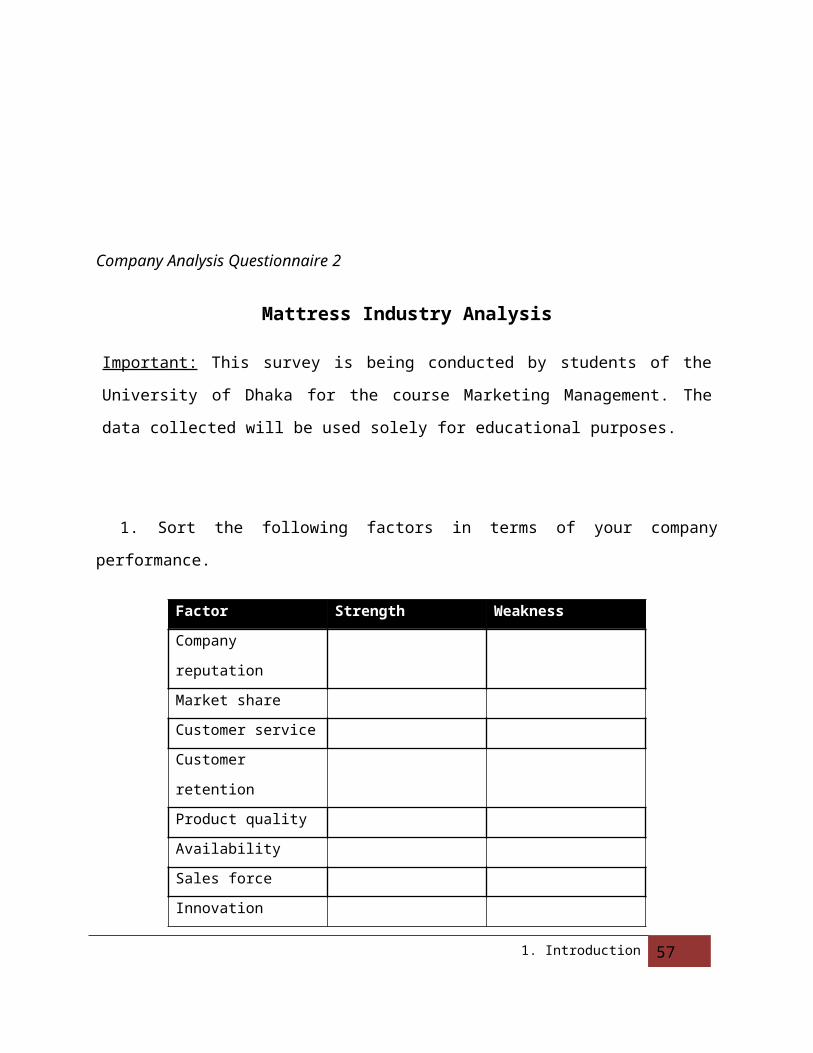
March 2831.852
April 1855.762
250.1208
May 1336.038
1307.55 2018.00 504744.14
June 730.8431
July 1601.766
61.4634
August 1529.245
1408.34 1734.88 106631.83
September
1094.003
October 1044.452
8.024536
November
1293.885
1463.99 1359.54 10909.70
December
2053.64
January"07
1602.273
348.6503
February 1716.854
1659.56 2614.27 911466.26
March 9.647143
April 51.40714
204.9208
May 685.8829
1365.09 2006.28 411129.22
June 1365.09 July 1714.44
6 11.7497
7August 1392.15
61582.45 1724.81 20266.12
September
1640.75
October 1105.473
64.79176
November
962.7629
1055.72 1351.65 87575.69
December
1098.914
January"08
1607.023
48.42013
Appendix D – Sales Data Analysis 74
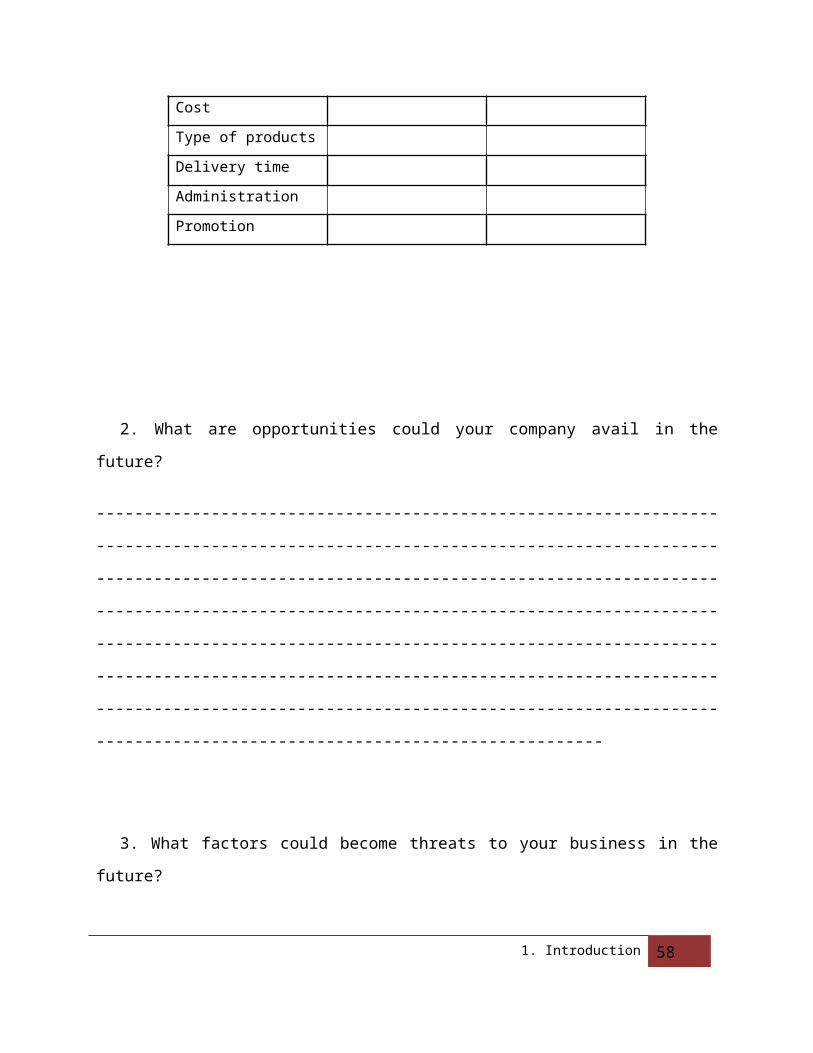
February 1727.125
1583.08 1885.21 91281.99
March 1415.087
April 2160.558
23.65584
May 1350.75 1631.77 1446.77 34224.68June 1384.01
3
July 1620.844
113.4171
August 1474.917
1619.39 1243.80 141067.89
September
1762.402
October 1253.499
21.38741
November
1174.585
1119.09 974.70 20846.37
December
929.173
January"09
1808.27 35.8439
February 2339.54 2266.00 1998.37 71629.26March 2650.20 April 2380.22 362.788
5May 2178.83 2279.53 1533.62 556378.58
PE Mattress Sales Histogram
Appendix D – Sales Data Analysis 75
January
"06
March
May July
Septem
ber
November
January
"07
March
May July
Septem
ber
November
January
"08
March
May July
Septem
ber
November
January
"09
March
May0
100
200
300
400
500
600
PE Mattress Sales Data
Date Actual Quantit
y
Quarterly
Data
Projected
Quantity
E=(fo-fe)^2
E/fe
January"06
207.7794
February 286.1879
221.05 Base Year
March 169.1806
April 194.1467
8.100178
May 190.7564
170.71 212.17 1718.58
June 127.2267
July 127.7891
44.07372
August 124.031 125.72 225.39 9933.61
Appendix D – Sales Data Analysis 76
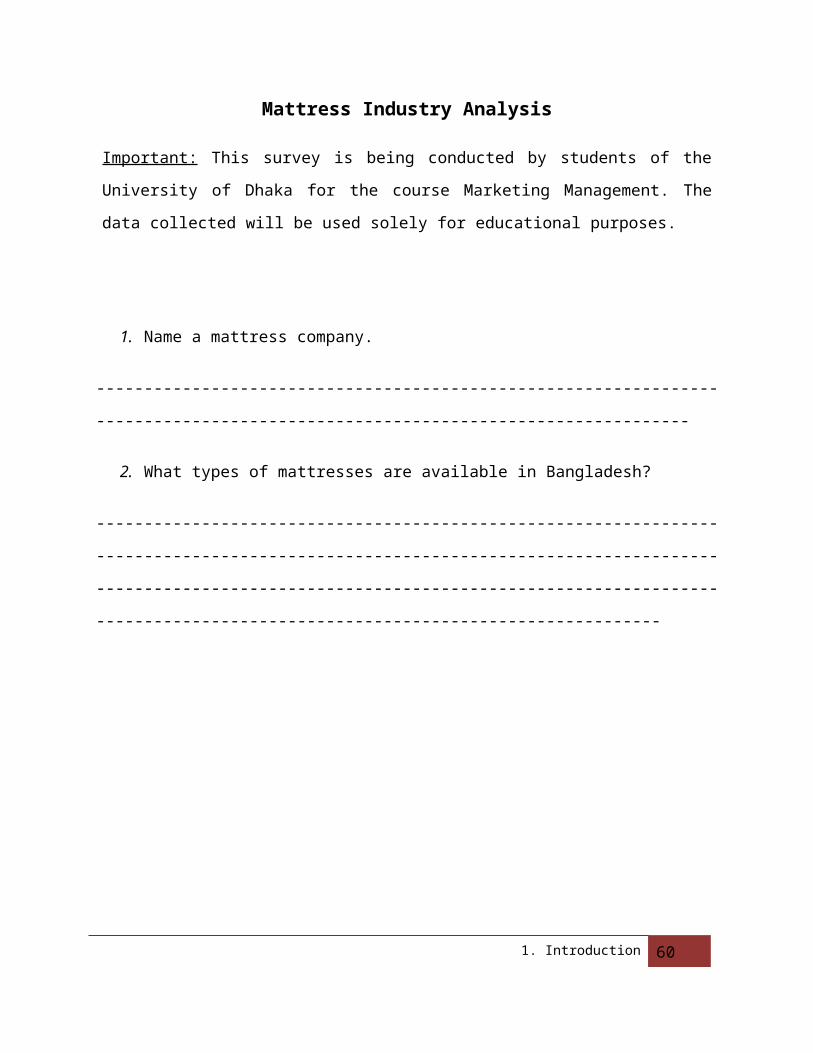
5September
125.3358
October 68.28121
24.7231
November
205.6788
165.97 243.57 6021.76
December 223.9442
January"07
228.0582
44.83676
February 232.7879
224.74 144.30 6470.12
March 213.377 April 302.84 3.47162
9May 242.5042
243.07 215.71 748.86
June 183.8788
July 246.5612
10.3814
August 286.857 277.92 229.15 2378.90September
300.3552
October 258.7733
40.09986
November
294.4279
347.29 247.64 9930.16
December 488.657 January"08
343.0551
0.066637
February 274.7762
297.47 301.95 20.12
March 274.5741
April 299.9168
7.8681
May 248.7232
242.07 289.82 2280.33
June 177.5589
July 417.2314
1.691509
August 236.8768
330.70 307.88 520.78
Appendix D – Sales Data Analysis 77
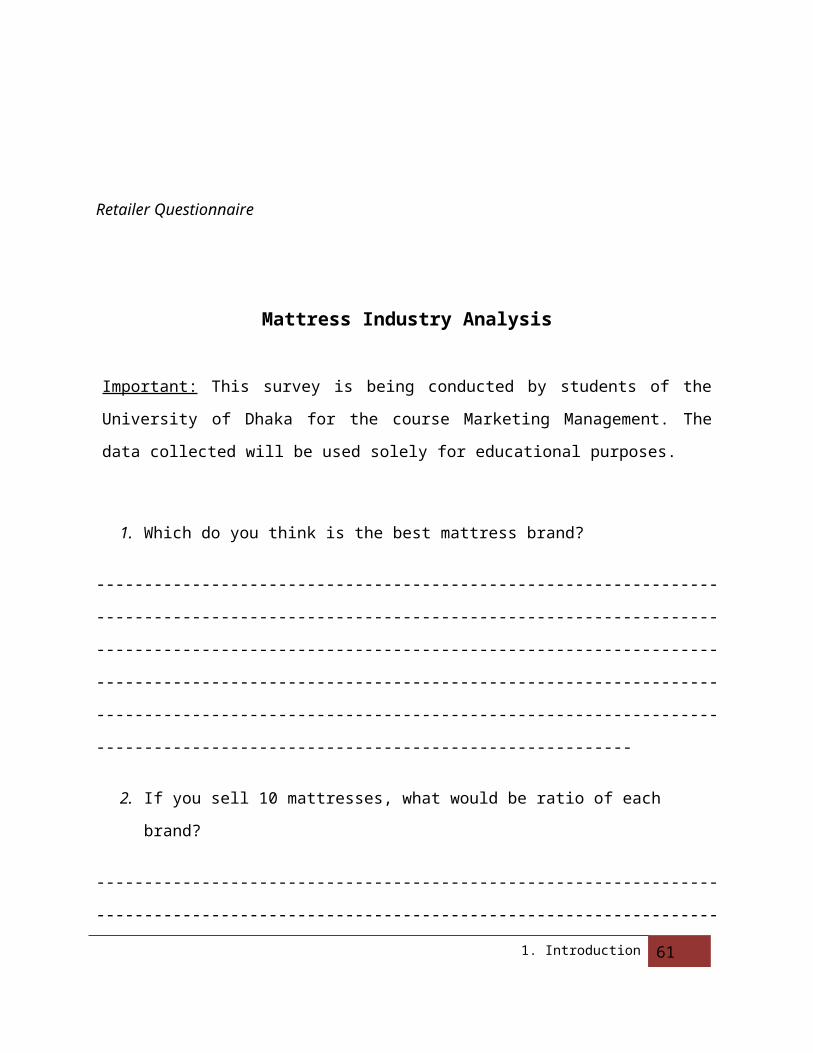
September
337.9892
October 194.1254
10.76356
November
346.5429
272.87 332.71 3581.20
December 277.947 January"09
186.00 37.94877
February 113.51 142.37 237.25 9003.47March 127.59 April 286.08 9.79432
5May 263.81 274.95 227.72 2230.35
Appendix D – Sales Data Analysis 78
Recommended