Telling the Successes of Public Education
July, 2014
Challenges of American Public Education
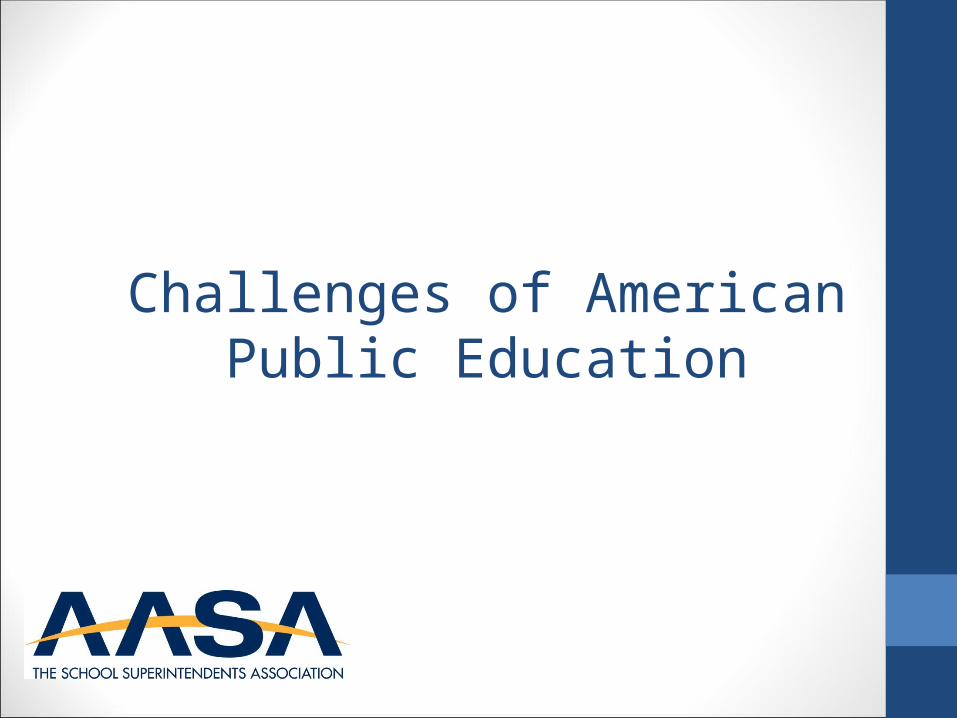
International Comparisons2011 – 4th Grade Scores Reading Math ScienceHong Kong 1 3 9Russia 2 10 5Finland 3 8 3Singapore 4 1 2Northern Ireland 5 6 21United States 6 11 7Denmark 7 13 16Croatia 8 30 23Chinese Taipei 9 4 6Ireland 10 17 22England 11 9 15Netherlands 12 12 14Czech Republic 13 22 8Sweden 14 26 11Italy 15 24 18Source: International Association for the Evaluation of Educational Achievement (IEA), Trends in International Mathematics and Science Study (TIMSS), 2011; Progress in International Reading Literacy Study (PIRLS), 2011.
News reports say the US is falling behind in education compared to other countries•These tests do not take into account the diversity of US public school students•Other countries only test very select students – the US tests students of all race and poverty level
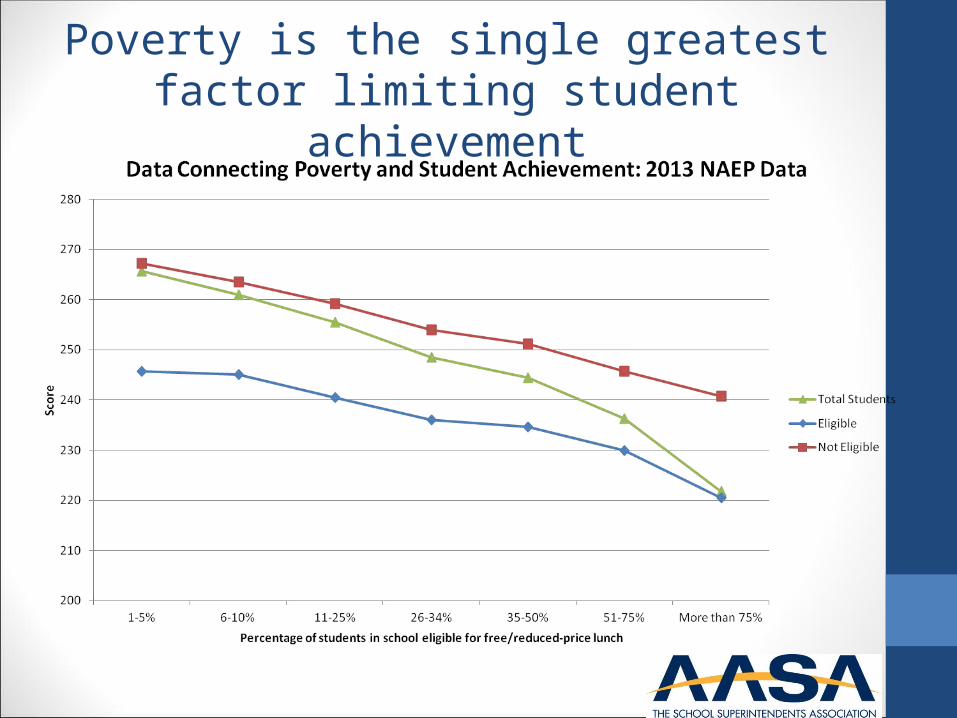
Poverty is the single greatest factor limiting student achievement
Education funding has dropped through the recession, remains
low• 35% of Americans believe the biggest problem with the
public school system is a lack of funding. This number has risen by 10% since 2003. (2013 PDK/Gallup Poll1)• Education budgets have been cut throughout the
country following the recession of 2008.• The sequester cuts hurt the schools that need the money
the most – schools with high rates of poverty had more of their funding cut, because of higher levels of federal investment in the schools. (See AASA’s report, Unequal Pain: Federal Public Education Revenues, Federal Education Cuts & the Impact on Public Schools2)
1http://pdkintl.org/programs-resources/poll/2http://aasa.org/uploadedFiles/Policy_and_Advocacy/files/Unequal-Pain-FINAL.pdf
Poverty is a Reality, Not an Excuse
Despite high poverty rates and inadequate funding, public schools in the US are graduating students ready for their future, at higher rates than ever before.
Successes of American Public Education
U.S. Schools Are NOT Failing All Students
• U.S. 15-year olds in schools with fewer than 10% of kids eligible for free or cut-rate lunch score first in the world in reading, outperforming even the famously excellent Finns • U.S. schools where fewer than 25% are impoverished (by
the same lunch measure) beat all 34 of the relatively affluent countries studied except South Korea and Finland (which have very few poor students)• U.S. schools where 25 to 50% of students were poor still
beat most other countries in reading
Graduation Rates are Rising, while Dropout Rates are at their Lowest• For the first time in US history, the total graduation rate
passed 80% in 2012.• We are on track to have 90% of students graduate by 2020.
• There were 648 fewer “dropout factories” and 1.2 million fewer student attending “dropout factories” in 2012 than 2002.• The dropout rate declined to 7% in 2011 from 12% in 1990.
(NCES 2013)
Source: Building a Grad Nation: 2014 Edition
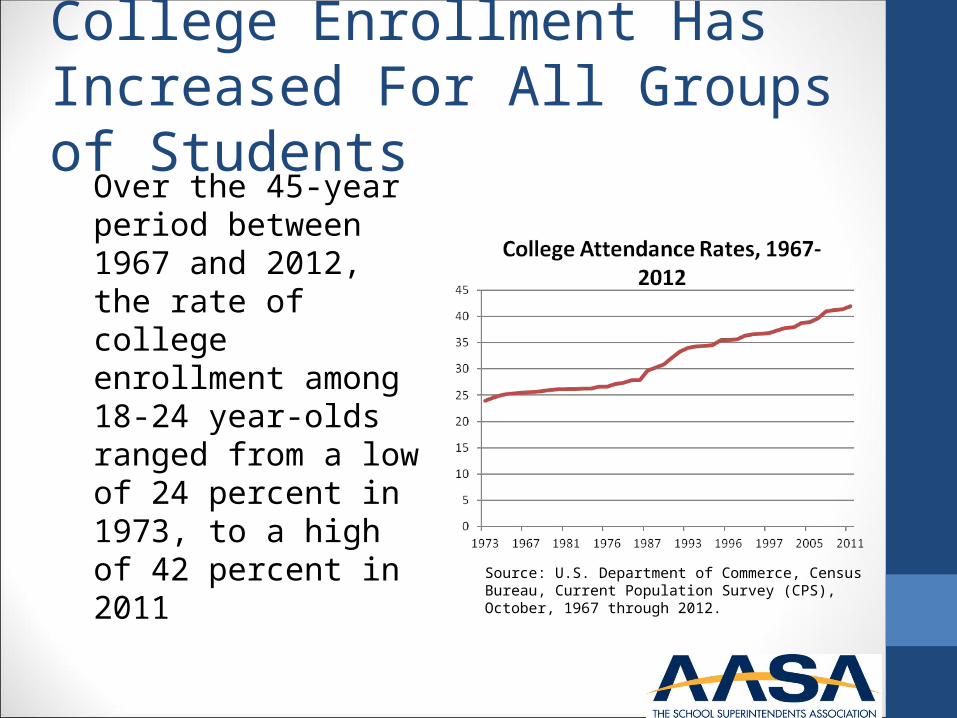
College Enrollment Has Increased For All Groups of Students
Over the 45-year period between 1967 and 2012, the rate of college enrollment among 18-24 year-olds ranged from a low of 24 percent in 1973, to a high of 42 percent in 2011
Source: U.S. Department of Commerce, Census Bureau, Current Population Survey (CPS), October, 1967 through 2012.
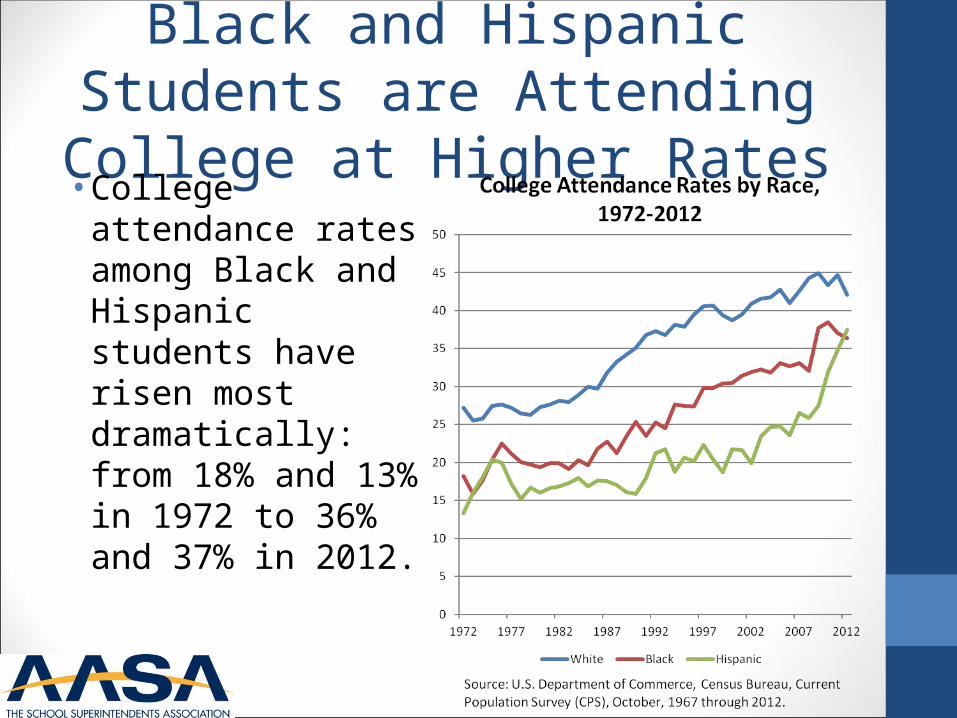
Black and Hispanic Students are Attending College at Higher Rates• College attendance
rates among Black and Hispanic students have risen most dramatically: from 18% and 13% in 1972 to 36% and 37% in 2012.
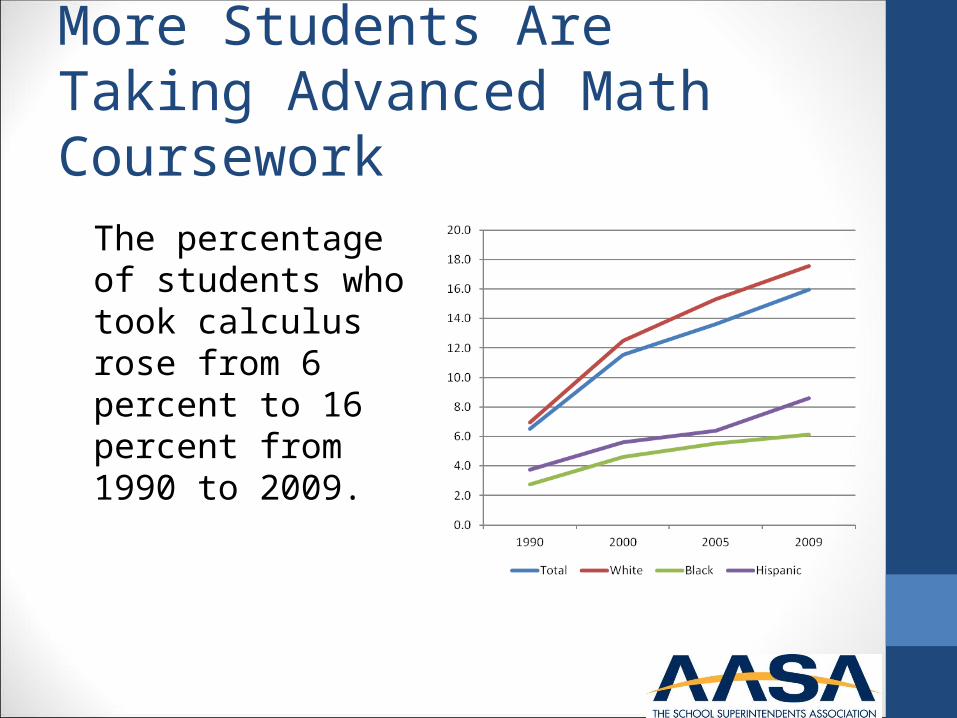
More Students Are Taking Advanced Math Coursework
The percentage of students who took calculus rose from 6 percent to 16 percent from 1990 to 2009.
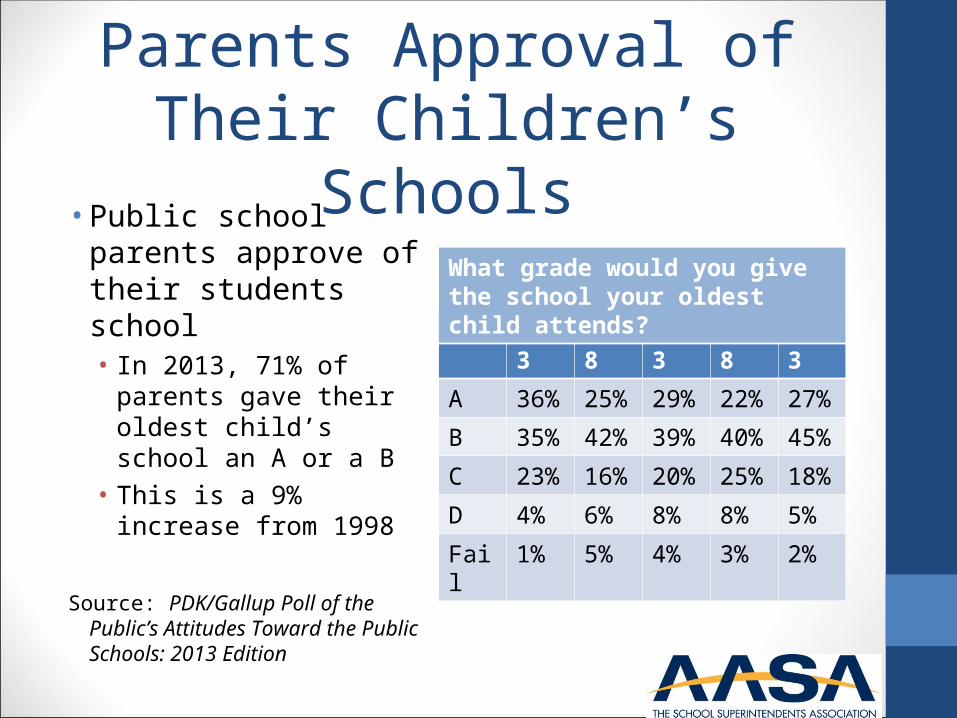
Parents Approval of Their Children’s Schools
• Public school parents approve of their students school• In 2013, 71% of parents
gave their oldest child’s school an A or a B
• This is a 9% increase from 1998
Source: PDK/Gallup Poll of the Public’s Attitudes Toward the Public Schools: 2013 Edition
2013 2008 2003 1998 1993
A 36% 25% 29% 22% 27%
B 35% 42% 39% 40% 45%
C 23% 16% 20% 25% 18%
D 4% 6% 8% 8% 5%
Fail 1% 5% 4% 3% 2%
What grade would you give the school your oldest child attends?
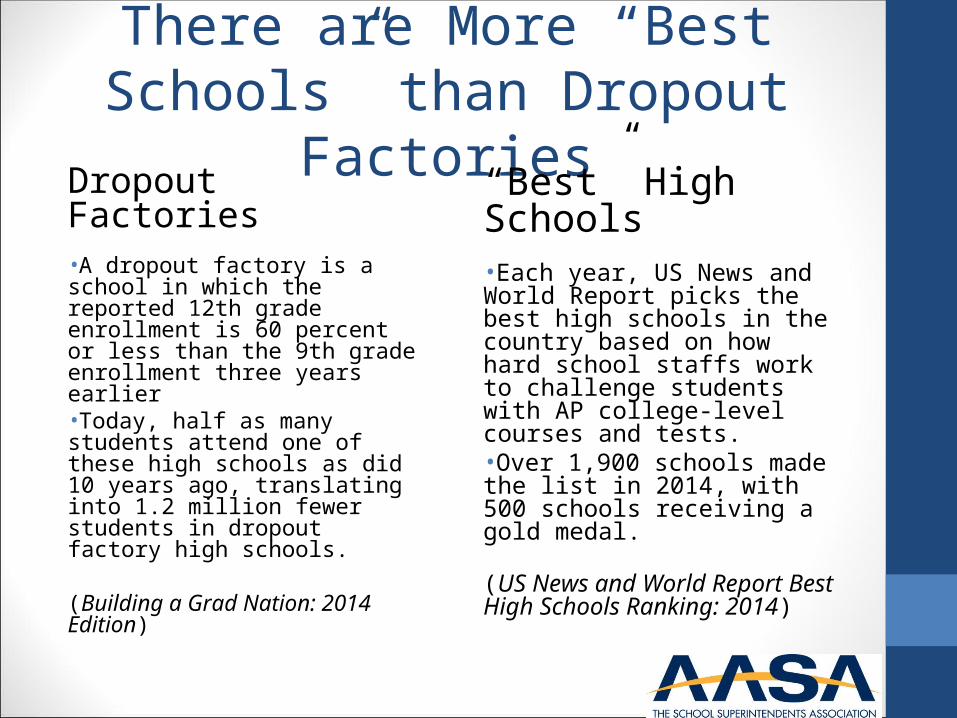
There are More “Best Schools” than Dropout Factories
Dropout Factories•A dropout factory is a school in which the reported 12th grade enrollment is 60 percent or less than the 9th grade enrollment three years earlier•Today, half as many students attend one of these high schools as did 10 years ago, translating into 1.2 million fewer students in dropout factory high schools.
(Building a Grad Nation: 2014 Edition)
“Best” High Schools•Each year, US News and World Report picks the best high schools in the country based on how hard school staffs work to challenge students with AP college-level courses and tests. •Over 1,900 schools made the list in 2014, with 500 schools receiving a gold medal.
(US News and World Report Best High Schools Ranking: 2014)
How You Can Spread the Word• This toolkit includes
sample tweets and letters to the editor to spread the word around your community• Act as an advocate for
your schools in your community: tell people the great work you are doing whenever you can
• Follow Leading Edge, the AASA policy blog (http://aasa.org/aasaBlog.aspx) for information on federal initiatives• Respond to AASA calls
to action, to contact your representatives in Washington on federal issues
Recommended