Upgrading in the Indian garment industry: a study of three clusters
Saon Ray,ξ Prithvijit Mukherjee and Mishita Mehra
(Preliminary draft: do not quote or cite)
Abstract: This paper examines the process of upgrading of the Indian garment industry through
a survey of 100 firms in three clusters in Delhi NCR, Tirupur, and Mumbai, in 2012. Upgrading
could be of three types: Process, Product or Functional. Product upgrading entails producing
higher value added products and involves steps taken to upgrade product quality, introduction of
new fabrics and raw materials, and reduction in reworking rates. Process upgrading occurs
through the incorporation of more sophisticated technologies in production and /or re-
engineering. Process upgrading takes place through use of new production machinery, workers
training, reduction in delivery time, total quality programs, introduction of new organizational
approaches, improvements in the production process and increased usage of computer programs
for business purposes. Functional upgrading involves moving to higher value functions and
occurs through design, marketing and branding. Moreover, most value addition occurs in this
stage of production. Most firms surveyed reported upgrading. Product upgrading is reported to
be the lowest, followed by functional and process. Process upgrading is highest in the category
both (firms which are exporting and also sell domestically), in Mumbai and among the medium
sized firms. Product upgrading is highest in the export category, in Delhi NCR and in the
medium sized firms. Little or no upgrading is reported by domestic firms, mostly in Delhi NCR
and in large firms. Functional upgrading is highest in exporters, in Delhi NCR and the medium
sized firms. The governance structure of the value chain determines functional upgrading.
Discriminant analysis has been used to identify the variables that differentiate between the three
groups, clusters, size and orientation. Reduction in reworking rates, introduction or
improvements in total quality programmes, increased use of computer programmes and internet
for business purposes and new production machinery are the most important predictors of
upgrading among Mumbai, Delhi and Tirupur. New production machinery is most important
predictor of upgrading between firms catering to the Domestic market and Both (i.e. exporting as
well as supplying to the export market).
ξ Corresponding author: email: [email protected]
2
1. Introduction
Garments1 are a labour intensive sector and contribute to a country’s industrialization efforts by
helping diversification from resource based exports. In the past, countries such as Japan reaped
the benefits of industrialization by exporting garments. Today, global exports in garments are
dominated by countries like China, while Bangladesh and Vietnam have also emerged as
important players.
The garment industry provides employment to several thousand people, and is an important
foreign exchange earner for many countries. For India too, the textiles and garment industry is
important since it is the second largest employer2 (agriculture is the largest) and also contributes
significantly to exports. In 2013, global textiles exports were worth US$ 772 billion, of which
India’s share was 5.2 percent. India’s textile and apparel exports amounted to US$ 40.2 billion in
2013, in which the share of textiles was 57 percent, while the share of apparel was about 43
percent. Apparel exports in 2013 from India were US$ 17 billion, registering an impressive
increase of 22 percent over the previous year (WTO, 2013).
The textile and apparel value chain is organised around five main segments (Pickles, 2012): raw
material inputs (which includes cotton, wool, silk for natural fibres, as well as oil and natural gas
for synthetic fibres), textiles (natural fibre based or synthetic fibre based), apparel manufacture,
intermediaries (brand name, overseas buying offices, and trading companies), marketing and
retail. In this paper, we focus on the process of apparel manufacture which has four main stages
of production, that is, design, cutting, sewing, and embellishment.
The literature on the organization of the apparel value chains is extensive (Gereffi and
Memedovic, 2003). It is now examining the mechanism through which firms and industries can
upgrade3 within global value chains to capture greater value added and hence profits. Upgrading
1 In this paper we use garments and apparel interchangeably. 2 45 million direct employment (Technopak, 2012).
3 Upgrading has been defined in the literature as “innovation producing and increase in the value added” (Morrison et al. 2008), insertion into local and global value chains in such a way as to maximize value creation and learning”
(Gereffi et al. 2001), shifts in activities that “increase the skill content of their activities and/or move into market
niches which have entry barriers and are therefore insulated to some extent from these pressures” (Humphrey and
Schmitz, 2002), and, “the capacity of ‘a firm’to innovate to increase the value-added of its products and processes”
(Giuliani et al. 2005).
3
has been classified into four types (Humphrey and Schmitz, 2002)4 : functional, product, process,
and chain. Functional upgrading involves moving to higher value functions and occurs through
design, marketing and branding, while product upgrading entails producing higher value added
products. Product upgrading entails producing higher value added products and involves steps
taken to upgrade product quality, introduce new fabrics and raw materials, and reduce reworking
rates. Process upgrading occurs through the incorporation of more sophisticated technologies in
production and /or re-engineering, while chain upgrading leads to the leveraging of expertise
gained in one industrial sector to enter another sector. Process upgrading takes place through use
of new production machinery, worker training, reduction in delivery time, total quality programs,
introduction of new organizational approaches, improvements in the production process and
increased usage of computer programs for business purposes. Chain upgrading leads to the
leveraging of expertise gained in one industrial sector to enter another sector.
This paper examines the process of upgrading of the Indian garment industry through a survey in
three clusters in Delhi National Capital Region (NCR), Tirupur, and Mumbai. The survey was
conducted on 100 firms in the three clusters in 2012. Most firms surveyed report upgrading.5
Product upgrading is reported to be the lowest, followed by functional and then process
upgrading. Functional upgrading is the highest in exporters, in Delhi NCR and the medium sized
firms. Process upgrading is highest in the category both (firms which are exporting as well as
selling domestically), in Mumbai, and among the medium sized firms. Product upgrading is
highest in the export category, in Delhi NCR and in the medium sized firms. Little or no
upgrading is reported by domestic firms, mostly in Delhi NCR and in large firms.
The paper is organized as follows: the next section discusses the concept of upgrading and
associated literature. Section 3 discusses the Indian apparel industry. Section 4 presents the
methodology used to survey the firms. Section 5 presents the findings of the survey and
discusses results of the discriminant analysis. Section 6 concludes.
2. Literature survey
4 In this paper we focus only on the first three types: product, process and functional. 5 Firms were asked to rate (on a scale of 1-5, where 1 is the lowest investment) their product, process and functional
upgrading.
4
Sixty percent of world trade takes place through coordinated global value chains (GVCs)
(UNCTAD, 2013). GVCs are highly structured networks where the flow of products, knowledge,
and resources are coordinated and serve as outlets for developing country exports.
The concept of upgrading or making better products and making them more efficiently and
moving into more skilled activities has been studied in the context of competitiveness
(Kaplinsky, 2001; Porter, 1990). In the context of value chains, upgrading is defined as
innovating to increase value added (Giuliani et al. 2005).6 Upgrading has been defined by
Humphrey and Schmitz (2002) as occurring through one of the four: product, process, functional
and chain.7
Product upgrading entails producing higher value added products. Process upgrading occurs
through the incorporation of more sophisticated technologies in production and /or re-
engineering. Functional upgrading involves moving to higher value functions, while chain
upgrading leads to the leveraging of expertise gained in one industrial sector to enter another
sector. Product upgrading involves steps taken to upgrade product quality, introduction of new
fabrics and raw materials, and reduction in reworking rates.
Process upgrading occurs by moving into more sophisticated product lines in terms of more unit
value and takes place through use of new production machinery, workers training, reduction in
delivery time, total quality programs, introduction of new organizational approaches,
improvements in the production process and increased usage of computer programs for business
purposes. Functional upgrading is acquiring new and superior functions in the chain such as
design, marketing and branding. Hence, most value addition occurs in this stage of production.
Chain upgrading involves a movement into new activities which may also imply higher skills
and capital requirement, and value added. Upgrading implies going up the value ladder and
moving away from activities that are of lower value and where entry barriers are low (Giuliani et
al. 2005).
6 Innovation does not refer to discoveries of breakthrough, but rather to marginal improvements of the products and
process that are new to the firm. 7 In this paper we examine only product, process and functional upgrading.
5
There is evidence of East Asian garment firms moving from low end activities to high end
activities such as designing and branding as documented by Gereffi in his studies in 1994 and
1999. However, as the literature suggests, upgrading is not automatic and even exporting through
global value chains does not guarantee upgrading. Nor does it provide access to the whole range
of activities needed for developing country firms to compete in the global economy. This brings
in the issue of governance of such value chains and the kinds of governance structure that
facilitate upgrading.
The issue of governance of GVCs has been examined by Gereffi (1999); Gereffi, Humphrey and
Sturgeon, 2005; Humphrey and Schmitz (2000).8 Chains often have governor or lead firms that
largely determine production parameters and wield power over other firms in the chain. Chain
governance is one of the factors likely to influence a firm’s upgrading chances (Bair, 2009;
Schmitz, 2004). Governance of value chains is important for developing countries as it defines
their prospects for learning and earning (Schmitz, 2006). Also, some activities are better
remunerated than others and it is in the interest of developing country firms to learn the skills to
upgrade their positions in the GVCs. The ability to identify activities providing higher returns
along value chains is the key to understanding the global appropriation of the returns to
production (Giuliani et al. 2005).
Giuliani et al. (2005) discuss how differences in learning across sectors foster the role of global
buyers in each of the sectors and may help or hinder upgrading. Based on this argument, they
develop a sectoral classification of upgrading in the context of Latin America. The categories
are: traditional manufacturing, natural resource based sectors, complex product industries and
specialized suppliers. In the case of traditional manufacturing which includes textiles, footwear,
etc., the sector is supplier dominated and major process innovations are introduced by the
8 Gereffi et al. (2005) have developed taxonomy that combines five governance categories based on combinations of
a) complexity of inter-firm transactions, b) the ability of participating firms to codify such transactions, c) the
capabilities of the supply base to fulfil the requirements of these transactions in an independent manner. These
categories are: 1) Market – with low buyer and low producer concentration, buyer not involved in product definition, 2) Captive (quasi hierarchical) – one firm exerts a high degree of control over other firms, high buyer dependency,
high buyer concentration, buyer’s competence in essential chain activities is higher than producers, 3) Modular –
similar to captive except capability in supply base is high, 4) Relational – complex interaction between buyer and
seller, 5) Hierarchy – which involves vertical integration.
6
producers of inputs such as machinery and materials. Firms upgrade their product by developing
or imitating new product designs, often interacting with large buyers who play an important role
in shaping the design of final products and the specificities of the process of production.
Giuliani et al. (2005) examine the endogenous and exogenous factors that influence firm
upgrading and note that the degree of cumulativeness of knowledge, codification and complexity
of the knowledge base influence the capacity and way firms upgrade.
Navas-Aleman (2011) suggests that it is rare for developing country manufacturers to design
their own exports even when operating in GVCs and even rarer for them to own exports brands.
As Keesing and Lall (1992) note, lack of design and marketing skills leaves firms from
developing countries in a vulnerable situation in comparison with global buyers. In this paper,
we highlight this aspect of the chain governance in the context of garment manufacturing in
India. In particular, we examine the product, process and functional upgrading for firms surveyed
in three clusters of India.
3. The Indian garment industry
The textile industry contributes about 14 per cent of the total industrial production in India, 4 per
cent to the GDP and 13 per cent of the total export earnings.9 The textile sector is the most
important sector in terms of employment, after the agriculture sector. It provides employment
directly to about 45 million and indirect employment to 60 million people (Technopak, 2012).
India is among the world’s top fifteen exporters of textiles and clothing.
While the exports of textiles by India increased from $ 8 billion in 1995 to 21 billion in 2009,
exports of clothing (garments), increased from $ 8.6 billion in 2005 to 10.6 billion in 2010.
While India doubled its exports of textiles between 2005 and 2010, in 2013 India’s textile and
apparel exports amounted to US$ 40.2 billion, of which the share of textiles was 57 percent and
the share of apparel was about 43 percent. Apparel exports in 2013 from India were US$ 17
billion in 2013.
9 Textile Committee (2011) National Household Survey 2010: Market for Textile and Clothing, pg 23
7
The textile and clothing industry is a diverse and heterogeneous industry which covers a great
number of activities, from the transformation of raw materials to fibres, yarns, and fabrics. These
in turn, are used to make a number of products including garments. The textile and the clothing
sector covers approximately 1500 tariff lines; while the textile sector comprises HS chapters 50
to 60 and 63 of the combined nomenclature, clothing comprises chapters 61 and 62 of the same
classification. The clothing sector covers made-up products that are articles of apparel and
clothing and accessories. The clothing products in chapter 61 are either knitted or crocheted
while apparel products that are produced from woven textile fabrics fall under chapter 62. Hence
the classification process distinguishes between products based on the underlying manufacturing
process. The maximum value addition to textiles is done by the apparel sector, which is the last
stage of the textile value chain.
The garment industry in India comprises the domestic market as well as exports. In 2008, it was
estimated that while the size of the domestic apparel market was US$ 15 billion, apparel exports
were US$ 9.7 billion (CITI). At current prices, the Indian textiles industry is pegged at US $ 55
billion, 64 percent of which services domestic demand (Ministry of Textiles). During the year
2010-11, garments accounted for 45 percent of total textile exports. Garments and cotton textiles
nearly account for 70 percent of India’s exports of textiles and clothing. Textiles and Apparel
Operations Outlook (2012) places the domestic market at US $ 50 billion while approximately
US $ 25 billion is exported.
The Annual Survey of Industries reports that there were 3760 garment manufacturing units in
2009-10 (going by the definition of Factory under the factories Act, 1948). In 2001-02, the same
figure was 3273 and in 2006-07, it was 3627. The Annual Survey of Industries collects data only
for registered manufacturing. The small and medium sector is surveyed by the Micro, Small and
Medium sector (MSME) survey. The Fourth MSME Census reported 214,557 registered MSMEs
in 2006-07. However, this covers only registered units meaning that unregistered small and
medium units are not counted.
The industrial structure in the garment industry is rather complex: the bulk of the units are small
and medium firms. Most of the production is organized in clusters. The major clusters are
8
located in Delhi NCR, Mumbai, Ludhiana, Kolkata, Tirupur, and Bangalore. A study by AEPC
in 2009 estimated that 95 percent of the production is in the top 19 clusters, whose annual
production is 890 crore pieces. Of this 680 crore pieces fulfill domestic demand and 210 crore
pieces are exported. The total number of garment units in these 19 clusters is 33371. The market
for textile and apparel is pegged at Rs. 3290 billion10
in 2011 in India, out of which the market
for apparel is pegged at Rs. 1540 billion, out of which 65 percent accounts for readymade
garments, and rest consists of unstitched garments.
India’s top readymade garments (RMG) exports in 2010 comprised Cotton T shirts (610910),
Women’s/Girls’ Blouses, Shirts and Shirt Blouses of Cotton (620630) and Men’s / Boys’ Shirts
of cotton (620520). These items were also the top three items in 2005. An assessment of the
number of knitted versus woven garments shows that based on certain assumptions,11
47 percent
of the garments in 2009 were in the knitted category and 53 percent in the woven category.
For the domestic market in 2009, 43 percent of the total production comprised men’s wear
amounting to Rs. 66300 crores, while women’s wear stood at Rs. 57745 crores, and 37 percent of
the total. Boy’s and girl’s wear stood at Rs. 15765 (10% of total) and Rs. 14190 (9% of total)
crores, respectively (Indian Textile and Apparel Compendium, 2010 Technopak).
4. Methodology
The primary study for the study examined the nature of the garments value chain located in
different clusters of the country. The objectives of the primary survey were the following:
(i) To document the firm’s engagement in different types of supply chains (global, regiona l
and domestic) and its perspective on the nature of such chains in the industry.
(ii) To examine different components of the supply chain
(iii) To examine the governance structures of the supply chain.
10
The Apparel Times – Vol. 7, No. 6, Nov- Dec 2011 11
Kolkata and Howrah which have turnovers of Rs. 5000 crores make largely knitted products; while Metiaburz
with a turnover of Rs. 7200 makes woven products. The share of knitted in total turnover is 40%. Mumbai which
has 30 to 35 percent of the total production makes knitted garments.
9
(iv) To understand strategies related to process efficiency, product upgrading and capacity to
augment their functional position in the chain adopted by firms
(v) To examine the impact of incentives and regulatory regimes on the firm’s performance.
Design of the survey
Primary data was collected from firms making garments using a combination of quantitative and
qualitative methods. Firms were selected randomly for participating in the survey, and a
structured questionnaire was used with 100 firms who agreed to participate from three clusters.
The questionnaires were administered to firms through face to face interviews during 2012.12
Information was also collected from other key stakeholders including industry associations. A
key informant survey was used to understand the difference in the behavior of the clusters with
industry associations.
As mentioned earlier, upgrading could be of several types, – a) Process upgrading b) Product
upgrading and c) Functional upgrading. In order to capture the differences, large, medium and
small firms were surveyed. To get a sense of the different value chains in the country, firms with
and without export orientation were surveyed. Questions related to the nature of the value chains
in which firms operate were asked. This allowed us to construct value chains, both, global and
domestic. Other questions were related to the nature of upgradation. Some firms were
interviewed repeatedly to understand the nature of the logistics of their operations. A few firms
reported production linkages with Bangladesh, enabling us to capture the regional value chain.
The questionnaire was designed to capture each aspect of upgrading. Following Navas-Aleman
(2011), firms were asked to rate (on a scale of 1-5, where 1 is the lowest investment) their
product, process and functional upgrading. The thirteen categories that they were asked to rate
were: 1. New production machinery (Process upgrading), 2. Worker training and attainment of
qualifications (Process upgrading), 3. Reduction in delivery time (Process upgrading), 4.
Introduction or improvements in total quality programmes (Process upgrading), 5. Introduction
of new organizational/ management techniques (Process upgrading), 6. Improvements in the
production process (Process upgrading), 7. Increased use of computer programmes and internet
12 40 questions were asked. The first few questions related to the nature of the firm and its operations. Firms were
asked about their product, their markets and their exports. Finally, questions related to upgrading and ways to
remove barriers to upgrading were also asked.
10
for business purposes (Process upgrading), 8. Steps taken to increase product quality (Product
upgrading), 9. Introduction of new materials and fabric to enhance product range (Product
upgrading), 10. Reduction in reworking rates (Product upgrading), 11. Design (Functional
upgrading), 12. Marketing (Functional upgrading), and 13. Branding (Functional upgrading).
The average product, process and functional upgrading index score was used to compare firms
and clusters.
5. Findings
A. Validation of value chains
a. Global value chains
Based on discussions with firms and industry associations, we note the presence of several
chains in the Indian garment industry. Firms cater to global value chains and also to the domestic
market. Firms in the Mumbai cluster sell half their output to the domestic market. We discuss the
domestic value chain below. The global value chain is of two types: the first, supplying to the US
and EU, and, the second, supplying to the Middle East market (or countries in South America).
Most of the medium and large firms cater to global value chains and the products of which are
being sold in the markets of US and EU. There are some differences between the two value
chains: while the products in the US market are low value added garments, which are sold in
bulk, the products sold in the EU market are higher value added while the quantities are lower.
The design, specification of inputs, standards of compliance and the supply chain are largely
determined by the buyer. The GVC catering to the Middle East markets is different from the
value chain in the US and the EU markets. Firms in Delhi NCR sell mostly to US/EU. Firms in
Tirupur sell to the Middle East as well as to the US/EU. The design, specification of inputs and
the supply chain is collaborative in case of US/EU. There is less importance attached to
compliance and producers upply products under their own brand names. Other, newer markets
that were being explored by the firms include Japan, South Korea, Singapore, Latin America,
South America and East Africa. Some firms have production linkages with the South Asian
countries, particularly Bangladesh, which we discuss below.
The coexistence of several value chains has also been found by Giuliani et al. (2005) in the case
of Latin America. They suggest that different value chains coexist in the same cluster, with firms
11
participating in domestics as well as global value chains, especially in traditional manufacturing.
Evidence of different chains dominated by US and EU buyers are also prevalent in the Sinos
Valley footwear cluster, where US and EU buyers dominate the GVC but there are minor chains
oriented towards Brazilian and Latin American markets (Bazan and Navas-Aleman, 2004).
These different chains also have different governance structures: in the quasi-hierarchical chain,
US buyers imposed their conditions concerning product design, marketing and branding on
Brazilian producers (Giuliani et al. 2005). There is evidence also from two Mexican footwear
clusters in Guadalajara and Leon, where firms participate in the domestic value chain (apart from
the GVC dominated by the US and EU, where the design and product development is controlled
by the US buyer), and in network chains (Giuliani et al. 2004). In the latter, there is cooperation
among firms, where competencies are shared among firms with more or less equal power.
b. Difference in governance structures in global value chains
Raw materials:
In supplying to the EU/US, as regards source of raw materials, either of the following could
prevail: a) The source and specification of the raw material are specified by the buyer – this is
done usually when the firm is dealing with a buyer for the first time or the buyer has
commissioned a mill for all the raw material required for production. In this case the producer
has very low bargaining power.
b) The specification is provided for the raw material by the buyer and the producer
negotiates the price with the mills.
c) The source and specification of accessories is always specified by the buyer. Usually they
are imported from Hong Kong.
Raw materials are procured directly by producers and products sold under their own brand name
in the Middle East market.
Design:
There are three models followed in supplying products to the EU/US:
a) the design, source and specification of raw material given by the buyer
12
b) The design is given by the buyer and the producer and buyer collaborates on the decision
regarding the type of material which would suit the design the best. The producer then
procures the raw materials.
c) The design is done by producer in collaboration with the buyer.
In the Middle East market, the seller sells under his own brand name and hence has greater
control over the value chain.
Product:
a) US market – basic garments and large volume
b) EU market – high value added with smaller volume and high on fashion
c) Middle East – producers have spaces reserved in supermarkets and supplies vary with
demand13
Production standards:
a) USA and EU market – there are various standards which the factory has to meet and there
is a huge restriction on outsourcing of the production process. However, in the peak
season, when production capacity is exhausted, outsourcing is allowed. Samples are
approved by the buyer at every point of the production process (though this comes down
with time as the firms have been dealing with each other) which considerably increases
the time required for production. For example, after dyeing, tests are done on the fabric to
check if they are azo-dye free, etc. Maintaining standards for production substantially
increases costs.
b) Middle East – There are no such standards in these markets.
c. Domestic value chains
The domestic value chain is organized in a different manner from the global value chain. The
domestic value chain has two segments; the first caters to the lower and middle income market in
the country. The producers have a ready stock of different styles which are sold directly to
wholesalers and multi brand outlets. In case of retail brands, the design is collaborative or
13 Products sold in the Middle East included children’s wear and garments for men and women.
13
provided by the buyer. The buyer monitors the quality and delivery schedule of the garments.
This segment is similar to that of the GVCs. Firms largely own brands in the domestic value
chain – which are sold through own showrooms, multi brand outlets and retail brands. One of the
most important differences in the domestic segment is that the credit cycle is different from that
of the export market.14
Apart from this, regulations regarding quality, etc., are more lax.
The infrastructure used to produce garments is common to the domestic and export markets. The
export market’s volumes are larger than those of the domestic market. The number of production
cycles for the export market can go up to 4 in a year, while in the domestic market there are 2.
The first is the festive season which extends from August to mid-January and which includes all
the major festivals, and the second is the summer season between March and May. The
transactions in the export market are done through defined contracts of design, payment, etc.,
while payments in the domestic market are a bit flexible.
d. Emergence of regional value chains
Some firms have reported that they have production linkages with Bangladesh.15
There are two
models of production in the regional value chain: own factory and sub contracting. There are also
two models for distributing the final output: directly exporting goods to EU (taking benefits
under GSP), and importing to India for sale in the Indian domestic market. Some of the
advantages cited in the case of the regional value chain are:
• Lower labour costs
• Lower costs for sourcing inputs
• Lower energy costs
• Ease of availability of labour
• Lax labour laws vis-à-vis India
Goods that are produced in Bangladesh and then imported to India, are 5 to 7 percent cheaper
than goods produced in India.
B. Upgrading
14 Some firms reported that recovery of dues from the domestic market is difficult while in the case of the exporting,
payment is prompt if all the paperwork is in order. 15 Products sold to Bangladesh included sherwani, jodhpuri, etc., as well as ladies T shirts.
14
The upgrading survey was conducted in Delhi NCR, Mumbai and Tirupur. One firm in Surat was
also interviewed. Each firm surveyed was asked questions relating to the form of upgrading and
were asked to score their response on a scale of 1-5, with 1 being the lowest score corresponding
to little or no upgrading. While 100 firms were interviewed for this purpose, the response of 97
is reported (some firms had to be removed from the sample because of missing observations on
location of the firms and other major variables). Firms were also asked about the problems they
faced in upgrading. Appendix A shows the scores recorded by the firms for each category of
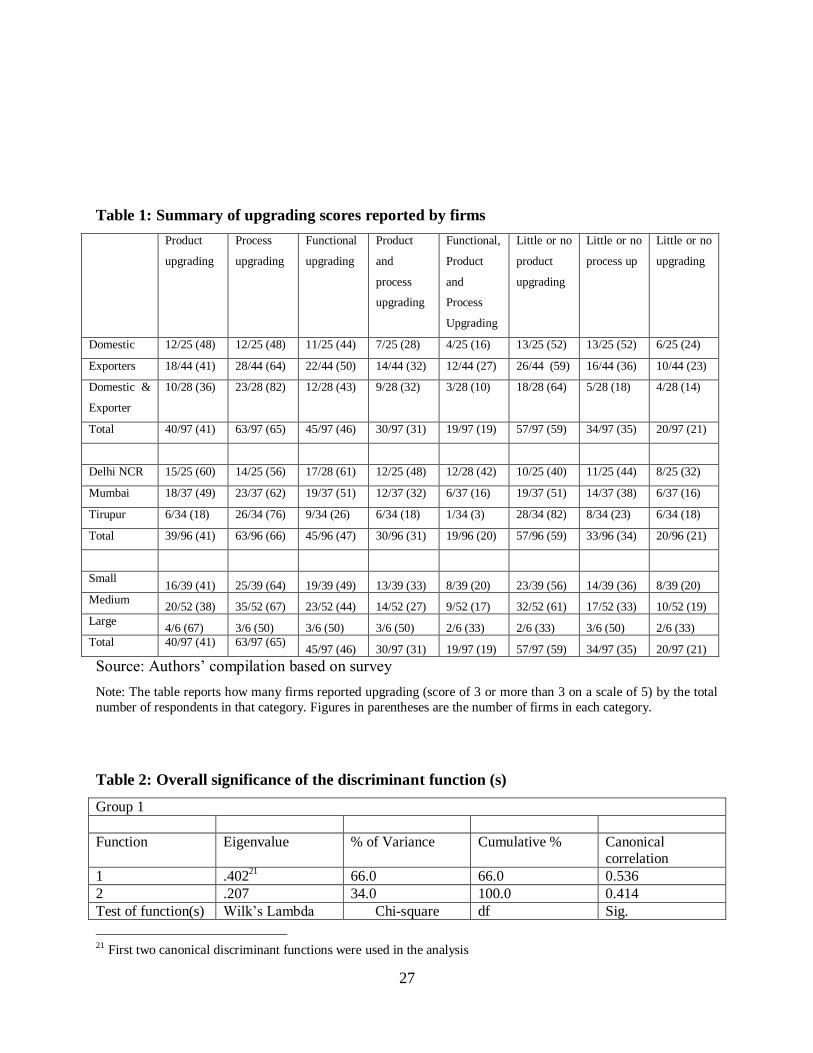
upgrading. The table below provides a summary of the responses recorded by the firms. It shows
the count of firms reporting upgrading in one form or other: a score of more than 3 counted as
upgrading and a score less than 3 suggested little or no upgrading.
[Table 1 about here]
Several points emerge from the table: most firms report upgrading. Product upgrading is reported
to be the lowest, followed by functional and process. Functional upgrading is highest in
exporters, in Delhi NCR and the largest firms. Process upgrading is highest in the category
exporting as well as selling domestically, in Tirupur, and among the medium sized firms.
Product upgrading is highest within the domestic category, in Delhi NCR and in the large firms.
Little or no upgrading is reported mostly by domestic firms, in Delhi NCR and in large firms.
This should not be interpreted as domestic firms in Delhi NCR not upgrading since all the firms
in our Delhi NCR sample were exporters. Rather, each of these categories should be seen as
independent of the other. While the highest score of 5 was reported by a small Mumbai firm
supplying to the domestic market, the lowest score was reported by a small exporter from
Tirupur. The market to which the firm supplies are important, too, since low upgrading is
reported in case firms of quasi-hierarchical structures (Humphrey and Schmitz, 2000). It is more
fruitful to examine each category of upgrading, and that is described below.
a. Process upgrading
Process upgrading takes place through use of new production machinery, worker training,
reduction in delivery time, total quality programs, introduction of new organizational
approaches, improvements in the production process and increased usage of computer programs
for business purposes. The lowest score was recorded for increased usage of computer programs
15
for business purposes, while the highest score was recorded for reduction in delivery time (see
table in appendix). Seventeen firms reported that they did not use computer programs for
business purposes, while all firms, except one, in the sample, reported reduction in delivery time.
All except five firms reported introduction of new production machinery, and all except six
reported worker training. Total quality programs were introduced by all firms except eight firms,
while all except five reported improvements in production process, and all, except seven, had
introduced new management techniques.
b. Product upgrading
Product upgrading involves steps taken to upgrade product quality, introduction of new fabrics
and raw materials, and reduction in reworking rates. While introduction to new fabrics and raw
materials scored the lowest, the highest rate was recorded by steps taken to improve the product
quality by all the firms in our sample. Twenty two firms reported that they had not introduced
any new fabrics while nine firms reported that they had not seen any reduction in reworking
rates, and only three reported that they had not taken any steps to improve the product quality.
India faces a particular problem with respect to material since its strength lies in cotton textiles.
India’s strength is in polyester16
among the man-made fibres, while other manmade fibres are
used the world over.17
c. Functional upgrading
Of all the forms of upgrading, the most difficult is functional upgrading. Functional upgrading
involves upgrading through design, marketing and branding. However, most value addition
occurs in this stage of production. Investing in functional upgrading can create valuable
development options especially for firms that depend on finding new buyers for survival
(Giuliani et al., 2005).
Our survey revealed that almost all the firms are involved in functional upgrading. The lowest
score, as expected, was recorded by branding while the highest score was recorded by design. In
16 Ministry of Textiles, Government of India report
(http://texmin.nic.in/policy/Fibre_Policy_Sub_%20Groups_Report_dir_mg_d_20100608_2.pdf)
17 Currently the global mix is 41% natural while 59% is manmade. In India, 70% of the mix is cotton based
garments.
16
the sample, thirteen firms reported that they are not doing any branding. Eleven firms reported
that they are not involved in marketing, and five of the firms reported that they are not involved
in design. Most of the firms not doing any branding also reported that they were not involved in
any marketing and many of them were not involved in designing as well. As has been discussed
earlier, in the context of global value chains, certain buyers specify the design and the firm
supplies according to the specifications. Contrary to expectation, the small and medium firms are
engaged in design and branding. This has to be seen in the context of the value chain to which
they are catering: branding and design is least in firms selling to the global value chain through
direct contact. Most firms in the Delhi NCR (which are also exporting) reported that buyers
specified the design.
The discussion on the organization of the domestic value chain and the global value chain
(catering to the EU/ US and Middle East) needs to be highlighted here. As Humphrey and
Schmitz (2000) point out, insertion in a quasi-hierarchical chain offers favourable conditions for
product and process upgrading but hinders functional upgrading. Our survey suggests that
designs are specified by the buyers mostly in the case of firms supplying to the EU or US (and
hence functional upgrading is limited in these cases). While functional upgrading could be
prevented by buyers in quasi-hierarchical chains, it can occur more easily in market based value
chains (Giuliani et al. 2004). In the Sinos Valley case, functional upgrading in design, branding
and marketing have been achieved by firms selling to buyers in the domestic and regional
markets of Latin America (Bazan and Navas-Aleman, 2004). Functional upgrading has also been
reported by the Mexican footwear producers selling in the domestic market (Rabellotti, 2009). In
the Brazilian textile cluster of Valle de Itaji, functional upgrading has been experienced (Giuliani
et al., 2005).
Hence the governance of the value chain has implications for functional upgrading and as
suggested by Navas-Aleman (2011), firms functionally upgrade first in domestic value chains
and then apply this knowledge when they start to export. The importance of domestic value
chains also needs to be recognized in this context.
C. Discussion on differences and similarities between firms in upgrading
17
a. Small firms vs. medium sized firms in upgrading
There are 52 medium sized firms, 39 small and 6 large in the sample. The small firms surveyed
are firms catering to the domestic market as well as exporting. In addition to supplying to EU
and US, small firms cater to the Gulf countries and South America. The small firms in our
sample are more actively engaged in process upgrading than product and functional upgrading.
Within functional upgrading, these firms reported a higher score for design compared to
marketing and branding. The majority of the small firms surveyed were located in Mumbai. The
average scores for the small firms is higher than the averages score for the large firms but lower
than the average scores for medium sized firms. Interestingly, in comparison to large firms (table
in appendix), small firms score lower than large firms in the introduction of new
organizational/management techniques, reduction in reworking rates, and marketing, while
recording a higher score than the large firms in all other categories of upgrading. The medium
sized firms scores lower than the large firms only in introduction of new
organizational/management techniques while scoring less than small firms in reduction in
delivery times, introduction /improvement in total quality programs and steps to improve product
quality. Over half of the medium size firms were exporting while they were mostly located in
Tirupur, in our sample.
b. Differences within the clusters in upgrading
There are 35 firms in the sample from Tirupur, 35 from Mumbai, one from Surat and the rest
from the Delhi NCR region. The highest average score was recorded by Mumbai, followed by
Delhi and Tirupur. The highest score recorded by the Mumbai cluster was in improvements in
the production process, while the lowest score was in marketing and branding. The highest score
recorded by the Delhi cluster was in reduction in delivery time, which given that all the firms in
the Delhi cluster were exporters, is not surprising. The lowest score was in steps taken to
increase product quality. In Tirupur, the highest score was in increased use of computer for
business purposes, as has been mentioned earlier, while the lowest score was in reduction in
reworking rates and branding.
c. Policy implications from the above discussion
18
Firms were also asked about the problems they faced in upgrading. A majority of firms reported
lack of skilled labour, access to technology and finance as the major obstacles in upgrading.
Some firms observed that the duty drawback system needed to be more streamlined so that
delays in receiving payments could be reduced. Logistics and inadequate infrastructure were
cited as major a reason for delays in exporting.
D. Discriminant analysis
Discriminant analysis is used to predict membership in two or more mutually exclusive groups
from a set of predictors, when there is no natural ordering for the groups. We use discriminant
analysis to to identify patterns in the perceptions of firms of upgrading they undertake.
Discriminate analysis has been used extensively in the finance literature to predict bankruptcy
(Altman, 1968). Aziz and Dar (2006) review alternative methodologies such as multiple
discriminant analysis and logit models and conclude that the predictive power of these models is
comparable.
a. Methodology
In our survey, each firm was asked to rank on a scale of 1 to 5, if they undertook any upgrading.
Questions pertaining to three types of upgrading were asked: product, process and functional
upgrading. The firms belong to three clusters, Mumbai, Tirupur and Delhi NCR, and can be
divided into small, medium and large, and, by whether they exported or served the domestic
market.
The dependent variable is upgrading with three categories: Group 1: cluster (Mumbai, Delhi
NCR, or Tirupur). Group 2 relates to firm size (small, medium and large) and Group 3 relates to
the orientation of firms determined by whether they are exporting, supplying domestically or
doing both.
The independent variables are the thirteen perception variables:
PR 1: New production machinery
PR2: Worker training and attainment of qualifications
PR3: Reduction in delivery time
PR4: Introduction or improvements in total quality programmes
19
PR5: Introduction of new organizational/ management techniques
PR 6: Improvements in the production process
PR 7: Increased use of computer programmes and internet for business purposes
PC 1: Steps taken to increase product quality
PC2. Introduction of new materials and fabric to enhance product range
PC 3: Reduction in reworking rates
FUN 1: Design
FUN 2: Marketing
FUN 3: Branding
The purpose of this analysis is to identify the variable that do the best job of differentiating
between the three groups, and hence the stepwise method of selecting variables is most
appropriate.
b. Assumptions
The sample size: each of the dependent variable groups should have at least 20 cases each. In this
case, information is available for 97 firms, with all firms reporting some upgrading. The
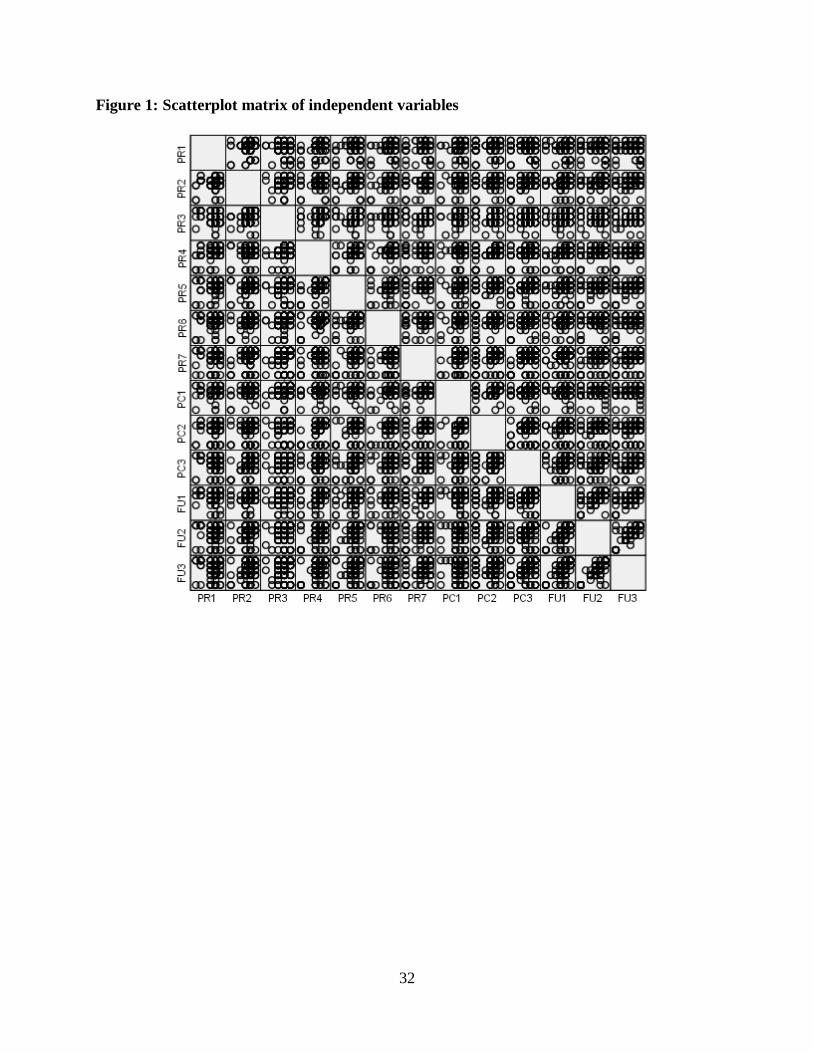
independent variables should be distributed normally and there should not be a linear
relationship among variables. In order to check the latter we have examined the scatterplot
matrix for the variables. This is shown in Figure 1. The variables show a non linear pattern,
ruling out interdependencies between the variables.
[Figure 1 about here]
Similar to multiple regression analysis, our first task is to determine whether or not there is a
statistically significant relation between independent variables and the dependent variable. Table
2 shows the eigenvalues and Wilk’s Lambda for Group 1 (clusters: Mumbai, Delhi or Tirupur).
The maximum number of discriminant functions is equal to the number of groups in the
dependent variable minus one, or the number of variables in the analysis, whichever is smaller.
For Group 2 (size of the firm: small, medium or large), no variable qualified for Wilk’s Lamba.
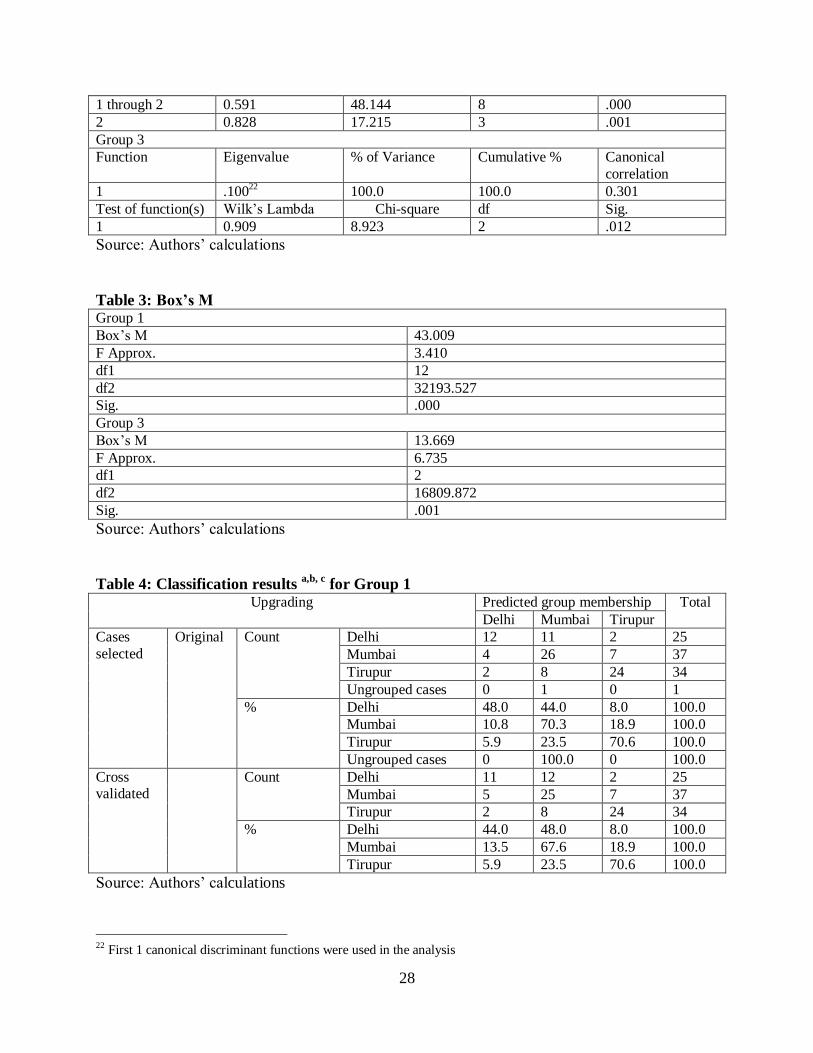
For Group 3, the table 2 shows that there is one discriminant function.
20
[Table 2 about here]
In discriminant analysis, the best measure of overall fit is classification accuracy. The
appropriateness of using the pooled covariance matrix in computing classifications is evaluated
by the Box’s M statistic. The Box’s M statistic helps determines whether or not the assumption
of equal dispersion of covariance matrices holds. The null hypothesis is equal population
covariance matrices and we reject the null hypothesis for Group 1 and 3. Table 3 reports the
Box’s M statistics for Group 1 and Group 3. The chi-square statistic for this test is less than
0.0001, and from the table we note that since the significance is larger, the null hypothesis is
rejected. Hence we note that there are two statistically significant discriminant functions to
separate Group 1 and one discriminant function to separate Group 3.
[Table 3 about here]
c. Results for classification of the groups
We next present the results of the accuracy rate for the holdout sample to each of the by chance
accuracy rates in Table 4 for Group 1, and in Table 5 for Group 2. From Table 4 we note that, for
group 1, 65 percent of the original grouped cases are correctly classified. From table5 we note
that for group 2, 45 percent of the grouped cases are correctly classified.
[Table 4 about here]
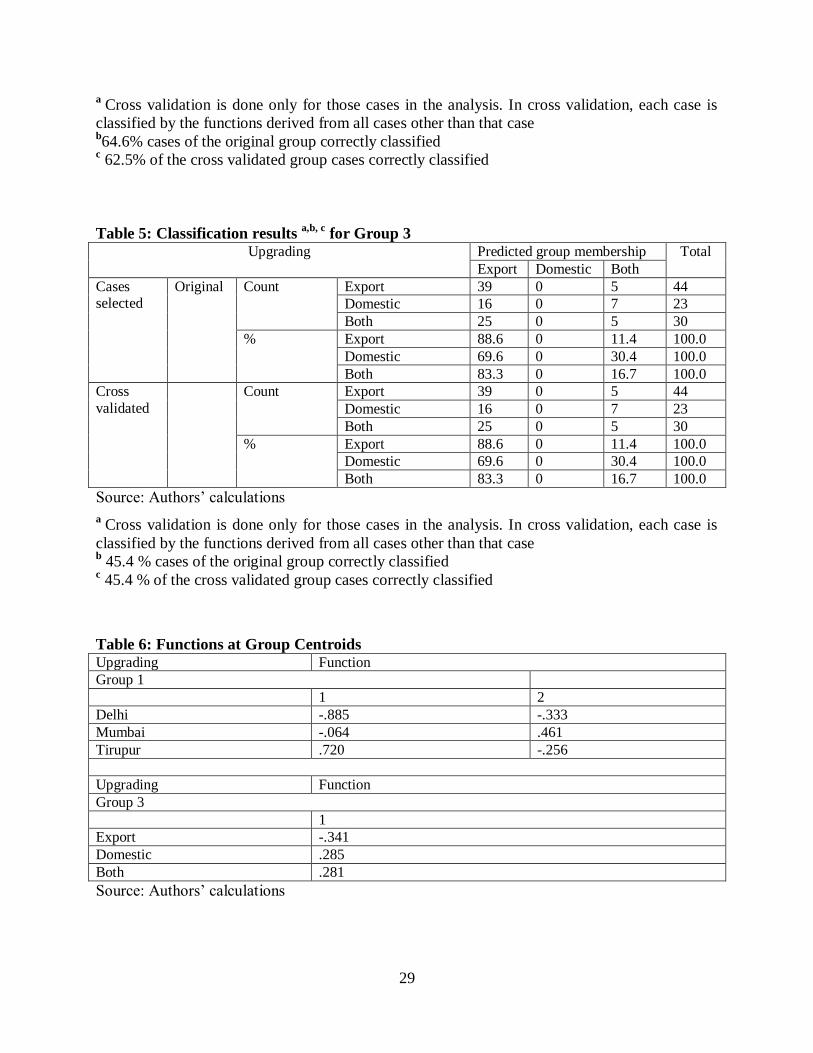
[Table 5 about here]
For the role of functions in differentiating categories of the dependent variable, we look at
patterns of positive and negative values in the output. From Table 6, we note that the centroid
(mean) for Delhi and Mumbai in Group 1, have negative values while Tirupur has a positive
value. Hence discriminant function 1 separates Tirupur from the other two groups. For
discriminant function 2, Delhi and Tirupur have negative values while Mumbai has a positive
value. So the second discriminant function separates Mumbai from the other two. For Group 3,
21
we note that Exporting is negative while Domestic and Both are positive. Hence discriminant
function 1 separates exporting from the other two groups.
[Table 6 about here]
d. Assessing the contribution of predictor variables
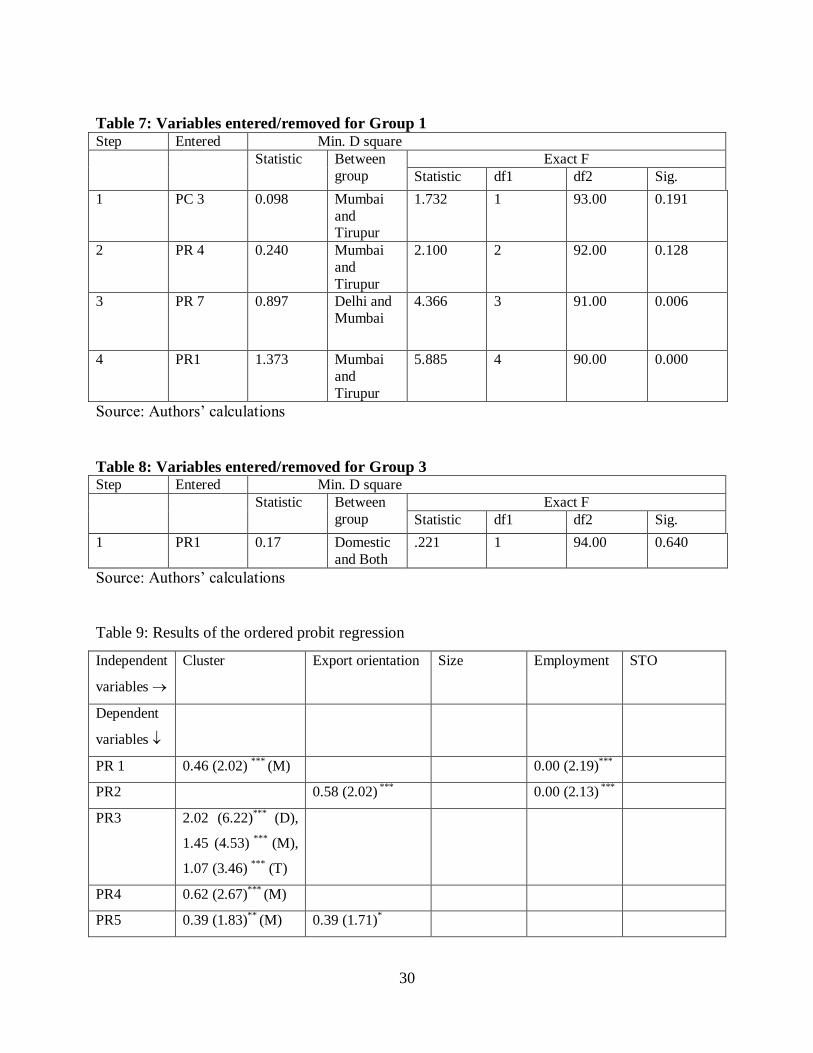
The summary table of variables entering and leaving the discriminant functions is shown in
Table 7. From this table we see that PC 3 (reduction in reworking rates), PR 4 (Introduction or
improvements in total quality programmes), PR 7 (Increased use of computer programmes and
internet for business purposes) and PR 1 (New production machinery) are the most important
predictors of upgrading between Mumbai, Delhi and Tirupur. PR1 (New production machinery)
is most important predictor of upgrading between firms catering to the Domestic market and
Both (i.e. exporting as well as supplying to the export market).
[Table 7 about here]
The summary for Group 3 is given in Table 8. PR1 (New production machinery) is the most
important predictor of upgrading between firms catering to the Domestic market and Both (i.e.
exporting as well as supplying to the export market).
[Table 8 about here]
E. Ordered Probit Analysis
Ordered probit analysis model has been used to capture the determinants of upgrading. This is
more appropriate than a linear regression model for explaining the hypothesis of what predicts
upgrading?18
The basic notion underlying the model is the existence of an underlying the model
is the existence of a latent or unobserved continuous upgrading variable, indicating the degree of
upgrading by the firm. This latent variable id related to a set of explanatory variables by the
standard linear relationship:
18 Ordered probit makes no assumption about the cardinality of the upgrading: hence the firms which have reported
an upgrading score of 2 are not assumed to be two times more upgraded than the firms that have reported a score of
1.
22
(1)
where xi is the vector of explanatory variables and include firm, industry and cluster related
factors influencing the level of upgrading. β is the associated parameter vector, and ε is a random
error term drawn from a standardized normal distribution. Ui* is unobserved and is related to U
by the following relationship:
Ui = 0 iff Ui* < 0
Ui = 1 iff 0 < Ui* < 1
…
Ui = J iff Ui* > J-1
where i are unobserved thresholds defining the boundaries between different levels of
upgrading.
The dependent variable is the index of upgrading and each of the thirteen categories of upgrading
has been included in the analysis.
a. Determinants of upgrading
Kaplinsky and Wamae (2010), identify four sets of factors that explain the extent to which firms
upgrade: ownership, the nature of buyers, the country of production (Madagascar or Kenya, in
their case) and the location of the final market. Patterns of ownership, whether national or
foreign, matters significantly in the case of Madagascar. Also the nationality of the foreign
investor matters: whether they are Asian or US owned.19
The nature of the buyers and their role
in upgrading has been discussed extensively in the GVC literature (and discussed above). The
location of the final markets is also closely related to the nature of the buyers and has been
discussed in Gibbons (2008). The difference in functional upgrading for firms catering to the
US/EU vis-a-vis supplying to the Middle East market has been noted in our case.
19 There are very few MNCs in our sample, most of the firms are Indian.
23
Based on this, the determinants of upgrading includes firm level factors such as size of the firm,
the sales turnover, investment in plant and machinery and the number of persons employed. The
cluster to which the firm belongs to has been included, as well the markets to which the firms are
catering to (Exporting, Domestic or Both).20
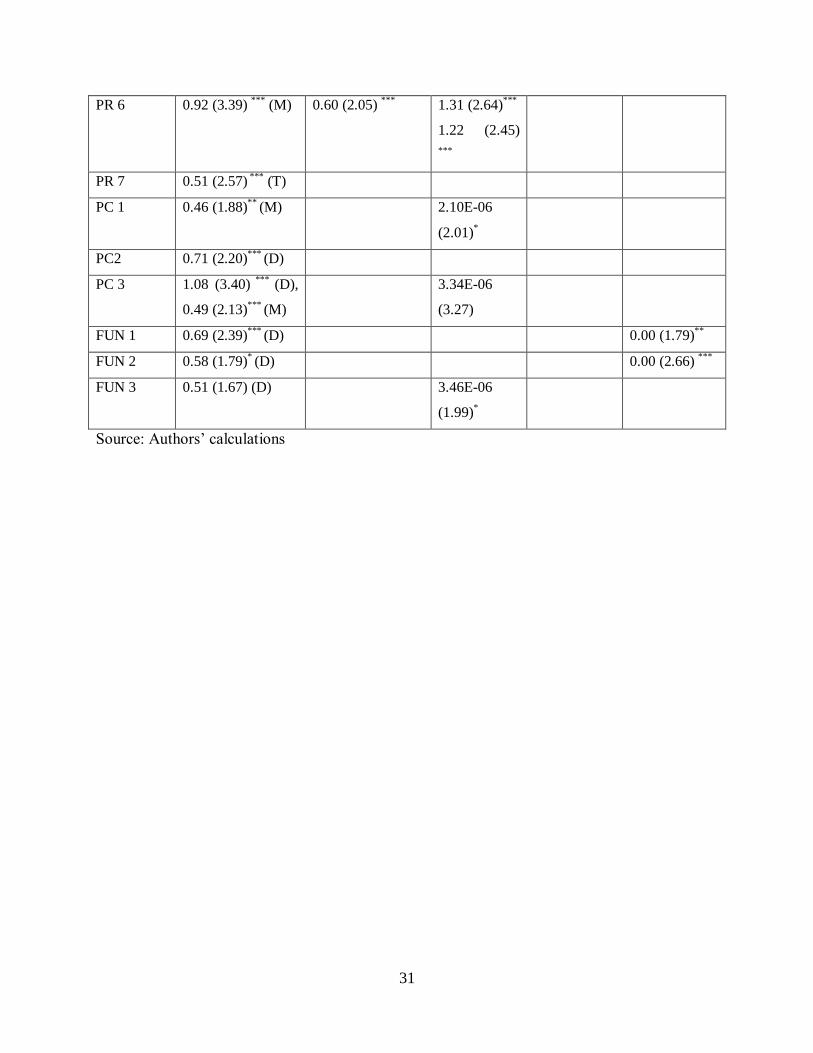
b. Results
The variables significant in explaining upgrading include the cluster, the orientation of the firm
and size and sales turnover as can be seen from table 9.
[Table 9 about here]
6. Conclusion
This paper examines, firstly, the engagement of firms in global, regional and domestic supply
chains in the apparel industry in India. Firms surveyed using a structured questionnaire were
located in Delhi NCR, Mumbai and Tirupur. There are firms catering to global value chains, as
well as selling to the domestic market. The global value chain is of two types: supplying to the
US and EU and supplying to the Middle East market. There are some differences in the two
value chains: while the products in the US market are low value added garments, which are sold
in bulk, the products sold in the EU market are higher value added while the quantities are lower.
Second, we also try to understand the strategies adopted by firms relating process, product
upgrading and capacity to augment their functional position in the chain. While most of the firms
reported process and product upgrading, fewer showed functional upgrading. For process
upgrading, the lowest score was recorded for increased usage of computer programs for business
purposes, while the highest score was recorded by reduction in delivery time. In the case of
product upgrading, introduction to new fabrics and raw materials scored the lowest, while the
highest rate was recorded by steps taken to improve the product quality by all the firms in our
sample. Our survey revealed that almost all firms are involved in functional upgrading. The
lowest score, as expected, was recorded by branding, while the highest score was recorded by
design. The nature of the governance structure affecting functional upgrading was also observed
from our survey.
20 It was not possible to distinguish between firms catering to the US versus catering to the EU in our sample.
24
Discriminant analysis was carried out to identify the variable that does the best job of
differentiating between the three groups, clusters, size and orientation. For the role of functions
in differentiating categories of the dependent variable, we look at patterns of positive and
negative values in the output. In case of classification of firms based on clusters, we observe that
there are two discriminant functions. Discriminant function 1 separates Tirupur from the other
two groups. Discriminant function 2, separates Mumbai from the other two. For the group
classified on the basis orientation, the first discriminant function separates Exporting from the
other two groups (Domestic and Both). The summary table of variables entering and leaving the
discriminant functions reveals that PC 3 (reduction in reworking rates), PR 4 (Introduction or
improvements in total quality programmes), PR 7 (Increased use of computer programmes and
internet for business purposes) and PR 1 (New production machinery) are the most important
predictors of upgrading between Mumbai, Delhi and Tirupur. PR1 (New production machinery)
is most important predictor of upgrading between firms catering to the Domestic market and
Both (i.e. exporting as well as supplying to the export market).
The ordered probit analysis confirmed the importance of cluster for all the types of upgrading.
Export orientation, and size of the firm also mattered in a few cases.
The policy implications from the survey follow from the factors that firms felt impacted
upgrading the most. Some of these factors have been noted above and are commonly cited in the
literature. However, the most important conclusion that emerges is the nature of the chain matter
– whether the domestic or the GVC. Also the export destination in case of GVC matters since
that determines the governance structure within the chain. Export promotion strategies of the
government generally tend to overlook this aspect and perhaps a more nuanced approach to GVC
activity will help the industry more.
References
Altman, E. I. (1968) Financial ratios, discriminant analysis and the prediction of corporate
bankruptcy, Journal of Finance, Vol. 22, pp. 589-610.
Apparel Export Promotion Council (2009) Indian Apparel Clusters-An Assessment. New Delhi.
Aziz, M. A. and H. A. Dar (2006) Predicting corporate bankruptcy: where we stand? Corporate
Governance, Vol. 6, no. 1, pp. 18-33.
25
Bair, J. (2009) Frontiers of Commodity Chain Research. Stanford University Press
Bazan, L., and Navas-Aleman, L. (2004) The Underground revolution in the Sinos valley: A
Comparison of Upgrading in global and national value chain, In Schmitz, H. (Ed. ) (2004) Local
enterprises in the global economy: Issues of governance and upgrading. Edward Elgar.
Economic Survey 2011-2012. Ministry of Finance, Government of India. Link:
http://www.indiabudget.nic.in/survey.asp
Gereffi, G. (1994) ‘The Organisation of Buyer-driven Global Commodity Chains: How U.S.
Retailers Shape Overseas Production Networks’, in G. Gereffi and M. Korzeniewicz (eds),
Commodity Chains and Global Capitalism, Westport, CT: Praeger: pp. 95–122
Gereffi, G., (1999) International Trade and Industrial Upgrading in the Apparel Commodity
Chain. Journal of International Economics, Vol. 48, Num. 1, June, Pages: pp. 37-70
Gereffi, G., Humphrey, J., Kaplinsky, R., Sturgeon,T.-J (2001) “Introduction: globalization,
value chains and development”, IDS Bulletin, 32 (3), pp. 1-8.
Gereffi, G ., Humphrey, J., Sturgeon,T.-J. (2005) The Governance of Global Value Chains.
Review of International Political Economy, Vol. 12, Num. 1, pp. 78-104.
Gereffi, G., and Memedovic, O. (2003) The Global Apparel Value Chian: What Prospects for
Upgrading for Developing Countries? Vienna, Austria, United Nations Industrial Development
Organization (UNIDO).
Gibbons, P., (2008) Segmentation, Governance and Upgrading in Global Clothing Chains: A
Mauritian Case Study, In Fold, N. and Larsen, M. N. (eds.) Globalization and Restructuring of
African Commodity Flows, Nordiska Afrikainstitutet, Stockholm.
Giuliani, E., Pietrobelli, C., and Rabellotti, R., (2005) Upgrading in global value chains: lessons
from Latin American clusters, World Development, 33(4), pp. 549-573.
Humphrey, J., and Schmitz, H., (2000) Governance and Upgrading: Linking Industrial Cluster
and Global Value Chain. IDS Working Paper, Num. 120, pp. 1-37.
Humphrey, J., and Schmitz, H., (2002) How does insertion in global value chains affect
upgrading in industrial clusters? Regional Studies, 36 (9), 1017-1027.
Technopak (2010) Indian Textile and Apparel Compendium, Technopak.
Technopak (2012) Indian Textile and Apparel Compendium, Technopak.
Kaplinsky, R. (2001) Learning networks in the South African auto components industry.
Innovation News.
26
Kaplinsky, R., and Morris, M., (2001) A handbook for Value Chain Research,
http://asiandrivers.open.ac.uk/documents/Value_chain _handbook_RKMM_Nov_2001.pdf
Kaplinsky, R. and Wamae, W. (2010) The Determinants of Upgrading and Value Added in the
African Clothing sector: The Contrasting Experiences of Kenya and Madgascar, IKD Working
Paper No. 59.
Keesing, D.B., and Lall, S., (1992) Marketing Manufactured Exports from Developing
Countries: Learning Sequences and Public Support . G. Helleiner, (Ed.), Trade Policy,
Industrialization, and Development: New Perspectives. Oxford: Clarendon Press.
Morrison, A., Pietrobelli, C., and Rabellotti, R., (2008) Global value chains and technological
capabilities; a framework to study learning and innovation in developing countries, Oxford
Development Studies, 36(1), pp. 39-58.
MSME, (2009) Quick Results Fourth All India Census of, Micro, Small & Medium Enterprises
2006-2007.GOI Development Commissioner (MSME).
MSME Policies: http://dcmsme.gov.in/policies/policies.htm
Navas-Aleman, L., (2011) The Impact of Operating in Multiple Value Chains for Upgrading:
The Case of the Brazilian Furniture and Footwear Industries. World Development, Vol. 39, No.
8, pp. 1386–1397, 2011.
Pickles, J. (2012) Economic and social upgrading in apparel global value chains: public
governance and trade policy, Capturing the Gains Working Paper 2012/13, University of
Manchester.
Porter, M. (1990) The Competitive Advantage of Nations, London and Basingstoke: Macmillan.
Schmitz, H., (2004) Local Enterprises in the Global Economy: Issues of Governance and
Upgrading. Edward Elgar, Cheltenham, UK.
Schmitz, H., (2006) Learning and Earning in Global Garment and Footwear Chains. European
Journal of Development Research, Vol. 18, Num. 4, Dec, pp: 546-571.
Textile Committee (2011) National Household Survey 2010: Market for Textile and Clothing.
The Apparel Times, (2011) International Magazine for Apparel Trade and Technology. Vol. 7,
No. 6, Nov-Dec 2011.
UNCTAD (2013) World Investment Report: Global Value Chains: Investment and Trade for
Development, UNCTAD, New York and Geneva.
27
Table 1: Summary of upgrading scores reported by firms
Product
upgrading
Process
upgrading
Functional
upgrading
Product
and
process
upgrading
Functional,
Product
and
Process
Upgrading
Little or no
product
upgrading
Little or no
process up
Little or no
upgrading
Domestic 12/25 (48) 12/25 (48) 11/25 (44) 7/25 (28) 4/25 (16) 13/25 (52) 13/25 (52) 6/25 (24)
Exporters 18/44 (41) 28/44 (64) 22/44 (50) 14/44 (32) 12/44 (27) 26/44 (59) 16/44 (36) 10/44 (23)
Domestic &
Exporter
10/28 (36) 23/28 (82) 12/28 (43) 9/28 (32) 3/28 (10) 18/28 (64) 5/28 (18) 4/28 (14)
Total 40/97 (41) 63/97 (65) 45/97 (46) 30/97 (31) 19/97 (19) 57/97 (59) 34/97 (35) 20/97 (21)
Delhi NCR 15/25 (60) 14/25 (56) 17/28 (61) 12/25 (48) 12/28 (42) 10/25 (40) 11/25 (44) 8/25 (32)
Mumbai 18/37 (49) 23/37 (62) 19/37 (51) 12/37 (32) 6/37 (16) 19/37 (51) 14/37 (38) 6/37 (16)
Tirupur 6/34 (18) 26/34 (76) 9/34 (26) 6/34 (18) 1/34 (3) 28/34 (82) 8/34 (23) 6/34 (18)
Total 39/96 (41) 63/96 (66) 45/96 (47) 30/96 (31) 19/96 (20) 57/96 (59) 33/96 (34) 20/96 (21)
Small 16/39 (41) 25/39 (64) 19/39 (49) 13/39 (33) 8/39 (20) 23/39 (56) 14/39 (36) 8/39 (20)
Medium 20/52 (38) 35/52 (67) 23/52 (44) 14/52 (27) 9/52 (17) 32/52 (61) 17/52 (33) 10/52 (19)
Large 4/6 (67) 3/6 (50) 3/6 (50) 3/6 (50) 2/6 (33) 2/6 (33) 3/6 (50) 2/6 (33)
Total 40/97 (41) 63/97 (65) 45/97 (46) 30/97 (31) 19/97 (19) 57/97 (59) 34/97 (35) 20/97 (21)
Source: Authors’ compilation based on survey
Note: The table reports how many firms reported upgrading (score of 3 or more than 3 on a scale of 5) by the total
number of respondents in that category. Figures in parentheses are the number of firms in each category.
Table 2: Overall significance of the discriminant function (s)
Group 1
Function Eigenvalue % of Variance Cumulative % Canonical correlation
1 .40221
66.0 66.0 0.536
2 .207 34.0 100.0 0.414
Test of function(s) Wilk’s Lambda Chi-square df Sig.
21 First two canonical discriminant functions were used in the analysis
28
1 through 2 0.591 48.144 8 .000
2 0.828 17.215 3 .001
Group 3
Function Eigenvalue % of Variance Cumulative % Canonical
correlation
1 .10022
100.0 100.0 0.301
Test of function(s) Wilk’s Lambda Chi-square df Sig.
1 0.909 8.923 2 .012
Source: Authors’ calculations
Table 3: Box’s M Group 1
Box’s M 43.009
F Approx. 3.410
df1 12
df2 32193.527
Sig. .000
Group 3
Box’s M 13.669
F Approx. 6.735
df1 2
df2 16809.872
Sig. .001
Source: Authors’ calculations
Table 4: Classification results a,b, c
for Group 1 Upgrading Predicted group membership Total
Delhi Mumbai Tirupur
Cases
selected
Original Count Delhi 12 11 2 25
Mumbai 4 26 7 37
Tirupur 2 8 24 34
Ungrouped cases 0 1 0 1
% Delhi 48.0 44.0 8.0 100.0
Mumbai 10.8 70.3 18.9 100.0
Tirupur 5.9 23.5 70.6 100.0
Ungrouped cases 0 100.0 0 100.0
Cross validated
Count Delhi 11 12 2 25
Mumbai 5 25 7 37
Tirupur 2 8 24 34
% Delhi 44.0 48.0 8.0 100.0
Mumbai 13.5 67.6 18.9 100.0
Tirupur 5.9 23.5 70.6 100.0
Source: Authors’ calculations
22 First 1 canonical discriminant functions were used in the analysis
29
a Cross validation is done only for those cases in the analysis. In cross validation, each case is
classified by the functions derived from all cases other than that case b64.6% cases of the original group correctly classified
c 62.5% of the cross validated group cases correctly classified
Table 5: Classification results a,b, c
for Group 3 Upgrading Predicted group membership Total
Export Domestic Both
Cases selected
Original Count Export 39 0 5 44
Domestic 16 0 7 23
Both 25 0 5 30
% Export 88.6 0 11.4 100.0
Domestic 69.6 0 30.4 100.0
Both 83.3 0 16.7 100.0
Cross
validated
Count Export 39 0 5 44
Domestic 16 0 7 23
Both 25 0 5 30
% Export 88.6 0 11.4 100.0
Domestic 69.6 0 30.4 100.0
Both 83.3 0 16.7 100.0
Source: Authors’ calculations
a Cross validation is done only for those cases in the analysis. In cross validation, each case is
classified by the functions derived from all cases other than that case b 45.4 % cases of the original group correctly classified
c 45.4 % of the cross validated group cases correctly classified
Table 6: Functions at Group Centroids Upgrading Function
Group 1
1 2
Delhi -.885 -.333
Mumbai -.064 .461
Tirupur .720 -.256
Upgrading Function
Group 3
1
Export -.341
Domestic .285
Both .281
Source: Authors’ calculations
30
Table 7: Variables entered/removed for Group 1 Step Entered Min. D square
Statistic Between
group
Exact F
Statistic df1 df2 Sig.
1 PC 3 0.098 Mumbai
and Tirupur
1.732 1 93.00 0.191
2 PR 4 0.240 Mumbai
and
Tirupur
2.100 2 92.00 0.128
3 PR 7 0.897 Delhi and
Mumbai
4.366 3 91.00 0.006
4 PR1 1.373 Mumbai
and
Tirupur
5.885 4 90.00 0.000
Source: Authors’ calculations
Table 8: Variables entered/removed for Group 3 Step Entered Min. D square
Statistic Between
group
Exact F
Statistic df1 df2 Sig.
1 PR1 0.17 Domestic
and Both
.221 1 94.00 0.640
Source: Authors’ calculations
Table 9: Results of the ordered probit regression
Independent
variables
Cluster Export orientation Size Employment STO
Dependent
variables
PR 1 0.46 (2.02) ***
(M) 0.00 (2.19)***
PR2 0.58 (2.02) ***
0.00 (2.13) ***
PR3 2.02 (6.22)***
(D),
1.45 (4.53) ***
(M),
1.07 (3.46) ***
(T)
PR4 0.62 (2.67)***
(M)
PR5 0.39 (1.83)**
(M)
0.39 (1.71)*
31
PR 6 0.92 (3.39) ***
(M) 0.60 (2.05) ***
1.31 (2.64)***
1.22 (2.45)
***
PR 7 0.51 (2.57) ***
(T)
PC 1 0.46 (1.88)**
(M)
2.10E-06
(2.01)*
PC2 0.71 (2.20)***
(D)
PC 3 1.08 (3.40) ***
(D),
0.49 (2.13)***
(M)
3.34E-06
(3.27)
FUN 1 0.69 (2.39)***
(D) 0.00 (1.79)**
FUN 2 0.58 (1.79)* (D) 0.00 (2.66)
***
FUN 3 0.51 (1.67) (D) 3.46E-06
(1.99)*
Source: Authors’ calculations
32
Figure 1: Scatterplot matrix of independent variables
33
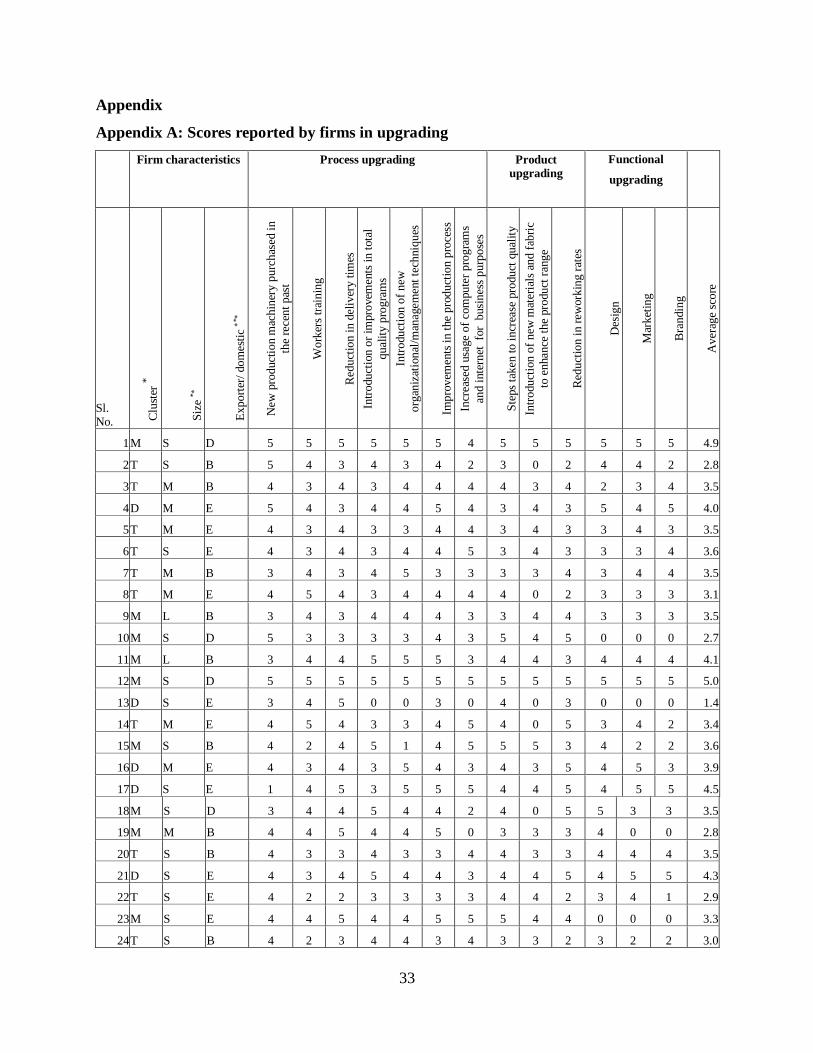
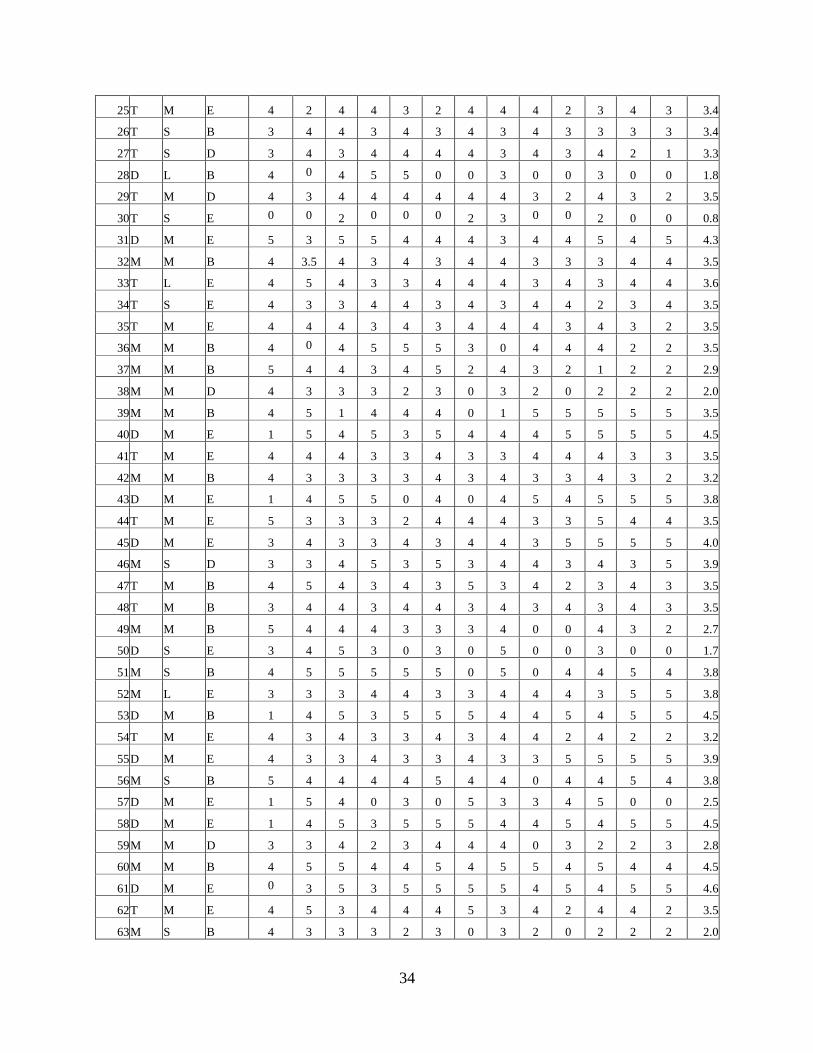
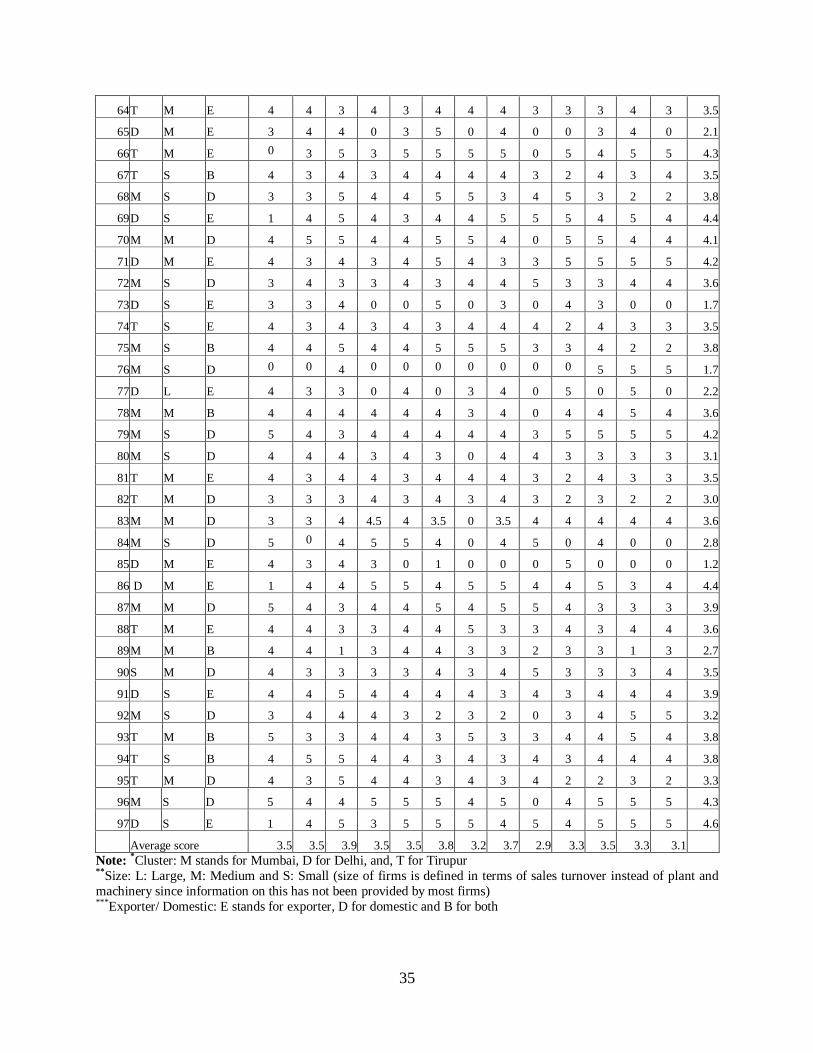
Appendix
Appendix A: Scores reported by firms in upgrading
Firm characteristics Process upgrading Product
upgrading
Functional
upgrading
Sl. No. C
lust
er *
Siz
e *
Export
er/
dom
esti
c
*
New
pro
duct
ion m
achin
ery p
urc
has
ed i
n
the
rece
nt
pas
t
Work
ers
trai
nin
g
Red
uct
ion i
n d
eliv
ery t
imes
Intr
oduct
ion o
r im
pro
vem
ents
in t
ota
l
qual
ity p
rogra
ms
Intr
oduct
ion o
f new
org
aniz
atio
nal
/man
agem
ent
tech
niq
ues
Impro
vem
ents
in t
he
pro
duct
ion p
roce
ss
Incr
ease
d u
sage
of
com
pute
r pro
gra
ms
and i
nte
rnet
fo
r b
usi
nes
s purp
ose
s
Ste
ps
taken
to i
ncr
ease
pro
duct
qual
ity
Intr
oduct
ion o
f new
mat
eria
ls a
nd f
abri
c
to e
nhan
ce t
he
pro
duct
ran
ge
Red
uct
ion i
n r
ework
ing r
ates
Des
ign
Mar
ket
ing
Bra
ndin
g
Aver
age
score
1 M S D 5 5 5 5 5 5 4 5 5 5 5 5 5 4.9
2 T S B 5 4 3 4 3 4 2 3 0 2 4 4 2 2.8
3 T M B 4 3 4 3 4 4 4 4 3 4 2 3 4 3.5
4 D M E 5 4 3 4 4 5 4 3 4 3 5 4 5 4.0
5 T M E 4 3 4 3 3 4 4 3 4 3 3 4 3 3.5
6 T S E 4 3 4 3 4 4 5 3 4 3 3 3 4 3.6
7 T M B 3 4 3 4 5 3 3 3 3 4 3 4 4 3.5
8 T M E 4 5 4 3 4 4 4 4 0 2 3 3 3 3.1
9 M L B 3 4 3 4 4 4 3 3 4 4 3 3 3 3.5
10 M S D 5 3 3 3 3 4 3 5 4 5 0 0 0 2.7
11 M L B 3 4 4 5 5 5 3 4 4 3 4 4 4 4.1
12 M S D 5 5 5 5 5 5 5 5 5 5 5 5 5 5.0
13 D S E 3 4 5 0 0 3 0 4 0 3 0 0 0 1.4
14 T M E 4 5 4 3 3 4 5 4 0 5 3 4 2 3.4
15 M S B 4 2 4 5 1 4 5 5 5 3 4 2 2 3.6
16 D M E 4 3 4 3 5 4 3 4 3 5 4 5 3 3.9
17 D S E 1 4 5 3 5 5 5 4 4 5 4 5 5 4.5
18 M S D 3 4 4 5 4 4 2 4 0 5 5 3 3 3.5
19 M M B 4 4 5 4 4 5 0 3 3 3 4 0 0 2.8
20 T S B 4 3 3 4 3 3 4 4 3 3 4 4 4 3.5
21 D S E 4 3 4 5 4 4 3 4 4 5 4 5 5 4.3
22 T S E 4 2 2 3 3 3 3 4 4 2 3 4 1 2.9
23 M S E 4 4 5 4 4 5 5 5 4 4 0 0 0 3.3
24 T S B 4 2 3 4 4 3 4 3 3 2 3 2 2 3.0
34
25 T M E 4 2 4 4 3 2 4 4 4 2 3 4 3 3.4
26 T S B 3 4 4 3 4 3 4 3 4 3 3 3 3 3.4
27 T S D 3 4 3 4 4 4 4 3 4 3 4 2 1 3.3
28 D L B 4 0 4 5 5 0 0 3 0 0 3 0 0 1.8
29 T M D 4 3 4 4 4 4 4 4 3 2 4 3 2 3.5
30 T S E 0 0 2 0 0 0 2 3 0 0 2 0 0 0.8
31 D M E 5 3 5 5 4 4 4 3 4 4 5 4 5 4.3
32 M M B 4 3.5 4 3 4 3 4 4 3 3 3 4 4 3.5
33 T L E 4 5 4 3 3 4 4 4 3 4 3 4 4 3.6
34 T S E 4 3 3 4 4 3 4 3 4 4 2 3 4 3.5
35 T M E 4 4 4 3 4 3 4 4 4 3 4 3 2 3.5
36 M M B 4 0 4 5 5 5 3 0 4 4 4 2 2 3.5
37 M M B 5 4 4 3 4 5 2 4 3 2 1 2 2 2.9
38 M M D 4 3 3 3 2 3 0 3 2 0 2 2 2 2.0
39 M M B 4 5 1 4 4 4 0 1 5 5 5 5 5 3.5
40 D M E 1 5 4 5 3 5 4 4 4 5 5 5 5 4.5
41 T M E 4 4 4 3 3 4 3 3 4 4 4 3 3 3.5
42 M M B 4 3 3 3 3 4 3 4 3 3 4 3 2 3.2
43 D M E 1 4 5 5 0 4 0 4 5 4 5 5 5 3.8
44 T M E 5 3 3 3 2 4 4 4 3 3 5 4 4 3.5
45 D M E 3 4 3 3 4 3 4 4 3 5 5 5 5 4.0
46 M S D 3 3 4 5 3 5 3 4 4 3 4 3 5 3.9
47 T M B 4 5 4 3 4 3 5 3 4 2 3 4 3 3.5
48 T M B 3 4 4 3 4 4 3 4 3 4 3 4 3 3.5
49 M M B 5 4 4 4 3 3 3 4 0 0 4 3 2 2.7
50 D S E 3 4 5 3 0 3 0 5 0 0 3 0 0 1.7
51 M S B 4 5 5 5 5 5 0 5 0 4 4 5 4 3.8
52 M L E 3 3 3 4 4 3 3 4 4 4 3 5 5 3.8
53 D M B 1 4 5 3 5 5 5 4 4 5 4 5 5 4.5
54 T M E 4 3 4 3 3 4 3 4 4 2 4 2 2 3.2
55 D M E 4 3 3 4 3 3 4 3 3 5 5 5 5 3.9
56 M S B 5 4 4 4 4 5 4 4 0 4 4 5 4 3.8
57 D M E 1 5 4 0 3 0 5 3 3 4 5 0 0 2.5
58 D M E 1 4 5 3 5 5 5 4 4 5 4 5 5 4.5
59 M M D 3 3 4 2 3 4 4 4 0 3 2 2 3 2.8
60 M M B 4 5 5 4 4 5 4 5 5 4 5 4 4 4.5
61 D M E 0 3 5 3 5 5 5 5 4 5 4 5 5 4.6
62 T M E 4 5 3 4 4 4 5 3 4 2 4 4 2 3.5
63 M S B 4 3 3 3 2 3 0 3 2 0 2 2 2 2.0
35
64 T M E 4 4 3 4 3 4 4 4 3 3 3 4 3 3.5
65 D M E 3 4 4 0 3 5 0 4 0 0 3 4 0 2.1
66 T M E 0 3 5 3 5 5 5 5 0 5 4 5 5 4.3
67 T S B 4 3 4 3 4 4 4 4 3 2 4 3 4 3.5
68 M S D 3 3 5 4 4 5 5 3 4 5 3 2 2 3.8
69 D S E 1 4 5 4 3 4 4 5 5 5 4 5 4 4.4
70 M M D 4 5 5 4 4 5 5 4 0 5 5 4 4 4.1
71 D M E 4 3 4 3 4 5 4 3 3 5 5 5 5 4.2
72 M S D 3 4 3 3 4 3 4 4 5 3 3 4 4 3.6
73 D S E 3 3 4 0 0 5 0 3 0 4 3 0 0 1.7
74 T S E 4 3 4 3 4 3 4 4 4 2 4 3 3 3.5
75 M S B 4 4 5 4 4 5 5 5 3 3 4 2 2 3.8
76 M S D 0 0 4 0 0 0 0 0 0 0 5 5 5 1.7
77 D L E 4 3 3 0 4 0 3 4 0 5 0 5 0 2.2
78 M M B 4 4 4 4 4 4 3 4 0 4 4 5 4 3.6
79 M S D 5 4 3 4 4 4 4 4 3 5 5 5 5 4.2
80 M S D 4 4 4 3 4 3 0 4 4 3 3 3 3 3.1
81 T M E 4 3 4 4 3 4 4 4 3 2 4 3 3 3.5
82 T M D 3 3 3 4 3 4 3 4 3 2 3 2 2 3.0
83 M M D 3 3 4 4.5 4 3.5 0 3.5 4 4 4 4 4 3.6
84 M S D 5 0 4 5 5 4 0 4 5 0 4 0 0 2.8
85 D M E 4 3 4 3 0 1 0 0 0 5 0 0 0 1.2
86 D M E 1 4 4 5 5 4 5 5 4 4 5 3 4 4.4
87 M M D 5 4 3 4 4 5 4 5 5 4 3 3 3 3.9
88 T M E 4 4 3 3 4 4 5 3 3 4 3 4 4 3.6
89 M M B 4 4 1 3 4 4 3 3 2 3 3 1 3 2.7
90 S M D 4 3 3 3 3 4 3 4 5 3 3 3 4 3.5
91 D S E 4 4 5 4 4 4 4 3 4 3 4 4 4 3.9
92 M S D 3 4 4 4 3 2 3 2 0 3 4 5 5 3.2
93 T M B 5 3 3 4 4 3 5 3 3 4 4 5 4 3.8
94 T S B 4 5 5 4 4 3 4 3 4 3 4 4 4 3.8
95 T M D 4 3 5 4 4 3 4 3 4 2 2 3 2 3.3
96 M S D 5 4 4 5 5 5 4 5 0 4 5 5 5 4.3
97 D S E 1 4 5 3 5 5 5 4 5 4 5 5 5 4.6
Average score 3.5 3.5 3.9 3.5 3.5 3.8 3.2 3.7 2.9 3.3 3.5 3.3 3.1
Note: *Cluster: M stands for Mumbai, D for Delhi, and, T for Tirupur
**Size: L: Large, M: Medium and S: Small (size of firms is defined in terms of sales turnover instead of plant and
machinery since information on this has not been provided by most firms) ***Exporter/ Domestic: E stands for exporter, D for domestic and B for both
Recommended