Universidade de Aveiro 2007
Departamento de Biologia
VÂNIA SOFIA DE SOUSA BESSA
DINÂMICA DE BACTERIOPLÂNCTON DURANTE A OCORRÊNCIA DE BLOOM DE FITOPLÂNCTON

Universidade de Aveiro
2007 Departamento de Biologia
VÂNIA SOFIA DE SOUSA BESSA
DINÂMICA DE BACTERIOPLÂNCTON DURANTE A OCORRÊNCIA DE BLOOM DE FITOPLÂNCTON
Dissertação apresentada à Universidade de Aveiro para cumprimento dos requisitos necessários à obtenção do grau de Mestre em Toxicologia, realizada sob a orientação científica do Doutor Mário Jorge Pereira, Professor Auxiliar, e da Doutora Maria Ângela Cunha, Professora Auxiliar do Departamento de Biologia da Universidade de Aveiro.
o júri
presidente Fernando José Mendes Gonçalves Professor Associado com Agregação da Universidade de Aveiro
Ulisses Manuel Miranda Azeiteiro Professor Associado com Agregação da Universidade Aberta Mário Jorge Verde Pereira Professor Auxiliar da Universidade de Aveiro Maria Ângela Sousa Dias Alves Cunha Professora Auxiliar da Universidade de Aveiro
agradecimentos
Esta é uma altura privilegiada para demonstrar o meu reconhecimento a todos aqueles que contribuíram para a realização deste trabalho. Ao Doutor Mário Jorge Pereira, Professor Auxiliar do Departamento de Biologia da Universidade de Aveiro, orientador desta tese, pelos conhecimentos científicos transmitidos, pelo sentido critico, rigor cientifico, pelas apreciações pertinentes, pelas sugestões valiosas, incentivo e amizade demonstrados ao longo de todo o trabalho. À Doutora Maria Ângela Cunha, Professora Auxiliar do Departamento de Biologia da Universidade de Aveiro, co-orientadora desta tese, pelo acompanhamento critico e activo do desenvolvimento dos trabalhos, pelos conselhos pertinentes e valiosos, rigor cientifico, incentivo e amizade demonstrados ao longo de todo o trabalho. À Licenciada Luísa Santos, pelo apoio laboratorial demonstrado diariamente e ensinamentos de técnicas úteis no desenvolvimento dotrabalho experimental. Às Licenciadas Ana Rita Lopes e Catarina Pereira, por estarem sempre presentes quando necessitei de apoio e pelo bom ambiente que sempre envolveu o nosso grupo de trabalho. Aos meus pais, por sempre me incentivarem e motivarem a evoluir, por me incutirem desde sempre o espírito do trabalho por objectivos, por compreenderem o meu reduzido tempo para a família e pelos mimos sempre disponíveis. Aos meus amigos de quatro patas, por me proporcionarem bons momentos de brincadeira e carinhos. Ao Ricardo Resendes, pelo carinho e paciência que demonstrou a longo destes dois anos, por estar sempre presente quando precisava de desabafar e pelos bons momentos de distracção proporcionados. A eles, e aos muitos amigos que acompanharam o desenvolvimento deste trabalho, só não posso prometer que a vossa paciência não voltará a ser testada…
palavras-chave
Eutrofização, Bacterioplâncton, Cyanoprokariota, virus, dinâmica de
populações, lagos pouco prufundos
resumo
O presente trabalho pretendeu avaliar a estrutura das comunidades virais,
bacterianas e fitoplanctónicas durante um período de crescente temperatura
(Primavera), num lago pouco profundo (Lagoa da Vela – Portugal).
Numa primeira fase, foi avaliada a dinâmica plantónica bem como a
importância da população viral sobre a comunidade fitoplanctónica. Foi
possível verificar que a comunidade fitoplanctónica foi dominada por taxa da
Divisão Cyanobacteria e Chlorophyta assim como a existência de uma
correlação positiva entre a abundância viral e a do bacterioplancton.
Numa segunda fase, foi avaliada a composição, diversidade e abundância da
comunidade de bacterioplâncton. Esta comunidade procariota mostrou-se
maioritariamente constituída pelo Domínio Bacteria, estando as Archaea
representadas em todas as amostras. Dentro do primeiro domínio, os filos
Cytophaga e Proteobacteria estiveram bem representados. As primeiras
apresentaram elevadas abundâncias durante a fluorescência de fitoplâncton, o
mesmo acontecendo a sub-grupos do Proteobacteria. A análise de regressão
revelou que a variabilidade dos distintos grupos procariotas foi regulada por
factores químicos, interacções biológicas e por regulação dupla de factores
bióticos e abióticos.

keywords
Eutrophication, Bacterioplankton, Virus, CyanoproKariota, population dynamics, shallow lake
abstract
The present study aimed to assess the structure of viral, bacterial and
phytoplankton communities during a period of increasing temperature (spring),
in a shallow lake (Lagoa da Vela – Portugal).
On a first phase, the plankton dynamics were assessed, as well as the impact
of the viral population in the phytoplankton community. It was observed that the
phytoplankton community was dominated by species of Cyanobacteria as well
as a positive correlation between viral and bacterioplankton abundance was
also found.
Secondly, the bacterioplancton community composition, diversity and
abundance were evaluated. This community was dominated by the Bacteria
domain, being Archaea present in all samples. Within the Bacteria domain, the
phylum Cytophaga and Proteobacteria were well represented. The first ones
had high abundance during the phytoplankton bloom, as would the
Proteobacteria sub-groups. The regression analysis showed that the variability
of different prokaryote groups was governed by chemical, biological
interactions and dual regulation of biotic and abiotic factors.
ÍNDICE
Capítulo I Introdução geral 06
1. Lagos profundos Vs lagos pouco profundos 07
2. Interacções tróficas como mecanismos reguladores 07
3. Fitoplancton 09
4. Bacterioplancton 10
4.1. Papel ecológico do bacterioplancton 10
4.2. Diversidade e abundância do bacterioplancton 11
4.3. Factores que afectam o crescimento do bacterioplancton 11
4.3.1. Disponibilidade de nutrientes organicos e inorganicos 12
4.3.2. Propriedades da água 13
4.3.3. Mortalidade através de infecção e predação 14
5. Análise por “Fluorescence In Situ Hybridization” 15
6. Objectivos e estrutura da tese 16
7. Referências 17
Capítulo II Water column environment of a eutrophic shallow temperate lake in
late spring: pelagic communities of phytoplankton, cyanobacteria
and associated heterotrophic bacteria and viruses
29
Capítulo III Bacteripoplankton dynamics during the development of a
cyanobacteria bloom in a temperate shallow lake 56
Capítulo IV Discussão geral 87
Referências 92

Capítulo I
Introdução geral
Capítulo I – Introdução geral
7
1. Lagos profundos Vs lagos pouco profundos
Os lagos oligotróficos, normalmente denominados lagos profundos, são caracterizados
por uma zona hipolímnica, pouco iluminada ou mesmo inteiramente escura, pobre em
fitoplâncton, cuja temperatura varia pouco durante o ano, sendo a produtividade muito
reduzida. Em contraste, os lagos eutróficos (ou pouco profundos) são caracterizados por
temperaturas mais elevadas e elevada produtividade.
No sul da Europa, os lagos pouco profundos (influenciados pelo clima Mediterrâneo)
estão sujeitos a efeitos top-down (Blanco et al., 2003; Gyllstrom et al., 2005), pelo que se
encontram mais vulneráveis a processos de eutrofização. Embora estes habitats suportem
uma considerável biodiversidade, o seu valor está normalmente comprometido devido ao
enriquecimento em nutrientes (estimulado pelas actividades humanas). Um bom exemplo
desta problemática é a Lagoa da Vela, local escolhido como objecto do presente estudo.
Este pequeno lago natural (resultante da acumulação de água numa depressão superficial) e
permanente, outrora transparente e com grande variedade de peixes, encontra-se
actualmente altamente turbido, sob forte carga de nutrientes (Abrantes et al., 2006) e
presença recorrente de cianobactérias, muitas das quais tóxicas (de Figueiredo et al., 2006).
Este sistema é utilizado para fins recreacionais, bem como para actividades agrícolas.
Como o solo circundante é arenoso, o lixiviamento de nutrientes e tóxicos é potenciado.
2. Interacções tróficas como mecanismos reguladores
A regulação dos sistemas aquáticos estabelece uma interacção entre as condicionantes
externas (factores abióticos) e os processos internos (interacções bióticas). Os mecanismos
de regulação top-down (do topo da cadeia trófica para a sua base) inferem que os
predadores podem ter efeitos determinantes nos níveis tróficos inferiores (Brooks &
Dodson, 1965; Hall et al., 1976), em oposição aos mecanismos de regulação bottom-up
que resultam da competição pela disponibilidade de nutrientes ou alimento. Da relação
entre estes dois mecanismos resulta o equilíbrio ecológico da cadeia trófica de um lago
(Brönmark & Hansson , 1998).
Paine (1980) denominou de cadeia trófica ao conjunto de efeitos recíprocos do
predador sobre a presa alterando a sua abundância, biomassa ou produtividade de uma

Capítulo I – Introdução geral
8
Figura 1: Esquema simplificado do
loop microbiano. MOD - Matéria
Organica Dissolvida; MOP -
Matéria Orgânica Particulada.
(Adaptado de Madigan et al., 2000)
população, comunidade ou nível trófico, afectando mais do que um elo da teia trófica. Os
microorganismos são membros activos nesta complexa rede. Como defende Sherr & Sherr
(1988), o loop microbiano (Figura 1) deve ser considerado como um componente integral
de uma grande rede alimentar, que inclua todos os organismos unicelulares pro e
eucariotas, tanto auto como heterotróficos, estando a cargo da cadeia alimentar microbiana
suportar a cadeia alimentar dos metazoários. Por outro lado, a presença de populações
virais numa comunidade aquática pode afectar a sua composição, comportamento e
estrutura (Chattopadhyay et al., 2003). Vários estudos (Bergh et al., 1989; Suttle et al.,
1990; Tarutani et al., 2000; Wommack & Colwell, 2000) têm demonstrado a presença de
vírus patogénicos nas comunidades de fitoplâncton tendo sido descritas para muitas algas
eucariotas (van Etten et al., 1991; Reisser, 1993), cianobactérias (Suttle & Chan, 1993) e
comunidades naturais de fitoplâncton (Peduzzi & Weinbauer, 1993). No entanto, apesar do
crescente número de trabalhos, o papel das infecções virais na população de fitoplâncton
continua longe de estar completamente entendido.

Capítulo I – Introdução geral
9
3. Fitoplâncton
O plâncton é a base de toda a cadeia alimentar aquática, ocupando o fitoplâncton o
primeiro nível trófico (produtores) (Chattopadhyay et al., 2003). Tal como as plantas
terrestres, o fitoplâncton necessita de luz solar, água e nutrientes para a fotossíntese.
Através da conversão da energia solar em energia química, via fotossíntese, produzem a
energia necessária para toda a cadeia alimentar aquática (Moss, 1998). Uma característica
comum das populações de fitoplâncton, dadas as condições ecológicas apropriadas
(elevados níveis de nutrientes, calor e sol), é a sua capacidade de rápido crescimento
conduzindo a elevadas densidades celulares, ou blooms, de uma ou mais espécies (Solé et
al., 2006). Normalmente, esta situação é benéfica para a aquacultura e actividade
piscatória. No entanto, a proliferação de algumas espécies pode ser responsável pela
ocorrência de efeitos nocivos (quer por toxicidade directa ou por outros mecanismos),
tanto na cadeia alimentar, na saúde pública como em actividades socio-económicas (Solé
et al., 2006). Este tipo de florescimento é denominado por HABs (Harmful Algal Blooms)
(Smayda, 1997). O desenvolvimento de elevadas concentrações celulares está dependente
de variáveis físicas (ex. elevados tempos de residência), químicas (ex. disponibilidade de
nutrientes) e biológicas (ex. baixa predação) (Solé et al., 2006). HABs podem ser causados
por uma grande variedade de grupos de algas, mas são normalmente os dinoflagelados os
maiores causadores. A propriedade chave que favorece a acumulação de elevadas
biomassas destes organismos é a sua mobilidade, que lhes permite migrar e interagir com
padrões da circulação da água (Smayda, 1997). Uma característica particular de algumas
espécies presentes de HAB é a sua capacidade de produzir toxinas que afectam outros
organismos (Smayda, 1997).

Capítulo I – Introdução geral
10
4. Bacterioplâncton
Papel ecológico do bacterioplâncton
As bactérias são os componentes biológicos mais importantes e abundantes envolvidos
na renovação (transformação e remineralização) da matéria organica em sistemas aquáticos
(Pomeroy, 1991). As bactérias heterotróficas estão particularmente especializadas na
transformação de matéria orgânica. Elas hidrolisam matéria organica dissolvida e
particulada, podem utilizar substratos de difícil de degradação e utilizar diferentes
compostos alóctones como fonte de carbono organico. Elas convertem carbono organico
dissolvido, que iria ser, inevitavelmente, perdido para outros membros da cadeia alimentar,
em carbono particulado que assim se torna potencialmente disponível para níveis tróficos
superiores (loop microbiano) (Sherr & Sherr, 1988). Esta capacidade de recuperar o
carbono organico dissolvido é significativa, uma vez que representa uma ligação entre as
fontes em diversos níveis e os consumidores superiores (Azam & Hodson, 1977; Azam,
1998). Por outro lado, estudos em vários ambientes aquáticos indicam que o loop
microbiano (fitoplâncton � DOC � bactérias � protozoários � metazoários) (Figura 1)
pode processar aproximadamente tanta energia como a cadeia alimentar clássica
(fitoplâncton � animais herbívoros � animais carnívoros) (Riemann & Sondergaard,
1986).
Através da remineralização da matéria organica, as bactérias regeneram nutrientes in
situ, que são depois utilizados pelos produtores primários. As bactérias heterotróficas
convertem carbono organico em inorganico a elevadas taxas, tornando a respiração
bacteriana a maior fracção da respiração total medida na maioria dos sistemas aquáticos
(Williams, 1981). Cole e colaboradores (1988) estimaram, numa vasta extensão de
condições tróficas, que a respiração bacteriana é, no mínimo, tão grande como a do
zooplâncton, atingindo valores até 40% da respiração planctónica total.
Compreender o carácter dual da transformação e remineralização das bactérias
planctónicas em sistemas aquáticos é um paradigma central da ecologia microbiana
contemporanea (del Giorgio & Cole, 1998).
Capítulo I – Introdução geral
11
Diversidade e abundância do bacterioplankton
Desde 1970 tem-se tornado cada vez mais evidente que o bacterioplâncton contribui
significativamente para a biomassa planctónica (del Giorgio & Cole, 1998). As
propriedades físicas e químicas da coluna de água, assim como a abundância e
produtividade da comunidade bacteriana variam nos sistemas aquáticos de acordo com a
amplitude de temperaturas (di Servi et al., 1995) e profundidade da coluna de água (Pace
& Cole, 1994; Talbot et al., 1997). As bactérias são os componentes planctónicos menos
variáveis em termos de densidade total e biomassa, contribuindo cerca de 20% para a
biomassa planctónica total (Williams, 1984).
A estrutura das comunidades de fito e zooplanctónica têm sido vastamente analisadas.
No entanto, o mesmo não se verifica com as estruturas das comunidades de
bacterioplâncton e a sua dinâmica espaço-temporal (Hobbie, 1988). Esta falha no
conhecimento ecológico existe porque as bactérias não podem ser morfologicamente
identificadas e porque uma taxonomia geralmente aceite não existia ate muito
recentemente (Höfle et al., 1999). O aparecimento, na última década, dos métodos
moleculares para a taxonomia de bactérias, tornou possível uma taxonomia filogenética
valida para bactérias que permite a análise das estruturas taxonómicas das comunidades
microbianas naturais (Olsen et al., 1986; Pace et al., 1986).
Factores que afectam o crescimento do bacterioplâncton
Uma vez que, nos sistemas aquáticos, uma elevada fracção de carbono flúi através das
bactérias, o conhecimento dos factores que controlam a produção de bacterioplâncton
torna-se relevante no conhecimento do funcionamento dos ciclos biogeoquímicos e,
particularmente, na previsão da sua evolução após perturbação.
Os factores ambientais interagem na regulação da actividade de bacterioplâncton de tal
forma que, frequentemente, se torna complicado fazer a descriminação entre efeitos
individuais e avaliar a sua contribuição relativa (Pomeroy & Wiebe, 2001).
Os principais factores que regulam o crescimento bacteriano incluem diferentes
variáveis, nomeadamente: nutricionais (disponibilidade de nutrientes organicos e
Capítulo I – Introdução geral
12
inorganicos), físicos (temperatura), químicos (salinidade) e biológicos (predação e lise
viral).
4.3.1 Disponibilidade de nutrientes orgânicos e inorgânicos
O fornecimento de substratos há muito é reconhecido como um factor dominante na
regulação da abundância e produção do bacterioplâncton em sistemas aquáticos (Shiah et
al., 1999). No entanto, vários estudos têm sugerido que as forças de controlo bottom-up
podem ser dependentes do sistema e também podem variar dentro do sistema (Wiebe &
Pomeroy, 1992; Shiah & Ducklow, 1995; Shiah et al., 1999).
A forte correlação positiva, observada em estudos laboratoriais e de campo, entre a
biomassa de fitoplâncton e bacterioplâncton e a produção bacteriana sugerem que o
fitoplâncton pode ser uma força autóctone importante de substratos de crescimento para
bactérias (Williams, 1990; White et al., 1991; Panzenbock et al., 2000). O fitoplâncton
pode, directamente, fornecer matéria organica às bactérias, através da exsudação de células
saudáveis e lise de células em senescencia ou mortas (Vadstein et al., 1993; Panzenbock et
al., 2000). Fornecimentos indirectos ocorrem através de lise viral ou predação por
zooplâncton herbívoro (Peduzzi & Herndl, 1992; Strom et al., 1997; Bratbak et al., 1998;
Hasegawa et al., 2000).
As bactérias respondem a alterações na disponibilidade de matéria organica por
alternância entre níveis de actividade. Como tendência geral, aumentos nas taxas de
produção de biomassa bacteriana, actividade ectoenzimática e taxas de uptake, têm sido
amplamente observadas durante blooms de fitoplâncton (Chróst et al., 1989; Chróst, 1991;
Middelboe et al., 1995), na proximidade de fontes de POM (Tholosan et al., 1999;
Grossart & Ploug, 2001) ou ao longo de gradientes crescentes de eutrofização (Hoppe et
al., 1998).
Adições experimentais de matéria organica a comunidades de bacterioplâncton,
demonstram que as respostas não estão somente relacionadas com a concentração do
carbono organico disponível, mas também com a qualidade dos substratos. Descobriu-se
que os detritos terrestres são relativamente refractários, enquanto que materiais derivados
de algas estimulam significativamente o crescimento (Wehr et al., 1999). Os substratos

Capítulo I – Introdução geral
13
dissolvidos são mais estimulantes do que a matéria particulada de idêntica fonte (Ferrier-
Pagès et al., 2000).
A concentração de substratos inorganicos é também um factor de controlo da produção
bacteriana (Torréton et al., 2000; Ferrier-Pagès & Furla, 2001). No entanto, ainda não está
completamente esclarecido até que extensão os substratos organicos e inorganicos podem
limitar a produção de bacterioplâncton (Toolan et al., 1991). Enquanto que se tem pensado
que a disponibilidade do carbono organico é um factor chave na limitação do crescimento
bacteriano, os elevados requisitos de nutrientes inorganicos (Vadstein et al., 1988) e a
elevada percentagem de uptake detectável para as bactérias (Currie & Kalff, 1984)
sugerem que o fornecimento de nutrientes inorganicos também podem limitar a abundância
e produção bacteriana. De facto, vários estudos têm demonstrado que o crescimento
bacteriano aumenta com o aumento da disponibilidade de nutriente inorganicos (Wikner et
al., 1999; Torréton et al., 2000). Por outro lado, tem sido demonstrado que as bactérias
heterotróficas competem, com sucesso, por nutrientes inorganicos com o fitoplâncton
(Thingstad et al., 1993). Blackburn et al., (1998) demonstrou que as bactérias têm,
aproximadamente, potenciais de uptake de nutrientes 100 vezes mais rápidos que o
fitoplâncton. A baixas concentrações de nutrientes inorganicos, a vantagem competitiva do
bacterioplâncton sobre o fitoplâncton, é uma ideia consensual (Torréton et al., 2000).
4.3.2 Propriedades da água
O crescimento de bactérias em sistemas aquáticos é afectado pela temperatura in situ,
como foi concluído pelas correlações positivas geralmente encontradas entre produção
bacteriana e temperatura (Shiah & Ducklow, 1997). Tem sido demonstrado que as
diferentes temperaturas óptimas de crescimento bacteriano reflectem a amplitude de
temperaturas no local (Simon & Wunsch, 1998). Alguns estudos têm demonstrado que a
variação nas taxas de actividade bacteriana em ecossistemas eutróficos podem ser
primeiramente regulados pela temperatura, passando a disponibilidade de substratos para
um papel secundário, durante as estações frias (Shiah & Ducklow, 1995). Um efeito
indirecto importante da temperatura é que afecta a afinidade dos sistemas enzimáticos. A
baixas temperaturas, a afinidade dos sistemas enzimáticos diminui significativamente,
Capítulo I – Introdução geral
14
possibilitando a acumulação de substratos lábeis no ambiente uma vez que se tornam
menos biodisponiveis (Pomeroy & Wiebe, 2001).
4.3.3 Mortalidade através de infecção e predação
A descoberta de que a abundância de vírus livres pode exceder em 1 a 2 ordens de
magnitude o número de bactérias platónicas (Maranger & Bird, 1995; Weinbauer &
Peduzzi, 1995a), motivou a pesquisa do impacto das infecções virais nos microorganismos
aquáticos. Vários estudos, numa ampla variedade de ecossistemas aquáticos, têm indicado
que os bacteriófagos podem ser importantes no controlo do crescimento bacteriano
(Maranger & Bird, 1995; Weinbauer & Peduzzi, 1995b). Tem sido demonstrado que até
30% das bactérias planctónicas estão infectadas por vírus líticos (Fuhrman & Suttle, 1993;
Suttle, 1994). Estimativas da mortalidade bacteriana devido a lise viral, indicam que os
fagos podem ser responsáveis por 1 a 100% da mortalidade bacteriana observada
(Weinbauer & Peduzzi, 1995b; Suttle, 1994), dependendo das condições ambientais e da
estrutura da comunidade hospedeira (Wommack & Colwell, 2000).
Os vírus também podem afectar a estrutura das comunidades de bactérias uma vez que
são específicos para um hospedeiro (Wommack et al., 1999). Por outro lado, podem
influenciar a diversidade bacteriana ao nível genético, dado que podem mediar trocas
genéticas através da transducção (Miller & Sayler, 1992; Paul, 1999).
A predação tem sido reportada como um dos maiores factores de mortalidade das
comunidades bacterianas (Weisse & Muller, 1998). Os nanoflagelados heterotróficos e os
ciliados são os predadores mais importantes tanto em sistemas marinhos (Wikner et al.,
1990) como nos de água doce (Sanders et al., 1989). Vários estudos têm demonstrado que
a predação por protistas influencia a distribuição celular (Hahn & Hofle, 1998) e a
estrutura taxonómica (Hahn & Hofle, 1998; Suzuki, 1999) das comunidades de bactérias.
Capítulo I – Introdução geral
15
5. Análise por Fluorescence In Situ Hybridization
Até recentemente, os microbiólogos que estudavam bactérias aquáticas
enfrentavam um dilema: podiam ou medir a abundância, a biomassa, a taxa de
crescimento, a actividade, da “média” bacteriana em condições in situ (Fuhrman et al.,
1989; Pernthaler et al., 1998), ignorando a diversidade filogenética e fisiológica das
comunidades microbianas, ou podiam isolar e caracterizar fisiologicamente estirpes
bacterianas individuais (Shut et al., 1993; Pernthaler et al., 1998), mas depois não eram
capazes de dizer se estes microorganismos também eram comuns no ambiente. Por
conseguinte, poucos conhecimentos foram gerados sobre as variações espaciais e
temporais de abundância de grupos filogenéticos definidos e espécies bacterianas
individuais em habitats naturais.
Técnicas de biologia molecular utilizadas para identificar microorganismos em
amostras ambientais têm, recentemente, fornecido novas ferramentas para estudar a
biodiversidade do bacterioplâncton (Acinas et al., 1997; DeLong et al., 1993; Fuhrman et
al., 1988; Giovannoni et al., 1995; Hiorns et al., 1997; Pernthaler et al., 1998) e as
abundâncias de bactérias e Archaea in situ que não podiam ser, anteriormente,
adequadamente distinguidas (Alfreider et al., 1996; Amann et al., 1990; Amann et al.,
1995; Murray et al., 1998; Pernthaler et al., 1998). Agora, os microbiólogos encontram-se
em posição de esclarecer a biogeografia (Pernthaler et al., 1998), a dinâmica populacional,
e as sucessões (Pinhassi & Hagström, 1997; Pernthaler et al., 1998) não de apenas alguns
microorganisms morfologicamente distintos, mas de um grande número de espécies.
Fluorescence in situ hybridization (FISH), com sondas oligonucleotídicas dirigidas
selectivamente ao rRNA, visualiza células bacterianas com afiliações definidas
filogeneticamente (Amann et al., 1995; Amann et al., 1997; Pernthaler et al., 1998).
Ao contrário de outras abordagens de identificação, o FISH conserva grande parte da
forma dos microorganismos alvo, i.e., a sua morfologia, o tamanho celular (Ramsing et al.,
1996; Pernthaler et al., 1997; Pernthaler et al., 1998) e o conteúdo celular em rRNA (Boyle
et al., 1995; Poulsen et al., 1993; Pernthaler et al., 1998). Portanto, apesar das limitações
do método (como discutido por Amann et al., 1995), o seu potencial para a identificação e
análise microscópica de microorganismos planctónicos estão agora reconhecidos.
Capítulo I – Introdução geral
16
6. Objectivos e estrutura da tese
Devido às características inerentes aos lagos pouco profundos, este trabalho pretendeu
estudar as interacções tróficas na Lagoa da Vela. Desta forma, os objectivos primordiais do
presente estudo foram:
• Avaliar a dinâmica plantónica num lago Mediterrânico, em território Português;
• Avaliar a importância dos vírus na dinâmica bacteriana;
• Interpretar a variabilidade na composição da comunidade bacteriana, durante
um bloom de fitoplâncton, num lago pouco profundo (Lagoa da Vela);
• Analisar os parâmetros químicos e biológicos que regulam a comunidade
procariota, em diferentes fases do bloom de fitoplâncton, com especial ênfase
nas interacções entre cianobactérias e outros grupos procariotas.
A presente dissertação assenta numa estrutura dividida em capítulos, que representam
unidades com objectivos próprios, integrados no âmbito global do trabalho. Os capítulos 2
e 3 correspondem a um artigos a submeter para publicação. Por este motivo estão escritos
na língua inglesa. No 1º Capítulo, é apresentada uma Introdução geral, na qual se abordam
os principais aspectos analisados experimentalmente, à luz dos conhecimentos científicos
actuais, onde são definidos os objectivos e o âmbito do presente trabalho. O Capítulo 2
(Water column environment of a eutrophic shallow temperate lake in late spring: pelagic
communities of phytoplankton, cyanobacteria and associated heterotrophic bacteria and
viruses) avalia a dinâmica plantónica do local em estudo, bem como a importância dos
vírus na dinâmica bacteriana. A variabilidade na composição da comunidade bacteriana,
durante um bloom de fitoplâncton, assim como os parâmetros químicos e organicos que
regulam a comunidade procariota, em diferentes fases do bloom de fitoplâncton, com
especial ênfase nas interacções entre cianobactérias e outros grupos procariotas são
apresentados no Capítulo 3. A última secção da tese tenta discutir, de forma integrada e
global, os resultados obtidos.
Capítulo I – Introdução geral
17
7. Referências
Abrantes N., Pereira R. & Gonçalves F. (2006) First step for na ecological risk assessment
to evaluate the impact of diffuse pollution in Lake Vela (Portugal). Environm. Monit. and
Assessment 117: 411-431.
Acinas S.G., Rodríguez-Valera F., & Pedrós-Alió C. (1997) Spatial and temporal variation
in marine bacterioplankton diversity as shown by RFLP fingerprinting of PCR amplified
16S rDNA. FEMS Microbiol. Ecol. 24: 27-40.
Alfreider A., Pernthaler J., Amann R., Sattler B., Glöckner F.O., Wille A. & Psenner R.
(1996) Community analysis of the bacterial assemblages in the winter cover and pelagic
layers of a high mountain lake using in situ hybridization. Appl. Environ. Microbiol. 62:
2138-2144.
Amann R.I., Binder B.J., Olson R.J., Chisholm S.W., Devereux R. & Stahl D.A. (1990)
Combination of 16S rRNA-targeted oligonucleotide probes with flow cytometry for
analyzing mixed microbial populations. Appl. Environ. Microbiol. 56: 1919-1925.
Amann R.I., Ludwig W. & Schleifer K.H. (1995) Phylogenetic identification and in situ
detection of individual microbial cells without cultivation. Microbiol. Rev. 59: 143-169.
Amann R., Glöckner F. O. & Neef A. (1997) Modern methods in subsurface microbiology:
in situ identification of microorganisms with nucleic acid probes. FEMS Microbiol. Rev.
20: 191-200.
Azam F. & Hodson R.E. (1977) Size distribution and activity of marine microheterotrophs.
Limnol. Oceanogr. 22: 492-501.
Azam F. (1998) Microbial control of oceanic carbon flux: the plot thickens. Science 280:
694-696.

Capítulo I – Introdução geral
18
Bergh O., Borsheim K.Y., Bratbak G. & Heldal M. (1989) High abundance of viruses
found in aquatic environments. Nature 340: 467-468.
Blackburn N., Fenchel T. & Mitchel J. (1998) Microscale nutrients patches in planktonic
habitats shown by chemotactic bacteria. Science 282: 2254-2256.
Blanco S., Romo S., Villena M.J. & Martínez S. (2003) Fish communities and food web
interactions in some shallow Mediterranean lakes. Hydrobiologia 506: 473-480.
Boyle M., Ahl T. & Molin S. (1995) Application of a strain-specific rRNA oligonucleotide
probe targeting Pseudomonas fluorescens Ag1 in a mesocosm study of bacterial release
into the environment. Appl. Environ. Microbiol. 61: 1384-1390.
Bratbak G., Jacobsen A. & Heldal M. (1998) Viral lysis of Phaeocystis pouchetii and
bacterial secondary production. Aquat. Microb. Ecol. 16: 11-16.
Brooks J.L. & Dodson S.I. (1965) Predation, body size and composition of plankton.
Science 150: 28-35.
Brönmark C. & Hansson L.A. (1998) The Biology of Lakes and Pounds. Oxford
University Press, Oxford, p.304.
Chattopadhyay J., Sarkar R.R. & Pal S. (2003) Dynamics of nutrients-phytoplankton
interaction in the presence of viral infection. BioSystems 68: 5-17.
Chróst R.J., Münster U., Rai H., Albrecht D., Witzel K. & Overbeck, J. (1989)
Photosynthetic production and exoenzymatic degradation of organic matter in the euphotic
zone of an eutrophic lake. J. Plankton Res. 11: 223-242.
Chróst R.J. (1991) Environmental control of the synthesis and activity of ectoenzymes. In:
Microbial enzymes in aquatic environments. Chróst R.J. (Ed.), Springer-Verlag, New
York, p. 29-59.

Capítulo I – Introdução geral
19
Cole J.J., Findlay S. & Pace M.L. (1988) Bacterial production in fresh and saltwater
ecosystems: a cross-system overview. Mar. Ecol.Prog. Ser. 43: 1-10.
Currie D. & Kalff J. (1984) The relative importance of bacterioplankton and phytoplankton
in phosphorus uptake in freshwater. Limnol. Oceanogr. 29: 311-321.
de Figueiredo D.R., Reboleira A.S.S.P., Antunes S.C., Abrantes N., Azeiteiro U.,
Gonçalves F. & Pereira M.J. (2006) The effect of environmental parameters and
cyanobacterial blooms on phytoplankton dynamics of a Portuguese temperate lake.
Hydrobiologia 568: 145-157.
DeLong E.F., Franks D.G., & Alldredge A.L. (1993) Phylogenetic diversity of aggregate-
attached vs. free-living marine bacterial assemblages. Limnol. Oceanogr. 38: 924-934.
Del Giorgio P.A. & Cole J.J. (1998) Bacterial growth efficiency in natural aquatic systems.
Annu. Rev. Ecol. Syst. 29: 503-541.
di Servi M.A., Mariazzi A.A. & Donadelli J.L. (1995) Bacterioplankton and phytoplankton
production in a large Patagonian reservoir (Republic Argentina) Hydrobiologia 297: 123-
129.
Ferrier-Pagès C., Leclercq N., Jaubert J. & Pelegri S.P. (2000) Enhancement of pico and
nanoplankton growth by coral exudates. Aquat. Microb. Ecol. 89: 147-153.
Ferrier-Pagès C. & Furla P. (2001) Pico and nanoplankton biomass and production in the
two largest atoll lagoons of French Polynesia. Mar. Ecol. Prog. Ser. 211: 63-76.
Fuhrman J.A., Comeau D.E, Hagström A. & Chan A.M. (1988) Extraction from natural
planktonic microorganisms of DNA suitable for molecular biological studies. Appl. and
Environ. Microbiol. 54: 1426-1429.

Capítulo I – Introdução geral
20
Fuhrman J.A., Sleeter T.D., Carlson C.A & Proctor L.M. (1989) Dominance of bacterial
biomass in the Sargasso Sea and its ecological implications. Mar. Ecol. Prog. Ser. 57: 207-
217.
Fuhrman J.A. & Suttle C.A. (1993) Viruses in marine planktonic systems. Oceanography
6: 51-63.
Giovannoni S.J., Mullins T.D. & Field K. G. (1995) Microbial diversity in oceanic
systems: rRNA approaches to the study of unculturable microbes. NATO ASI (Adv. Sci.
Inst.) Ser. Ser. G Ecol. Sci. 38: 217-248.
Grossart H.P. & Ploug H. (2001) Microbial degradation of organic carbon and nitrogen on
diatom aggregates. Limnol. and Oceanogr. 46: 267-277.
Gyllstrom M., Hansson L.A., Jeppesen E., García-Criado F., Gross E., Irvine K., Kairesalo
T., Kornijow R., Miracle M.R., Nykanen M., Nõges T., Romo S., Stephen D., van Donk E.
& Moss B. (2005) The role of climate in shaping zooplankton communities of shallow
lakes. Limnol. and Oceanog. 50: 2008-2021.
Hahn M.W. & Hofle M.G. (1998) Grazing pressure by a bacterivorous flagellate reverses
the relative abundance of Comamonas acidovorans PX54 and Vibrio strain CB5 in
chemostat cocultures. Appl. Environ. Microbiol. 64: 1910-1918.
Hall D.J., Threlkeld S.T., Burns C.W. & Crowley P.H. (1976) The size-efficiency
hypothesis and the size structure of zooplankton communities. Annual Review of Ecology
and Systematics 7: 177-208.
Hasegawa T., Koike I. & Mukai H. (2000) Estimation of dissolved organic nitrogen release
by micrograzers in natural planktonic assemblages. Plankton Biol. Ecol. 47: 23-30.
Capítulo I – Introdução geral
21
Hiorns W.D., Methé B.A., Nierzwicki-Bauer S.A. & Zehr J.P. (1997) Bacterial diversity in
Adirondack mountain lakes as revealed by 16S rRNA gene sequences. Appl. and Environ.
Microbiol. 63: 2957-2960
Hobbie J.E. (1988) A comparison of the ecology of planktonic bacteria in fresh and salt
water. Limnol. Oceanogr. 33: 750-768.
Höfle M.G., Haas H. & Dominik K. (1999) Seasonal Dynamics of Bacterioplankton
Community Structure in a Eutrophic Lake as Determined by 5S rRNA Analysis. Appl. and
Environm. Microbiol. 65: 3164-3174.
Hoppe H.G., Giesenhagen H.C. & Gcke K. (1998) Changing patterns of bacterial substract
decomposition in a Eutrophication gradient. Aquat. Microb. Ecol. 15: 1-13.
Madigan M., Martinko J. and Parker J. (2000) Brock, Biology of Microorganisms; 9th Ed.
Prentice Hall, Inc., Upper Saddle River, New Jersey. 991 pp.
Maranger R. & Bird D. (1995) Viral abundance in aquatic systems: a comparison between
marine and freshwaters. Mar. Ecol. Prog. Ser. 121: 217-226.
Middelboe M., Søndergaard M., Letarte Y. & Borch N.H. (1995) Attached and free-living
bacteria: production and polymer hydrolysis during a diatom bloom. Microb. Ecol. 14: 81-
90.
Miller R.V. & Sayler G.S. (1992) Bacteriophage-host interactions in aquatic systems. In:
Wellington E.M., van Elsas J.D. (Eds.), Genetic interactions among microorganisms in the
natural environment. Pergamon Press, New York, p. 176-193.
Murray A.E., Preston C.M., Massana R., Taylor L.T., Blakis A., Wu K. & DeLong E.F.
(1998) Seasonal and spatial variability of bacterial and archaeal assemblages in the coastal
waters near Anvers Island, Antarctica. Appl. and Environ. Microbiol. 64: 2585-2595.
Capítulo I – Introdução geral
22
Moss B. (1998) Ecology of freshwaters. 3rd ed. Blackwell Science Oxford, p. 572.
Olsen G.J., Lane D.J., Giovannoni S.J. & Pace N.R. (1986) Microbial ecology and
evolution: a ribosomal RNA approach. Annu. Rev. Microbiol. 40: 337-365.
Pace N.R., Stahl D.A., Lane D.J. & Olsen G.J. (1986) The analysis of natural microbial
populations by ribosomal RNA sequences. Adv. Microb. Ecol. 8: 1-55.
Pace N.R. & Cole J.J (1994) Comparative and experimental approaches to top-down and
bottom-up regulation of bacteria. Mirob. Ecol. 28: 181-193.
Paine R.T. (1980) Food webs: linkage interaction strength and community infra-structure.
Journal of Animal Ecology 49: 667-685.
Panzenbock M., Mobes-Hansen B., Albert R. & Herndl G. (2000) Dynamics of phyto- and
bacterioplankton in a high Artic lake on Franz Joseph Land archipelago. Aquat. Microb.
Ecol. 21: 265-273.
Paul J.H. (1999) Microbial gene transfer: an ecological perspective. J. Microbiol.
Biothecnol. 1: 45-50.
Peduzzi P. & Herndl G.J. (1992) Zooplankton activity fuelling the microbial loop:
differential growth response of bacteria from oligo- and eutrophic waters. Limnol.
Oceanogr. 37: 1087-1092.
Peduzzi P. & Weinbauer M.G. (1993) The submicron size fraction of sea water containing
high numbers of virus particles as bioactive agent in unicellular plankton community
successions. J. Plankton. Res. 15: 1375-1386.
Pernthaler J., Alfreider A., Posch T., Andreatta S., & Psenner R. (1997) In situ
classification and image cytometry of pelagic bacteria from a high mountain lake
(Gossenköllesee, Austria). Appl. and Environ. Microbiol. 63: 4778-4783.

Capítulo I – Introdução geral
23
Pernthaler J., Glöckner F., Unterholzner S., Alfreider A., Psenner R. & Amann R. (1998)
Sasonal community and population dynamics of pelagic bacteria and archaea in a high
mountain lake. Appl. and Environ. Microbiol. 64: 4299-4306.
Pinhassi J. & Hagström A. (1997) Dominant marine bacterioplankton species found among
colony-forming bacteria. Appl. and Environ. Microbiol. 63: 3359-3366.
Pomeroy L.R. (1991) Status and future needs in protozoan ecology. In: Reid P.C., Turley
C.M. & Burkhill P.H. (Ed), Protozoan and their role in marine processes, NATO ASI
Series G: Ecological Sciences, Vol 25, Springer-Verlag, Heidelberg, p. 475-492.
Pomeroy L.R. & Wiebe W.J. (2001) Temperature and substract as interactive limiting
factors for marine heterotrophic bacteria. Aquat. Microb. Ecol. 23: 187-204.
Poulsen L.K., Ballard G. & Stahl D.A. (1993) Use of rRNA fluorescence in situ
hybridization for measuring the activity of single cells in young and established biofilms.
Appl. and Environ. Microbiol. 59: 1354-1360.
Ramsing N.B., Fossing H., Ferdelman T.G., Andersen F. & Thamdrup B. (1996)
Distribution of bacterial populations in a stratified fjord (Marianger Fjord, Denmark)
quantified by in situ hybridization and related to chemical gradients in the water column.
Appl. and Environ. Microbiol. 62: 1391-1404.
Reisser W. (1993) Viruses and virus like particles of freshwater and marine eukaryotic
algae: a review. Arch. Protistenkd. 143: 257-265.
Riemann B. & Sondergaard M. (1986) Regulation of bacterial secondary production in two
eutrophic lakes and in experimental enclosures. J. Plankton Res. 8: 519-536.

Capítulo I – Introdução geral
24
Sanders R.W. Porter K.G. Bennett S.J. & DeBaise A.E. (1989) Seasonal patterns of
bacterivory by flagellates, ciliates rotifers and cladocerans in a freshwater planktonic
community. Limnol. and Oceanogr. 34: 673-687.
Sherr E. & Sherr B. (1988) Role of microbes in pelagic food webs: A revised concept.
Limnol. and Oceanogr. 33: 1225-1227.
Shiah F.K. & Ducklow H.W. (1995) Multiscale variability in bacterioplankton abundance
production and specific growth rate in a temperate salt-marsh tidal creek. Limnol. and
Oceanogr. 40: 55-56.
Shiah F.K. & Ducklow H.W. (1997) Bacterioplankton growth response to temperature and
variations in estuaries measured by thymidine:leucine incorporation rate. Aquat. Microb.
Ecol. 13: 151-159.
Shiah F.K., Liu K. & Gong G. (1999) Temperature versus substrate limitation of
heterotrophic bacterioplankton production across trophic and temperature gradients in the
east China Sea. Aquat. Microb. Ecol. 17: 247-254.
Shut F., de Vries E.J., Gotschal J.C., Robertsen B.R., Harder W., Prins R.A., and Button
D.K. (1993) Isolation of typical marine bacteria by dilution culture: growth, maintenance,
and characteristics of isolates under laboratory conditions. Appl. and Environ. Microbiol.
59: 2150-2160.
Simon M. & Wunsch C. (1998) Temperature control of bacterioplankton growth in a
temperate large lake. Aquat. Microb. Ecol. 16: 119-130.
Smayda T. (1997) Harmful algal blooms: their ecophysiology and general relevance to
phytoplankton blooms in the sea. Limnology and Oceanography 42: 1137-1153.
Solé J., Estrada M. & Garcia-Ladona E. (2006) Biological controlo of harmful algal
blooms: A modelling study. Journal of Mar. Syst. 33: 73-88.

Capítulo I – Introdução geral
25
Strom S.L., Benner R., Ziegler S. & Dagg M.J. (1997) Planktonic grazers are a potentially
important source of marine dissolved organic carbon. Limnol Oceanogr. 42: 1367-1374.
Suttle C., Charm A. & Cottrell M. (1990) Infection of phytoplankton by viruses and
reduction of primary productivity. Nature 347: 467-469.
Suttle C.A. & Chan A.M. (1993) Marine cyanophages infecting oceanic and coastal strains
of Synechococcus: abundance, morphology, cross-infectivity and growth characteristics.
Mar. Ecol. Prog. Ser. 92: 99-109.
Suttle C.A. (1994) The significance of virus to mortality in aquatic microbial communities.
Microb. Ecol. 28: 237-243.
Suzuki M.T. (1999) Effect of protistan bacterivory on coastal bacterioplankton diversity.
Aquat. Microb. Ecol. 20: 261-272.
Talbot V., Giuliano L., Bruni V. & Bianchi M (1997) Bacterial abundance, production and
ectoproteolytic activity in the Strait of Magellan. Mar. Ecol. Prog. Ser. 154: 293-302.
Tarutani K., Nagasaki K. & Yamaguchi M. (2000) Viral impacts on total abundance and
clonal composition of the harmful bloom-forming phytoplankton Heterosigma akashiwo.
Appl. and Environ. Microbial. 66: 4916-4920.
Thingstad T.F., Skjoldal E.F. & Bohne R.F. (1993) Phosphorus cycling and algal-bacterial
competition in Sandsfjord, western Norway. Mar. Ecol. Prog. Ser. 99: 239-259.
Tholosan O., Lamy F., Garcin J., Polychronaki T. & Bianchi A. (1999) Biphasic
extracellular proteolytic enzyme activity in benthic water and sediment in the northwestern
Mediterranean Sea. Appl. Environ. Microbial. 65: 1619-1626.
Capítulo I – Introdução geral
26
Toolan T., Wehr J.D. & Findlay S. (1991) Inorganic phosphorus stimulation of
bacterioplankton production in a mesoeutrophic lake. Appl. Environ. Microbiol. 57: 2074-
2078.
Torréton J.P., Talbot V. & Garcia N. (2000) Nutrient stimulation of bacterioplankton
growth in Tuamotu atoll lagoons. Aquat. Microb. Ecol. 21: 125-137.
Vadstein O., Jense A., Olsen Y. & Reinertson H. (1988) Growth and phosphorus status of
limnetic phytoplankton and bacteria. Limnol. Oceanogr. 33: 489-503.
Vadstein O., Olsen Y. & Reinestsem H. (1993) The role of planktonic bacteria in
phosphorus cycling in lakes-sink and link. Limnol. Oceanogr. 38: 1539-1544.
van Etten J.L., Lane L.C. & Meints R.H. (1991) Viruses and virus like particles of
eukaryotic algae. Microbiol. Rev. 55: 586-620.
Wehr J.D., Petersen J. & Findlay S. (1999) Influence of three contrasting detrital carbon
sources on planktonic metabolism in a mesotrophic lake. Microb. Ecol. 37: 23-35.
Weinbauer M. & Peduzzi P (1995a) Effect of virus-rich high molecular weigh concentrates
of seawater on dynamics of dissolved amino acids and carbohydrates. Mar. Ecol. Prog.
Ser. 127: 245-253.
Weinbauer M. & Peduzzi P (1995b) Significance of virus versus heterotrophic
nanoflagellates for controlling bacterial abundance in the northern Adriatic Sea. J.
Plankton Res. 17: 1851-1856.
Weisse T. & Muller H. (1998) Planktonic protozoa and the microbial food web in Lake
Constance. Arch. Hydrobiol. Spec. Issues Adv. Limnol. 53: 223-254.

Capítulo I – Introdução geral
27
White P.A., Kalff J., Rasmussen B. & Galson J.M. (1991) The effect of temperature and
algal biomass on bacterial production and specific growth rate in freshwater and marine
habitats. Microb. Ecol. 21: 99-118.
Wiebe W.M. & Pomeroy L.R. (1992) Bacterial growth in the cold: Evidence for an
enhanced substract requirement. Appl. and Environ. Microbiol. 58: 359-364.
Wikner J., Rassoulzadegan F. & Hagstrom A. (1990) Periodic bacterivore activity balances
bacterial growth in the marine environment. Limnol. Oceangr. 35: 313-324.
Wikner J., Cuadros R. & Jansson M. (1999) Differences in consumption of allochthonous
DOC under limnic and estuarine conditions. Aquat. Microb. Ecol. 17: 289-299.
Williams P.J. (1981) Incorporation of microheterotrophic processes into the classical
paradigm of the planktonic food web. Kieler Meeresforsch 5: 1-28.
Williams P.J. (1990) The importance of losses during microbial growth: commentary on
the physiology, measurement and ecology of the release of dissolved organic material.
Mar. Microb. Food Webs 4: 175-206.
Williams P.J. LeB. (1984) Bacterial production in the bacterial food webs: the emperor’s
new suite of clothes? In: Flows of energy and materials in marine ecosystems. Fasham
M.J.R. (Ed.) Plenum Press Corporation, New York, p. 271-299.
Wommack K.E., Ravel J., Hill R.T., Chun J. & Colwell R.R. (1999) Population dynamics
of Chesapeake Bay virioplancton: total-community analysis by pulse-field gel
electrophoreseis. Appl. Environ. Microbiol. 65: 231-240.
Wommack K.E. & Colwell R.R. (2000) Virioplankton: viruses in aquatic ecosystems.
Microbial. Mol. Biol. Rev. 64: 69-114.

Capítulo I – Introdução geral
28

Capítulo II
Water column environment of a eutrophic shallow
temperate lake in late spring: pelagic communities
of phytoplankton, cyanobacteria and associated
heterotrophic bacteria and viruses
Capítulo II – Water column environment of a eutrophic shallow temperate lake in late spring: pelagic communities of phytoplankton, cyanobacteria and associated heterotrophic bacteria and viruses
30
Water column environment of a eutrophic shallow temperate lake in spring:
pelagic communities of phytoplankton, cyanobacteria and associated
heterotrophic bacteria and viruses
Lopes, A.R., 1 Azeiteiro, U.M., 3, 4 Bessa V.S., 1 Pereira, C., 1 Almeida, A., 2 Cunha, M.A. 2
& Pereira, M.J. 2
1 Biology Department, University of Aveiro, Campus de Santiago, 3810-193 Aveiro, Portugal
2 CESAM, Biology Department, University of Aveiro, Campus de Santiago, 3810-193 Aveiro, Portugal
3 IMAR – CIC Institute of Marine Research, University of Coimbra, 3004-517 Coimbra, Portugal
4 Universidade Aberta, 4200-055, Porto, Portugal
Corresponding author: Prof Ulisses M Azeiteiro [email protected]
“This paper has not been submitted elsewhere in identical or similar form, nor will it be during the first three months after submission to Hydrobiologia.”
Capítulo II – Water column environment of a eutrophic shallow temperate lake in late spring: pelagic communities of phytoplankton, cyanobacteria and associated heterotrophic bacteria and viruses
31
Abstract: The high viral counts reported in aquatic systems suggest that viral infection may
be an important factor controlling bacterial populations in natural waters. In order to test
the importance of viruses on bacterial dynamics, we have taken advantage of the spring
phytoplankton bloom, which occurs regularly in the shallow freshwater Vela Lake, causing
large natural fluctuations in the density of pelagic viruses and bacteria. Viral particles
were counted by epifluorescence microscopy after staining with SYBR gold. Total
bacterial number was determined by epifluorescence microscopy after staining with
acridine orange. Phytoplankton composition, viral and bacterial densities were determined
every second day between April and June of 2006 in surface water samples (32 samples).
The concentration of viruses through the spring bloom decrease from 2 x 10¹² viruses L-1
after the Chlorophyta bloom to 5 x 10¹⁰ viruses L-1 during the peak of Cyanobacteria, with
a mean of 2 x 10¹¹ viruses L-1. Bacterial numbers followed the same pattern of variation,
decreasing during the bloom from 3.3 x 10¹¹ cells L-1 to 1.1 x 10¹¹ cells L-1 with a mean of
1.6 x 10¹¹ cells L-1. Although viruses counts were, on average, higher than bacterial counts,
yielding mean virus-to-bacterium ratio of 1.4 (range 0.3 to 5.7), the virus-to-bacterium
ratio was frequently low, showing values below 1 in 57 % of the cases. The same pattern
of variation of viruses and bacteria during the phytoplankton bloom as well as the
significant correlation between viruses and bacteria (p 0.05) suggest that a significant
fraction of viruses are bacteriophages. However, the frequent low viruses-to-bacteria ratios
seem to indicate that during a bloom a large fraction of planktonic viruses results from
phytoplankton cells infection.
Keywords: shallow lake, eutrophication, phytoplankton dynamics, environmental
parameters, virioplankton, bacterioplankton
Capítulo II – Water column environment of a eutrophic shallow temperate lake in late spring: pelagic communities of phytoplankton, cyanobacteria and associated heterotrophic bacteria and viruses
32
Introduction
Many ecosystems that are impacted by nutrients are shallow, and in contrast to deep
plankton-dominated ecosystems they are capable of supporting a variety of autotrophs.
These autotrophs compete for nutrients, light, and space, and have other complex
ecological interactions that may influence how the ecosystem as a whole responds to
nutrient stress (Havens et al. 2001). Environmental conditions such as increased
temperatures and pH, low turbulence and enhanced nutrient loading, stimulate the
development of planktonic cyanobacteria in lakes, leading to the formation of blooms (de
Figueiredo et al. 2004a) by the bloom-forming genera including Anabaena,
Aphanizomenon and Microcystis (Simis et al. 2005; de Figueiredo et al. 2006).
Cyanobacterial-microbial associations occur during both active growth and senescent
phases of bloom cyanobacteria. These interactions may lead to parallel optimization of
growth and bloom potentials among microbial epiphytes and cyanobacterial hosts acting as
consortia, and may also reflect mutually beneficial physiological and ecological
adaptations and exchange processes allowing cyanobacteria to periodically dominate
planktonic communities (de Figueiredo et al. 2006). Microalgae are known to produce a
variety of composts that are referred in the collective as secondary metabolites. This
substances are diverse in there chemical structure and physiological function (Skulberg
2000), namely antibiotics (Piccardi et al. 2000) and antibacterial (Jaki et al. 1999;
Østensvik et al. 1998), antiviral (Hayashi & Hayashi 1996; Mundt et al. 2001; Nowotny et
al. 1997), antialgal (Kodani et al. 2002; Volk 2005), enzyme inhibitors (Doan et al. 2000;
Kós et al. 1995; Matsuda et al. 1996; Mundt et al. 2001; Murakami et al. 1995; Sano et al.
2005) and stimulators of enzymes involved in the degradation of reactive aerobic species
activity (peroxidase; glutathione S- transferase; catalase) (Mitrovic et al. 2004;

Capítulo II – Water column environment of a eutrophic shallow temperate lake in late spring: pelagic communities of phytoplankton, cyanobacteria and associated heterotrophic bacteria and viruses
33
Pflugmacher et al. 1999). These substances produced by cyanobacteria, influence their
aquatic environment reducing the number of virus, bacteria and other microorganims
(Mundt et al. 2001).
There is a lack of recently published information concerning planktonic dynamics in
Mediterranean lakes, especially in Portuguese territory where there is a strong climatic
influence from the Atlantic Ocean. Lake Vela is a polymictic shallow lake exhibiting some
characteristics typical of an advanced trophic state, namely, the permanently turbid water,
the reduction in biodiversity, and the recurrent occurrence of Cyanobacteria blooms
(Abrantes et al. 2006; de Figueiredo et al. 2006). For Vela Lake the works of Antunes et al.
(2003), Abrantes et al. (2006) and de Figueiredo et al. (2006), establish that the
phytoplankton assemblages are highly correlated with temperature and nutrient
concentrations (particularly phosphorus); Chlorophytes dominate in early spring and
cyanobacteria from early spring until the beginning of autumn (low nutrient levels, along
with high temperatures).
New techniques of enumeration have shown that viruses are abundant in marine
and freshwaters. As summarized by Wommack & Colwell (2000), the abundance of
viruses ranged from <104 to >108 ml-1 in the studied aquatic systems. Recent estimates
reveal ca 1010 viruses per litre which are far higher than previous estimates (Bergh et al.
1989; Maranger & Bird 1995; Fuhrman 1999; Wommack & Colwell 2000; Zhang 2002;
Liu et al. 2006). They can regulate biomass production, species diversity, population
dynamics and community structure in the aquatic microbial communities, influence carbon
and nutrient recycling in food chain and water environment, and even have implications on
the global climate (Bergh et al. 1989; Fuhrman 1999; Bratbak & Heldal 2000; Bettarel et
al. 2004). The high viral counts reported in aquatic systems (Liu et al. 2006) suggest that
viral infection may be an important factor controlling bacterial populations in natural

Capítulo II – Water column environment of a eutrophic shallow temperate lake in late spring: pelagic communities of phytoplankton, cyanobacteria and associated heterotrophic bacteria and viruses
34
waters, and can match grazing by protists as a source of mortality for bacteria (Weinbauer
et al. 2003).
Since the ecological significance of virioplankton in aquatic ecosystems must be
realized by their interaction with the hosts (e.g. bacteria, cyanobacteria and algae),
enumeration of viruses and their hosts in water samples is an important first step
elucidating the virus-host interaction. In order to test the importance of viruses on bacterial
dynamics, we have taken advantage of the spring phytoplankton bloom, which occurs
regularly in the shallow freshwater Vela Lake.
Materials and Methods
Studied area and sampling
Vela Lake (44º58’N, 5º18’W) is a shallow eutrophied freshwater body (mean depth = 0.9
m, maximum depth = 2.4 m, with 70 ha of floodable surface area and a total volume of 70
× 104 m3) (Abrantes et al. 2006; de Figueiredo et al. 2006) located in Quiaios (Figueira da
Foz, Central Portugal). The water volume is predominantly influenced by the variation of
groundwater levels and rainfall, which makes the lake very susceptible to drought during
summer months. This lake is classified as eutrophic since 1960 (Nauwerck 1960), showing
high N and P levels typical of eutrophic systems (Antunes et al. 2003). The increase of
phytoplankton biomass, with the presence of algal blooms, the depletion of submerged
macrophytes, the increase in turbidity, and a subsequent reduction in biodiversity are some
of the characteristics associated with the eutrophication process in Lake Vela (de
Figueiredo et al. 2006). The organic matter and nutrient inputs come mainly from human
activities (such as agriculture and modification of land) in surrounding areas. Antunes et al.
(2003) has reported an increase of the nutrient levels during the last decade.
Capítulo II – Water column environment of a eutrophic shallow temperate lake in late spring: pelagic communities of phytoplankton, cyanobacteria and associated heterotrophic bacteria and viruses
35
The study started at April 18th and ended at June 19th of 2006 (during the spring
period). Samples were collected every two days (32 samples). Dissolved oxygen (O2 mg.L-
1 and O2%), conductivity, water, air temperature and pH were determined in situ (WTW
multiliner P4).
The samples were collected just bellow the water surface; a 1,5 L plastic bottle and a
1L glass bottle with Lugol (1% v/v) were used: the content of the first was filtered and
used for the determination of chemical parameters (phosphates, nitrates and ammonia),
organic mater (total and volatile solids) and chlorophyll a in the laboratory; and the
second, was used for the phytoplankton analyses. A sterile analyses flask was also filled
with water for bacterial analyses. Glutaraldehyfe-fixed samples for virus and bacteria
enumeration were also collected. Sampling occurred always in the same location and
during the morning period (10±2h).
The samples were maintained in the obscurity and processed after an hour, in the
laboratory. The processing consisted in the sample filtration using Whatman GF/C filters,
the filters used for the evaluation of organic material were previously dried at 103ºC until
they obtain a constant weight (APHA 1992). After the processing, the filtered water was
used for determination of chemical parameters and the filters were used for determination
of chlorophyll a and organic matter (which were conserved a -20ºC).
Environmental parameters and chlorophyll a
Phosphate, nitrate and ammonia concentrations were determined spectrophotometrically
(Genesys 6 Thermo spectronic): phosphate was assayed using the stannous chloride
method, described in APHA (1992); nitrate was determined applying the sodium salicilate
Capítulo II – Water column environment of a eutrophic shallow temperate lake in late spring: pelagic communities of phytoplankton, cyanobacteria and associated heterotrophic bacteria and viruses
36
method described in Rodier (1984) and ammonia was quantified as described by Hall &
Lucas (1981).
Quantification of organic matter (total and volatile solids) was made as described in
APHA (1992). Chlorophyll a was determined after maceration and extraction with acetone
90%, overnight at 4ºC, centrifugation at 3000rpm during 10min, as described by Lorenzen
(1967).
Phytoplankton diversity and abundance
For the phytoplankton quantification, samples were fixed with (1% v/v) Lugol and the
enumeration was done in agreement with Lund et al. (1958). During enumeration, were
considered as unit: colony for colonial organisms; filament for filamentous organisms and
cell for unicellular organisms.
The more important groups in this study were: Chlorophyta; Cryptophyta; Cyanoprokariota
and Euglenophyta, because of their predominance (diatoms were rare, not only in terms of
species number, but also in terms of abundance and were not identified and quantified).
The identification of phytoplankton species, belonging to these groups, was made by
observation through a light microscope using different references for: Chlorophyta
(Chlorococcales) (Komárek & Fott 1983); Cryptophyta (Fott 1968); Cyanoprokaryota
(Geitler 1932; Komárek & Anagnostidis 1989; Komárek & Anagnostidis 1999) and
Euglenophyta (Huber-Pertolozi 1961).
Evaluation and characterization of bacterial dynamics
Total bacterial number was determined by epifluorescence microscopy after staining with
acridine orange (Hobbie et al. 1977).
Heterotrophic aerobic bacteria quantification was done by pour plate using Tryptic Soy
Agar (TSA) as culture medium, with 96h incubation at 25 ºC (P selecta, Hotcold - M);
Capítulo II – Water column environment of a eutrophic shallow temperate lake in late spring: pelagic communities of phytoplankton, cyanobacteria and associated heterotrophic bacteria and viruses
37
isolation was done by streak-plate technique. The isolated strains have grown in 10mL
TSB (Tryptic Soy Broth), overnight at 37ºC and with a rotation of 100rpm (Sanyo orbital
incubation – orbisafe Tsnetwise). After this period, 6mL of the inoculum was transferred
for a new recipient, at which was added 3mL of glycerol 45% (v/v). After this, 5 aliquots
(1mL) of the mixture were transferred to a new sterile eppendorf and conserved at -80ºC
(Sanyo ultra low temperature freezer, MDF 382AT) (for a primary characterization of the
isolated bacteria gram stain, catalase and oxidase tests have been performed: they were
Gram negative, catalase and oxydase positive and had mobility by polar flagella) (Rodier
1984).
Evaluation and characterization of viral dynamics
Viral particles were counted by epifluorescence microscopy after staining with SYBR
gold.
Statistical analysis
A canonical correspondence analysis or CCA (Ter Braak 1995) was used to ascertain the
relationships between phytoplankton, bacteria, virus and environmental variables along the
study period. CCA extracts synthetic gradients from the biotic and environmental matrices
and the explanatory variables are quantitatively represented by arrows in graphical biplots.
The arrow direction indicates positive or negative correlations and their length is relative to
the importance of the explanatory variable in the ordination. A Monte Carlo permutation
test was used to assess the significance of the relationships between the biotic data and the
explanatory variables.

Capítulo II – Water column environment of a eutrophic shallow temperate lake in late spring: pelagic communities of phytoplankton, cyanobacteria and associated heterotrophic bacteria and viruses
38
Results
Environmental parameters
During the sampling period water temperature showed a minimum of 17.2 ºC and a
maximum value of 27.5 ºC, with an average value of 22.5±2.4 ºC. Water conductivity
ranged between 566 and 641 µS cm-1, and an average value of 606±21 µS cm-1. pH values
ranged between 7.75 and 9.82 during the sampling period. Dissolved O2 showed a
minimum of 4.75 mg l-1 and 58.4% and a maximum of 13.7 mg l-1 and 173.3% (Table 1).
The higher values obtained for pH and dissolved O2 were measured in the same day (5th of
June of 2006).
Chlorophyll a concentration ranged between 0.005 and 0.098 µg l-1 with an average
value of 0.035±0.028 µg l-1. Total solids ranged between 12.700 and 52.900 mg l-1 and
volatile solids showed a minimum value of 12.700 and a maximum value of 47.900 mg l-1;
the average values were 28.624±12.453 mg l-1 and 27.384±11.220 mg. l-1, respectively
(Table 1).
NH4+ concentration ranged between 0.002 and 0.131 mgN l-1. NO3
- ranged between
0.004 and 0.017 mgN l-1, with an average value of 0.008±0.003 mgN l-1. Phosphate
concentration (detection level: 0.003 mg l-1) reached a maximum of 0.009 mg l-1, during a
very rainy period (≤ 0,003 mg l-1) (Table 1).
Phytoplankton
The more representative taxa were Chlorophyta and Cyanoprokariota, while the
Cryptophyta and Euglenophyta were less representative, i.e., had a lower frequency and
number of effectives (Fig. 1).

Capítulo II – Water column environment of a eutrophic shallow temperate lake in late spring: pelagic communities of phytoplankton, cyanobacteria and associated heterotrophic bacteria and viruses
39
It was observed that Euglenophyta had the lowest expression, during the studied period.
However, between May 26th and June 19th of 2006, its expression was higher, showing the
higher percentage in May 28th (1643 cells ml-1), due to the species Euglena viridis (1559
cells ml-1) and in 5 June (1348 cells ml-1), due to the genus Trachelomonas (T. nigra; T.
stoweri; T. volvocina) (337 cells ml-1). Although Cryptophyta “division” had a lower
expression than the Chlorophyta and Cyanobacteria, it was always represented during the
sampling period; the exception occurred between May 26th and June 7th. The major
abundance due to Cryptomonas sp. was observed during these days: April 20th (1067 cells
ml-1) and June 11th and 17th (1685 and 1541 cells ml-1, respectively).
It is also visible that Chlorophyta division was more abundant during the initial period.
Then there was a shift in the dominant division, leading to Cyanoprokariota dominance.
This variation occurred as the water temperature, conductivity, pH and dissolved oxygen
were getting higher.
During the sampling period, it was observed a great diversity in species and their
abundance within Chlorophyta. The species that during this period contributed for this
group abundance, belong to the following genera: Phacotus (Phacotus lenticularis)
Coelastrum, (Coelastrum pseudomicroporum and Coelastrum reticulatum) Pediastrum
(Pediastrum boryanum, Pediastrum duplex, Pediastrum simplex and Pediastrum tetras)
Scenedesmus (Scenedesmus acuminatus, Scenedesmus acutus and Scenedesmus oaauensis)
and Tetraedron (Tetraedron caudatum and Tetraedron minimum). The higher values
observed between the April 18th and 24th of 2006 occurred due to a bloom of Scenedesmus
spp., being the maximum observed in April 20th (27079 CU ml-1). A new increase was
observed in May 22nd (10322 CU ml-1), with Pediastrum spp., Tetraedron spp. and a still
higher number of Scenedesmus spp.. In June 3rd was observed a new peak (17522 CU ml-1)
due to a Tetraedron spp. bloom (8199 cells ml-1). Species from the Coelastrum genera
Capítulo II – Water column environment of a eutrophic shallow temperate lake in late spring: pelagic communities of phytoplankton, cyanobacteria and associated heterotrophic bacteria and viruses
40
have been always present during the studied period; its higher expression occurred between
April 22nd and 28th of 2006 with a maximum in April 26th (506 CU ml-1) and between the
June 3rd and 13th of 2006, where the highest value was obtained in June 9th (337 CU ml-1)
(Fig. 1c). In figure 1 is possible to observe that, although Cyanobacteria division had
always an elevated cellular concentration, it only became dominant after April 20th of
2006. This shift followed a decrease in total cellular concentration of Chlorophyta and an
increase in cellular concentration of cyanobacteria species Aphanizomenon flos-aquae.
During the sampling period, there were two cyanobacterial species that have been present
since the beginning of the study (Microcystis cf. pulveria and Chroococcus limneticcus),
being the responsible for the elevated cellular level observed. After the 19th sample (May
24th of 2006), the observed pattern for this group follows the bloom-forming filamentous
cyanobacteria (Aphanizomenon flos-aquae), detectable between May 22nd and June 19th of
2006, with an exception in the following days June 11th and 13th. In this way the peaks
observed in May 6th, 12th and 18th (23635 CU ml-1, 25236 CU ml-1 and 24899 CU ml-1,
respectively) were in majority caused by the species Microcystis sp. and the peaks
observed in June 1st and 9th (25489 CU ml-1 and 26753 CU ml-1, respectively) were mainly
caused by the filamentous species. The highest cellular concentration obtained for these
taxa occurred in June 9th, being coincident with the day in which the highest cellular
concentration for the filamentous species was observed (8342 CU ml-1) (Fig. 1). The
appearance of the bloom forming filamentous cyanobacteria Aphanizomenon flos-aquae
occurred simultaneously with an increase in phosphate concentration in the water (May
30th to June 19th), after a very rainy period; and with a low level of nitrogen source
compounds (NO3- and NH4
+).
Capítulo II – Water column environment of a eutrophic shallow temperate lake in late spring: pelagic communities of phytoplankton, cyanobacteria and associated heterotrophic bacteria and viruses
41
Bacteria, Virus and virus-to-bacterium ratio
The concentration of viruses through the spring bloom decrease from 2 x 10¹² viruses L-1
after the Chlorophyta bloom to 5 x 10¹⁰ viruses L-1 during the peak of Cyanobacteria, with
a mean of 2 x 10¹¹ viruses L-1. Bacterial numbers followed the same pattern of variation,
decreasing during the bloom from 3.3 x 10¹¹ cells L-1 to 1.1 x 10¹¹ cells L-1 with a mean of
1.6 x 10¹¹ cells L-1 (Fig. 2). Although viruses counts were, on average, higher than
bacterial counts, yielding mean virus-to-bacterium ratio of 1.4 (range 0.3 to 5.7), the virus-
to-bacterium ratio was frequently low, showing values below 1 in 57 % of the cases.
The canonical correspondence analysis
Results from CCA ordination of most abundant phytoplankton species, bacteria, virus and
environmental variables (Fig. 3a) lead to the conclusion that water temperature (WT) and
volatile solids (VS) were strongly correlated with the first CCA axis while dissolved
oxygen (O2), pH, ammonia (NH4+), phosphates (PO4
3-) and nitrates (NO3-) were the most
correlated with the second axis. These two axes alone explained 48,5% of the total
phytoplankton, bacterial and viral variance (Table 2a). On the negative side, the first axis is
defined by the green algae Tetraedron minimum (TETm), Scenedesmus oahuensis (SCEo),
Scenesdesmus acuminatus (SCEa), Pediastrum boryanum (PEDb), Scenedesmus sp. (SCE),
Scenesdesmus spinosus (SCEs), but also by the cyanobacteria Microcystis sp. (MYCS) and
total viral concentration (Vir). The positive side of the first axis is defined by the
euglenophyte Euglena sp. (EUG.), Lepocinclis salina (LEP.), Trachelomonas sp. (TRA)
and Trachelomonas nigra (TRAn), the chlorophyte Botriococcus brauni (BATR),
Pediastrum tetras (PEDt), and the cyanobacteria Aphanizomenon flos-aquae (APHA) and
Merismopedia sp. (MERI), but also by the total bacteria concentration (Bac). Along the
Capítulo II – Water column environment of a eutrophic shallow temperate lake in late spring: pelagic communities of phytoplankton, cyanobacteria and associated heterotrophic bacteria and viruses
42
second axis, the positive area is defined by the cyanobacteria Microcystis sp. (MYCS) and
by the cryptophyte Cryptomonas sp. (CRYP) and the negative side is defined by
chlorophyte: Coelastrum pseudomicroporum (COEL), Scenedesmus disciformes (SCEd),
Pediastrum duplex (PEDd) and Tetraedron caudatum (TETc).
In the second CCA virus densities were used as explanatory variables (Table 2c and
Fig. 3b). The first two axes explained 50.6% (a higher percentage then the obtained for the
first diagram) of the total phytoplankton and bacterial variance. This analysis was preceded
by a CCA (Table 2b) using the same data (without virus) (the first two axes explained
45.2% of the total variance). The ordination diagram obtained (Fig. 3b) shows that water
temperature and volatile solids are still strongly correlated with the first CCA axis, but
immediately followed by viral abundance. The second axis shows correlations with pH,
dissolved oxygen and conductivity.
Discussion
De Figueiredo et al. (2006) described the dominance of cyanobacteria from late spring
until early autumn (less nutrient availability and higher temperatures) in this shallow lake,
eutrophic system (a massive cyanobacterial bloom of Aphanizomenon flos-aquae occurred
early in May 2001 and was preceded by the lowest nitrogen levels measured in the water
during all the study period). The development of the dense A. flos-aquae bloom was
preceded by the lowest concentrations of nitrogen, indicating that this cyanobacterial strain
is not very dependent on nitrogen availability, probably due to its N-fixing capability.
However, the availability of phosphate appeared to be required for the bloom development.
This phosphorus dependence has been reported for this species (Teubner et al. 1999;
Dokulil & Teubner 2000; de Figueiredo et al., 2004b; 2006).
Capítulo II – Water column environment of a eutrophic shallow temperate lake in late spring: pelagic communities of phytoplankton, cyanobacteria and associated heterotrophic bacteria and viruses
43
Loss of biodiversity and increase of algal blooms are the most evident negative ecological
impacts of human activities on the microbial level in aquatic systems. The dominance of
Cyanobacteria, and the presence of the genus Microcyctis and Aphanizomenon follows a
pattern described for shallow Mediterranean lakes (Naselli-Flores & Barone 2003; de
Figueiredo et al. 2006; Moustaka-Gouni et al. 2007). This pattern may indicate relations
between climate factors and phytoplankton dynamics (Naselli-Flores & Barone 2003; de
Figueiredo et al. 2006; Moustaka-Gouni et al. 2007). If the smoother seasonal changes in
irradiance in lower latitudes compared to those in higher latitudes, in combination with
other properties of warmer climates, are assumed to result in smoother changes in physical
conditions of the lakes, these may allow persistence of Cyanobacteria (Naselli-Flores et al.
2003; Moustaka-Gouni et al. 2007). These observations may have implications for future
investigation of climate impacts on phytoplankton dynamics due to global warming
(Moustaka-Gouni et al. 2007).
The abundance of heterotrophic bacteria in the water column depends on the availability of
organic matter and is indirectly linked to the chlorophyll concentration. Ammonia- and
nitrite-oxidising bacteria together are responsible for the process of nitrification (which is
the oxidation of ammonium to nitrate). The highest appearing of heterotrophic aerobic
bacteria was observed during the bloom, which match the high values of organic matter.
The maximum values of chlorophyll a, total and volatile solids were observed during the
bloom period, decreasing when the senescence period began (Fig. 4).
In most instances, viral abundance was significantly correlated with bacterioplankton
abundance (Wommack & Colwell 2000; Fischer & Velimirov 2002; Bettarel et al. 2003;
Vrede et al. 2003), but in a few studies, it showed significant correlation with chlorophyll a
concentration (Boehme et al 1993; Maranger & Bird 1995; Weinbauer et al. 1995). The
same pattern of variation of viruses and bacteria during the phytoplankton bloom as well as
Capítulo II – Water column environment of a eutrophic shallow temperate lake in late spring: pelagic communities of phytoplankton, cyanobacteria and associated heterotrophic bacteria and viruses
44
the significant correlation between viruses and bacteria (p<0.05) suggest that a significant
fraction of viruses are bacteriophages. However, the frequent low viruses-to-bacteria ratios
seem to indicate that during a bloom a large fraction of planktonic viruses results from
phytoplankton cells infection; phytoplankton might represent an important host reservoir
for the virioplankton which is consistent with the results reported by Maranger & Bird
(1995). Laboratory experiments with whole water-columns from shallow, eutrophic lakes
repeatedly showed collapse of the predominant filamentous cyanobacteria; the collapse
could be due to viral activity (Gons et al. 2006). VBR is a common index used to examine
viral-bacterial dynamics in aquatic systems (Maranger & Bird 1995). Generally, high VBR
values may have resulted from either a high infection rate or a long persistence of viruses
in the plankton (Laybourn-Parry et al. 2001). In addition, high concentration phytoplankton
and cyanobacteria may also result in high VBR value (Maranger & Bird 1995). The mean
VBR of 1.4 (range 0.3 to 5.7) is somehow below the general range (i.e., 3 to 10) reported
for pelagic environments (Wommack & Colwell 2000). The possible explanation for our
results is that viral dynamics might result from bacteriophages, cyanophages, algal viruses
and other viruses together.
References
Abrantes N., Antunes S.C., Pereira M.J., Gonçalves F. 2006. Seasonal succession of
cladocerans and phytoplankton and their interactions in a shallow eutrophic lake (Lake
Vela, Portugal). Acta Oecologica 29: 54-64.
Antunes S.C., Abrantes N., Gonçalves F. 2003. Seasonal variation of the abiotic
parameters and the cladoceran assemblage of Lake Vela: comparison with previous
studies. Annales de Limnologie, International Journal of Limnology 39: 255-264.
Capítulo II – Water column environment of a eutrophic shallow temperate lake in late spring: pelagic communities of phytoplankton, cyanobacteria and associated heterotrophic bacteria and viruses
45
APHA 1992. Standard methods for the examination of water and wastewater” 18th ed.
American public health association, Washington, D.C. 991 pp.
Bergh O., Borsheim K.Y., Bratbak G., Hendal M. 1989. High abundance of viruses found
in aquatic environments. Nature 340: 467-468.
Bettarel Y., Sime-Ngando T., Amblard C., Dolan J. 2004. Viral activity in two contrasting
lake ecosystems. Applied and Environmental Microbiology 70: 2941-2951.
Boheme J., Fischer M.E., Jiang S.C., Kellogg C.A., Pichard S., Rose J.B., Steinway C.,
Paul J.H. 1993. Virus, bacterioplankton, and phytoplankton in the southeastern Gulf of
mexico: distribution and contribution to oceanic DNA pools. Marine Ecology Progress
Series 97: 1-10
de Figueiredo D.R., Azeiteiro U.M., Esteves S.M., Gonçalves F.J.M., Pereira M.J. 2004a.
Microcystin producing blooms – a serious global Public Health issue” Ecotoxicology and
Environmental Safety 59 (2): 151-163.
de Figueiredo D.R., Vidal T., Lopes V., Soares A.M.V.M., Pereira M.J. 2004b. Toxic
cyanobacterial blooms – occurrence, consequences and control strategies. In Global Trends
on Environmental Education. Azeiteiro, U.M., Pereira, M.J., Caeiro, S., Bacelar-Nicolau, P.,
Morgado, F. & Gonçalves, F., (Eds.). 623-656, Discursos Língua, Cultura e Sociedade,
Universidade Aberta, Lisboa..
de Figueiredo D.R., Reboleira A.S.S.P., Antunes S.C., Abrantes N., Azeiteiro U.M.,
Gonçalves F., Pereira M.J. 2006. The effect of environmental parameters and
cyanobacterial blooms on phytoplankton dynamics of a Portuguese temperate lake.
Hydrobiologia 568: 145-157.
Doan N.T., Rickards R.W., Rothschild J.M., Smith G.D. 2000. Allelopathic actions of the
alkaloids 12- epi- hapalindole E isonitrile and calothrixin A from cianobactéria of the
genera Fischerella and Calothrix. Journal of Applied Phycology 12: 409-416.
Capítulo II – Water column environment of a eutrophic shallow temperate lake in late spring: pelagic communities of phytoplankton, cyanobacteria and associated heterotrophic bacteria and viruses
46
Dokulil M. Teubner K. 2000. Cyanobacterial dominance in lakes. Hydrobiologia 428: 1-
12.
Fischer U.R., Velimirov B. 2002. High control of bacterial production by viruses in a
eutrophic oxbow lake. Aquat. Microb. Ecol. 27: 1-12.
Fott B. 1968. Das Phytoplankton des Süsswasses, Systematik und Biologie. 3 Teil:
Cryptophyceae, Chloromonadophyceae, Dinophyceae” E. Schweizerbart’sche
Verlagsbuchandlung, Stuttgart.
Fuhrmann J.A. 1999. Marine viruses and their biogeochemical and ecological effects.
Nature 399: 541-547.
Geitler L. 1932. Cyanophyceae In: Rabenhorst’s, L. (Ed), Kryptogamen-Flora von
Deutschland, Österreich und der Schweiz, band 14. Akademische Verlagsgesellschaft,
Leipzig.
Gons H.J., Hoogveld H.L., Simis S.G.H., Tijdens M. 2006. Dynamic modelling of viral
impact on cyanobacterial populations in shallow lakes: implications of burst size. Journal
of the Marine Biological Association of the United Kingdom 86 (3): 537-542.
Hall A., Lucas M.F.M.B. 1981. Analysis of ammonia in brackish waters by the indophenol
blue technique: comparison of two alternative methods” Revista Portuguesa Química 23:
205-211.
Havens K.E., Hauxwell J., Tyler A.C., Thomas S., McGlathery K.J., Cebrian J., Valiela I.,
Steinman A.D., Hwang S-J. 2001. Complex interactions between autotrophs in shallow
marine and freshwater ecosystems: implications for community responses to nutrient
stress. Environmental Pollution 113: 95-107.
Hayashi T., Hayashi K. 1996. Calcium spirulan, an inhibitor of enveloped virus
replications, from a blue-green alga Spirulina plantesis. J. Nat. Prod. 59: 83-87.

Capítulo II – Water column environment of a eutrophic shallow temperate lake in late spring: pelagic communities of phytoplankton, cyanobacteria and associated heterotrophic bacteria and viruses
47
.Hobbie E., Daley R.J., Jaspers S. 1997. Use of nucleopore filters for counting bacteria by
epifluorescence microscopy. Applied and Environmental Microbiology 33: 1225–1228.
Huber-Pestalozzi, G. 1961. Das Phytoplankton des Süsswasses, Systematik und Biologie 4
Teil: Euglenophyceae. E. Schweizerbart’sche Verlagsbuchandlung, Stuttgart.
Jaki B., Orjala J., Sticher O. 1999. A novel extracellular diterpenoid with antibacterial
activity from the cyanobacterium Nostoc commune. J. Nat. Prod. 62: 502-503.
Kodani S., Imoto A., Mitsutani A., Murakami M. 2002. Isolation and identification of the
antialgal compound, harmane (1-methyl-β-carboline), produced by the algicidal bacterium,
Pseudomonas sp. K44-1. Journal of Applied Phycology 14: 109-114.
Komárek J., Anagnostidis K. 1989. Modern approach to the classification system of
cyanophytes – 4 – Nostocales. Archives of hydrobiology (Supplement 82): 247-345.
Komárek J., Anagnostidis K. 1999. Cyanoprokaryota - 1 Teil Chloococcales. In: Ettl, H.,
G. Gärtner, H. Heynig & D. Mollenhauer (Eds). Süβwasserflora von Mitteleuropa, Band
19/1. G. Fisher Verlag, Jena, Stuttgart, Lübeck, Ulm.
Komárek J., Fott B. 1983. Das phytoplankton des Süsswassers, systematic un biologie 7.
Teil, 1. Hälfte, Chlorophyceae (Grünalgen). Ordnung: Chlorococcales. Scweizerbart’sche
Verlagsbuchhandlung, Stuttgart.
Kós P., Gorzó G., Surányi G., Borbély G. 1995. Simple and efficient method for isolation
and measurement of cyanobacterial hepatotoxins by plant tests (Sinapsis alba L.).
Analytical Biochemistry 225: 49-53.
Laybourn-Pauy J., Hofer J.S., Sommaruga R. 2001. Seasonal dynamics of viruses in an
alpine lake: importance of filamentous forms. Aquatic Microbial Ecology 26: 1-11.
Liu Y.-M., Zhang Q.-Y., Yuan X.-P., Li Z.-Q., Gui J.-F. 2006. Seasonal variation of
virioplankton in a eutrophic shallow lake. Hydrobiologia 560: 323-334.

Capítulo II – Water column environment of a eutrophic shallow temperate lake in late spring: pelagic communities of phytoplankton, cyanobacteria and associated heterotrophic bacteria and viruses
48
Lorenzen C.J. 1967. Determination of chlorophyll and phaeo-pigments:
spectrophotometric equations. Limnol. Oceanogr. 12: 343-346.
Lund J.W.G., Kipling C., Le Cren E.D. 1958. The inverted microscope method of
estimating algal numbers and statistical basis of estimations by counting. Hydrobiologia
11: 143-170.
Maranger R., Bird D.F. 1995. Viral abundances in aquatic systems: a comparison between
marine and freshwater. Marine Ecology Progress Series 121: 217-226.
Matsuda H., Okino T., Murakami M., Yamaguchi K. 1996. Aeruginosins 102-A and B,
new
thrombin inhibitors from the cyanobacterium Microcystis viridis (NIES-102). Tetrahedron
52: 14501-14506.
Mitrovic S.M., Pflugmacher S., James K.J., Furey, A. 2004. Anatoxin-a elicits an increase
in peroxidase and glutathione S-transferase activity in aquatic plants. Aquatic toxicology
68: 185-192.
Moustaka-Gouni M., Vardaka E., Tryfon E. 2007. Phytoplankton species succession in a
shallow Mediterranean lake (L. Kastoria, Greece): steady-state dominance of Limnothrix
redekei, Microcystis aeruginosa and Cylindrospermopsis raciborskii. Hydrobiologia 575:
129-140.
Mundt S., Kreitlow S., Nowotny A., Effmert U. 2001. Biochemical and pharmacological
investigations of selected cianobactéria. International Journal of Hygiene and
Environmental Health 203: 327-334.
Murakami M., Ishida K., Okino T., Okita Y., Matsuda H., Yamaguchi K. 1995.
Aeruginosins 98-A and B, trypsin inhibitors from the blue-green alga Microcystis
aeruginosa (NIES-98). Tetrahedron letters 36(16): 2785-2788.
Capítulo II – Water column environment of a eutrophic shallow temperate lake in late spring: pelagic communities of phytoplankton, cyanobacteria and associated heterotrophic bacteria and viruses
49
Naselli-Flores L., Barone, R. 2003. Steady-state assemblages in a Mediterranean
hypertrophic reservoir. The role of Microcystis ecomorphological variability in
maintaining an apparent equilibrium. Hydrobiologia 502: 133-143.
Naselli-Flores L., Padisak J., Dokulil, M.T., Chorus I. 2003. Equilibrium steady-state
concept in phytoplankton ecology. Hydrobiologia 502: 395-403.
Nauwerck A., 1960. Zur Systematik und Ökologie portugiesischer Planktonalgen. Bol.
Soc. Brot. XI: 7-56.
Nowotny A., Mentel R., Wegner U., Mundt S., Lindequist U. 1997. Antiviral activity of an
aqueous extract of the cyanobacterium Microcystis aeruginosa. Phytotherapy Research 11:
93-96.
Østensvik Ø., Skulberg O.M., Underdal B., Hormazabal V. 1998. Antibacterial properties
of extracts from selected planktonic freshwater cyanobacteria – a comparative study of
bacterial bioassays. Journal of Applied Microbiology 84: 1117-1124.
Pearl H.W. 1996. Microscale physiological and ecological studies of aquatic
cyanobacteria: macroscale implications. Microscopy research and technique 33: 47-72.
Pflugmacher S., Codd G.A., Steinberg C.E.W. 1999. Effects of the cyanobacterial toxin
microcistin-LR on the detoxication enzymes in aquatic plants. J. Appl. Bot. 14(14): 111-
115.
Piccardi R., Frosini A., Tredici M.R., Margheri C. 2000. Bioactivity in free-living and
symbiotic cyanobacteria of the genus Nostoc. Journal of Applied Phycology 12: 543-547.
Rodier J. (1984) L’analyse de l’eau, eaux naturelles, eaux résiduaires, eau de mer (chimie,
physico-chemie, bactériologie, biologie). 7ed. Dunoud, Bordas, Paris. 700 pp.
Sano T., Takagi H., Morrison L.F., Metcalf J.S., Codd G.A., Kaya K. 2005. Leucine
aminopeptidase M inhibitors, cyanostatin A and B, isolated from cyanobacterial water
blooms in Scotland. Phytochemistry 66: 543-548.

Capítulo II – Water column environment of a eutrophic shallow temperate lake in late spring: pelagic communities of phytoplankton, cyanobacteria and associated heterotrophic bacteria and viruses
50
Simis S.G.H., Tijdens M., Hoogveld H.L., Gons H.J. 2005. Optical changes associated
with cyanobacterial bloom termination by viral lysis. Journal of Plankton Research 27(9):
937-949.
Skulberg O.M. 2000. Microalgae as source of bioactive molecules – experience from
cyanophyte research. Journal of Applied Phycology 12: 341-348.
ter Braak, C., 1995. Ordination. In: Jongman, R.H.G., ter Braak, C.J.F., Tongeren, O.F.R.
(eds), Data analysis in community and landscape ecology. Cambridge University Press,
Cambridge, pp. 91–173.
Teubner K., Feyerabend R., Henning M., Nicklisch A., Woitke P., Kohl J.-G. 1999.
Alternative blooming of Aphanizomenon flos-aquae or Planktothrix agardhii induced by
the timing of the critical nitrogen-phosphorus-ratio in hypertrophic riverine lakes. Arch
Hydrobiol, Spec Iss Adv Limnol 54: 325-344.
Volk R.B. 2005. Screening of microalgal culture media for the presence of algicidal
compounds and isolation and identification of two bioactive metabolites, excreted by the
cyanobacteria Nostoc insulare and Nodularia harveyana, respectively. Journal of Applied
Phycology 17: 339-347.
Weinbauer M.G., Fuks D., Peduzzi P. 1995. Diel, seasonal, and depth-related variability of
viruses and dissolved DNA in the Northern Adriatic Sea. Microbial Ecology 30: 25-41.
Weinbauer M.G., Brettar I., Höfle M.G. 2003. Lysogeny and virus-induced mortality of
bacterioplankton in surface, deep and anoxic waters. Limnology and Oceanography 48:
1457-1465.
Wommack K.E., Colwell R.R. 2000. Virioplankton: viruses in aquatic ecosystems.
Microbiology and Molecular Biology Reviews 64: 69-114.
Vrede K., Stensdotter U., Lindstrom E.S. 2003. Viral and bacterioplankton dynamics in
two lakes with different humic contents. Microbial Ecology 46: 406-415.
Capítulo II – Water column environment of a eutrophic shallow temperate lake in late spring: pelagic communities of phytoplankton, cyanobacteria and associated heterotrophic bacteria and viruses
51
Zar J.H. 1996. Biostatistical Analysis” 3rd edition Prentice-Hall International, Inc., New
Jersey 662 pp.
Zhang Q.Y. 2002. Virioplankton. Acta Hydrobiology Sinica 26: 691-696.
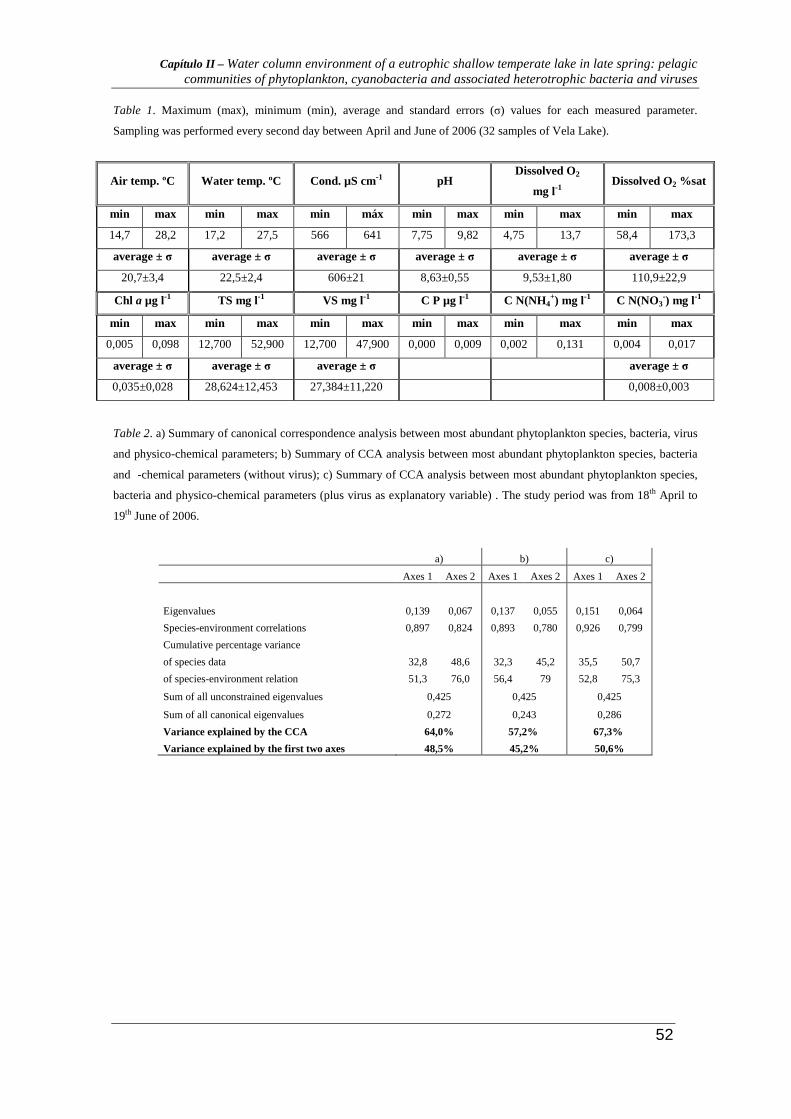
Capítulo II – Water column environment of a eutrophic shallow temperate lake in late spring: pelagic communities of phytoplankton, cyanobacteria and associated heterotrophic bacteria and viruses
52
Table 1. Maximum (max), minimum (min), average and standard errors (σ) values for each measured parameter.
Sampling was performed every second day between April and June of 2006 (32 samples of Vela Lake).
Air temp. ºC Water temp. ºC Cond. µS cm-1 pH Dissolved O2
mg l-1 Dissolved O2 %sat
min max min max min máx min max min max min max
14,7 28,2 17,2 27,5 566 641 7,75 9,82 4,75 13,7 58,4 173,3
average ± σ average ± σ average ± σ average ± σ average ± σ average ± σ
20,7±3,4 22,5±2,4 606±21 8,63±0,55 9,53±1,80 110,9±22,9
Chl a µg l-1 TS mg l-1 VS mg l-1 C P µg l-1 C N(NH4+) mg l-1 C N(NO3
-) mg l-1
min max min max min max min max min max min max
0,005 0,098 12,700 52,900 12,700 47,900 0,000 0,009 0,002 0,131 0,004 0,017
average ± σ average ± σ average ± σ average ± σ
0,035±0,028 28,624±12,453 27,384±11,220 0,008±0,003
Table 2. a) Summary of canonical correspondence analysis between most abundant phytoplankton species, bacteria, virus
and physico-chemical parameters; b) Summary of CCA analysis between most abundant phytoplankton species, bacteria
and -chemical parameters (without virus); c) Summary of CCA analysis between most abundant phytoplankton species,
bacteria and physico-chemical parameters (plus virus as explanatory variable) . The study period was from 18th April to
19th June of 2006.
a) b) c)
Axes 1 Axes 2 Axes 1 Axes 2 Axes 1 Axes 2
Eigenvalues 0,139 0,067 0,137 0,055 0,151 0,064
Species-environment correlations 0,897 0,824 0,893 0,780 0,926 0,799
Cumulative percentage variance
of species data 32,8 48,6 32,3 45,2 35,5 50,7
of species-environment relation 51,3 76,0 56,4 79 52,8 75,3
Sum of all unconstrained eigenvalues 0,425 0,425 0,425
Sum of all canonical eigenvalues 0,272 0,243 0,286
Variance explained by the CCA 64,0% 57,2% 67,3%
Variance explained by the first two axes 48,5% 45,2% 50,6%

Capítulo II – Water column environment of a eutrophic shallow temperate lake in late spring: pelagic communities of phytoplankton, cyanobacteria and associated heterotrophic bacteria and viruses
53
Figures
Figure 1. Abundances distribution of the main phytoplankton groups and A. flos-aquae dynamics every second day
between April and June of 2006 in surface water samples (32 samples) of Vela Lake.
Figure 2. Variation of bacterial and viral abundance every second day between April and June of 2006 in surface water
samples (32 samples) of Vela Lake.
Figure 3. Results from canonical correspondence analysis for Vela Lake between 18th April and 19th June of 2006: a)
biplot for most abundant phytoplankton species, bacteria, virus and environmental variables; b) biplot for most abundant
phytoplankton species, bacteria and environmental variables plus virus (as explanatory variable).
Figure 4. Time courses of phytoplankton biomass as chlorophyll a (Chl-a), organic matter every second day between
April and June of 2006 in surface water samples (32 samples) of Vela Lake.
Fig. 1
0,00E+00
5,00E+01
1,00E+02
1,50E+02
1 3 5 7 9 11 13 15 17 19 21 23 25 27 29 31
sample
x10
10 c
ells
.L-1
virus
bacteria
Fig. 2
1
100
10000
1000000
1 2 3 4 5 6 7 8 9 10 11 12 13 14 15 16 17 18 19 20 21 22 23 24 25 26 27 28 29 30 31 32
Sample
Chlorophyta
Cryptophyta
Cyanoprokaryota
Euglenophyta
A. f los-aquae
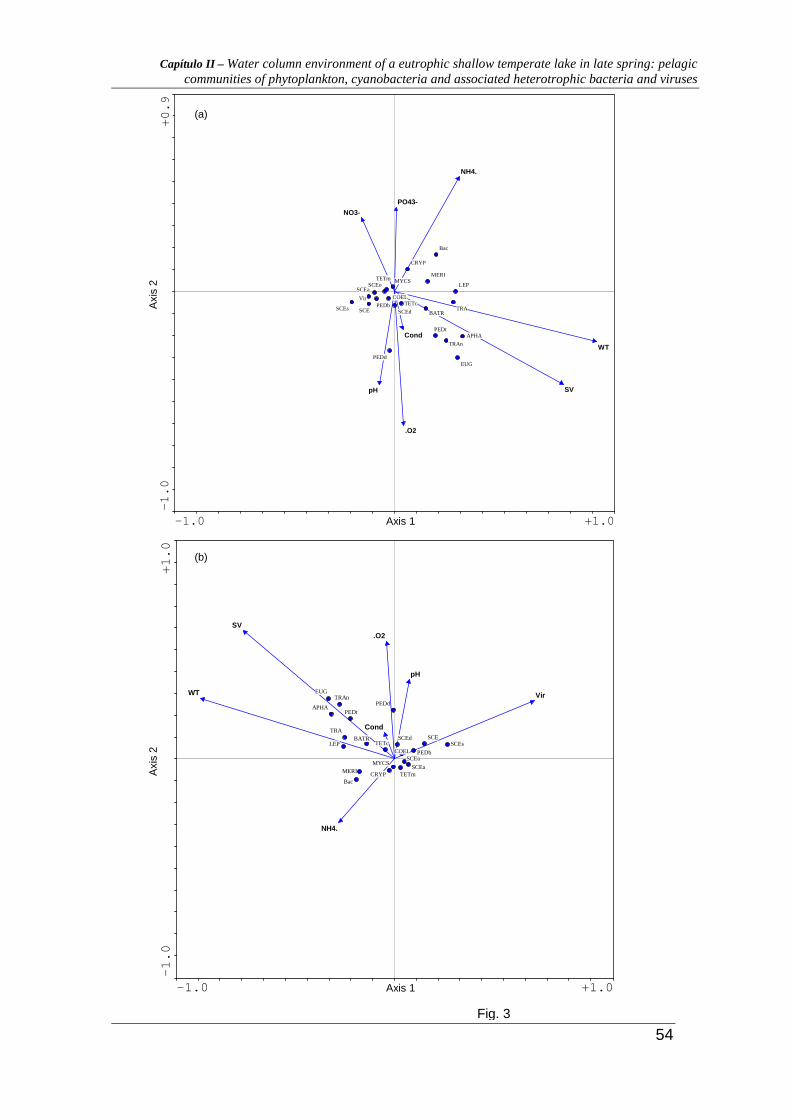
Capítulo II – Water column environment of a eutrophic shallow temperate lake in late spring: pelagic communities of phytoplankton, cyanobacteria and associated heterotrophic bacteria and viruses
54
-1.0 +1.0
-1.0
+0.9
WT
SV
NH4.
NO3-
pH
.O2
Cond
PO43-
APHA
EUG
LEP
TRA
TRAn
SCEs
Bac
PEDt
MERI
BATRSCE
Vir
SCEa
PEDb
CRYP
SCEoTETm
TETcCOEL
PEDd
MYCS
SCEd
-1.0 +1.0
-1.0
+1.0
WT
SV
Vir
NH4.
pH
Cond
.O2
EUG
APHA
TRAn
SCEsLEP
TRA
PEDt
Bac
MERI
SCEBATR
PEDb
SCEa
SCEo
TETcCOEL
TETmCRYP
SCEd
PEDd
MYCS
Axis 1
Axi
s 2
Axis 1
Axi
s 2
(a)
(b)
Fig. 3
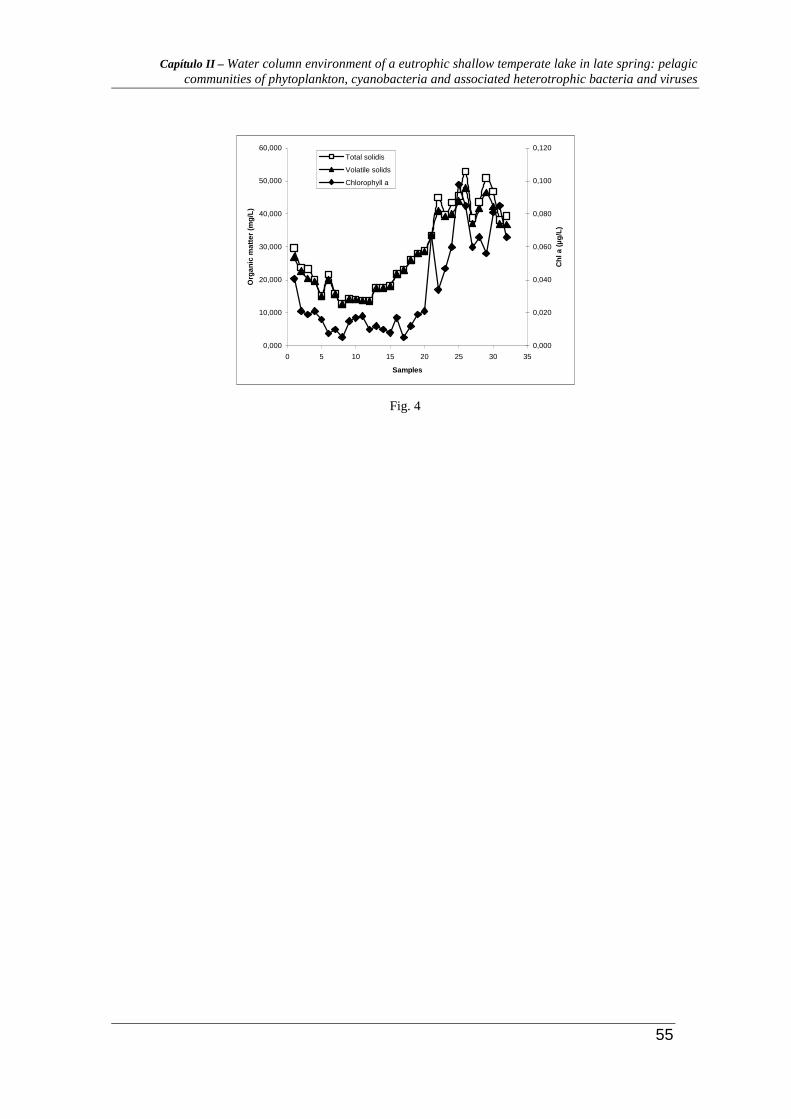
Capítulo II – Water column environment of a eutrophic shallow temperate lake in late spring: pelagic communities of phytoplankton, cyanobacteria and associated heterotrophic bacteria and viruses
55
0,000
10,000
20,000
30,000
40,000
50,000
60,000
0 5 10 15 20 25 30 35
Samples
Org
anic
mat
ter
(mg/
L)
0,000
0,020
0,040
0,060
0,080
0,100
0,120
Chl
a (
µg/L
)
Total solidis
Volatile solids
Chlorophyll a
Fig. 4

Capítulo III
Bacterioplankton dynamics during the
development of a phytoplankton bloom in a
temperate shallow lake
Capítulo III - Bacterioplankton dynamics during the development of a phytoplankton bloom in a temperate shallow lake
57
Bacterioplankton dynamics during the development of a phytoplankton bloom in
a temperate shallow lake
Bessa V.S.2, Lopes, A.R.2, Pereira, C.2, Santos, L.1, Almeida, A.1, Pereira, M.J.1 & Cunha,
M.A.1
1CESAM, Departamento de Biologia, Universidade de Aveiro, Campus de Santiago, 3810-193 Aveiro, Portugal
2Departamento de Biologia, Universidade de Aveiro, Campus de Santiago, 3810-193 Aveiro, Portugal
Journal (Paper submitted for publication in the Microbial Research)
Corresponding Author:
Maria Ângela Cunha
Departamento de Biologia, Universidade de Aveiro, 3810-193 Aveiro, Portugal
Phone. + 351 234 370 350; Fax. +351 234 426 408
E-mail: [email protected]
Capítulo III - Bacterioplankton dynamics during the development of a phytoplankton bloom in a temperate shallow lake
58
Bacterioplankton dynamics during the development of a phytoplankton bloom in
a temperate shallow lake
Bessa V.S.2, Lopes, A.R.2, Pereira, C.2, Santos, L.1, Almeida, A.1, Pereira, M.J.1 & Cunha,
M.A.1
1CESAM, Departamento de Biologia, Universidade de Aveiro, Campus de Santiago, 3810-193 Aveiro, Portugal
2Departamento de Biologia, Universidade de Aveiro, Campus de Santiago, 3810-193 Aveiro, Portugal
Abstract
Phytoplankton blooms are common in eutrophic freshwaters, being Cyanobacteria frequently reported as the major intervenient in bloom formation. Some information about the dynamics of bacterioplankton communities during phytoplankton blooms is currently available but little is known about phytoplankton influence on prokaryote diversity and the relation between cyanobacterial development and the dynamics of other prokaryote groups. The aim of this work was the characterization of freshwater planktonic prokaryote communities during a phytoplankton bloom and the identification of major environmental factors regulating prokaryote dynamics during these events. The prokaryote community was described in terms the total culturable fraction (colony counts) and the relative abundance of selected phylogenetic groups assessed by Fluorescence In Situ Hybridization. Probes for Archaea, Eubacteria, α, β and γ–Proteobacteria, Cyanobacteria, Actinobacteria, and Cytophaga-Flavobacteria were used. Physical and chemical water properties were also described. The culturable fraction (323-15000 CFU.mL-1) was mainly composed of gram-negative, catalase positive strains. The culture independent approach revealed that the prokaryote community was diverse, although mainly composed by Eubacteria, and that its structure was highly variable during the study period. The abundance of Cyanobacteria did not correlate significantly with the abundance of any other of the analyzed prokaryote groups but it correlated positively with PO4
3-. Conductivity correlated positively with the abundance of Archaea, β and γ–Proteobacteria. The results indicate an association of these groups with organic matter, derived from primary production.
Capítulo III - Bacterioplankton dynamics during the development of a phytoplankton bloom in a temperate shallow lake
59
INTRODUCTION
Freshwater habitats play an important role in global biogeochemical cycles regulating
the flux of dissolved and particulate matter from the terrestrial environment to the sea.
Bacteria are involved in the most significant biogeochemical processes. However, little is
known about the identity and function of the groups that inhabit freshwater environments as
well as about their relation with phytoplankton and chemical and biological parameters.
Recent studies of comparative analysis of 16S rRNA clone libraries have revealed that lakes
and rivers contain many bacterial groups that appear to be phylogenetically distinct from
those found in other environments (e.g. in soils and oceans; Eiler and Bertilsson, 2004).
Eutrophication is frequently a result of nutrient unbalance associated to the release of
sewage effluent and run-off from lawn fertilizers into natural waters, although it may also
occur naturally in situations where nutrients accumulate (e.g. depositional environments)
(Spatharis et al., 2007). Human activities can accelerate the rate at which nutrients enter
ecosystems (for example: runoff from agriculture and development, pollution from septic
systems and sewers, and other human-related activities), increasing the flux of both inorganic
nutrients and organic substances into the ecosystem.
In freshwater systems, phosphorus and nitrogen often act as limiting nutrients – the
levels of these two nutrients determine the biological productivity of the lake. A sharp
increase in one or both of these elements can result in an algal bloom (de Figueiredo et al.,
2006). There are several direct and indirect costs associated with algal blooms. As the algae
population proliferates, waters become increasingly more turbid, especially in shallow lakes
(Schäfer et al., 2001; Haukka, et al., 2006).
Phytoplankton and cyanobacterial blooms are common in eutrophic freshwaters often
producing elevated levels of noxious compounds that compromise water quality. Transfer of
photosynthetically fixed organic carbon to heterotrophic bacteria can occur by bacterial
degradation and utilization of dead cyanobacteria. Enzymatic attack and predation on living
phytoplankton by heterotrophic bacteria can liberate dissolved organic matter for bacterial
bloom conditions. Cyanobacterial dominated phytoplankton is the main source of readily
available DOM. However, in the post-bloom, when some bacterial groups are actively using
dead cell material, the total bacterial numbers were found to decrease (Kisand and Tammert,
2000) indicating a shift in the structure of the heterotrophic fraction of bacterioplankton.
Capítulo III - Bacterioplankton dynamics during the development of a phytoplankton bloom in a temperate shallow lake
60
Since the introduction of culture-independent methods for the identification and
classification of microorganisms in different environments, our knowledge of the diversity of
Bacteria and Archaea has significantly increased. This is also true for bacterioplankton
communities of lakes (Hiorns et al., 1997; Methé and Zehr, 1999; Zwart et al., 1998;
Lindström, 2000). However, only a few attempts have been made to relate community
composition to biological, chemical and physical parameters in the lakes (e.g., Höfle et al.,
1999; Lindström, 1998; Methé and Zehr, 1999; Lindström, 2000). Consequently, little is
known about the factors that may have a significant impact on the phylogenetic structure of
lake bacterioplankton.
The present work aimed to interpret the variability of the composition of the bacterial
community in a shallow lake (Vela Lake), a eutrophic freshwater system, during a
phytoplankton bloom. In different bloom phases, the major chemical and organic parameters
regulating prokaryote dynamics were analyzed with a particular focus on search for
interactions between cyanobacteria and other prokaryote groups.

Capítulo III - Bacterioplankton dynamics during the development of a phytoplankton bloom in a temperate shallow lake
61
MATERIAL AND METHODS
Study site
Vela Lake (44º58’N, 5º18’W) is one of the few natural shallow lakes (average depth
circa 1m) existing in the west coast of Portugal, lying in a transition zone between
Mediterranean (southwards) and Atlantic (northwards) bioclimates (Abrantes et al., 2006).
Vela Lake is a small (60-70ha), shallow (0,9m average depth; 2,4 m maximum depth) water
body, being the largest of a cluster of small shallow lakes located within a coastal dune
system (de Figueiredo et al., 2006).
Agriculture, livestock activities and, to a lesser extend, domestic runoffs from adjacent
human settlements supply regular nutrient inputs to the lake, originating high primary
productivity and turbity (Abrantes et al., 2006).
Phytoplankton and cyanobacterial blooms are frequent and occasional episodes of
oxygen shortage have occurred in recent years (Antunes et al., 2003).
Sampling Strategy
Samples were collected just below surface every second day, from April 18th to June
19th, 2006 (spring time), during the morning period. Samples were enumerated according to
the sequential days of sampling. In each sampling day, water was collected for chemical
(phosphates, nitrates, ammonia) parameters, particulate matter (volatile and total solids),
chlorophyll a (as an estimate of algal biomass) and prokaryote dynamics analyses. All the
samples were kept in the dark, being processed in the laboratorium within one hour.
During the sampling period, several parameters were evaluated in situ: pH, O2
concentration (mg.L-1) and percentage of saturation (%), conductivity and water temperature
(WTW multiliner P4).
Capítulo III - Bacterioplankton dynamics during the development of a phytoplankton bloom in a temperate shallow lake
62
Physical and chemical parameters
For the determination of total and volatile solids, aliquots of variable volume (depending
on the trophic status) were filtered through GF/C precombusted filters. Total solids were
calculated by gravimetry and volatile solids were calculated by weight loss after incineration
(APHA, 1992).
Inorganic nutrients were determinated colorimetrically (6 Genesys Thermo spectronic)
following the stannous chloride method for phosphate (APHA, 1992), the sodium salicylate
method for nitrate (described by Rodier, 1984) and the indophenol blue method was used for
ammonia (described by Hall & Lucas, 1981).
Chlorophyll a concentration was determined spectophotometrically (Lorenzen, 1967),
after filtration of a proper volume (depending on the trophic status), extraction with acetone
90%, overnight at 4ºC and centrifugation at 3000 rpm during 10min.
Phytoplankton abundance and diversity
For the phytoplankton quantification, samples were fixed in Lugol solution (1% v/v)
being the enumeration performed according to the described by Lund et al., (1958), after
adequate concentration.
During the quantification, it was considered as unit: the colony in the case of colonial
organisms; the filament for filamentous organisms and the cell for unicellular organisms.
Chlorophyta, Cryptophyta, Cyanobacteria and Euglenophyta were the relevant groups
and green and blue-green algae the dominants. For the identification of different species and
genera different flora were used: Chlorophyta (Chlorococcales) (Komárek and Fott, 1983);
Cryptophyta (Fott, 1968); Cyanobacteria (Geitler, 1932; Komárek and Anagnostidis, 1989;
Komárek and Anagnostidis, 1999) and Euglenophyta (Huber- Pestalozzi, 1961).
Culturable Bacteria
Culturable bacteria were enumerated by the pour-plate method of the convenient dilution,
using TSA (Tryptic Soy Agar) as culture medium and Ringer solution as dilution liquid, and
incubation at 25ºC for 96h. Some colony types were selected according to colony morphology

Capítulo III - Bacterioplankton dynamics during the development of a phytoplankton bloom in a temperate shallow lake
63
and cultural characteristics for further characterization. The selected colonies were isolated in
TSA plates, using the streaking method (Madigan et al., 2000).
The isolates were stored in glycerol until analysis (Madigan et al., 2000).
Each isolate was characterized as to catalase and oxidase activities as well as Gram type.
The presence of motility was observed on the microscope in wet mounts (Madigan et al.,
2000).
Fluorescence In Situ Hybridization (FISH)
The phylogenetic structure of prokaryotic planktonic communities was determined by
Fluorescence In situ Hybridization (FISH) with Cy3-labeled oligonucleotide probes (MWG
Biotech). Sample fixation was performed according to the method described by Glöckner et
al. (1996). Briefly, samples were filtered through 0.2 µm polycarbonate filters (GE Osmonics)
and fixed during 30 m with 4 % paraformaldehyde (Sigma, Aldrich).
For the hybridization with the oligonucleotide probes, some sample were selected
according with to profiles of variation of chemical and biological descriptors, in order to
represent different phases of the bloom development.
Domain and group-specific probes used were Eub338-II-III for Bacteria, Alf968 for α-
proteobacteria, Bet42a for β-proteobacteria, Gam42a for γ-proteobacteria, CF319a for
Cytophaga-Flavobacterium, HGC236 for Actinobacteria, Cya361 for Cyanobacteria and
Arch915 for Archaea. Unlabeled competitor probes were also used for distinguished
Betaproteobateria and Gammaproteobacteria. A negative control probe (Bet42aNM and
Gam42NM) was used to examine non-specific binding. The probe sequences and references
are given in Table 1. For each probe, triplicate filter pieces were placed on a Parafilm-covered
glass slide and overlaid with 30µl of hybridization solution with 3ng.µL-1 of probe (final
concentration). The hybridization solution contained 0.9M NaCl, 20mM Tris-HCl (pH 7.4),
0.01% SDS, and the optimum concentration of formamide for each probe. Filters were
incubated in sealed chambers at 46°C for 90m. After hybridization, filters were washed for 15
min at 48°C in wash solution (20mM Tris HCl pH 7.4, 5mM ethylenediaminetetraacetic acid,
0.01% SDS, and the appropriate concentration of NaCl) (Pernthaler et al., 2002).
After rinsed and dried, the filter pieces were stained with 2 µg.mL-1 DAPI (final
concentration), mounted with Vectashield and Citifluor (1:4) and examined under the
epifluorescence microscope (Leica, DMLS) equipped with a 50-W high-pressure mercury
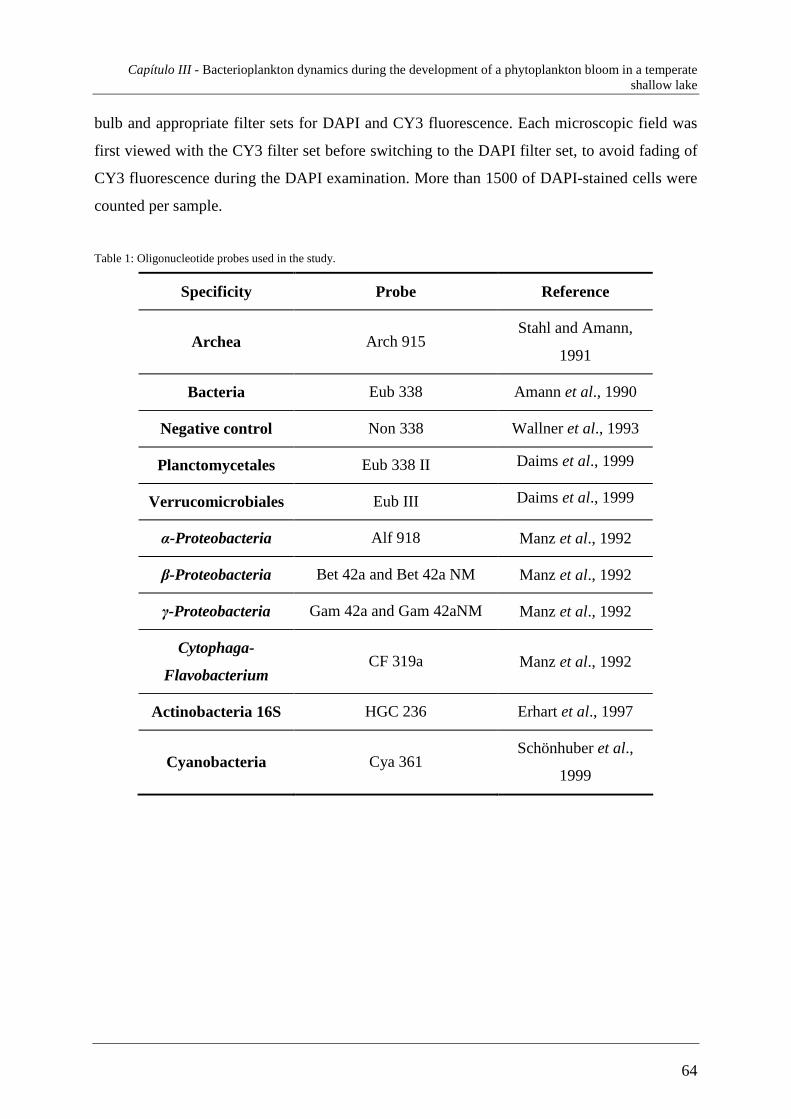
Capítulo III - Bacterioplankton dynamics during the development of a phytoplankton bloom in a temperate shallow lake
64
bulb and appropriate filter sets for DAPI and CY3 fluorescence. Each microscopic field was
first viewed with the CY3 filter set before switching to the DAPI filter set, to avoid fading of
CY3 fluorescence during the DAPI examination. More than 1500 of DAPI-stained cells were
counted per sample.
Table 1: Oligonucleotide probes used in the study.
Specificity Probe Reference
Archea Arch 915 Stahl and Amann,
1991
Bacteria Eub 338 Amann et al., 1990
Negative control Non 338 Wallner et al., 1993
Planctomycetales Eub 338 II Daims et al., 1999
Verrucomicrobiales Eub III Daims et al., 1999
α-Proteobacteria Alf 918 Manz et al., 1992
β-Proteobacteria Bet 42a and Bet 42a NM Manz et al., 1992
γ-Proteobacteria Gam 42a and Gam 42aNM Manz et al., 1992
Cytophaga-
Flavobacterium CF 319a Manz et al., 1992
Actinobacteria 16S HGC 236 Erhart et al., 1997
Cyanobacteria Cya 361 Schönhuber et al.,
1999
Capítulo III - Bacterioplankton dynamics during the development of a phytoplankton bloom in a temperate shallow lake
65
Statistical analysis
In order to assess environmental dynamics during a cyanobacterial bloom, principal
component analysis was performed using FISH absolute abundance data, physical and
chemical parameters (Aguilera et al., 2007). With the aim of identifying the major
environmental factors regulating prokaryote dynamics, a stepwise multiple regression analysis
was performed using conductivity, PO43-, NO3
-, total solids, volatile solids, chlorophyll a,
total DAPI, Archaea, α-Proteobacteria, β-Proteobacteria, γ-Proteobacteria and
Actinobacteria and absolute counts as independent variables and biological parameters (Total
DAPI counts, Archaea, Bacteria, α-Proteobacteria, β-Proteobacteria, γ-Proteobacteria,
Actinobacteria and Cyanobacteria counts) as dependent variables (Pallant, 2004).
Collinearity was verified by the Spearman’s test. All the statistical analysis were performed
using SPSS 14.0 package.

Capítulo III - Bacterioplankton dynamics during the development of a phytoplankton bloom in a temperate shallow lake
66
RESULTS
Physical and chemical parameters
During the sampling period, the water temperature presented an average value of
22.5±2.4ºC, varying between 17.2 and 27.5 ºC. The values of conductivity varied between
566 and 641µS.cm-1, being the average value of 606±21 µS.cm-1 (Figure 1). The recorded pH
values varied from 7.75 to 9.82, presenting an average value of 8.63±0.55 (Figure 2). The
percentage saturation of dissolved O2 showed wide amplitude (minimum of 58.4% and a
maximum of 173.3%) with a value of 110.9±22.9% (Figure 2). The highest pH value was
observed in the same day as the maximum of dissolved oxygen, at the end of the sampling
period (sample 25, June 5th 2006).
16
18
20
22
24
26
28
1 3 5 7 9 11 13 15 17 19 21 23 25 27 29 31
Sample
Wat
er te
mp.
(ºC
)
560
580
600
620
640
660
Con
duct
ivity
(µ
S/c
m)
Water temp Conductivity
7.5
8.0
8.5
9.0
9.5
10.0
1 3 5 7 9 11 13 15 17 19 21 23 25 27 29 31
Sample
55
75
95
115
135
155
175
195pH Oxygen
10
15
20
25
30
35
40
45
50
55
1 3 5 7 9 11 13 15 17 19 21 23 25 27 29 31
Sample
Par
ticul
ate
Mat
ter
(mg/
L)
0
10
20
30
40
50
60
70
80
90
100
Chl
a (
µg/
L)
TS VS Cloroplyll a
Figure 1 – Variation of water temperature and conductivity in Lagoa da Vela, during the sampling period.
Figure 2 – Variation of pH and oxygen concentration (saturation %), in Lagoa da Vela, during the sampling period.
Figure 3 – Variation of total and volatile solids and chlorophyll a, in Lagoa da Vela, during the sampling period.
Figure 4 – Variation of nitrate, phosphate and ammonia, in Lagoa da Vela, during the sampling period.
1
3
5
7
9
11
13
15
17
19
21
23
1 3 5 7 9 11 13 15 17 19 21 23 25 27 29 31
Sample
C(N
O3- ) µ
g/L
and
C(
P) µ
g/L
1
6
11
16
21
26
31
36
41
46
C(N
H4+ ) µ
g.L-1
Nitrates Phosphates Ammonia
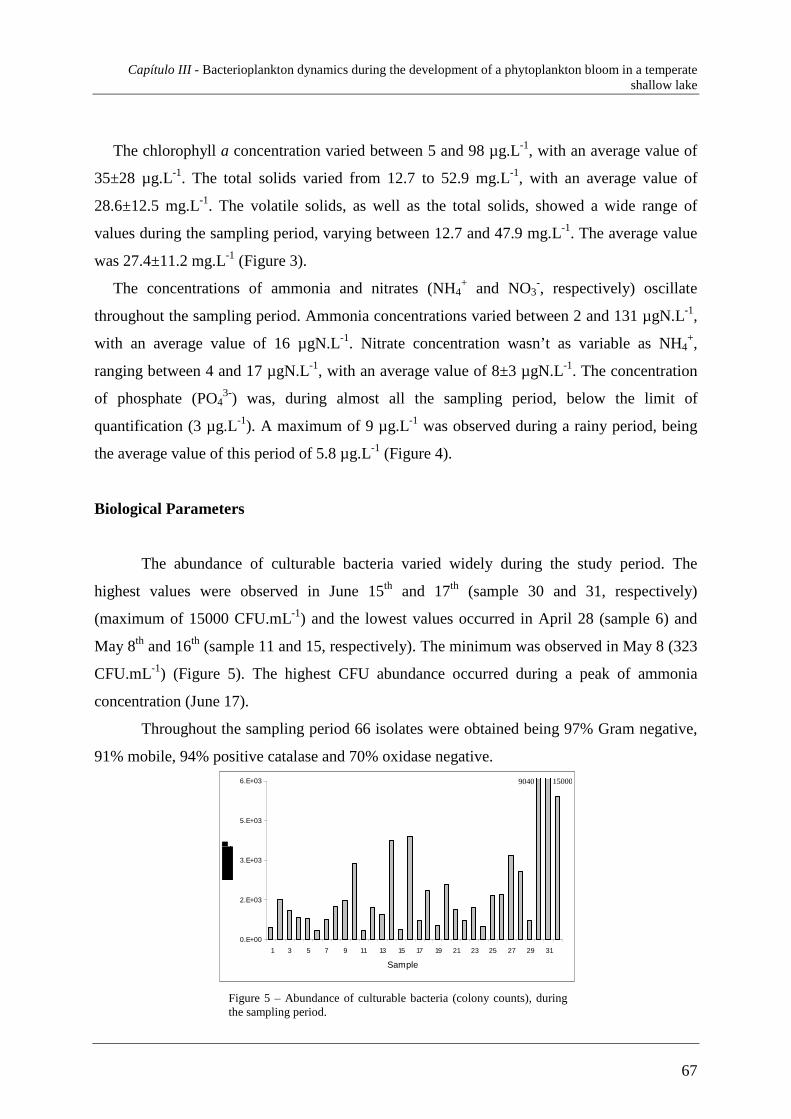
Capítulo III - Bacterioplankton dynamics during the development of a phytoplankton bloom in a temperate shallow lake
67
The chlorophyll a concentration varied between 5 and 98 µg.L-1, with an average value of
35±28 µg.L-1. The total solids varied from 12.7 to 52.9 mg.L-1, with an average value of
28.6±12.5 mg.L-1. The volatile solids, as well as the total solids, showed a wide range of
values during the sampling period, varying between 12.7 and 47.9 mg.L-1. The average value
was 27.4±11.2 mg.L-1 (Figure 3).
The concentrations of ammonia and nitrates (NH4+ and NO3
-, respectively) oscillate
throughout the sampling period. Ammonia concentrations varied between 2 and 131 µgN.L-1,
with an average value of 16 µgN.L-1. Nitrate concentration wasn’t as variable as NH4+,
ranging between 4 and 17 µgN.L-1, with an average value of 8±3 µgN.L-1. The concentration
of phosphate (PO43-) was, during almost all the sampling period, below the limit of
quantification (3 µg.L-1). A maximum of 9 µg.L-1 was observed during a rainy period, being
the average value of this period of 5.8 µg.L-1 (Figure 4).
Biological Parameters
The abundance of culturable bacteria varied widely during the study period. The
highest values were observed in June 15th and 17th (sample 30 and 31, respectively)
(maximum of 15000 CFU.mL-1) and the lowest values occurred in April 28 (sample 6) and
May 8th and 16th (sample 11 and 15, respectively). The minimum was observed in May 8 (323
CFU.mL-1) (Figure 5). The highest CFU abundance occurred during a peak of ammonia
concentration (June 17).
Throughout the sampling period 66 isolates were obtained being 97% Gram negative,
91% mobile, 94% positive catalase and 70% oxidase negative.
Figure 5 – Abundance of culturable bacteria (colony counts), during the sampling period.
0.E+00
2.E+03
3.E+03
5.E+03
6.E+03
1 3 5 7 9 11 13 15 17 19 21 23 25 27 29 31
Sample
15000 9040

Capítulo III - Bacterioplankton dynamics during the development of a phytoplankton bloom in a temperate shallow lake
68
0%
10%
20%
30%
40%
50%
60%
70%
80%
90%
100%
1 3 5 7 9 11 13 15 17 19 21 23 25 27 29 31
Sample
Chlor . Crypt . Eugl. Cyano.
0
3000
6000
9000
12000
15000
18000
21000
24000
27000
1 3 5 7 9 11 13 15 17 19 21 23 25 27 29 31
Sample
Chlorophyt a Cyanobact eria
Phytoplankton abundance and diversity
The variation of different phytoplankton groups during the sampling period is showed
in Figure 6. The most representative divisions were Cyanobacteria and Chlorophyta, whereas
the Cryptophyta and Euglenophyta had a lower representation and frequency.
Early in the sampling period, Chlorophyta division was predominant, being this
predominance progressively transferred to Cyanobacteria (Figure 6 and 7), while the values of
water temperature, conductivity, pH and dissolved oxygen (Figure 1 and 2) were increasing.
Within Chlorophyta division, there was a variation in species composition, being the genus
Phacotus (Phacotus lenticularis), Coelastrum (Coelastrum pseudomicroporum, Coelastrum
reticulatum), Pediastrum (Pediastrum boryanum, Pediastrum duplex, Pediastrum simplex,
Pediastrum tetras), Scenedesmus (Scenedesmus acuminatus, Scenedesmus acutus,
Scenedesmus oahuensis) and Tetraedron (Tetraedron caudatum, Tetraedron minimum) the
major representatives. The maximum value of Chlorophyta abundance was 27079 cells.mL-1
(sample 2, April 20th) and the minimum was 3707 cells.mL-1 (sample 15, May 16th) (Figure
7).
The Cyanobacteria division began to predominate only when Chlorophyta started to
decline, i. e., after April 20th (sample 2). Microcystis cf. pulveria and Chroococcus
limneticcus were present throughout the sampling period. In June 9th (sample 27), a maximum
value of Cyanobacteria abundance was observed (8342 cels.mL-1) (Figure 7), coinciding with
an Aphanizomenon flos-aquae maximum.
Figure 6 – Seasonal dynamics of Chlorophyta, Cryptophyta, Cyanobacteria and Euglenophyta, during the sampling period.
Figure 7 – Variation of the absolute abundance of Chlorophyta and Cyanobacteria, during the sampling period.

Capítulo III - Bacterioplankton dynamics during the development of a phytoplankton bloom in a temperate shallow lake
69
Abundance and composition of prokaryote groups
Total cell counts, accessed by epifluorescence counts after DAPI staining, varied from
3.03x10¹⁰ cells.L-1 (sample 3, April 22nd) to 9.07x10¹⁰ cells.L-1 (sample 29, June 13th) with an
average value of 6.14x10¹⁰ cell.L-1 (Figure 8).
The community was dominated by Bacteria which, relatively to DAPI counts, varied
between 20.7% (May 6th, sample 10) and 75% (June 17th, sample 31), with an average value
of 50.1% (Table 2 and Figure 9). The lowest value found with Eub338 probe was observed in
a period of very low total and volatile solids concentration (Figure 3). The June 17th (sample
31) showed the highest bacteria abundance (Eub 338 Probe) (Figure 8 and 9), corresponding
to conditions of high ammonia (Figure 4), low oxygen (% saturation) (Figure 2), high
conductivity (Figure 1), high chlorophyll a values (Figure 3), total and volatile solids
concentration in the beginning of a declining phase of the bloom (Figure 3).
Archaea were detected in all samples, ranging from 2.7% (May 6th, sample 10) to
12.2% (June 7th), with an average value of 8.0% (Table 2 and Figure 9). Higher Archaea
abundance occurred during the decline of the Cyanobacterial bloom (Figure 12a).
Figure 8 – Variation of the total cell counts accessed by DAPI staining, during the sampling period.
0.0E+00
1.0E+10
2.0E+10
3.0E+10
4.0E+10
5.0E+10
6.0E+10
7.0E+10
8.0E+10
9.0E+10
1.0E+11
1 3 4 7 8 10 14 16 17 23 26 29 30 31 32
Sample
TN
B (
cells
l-1)
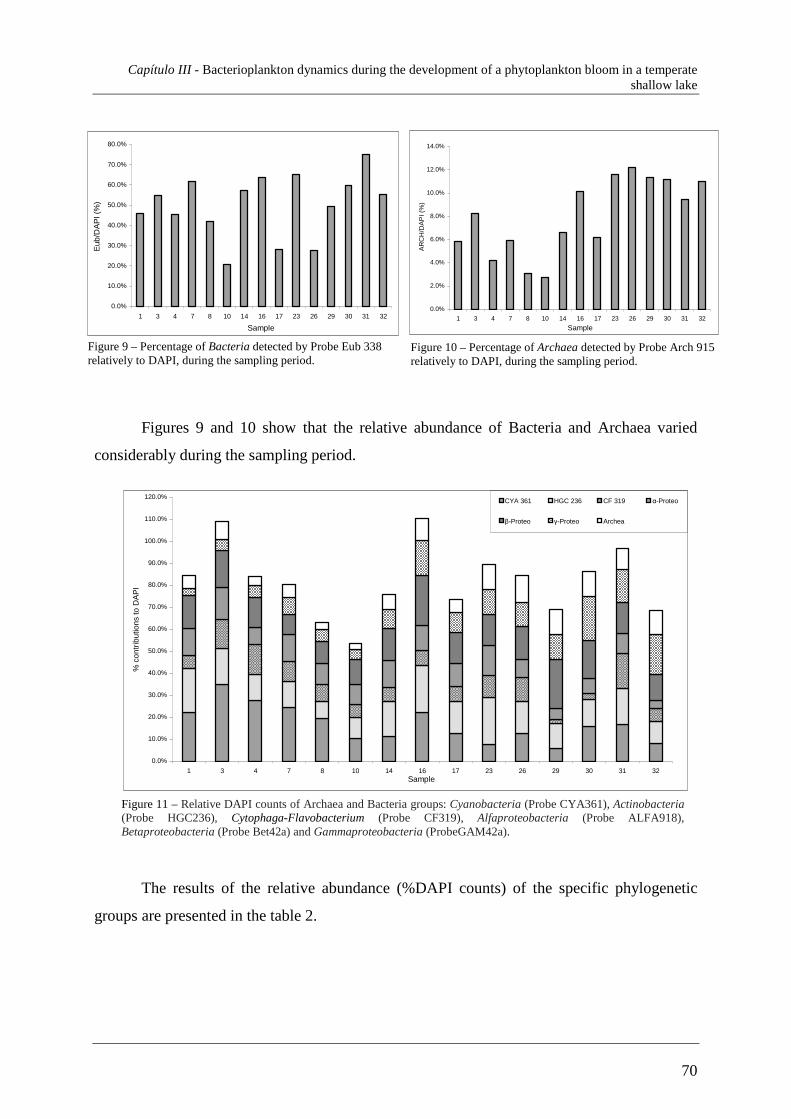
Capítulo III - Bacterioplankton dynamics during the development of a phytoplankton bloom in a temperate shallow lake
70
Figures 9 and 10 show that the relative abundance of Bacteria and Archaea varied
considerably during the sampling period.
The results of the relative abundance (%DAPI counts) of the specific phylogenetic
groups are presented in the table 2.
Figure 9 – Percentage of Bacteria detected by Probe Eub 338 relatively to DAPI, during the sampling period.
Figure 10 – Percentage of Archaea detected by Probe Arch 915 relatively to DAPI, during the sampling period.
Figure 11 – Relative DAPI counts of Archaea and Bacteria groups: Cyanobacteria (Probe CYA361), Actinobacteria (Probe HGC236), Cytophaga-Flavobacterium (Probe CF319), Alfaproteobacteria (Probe ALFA918), Betaproteobacteria (Probe Bet42a) and Gammaproteobacteria (ProbeGAM42a).
0.0%
10.0%
20.0%
30.0%
40.0%
50.0%
60.0%
70.0%
80.0%
1 3 4 7 8 10 14 16 17 23 26 29 30 31 32
Sample
Eub
/DA
PI (
%)
0.0%
2.0%
4.0%
6.0%
8.0%
10.0%
12.0%
14.0%
1 3 4 7 8 10 14 16 17 23 26 29 30 31 32
Sample
AR
CH
/DA
PI (
%)
0.0%
10.0%
20.0%
30.0%
40.0%
50.0%
60.0%
70.0%
80.0%
90.0%
100.0%
110.0%
120.0%
1 3 4 7 8 10 14 16 17 23 26 29 30 31 32Sample
% c
ontr
ibut
ions
to D
AP
I
CYA 361 HGC 236 CF 319 α-Proteo
β-Proteo γ-Proteo Archea

Capítulo III - Bacterioplankton dynamics during the development of a phytoplankton bloom in a temperate shallow lake
71
Table 2: DAPI and probe specific counts relatively to DAPI, during the sampling period.
a Percent of DAPI counts. Numbers have been corrected by subtracting NON338 counts.
Fraction (%) of total cells (mean±SD) detected with probea Day Sample number Total cell counts
(1010cell.L-1) Arc915 Eub338, II & III Αlf918 Bet42 Gam42 CF319 HGC236 Cya361
18-April 1 4.4 ± 7.0E+08 5.8±0.7 45.7±9.8 12.3±1.1 14.9±1.1 3.3±0.1 6.1±0.3 19.7±6.2 22.3±2.2
22- April 3 3.0 ± 0.6E+08 8.2±0.6 54.7±14.7 14.7±1.6 16.7±1.7 4.9±0.4 13.0±0.3 16.3±0.4 34.9±1.4
24- April 4 4.0 ± 0.4E+08 4.2±0.7 45.5±2.8 7.8±0.1 13.2±1.1 5.6±0.8 13.6±3.1 11.8±2.1 27.8±0.2
30-Abr 7 3.1 ± 3.7E+08 5.9±0.3 61.9±14.2 11.9±1.0 9.1±0.9 7.6±0.6 9.4±0.4 11.8±0.6 24.4±7.4
02-May 8 5.0 ± 2.3E+08 3.1±0.3 42.0±14.6 9.6±0.8 10.0±0.3 5.6±0.3 7.6±0.4 7.8±0.2 19.4±4.2
06-May 10 6.2 ± 1.5E+08 2.7±0.1 20.7±4.2 9.2±0.3 11.2±0.5 4.9±0.2 5.9±0.2 9.2±0.5 10.5±1.8
14-May 14 7.4 ± 2.8E+08 6.6±0.3 57.3±1.7 12.3±0.7 14.6±0.8 8.6±0.3 6.6±0.2 15.7±0.2 11.2±1.4
18-May 16 7.1 ± 1.2E+08 10.1±0.4 63.8±0.7 11.3±0.5 22.7±0.6 15.7±0.4 7.1±0.4 21.1±0.5 22.2±0.3
20-May 17 8.6 ± 4.6E+08 6.2±0.1 28.4±9.0 10.4±0.2 14.3±1.0 8.9±0.6 6.9±0.2 14.5±0.4 12.6±0.5
01-June 23 8.0 ± 0.3E+08 11.6±0.3 65.4±0.8 13.8±0.4 13.9±0.6 11.2±0.4 9.9±0.1 21.4±0.8 7.7±0.3
07-June 26 6.3 ± 5.2E+08 12.2±0.5 27.5±0.5 7.9±0.2 15.3±0.3 10.6±1.2 10.9±1.2 14.8±0.9 12.5±0.6
13-June 29 9.1 ± 23.4E+08 11.4±0.5 49.3±2.0 4.9±0.2 22.4±0.8 11.4±0.1 1.6±0.1 11.6±0.3 5.7±0.4
15-June 30 6.4 ± 0.3E+08 11.2±0.5 59.6±1.3 7.1±0.2 17.1±0.7 20.1±1.4 2.6±0.1 12.0±0.2 15.9±0.8
17-June 31 5.3 ± 0.5E+08 9.5±0.5 75.0±5.2 8.8±0.4 14.0±1.1 15.3±3.1 16.3±0.1 16.0±0.3 16.9±0.1
19-June 32 8.2 ± 0.3E+08 11.0±0.2 55.4±3.5 3.8±0.2 11.8±0.7 18.1±0.8 5.8±0.3 10.2±0.8 7.8±5.7
Mean ± σ 6.1 ± 1.9 8.0 ± 3.2 50.14 ± 16.3 9.7 ± 3.1 14.8 ± 3.9 10.1 ± 5.1 8.2 ± 4.0 14.3± 4.3 16.8 ± 8.4
Capítulo III - Bacterioplankton dynamics during the development of a phytoplankton bloom in a temperate shallow lake
72
The detailed analysis of the Bacteria domain (Figures 11 and 12) showed that
Cyanobacteria detected with the Cya361 probe varied, relatively to DAPI counts, between 6.7
(June 13th) and 34.9 (April 22nd), being the average value of 16.8% (Table 2 and Figure 11).
In terms of absolute counts, it was observed a maximum abundance value of 1.58x10¹⁰
cells.L-1 (sample 16, May 18th) and a minimum of 5.14x10⁹ cells.L-1 (sample 29, June 13th).
An initial peak was observed between April 18th and May 18th, decreasing until June 13th,
where a new peak occurs, diminishing again (Figure 12a).
Actinobacteria showed an increasing trend until June 1st, decreasing until the end of
the study period. The minimum absolute value was observed in April 30th (3.7x10⁹ cells.L-1)
and the maximum in June 1st (1.71x10¹⁰ cells.L-1) (Figure 12b). This sub-group accounted for
a minimum of 7.8% (May 2nd) and the maximum of 21.4% (June 1st) of DAPI counts, being
the average value of 14.3% (Table 2 and Figure 11).
The Cytophaga-Flavobacterium (Probe CF319) showed an oscillatory trend, with
three increasing periods: from April 18th to April 24th, from April 26th to June 1st and from
June 13th to June 17th, being the minimum absolute value observed in June 13th (1.49x10⁹
cells.L-1) and the maximum in June 17th (8,73x10⁹ cells.L-1) (Figure 12c). The relative
abundance varied from a minimum of 2.6 (June 15th) to a maximum of 16.3 (June 17th), being
8.2% the average value (Table 2 and Figure 11).
In terms of relative abundance, α-Proteobacteria contribution varied between 3.8%
(June 19th) and 14.7% (April 22nd) with an average value of 9.7% (Table 2 and Figure 11). It
was verified an increasing trend until June 1st (1.10x10¹⁰ cells.L-1) then decreasing to a value
that stayed almost constant until the end of the study period (3.11x10⁹ cells.L-1) (Figure 12d).
β-Proteobacteria showed two periods of increasing abundance (from April 18th to
May 18th and from May 20th to June 13th), decreasing soon after (Figure 12e). The maximum
value was observed after the second increase, in June 13th (2.03x10¹⁰ cells.L-1) and the
minimum in April 30th (2.86x10⁹ cells.L-1) (Figure 12e). This sub-group minimum
contribution to the total Bacteria counts was 9.1% and 22.7% the maximum. The average
value was 14.8% (Table 2 and Figure 11).
γ-Proteobacteria presented an increasing trend until May 18th, maintaining constant
levels up to the end of the study period (Figure 12f). On the first sample (April 18th) the
lowest abundance value was registered, 1.43x10⁹ cells.L-1. The highest was observed in the
last sample (June 19th), 1.49x10¹⁰ cells.L-1 (Figure 12f). This sub-group had a minimum

Capítulo III - Bacterioplankton dynamics during the development of a phytoplankton bloom in a temperate shallow lake
73
Figure 12 - Bacteria total numbers for each probe [a) Cya 361; b)HGC 236; c) CF 319; d) Alf918; e) Bet42a; f) Gam42], detected by FISH, during the sampling period.
contribution of 3.3% (April 18th) and a maximum contribution of 20.1% (June 1st) (average
value of 10.1) to the whole bacteria population (Table 2 and Figure 12f).
0.0E+00
2.0E+09
4.0E+09
6.0E+09
8.0E+09
1.0E+10
1.2E+10
1.4E+10
1.6E+10
1.8E+10
1 3 4 7 8 10 14 16 17 23 26 29 30 31 32
Sample
NT
B (
cell.
ml-1
)
0.0E+00
2.0E+09
4.0E+09
6.0E+09
8.0E+09
1.0E+10
1.2E+10
1.4E+10
1.6E+10
1.8E+10
2.0E+10
2.2E+10
1 3 4 7 8 10 14 16 17 23 26 29 30 31 32Sample
NT
B (
cells
.L-1
)
0.0E+00
2.0E+09
4.0E+09
6.0E+09
8.0E+09
1.0E+10
1.2E+10
1.4E+10
1.6E+10
1.8E+10
2.0E+10
2.2E+10
1 3 4 7 8 10 14 16 17 23 26 29 30 31 32Sample
NT
B (
cells
.L-1
)
0.0E+00
2.0E+09
4.0E+09
6.0E+09
8.0E+09
1.0E+10
1.2E+10
1.4E+10
1.6E+10
1.8E+10
2.0E+10
2.2E+10
1 3 4 7 8 10 14 16 17 23 26 29 30 31 32Sample
NT
B (
cells
.L-1
)
0.0E+00
2.0E+09
4.0E+09
6.0E+09
8.0E+09
1.0E+10
1.2E+10
1.4E+10
1.6E+10
1.8E+10
2.0E+10
2.2E+10
1 3 4 7 8 10 14 16 17 23 26 29 30 31 32Sample
NT
B (
cells
.L-1
)
0.0E+00
2.0E+09
4.0E+09
6.0E+09
8.0E+09
1.0E+10
1.2E+10
1.4E+10
1.6E+10
1.8E+10
2.0E+10
2.2E+10
1 3 4 7 8 10 14 16 17 23 26 29 30 31 32
Sample
NT
B (
cells
.L-1
)
a) b)
c) d)
e) f)

Capítulo III - Bacterioplankton dynamics during the development of a phytoplankton bloom in a temperate shallow lake
74
Principal component analysis
The ordination analysis by PCA (Figure 13) showed that dissolved oxygen and the
abundance of prokaryote groups, with the exception of Cyanobacteria, were mostly
associated to the first axis. This axis is associated to the bloom temporal sequence. On the
negative side are represented the more oxic conditions, characterized by high Cyanobacteria
abundance, dissolved oxygen and nitrate concentration (the bloom fase). Cyanobacteria had a
peak of abundance in May 18th (sample16, Figure 12a), corresponding to low levels of
dissolved oxygen (Figure 2) and nitrates (Figure 4). The positive side describes the less oxic
conditions, characterized by higher bacterial abundance (Actinobacteria, β and γ-
Proteobacteria, Archaea), water temperature, organic matter, conductivity, ammonia and
phosphates (Figure 4) (indicating the bloom decline fase). Actinobacteria, α, β and γ-
Proteobacteria (Figure 12b), d) e) and f)) showed peaks of abundance in samples from 14 to
29. Comparing with the PCA analysis it can be assumed that in this period the decline of the
bloom phase started. Cyanobacteria had a peak on sample 16 (Figure 12a). Cytophaga-
Flavobacterium showed a very oscillatory behaviour (Figure 12c). In the PCA analysis this
sub-group was placed near the origin centre of both axis, indicating that it’s regulation was
Figure 13 – Principle Component Analysis between procaryte total numbers for each probe assessed by epifluorescence microscopy and FISH and physical-chemical parameters, during the sampling period.
0,90,60,30,0-0,3-0,6-0,9
Component 1
0,9
0,6
0,3
0,0
-0,3
-0,6
-0,9
Com
pone
nt 2
Component Plot
O2Cyanobact
PO4AlfaProt
Actinobact
NO3
NH4
pH
CF
TS
VS
Cloroph-a
Conduct
WaterTemp
GamaProt
ArchEub
DAPI BetaProt
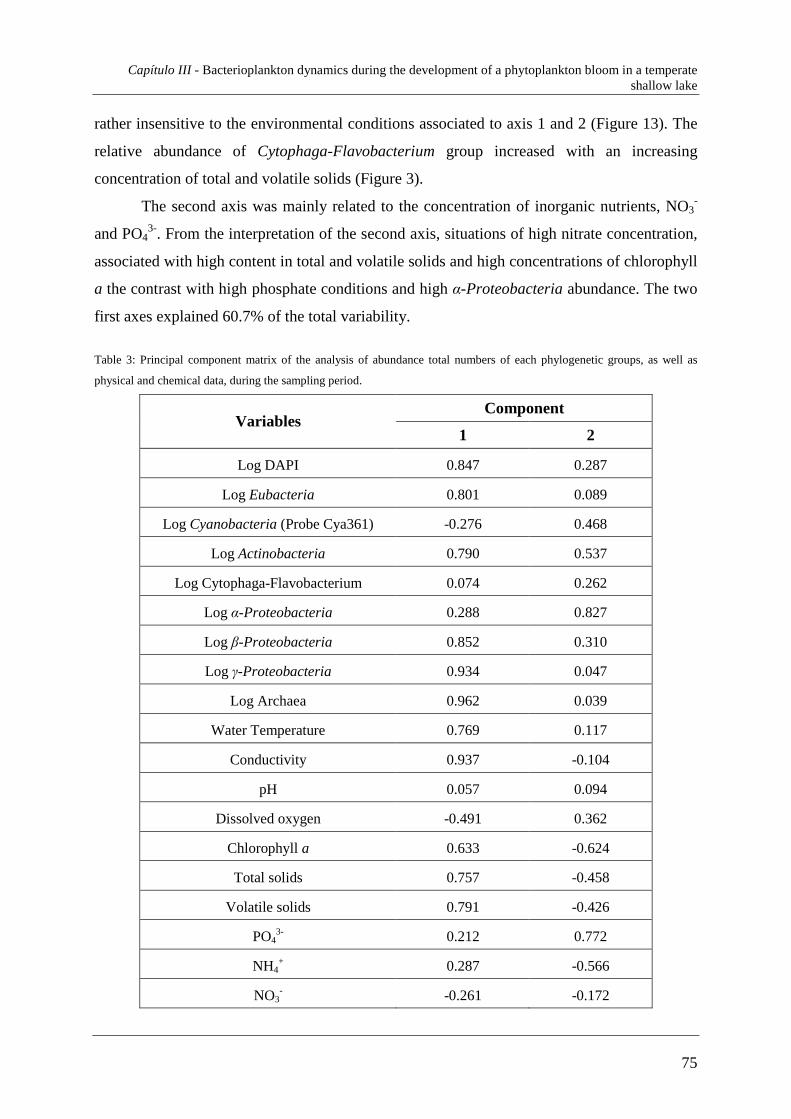
Capítulo III - Bacterioplankton dynamics during the development of a phytoplankton bloom in a temperate shallow lake
75
rather insensitive to the environmental conditions associated to axis 1 and 2 (Figure 13). The
relative abundance of Cytophaga-Flavobacterium group increased with an increasing
concentration of total and volatile solids (Figure 3).
The second axis was mainly related to the concentration of inorganic nutrients, NO3-
and PO43-. From the interpretation of the second axis, situations of high nitrate concentration,
associated with high content in total and volatile solids and high concentrations of chlorophyll
a the contrast with high phosphate conditions and high α-Proteobacteria abundance. The two
first axes explained 60.7% of the total variability.
Table 3: Principal component matrix of the analysis of abundance total numbers of each phylogenetic groups, as well as
physical and chemical data, during the sampling period.
Component Variables
1 2
Log DAPI 0.847 0.287
Log Eubacteria 0.801 0.089
Log Cyanobacteria (Probe Cya361) -0.276 0.468
Log Actinobacteria 0.790 0.537
Log Cytophaga-Flavobacterium 0.074 0.262
Log α-Proteobacteria 0.288 0.827
Log β-Proteobacteria 0.852 0.310
Log γ-Proteobacteria 0.934 0.047
Log Archaea 0.962 0.039
Water Temperature 0.769 0.117
Conductivity 0.937 -0.104
pH 0.057 0.094
Dissolved oxygen -0.491 0.362
Chlorophyll a 0.633 -0.624
Total solids 0.757 -0.458
Volatile solids 0.791 -0.426
PO43- 0.212 0.772
NH4+ 0.287 -0.566
NO3- -0.261 -0.172
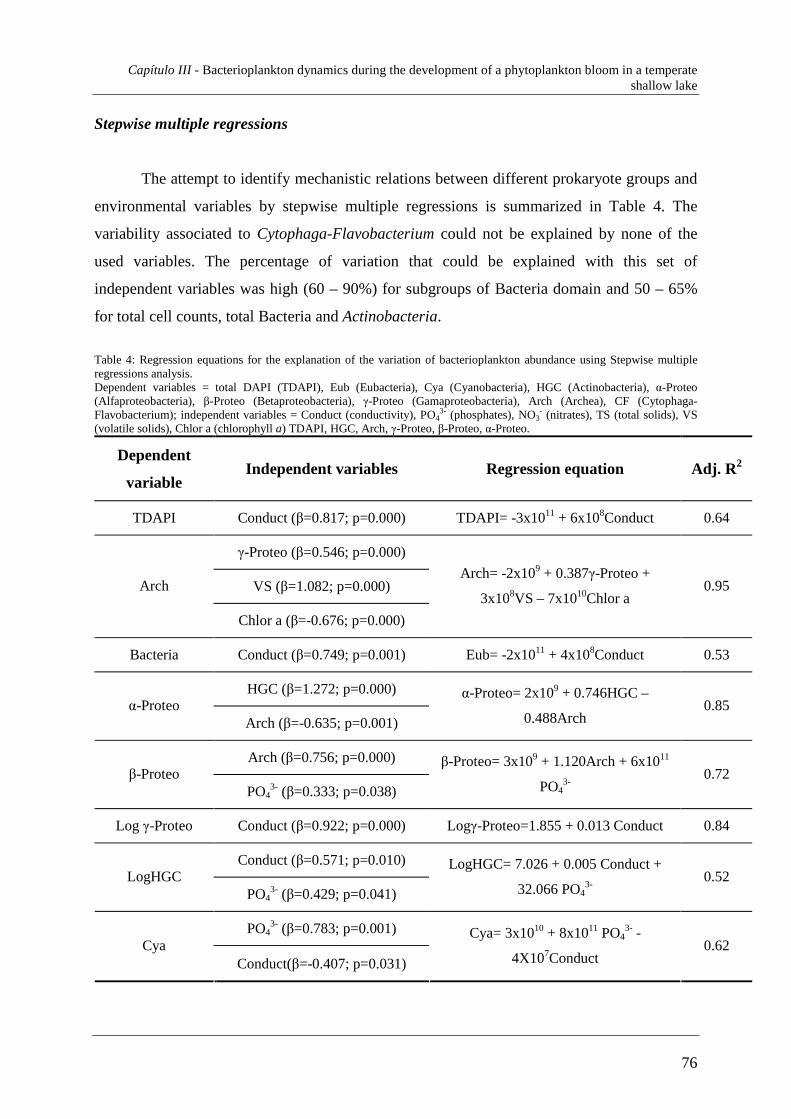
Capítulo III - Bacterioplankton dynamics during the development of a phytoplankton bloom in a temperate shallow lake
76
Stepwise multiple regressions
The attempt to identify mechanistic relations between different prokaryote groups and
environmental variables by stepwise multiple regressions is summarized in Table 4. The
variability associated to Cytophaga-Flavobacterium could not be explained by none of the
used variables. The percentage of variation that could be explained with this set of
independent variables was high (60 – 90%) for subgroups of Bacteria domain and 50 – 65%
for total cell counts, total Bacteria and Actinobacteria.
Table 4: Regression equations for the explanation of the variation of bacterioplankton abundance using Stepwise multiple regressions analysis. Dependent variables = total DAPI (TDAPI), Eub (Eubacteria), Cya (Cyanobacteria), HGC (Actinobacteria), α-Proteo (Alfaproteobacteria), β-Proteo (Betaproteobacteria), γ-Proteo (Gamaproteobacteria), Arch (Archea), CF (Cytophaga-Flavobacterium); independent variables = Conduct (conductivity), PO4
3- (phosphates), NO3- (nitrates), TS (total solids), VS
(volatile solids), Chlor a (chlorophyll a) TDAPI, HGC, Arch, γ-Proteo, β-Proteo, α-Proteo.
Dependent
variable Independent variables Regression equation Adj. R2
TDAPI Conduct (β=0.817; p=0.000) TDAPI= -3x10¹¹ + 6x10⁸Conduct 0.64
γ-Proteo (β=0.546; p=0.000)
VS (β=1.082; p=0.000) Arch
Chlor a (β=-0.676; p=0.000)
Arch= -2x10⁹ + 0.387γ-Proteo +
3x10⁸VS – 7x10¹⁰Chlor a 0.95
Bacteria Conduct (β=0.749; p=0.001) Eub= -2x10¹¹ + 4x10⁸Conduct 0.53
HGC (β=1.272; p=0.000) α-Proteo
Arch (β=-0.635; p=0.001)
α-Proteo= 2x10⁹ + 0.746HGC –
0.488Arch 0.85
Arch (β=0.756; p=0.000) β-Proteo
PO43- (β=0.333; p=0.038)
β-Proteo= 3x10⁹ + 1.120Arch + 6x10¹¹
PO43-
0.72
Log γ-Proteo Conduct (β=0.922; p=0.000) Logγ-Proteo=1.855 + 0.013 Conduct 0.84
Conduct (β=0.571; p=0.010) LogHGC
PO43- (β=0.429; p=0.041)
LogHGC= 7.026 + 0.005 Conduct +
32.066 PO43-
0.52
PO43- (β=0.783; p=0.001)
Cya Conduct(β=-0.407; p=0.031)
Cya= 3x10¹⁰ + 8x10¹¹ PO43- -
4X10⁷Conduct 0.62

Capítulo III - Bacterioplankton dynamics during the development of a phytoplankton bloom in a temperate shallow lake
77
Proteobacteria group was well represented in this study. Gamma-Proteobacteria was
related to conductivity, which explained 84% of the variability of the relative abundance of
this group. More than 70% of the variability of β-Proteobacteria was explained by the
relation with the abundance of Archaea and the availability of PO43- (Table 4).
AlphaProteobacteria was mainly regulated by biotic factors through interactions with other
phylogenetic groups, which explained 85% of the variability. In this study, the organisms
whose DNA contains high (>55%) levels of guanine plus cytosine residues (HGC) were also
counted, accounting for 14% of the total counts (Table 2). Conductivity and PO43-
concentration explained 52% of the observed variability, indicating that it responds mainly to
shifts in the chemical environment.

Capítulo III - Bacterioplankton dynamics during the development of a phytoplankton bloom in a temperate shallow lake
78
DISCUSSION
Cyanobacteria were generally well represented. Aphanizomenon flos-aquae and others
nitrogen fixing cyanobacteria are highly dependent of phosphorus availability, high water
temperature and conductivity (de Figueiredo et al., 2004). In this study, the cyanobacterial
populations that could be detected with the Cya361 probe were mostly regulated by the
chemical environment since the concentration of PO43- and conductivity explained 62% of the
variability (Table 4). Cyanobacterial blooms are associated not only to the increased
availability of organic matter but also to the production of toxic substances and therefore the
interaction with other prokaryote groups may be extremely complex (Pflugmacher, 2002).
The major development of the bloom of primary producers occurred during the second half of
the sampling period with the occurrence of peaks of chlorophyll a, total and volatile solids
(Figure 3) and an increase in water temperature and conductivity (Figure 1). Nitrate
concentration (Figure 4) was reduced to low levels during the first days of the development of
the bloom and oversaturation of dissolved oxygen was also observed (Figure 2). In the
phytoplankton quantification obtained by direct microscope counts it was not verified a
marked variation in the cells number during the sampling period (Figures 6 and 7). This is
probably due to two major technical aspects: the sample sedimentation, so the fluctuant
phytoplankton organisms are not counted; the organism size must be higher then 5µm, thus all
the smaller organisms were not visualized and therefore not accounted. This approach only
demonstrated the phytoplankton successions during the study period.
During this study were found a marked increase in the number of culturable bacteria
(Figure 5) associated with the peak of chlorophyll a, which indicated the establishment of
bloom conditions during the second half of the sampling period. This development was
associated to an increase availability of organic matter that can also be inferred from the high
concentration of volatile solids (Figure 3).
Culture independent approaches such as FISH allow a deeper insight into dynamics of
the whole prokaryote assemblage during the phytoplankton bloom. Total prokaryote
abundance counts (DAPI) increased just before the bloom, probably responding to an increase
in conductivity and in the availability of inorganic nutrients. The values of abundance
remained high during the bloom when algal biomass were probably used as a major source of
substrates for heterotrophic bacteria. The prokaryote community was dominated by Bacteria.
Capítulo III - Bacterioplankton dynamics during the development of a phytoplankton bloom in a temperate shallow lake
79
Archaea were present in all samples in low numbers such as generally found in surface waters
of freshwaters systems (Briee et al., 2007). The negative relation between Archaea and
chlorophyll a in the corresponding regression model, may indicate that the former decrease in
relative importance under bloom conditions. Since Bacteria account for majority of DAPI
counts it is expected that more then 50% of the variability in both counts can be explained by
the same parameter (conductivity).
Heterotrophic bacteria constitute an important part of the pelagic food web by
mineralizing dissolved organic carbon and converting dissolved matter into particulate
biomass available to higher trophic levels through the microbial loop (Azam et al., 1983) with
bacterial activity levels and population dynamics embedded in a web of changing ecological
and biological relationships. Factors such as the concentration of inorganic nutrients (Toolan
et al., 1991; Thingstad and Lingnell, 1993; Torréton et al. 2000, Ferrier-Pagès and Furla,
2001) and the phytoplankton biomass (Williams, 1990; White et al., 1991; Panzenbock et al.,
2000) are involved in the regulation of bacterial growth and abundance, influencing the
success of different groups and ultimately the structure of the prokaryote communities.
Several field and laboratory studies have shown that during the distinct phases of
phytoplankton blooms considerable shifts in bacterioplankton community dynamics can occur
(Fandino et al., 2001, Pinhassi et al., 2004, Riemann et al., 2000). Cytophaga are known to be
important degraders of biomacromolecules. Due to their high degradative capacity, they are
potentially the major contributors to the organic matter degradation, being possible that
different types were physiologically better able to utilize organic matter available at different
bloom stages (Fandino et al., 2001). During a phytoplankton bloom, where high intense
polymer and particle enrichment are expected, high abundance of this group is accepted. This
fact is in accordance with the results obtained in this study, although the authors did not
related with the biotic and abiotic factors studied. Alpha, β and γ -Proteobacteria include
nitrifying bacteria, which are able to grow chemolithotrophically at the expense of reduced
inorganic compounds. The nitrification process of ammonia, in nature, results from the
sequential action of two separate groups of organisms, the ammonia-oxidizing bacteria
(Nitrosomonas and Nitrosococcus) and the nitrite-oxidizing bacteria (Nitrobacter). Nitrifying
bacteria (such as α-Proteobacteria) are widespread in habitats where considerable amounts of
ammonia are present, such as sites where expensive protein decomposition occurs
(ammonification) (Madigan et al., 2000). Pinhassi et al. (2004) observed that α-
Proteobacteria respond positively to nutrient increase. This fact is in accordance with the

Capítulo III - Bacterioplankton dynamics during the development of a phytoplankton bloom in a temperate shallow lake
80
results obtained in the present study, since this group gains importance when the
concentrations of total and volatile solids, chlorophyll a (Figure 3) and phytoplankton (Figure
6 and 7) are rising.
The regression analysis revealed that the variability in the abundance of distinct
prokaryote phylogenetic groups could, in some cases, be mostly regulated by chemical
factors, such as for the globality of the bacterial domain (Eubacteria) the γ subdivision of
Proteobacteria, the Actinobacteria group and the Cyanobacteria or, in other cases, by
biological interactions with other groups such as for α-Proteobacteria or even by both type of
factors, such as for Archaea and β-Proteobacteria, indicating a dual regulation by biotic and
abiotic factors. Remarkingly, the abundance of cyanobacteria was not a relevant factor in the
regression models used for the explanation of the variability of other prokaryote groups. This
can be interpreted as an indication that, in this study, during the phytoplankton bloom,
prokaryote communities interact with primary producers mostly by using DOM-rich exudates,
inferred from significant relations found with chlorophyll a, or by competing with bloom
primary producers for inorganic nutrients and phosphate.
Capítulo III - Bacterioplankton dynamics during the development of a phytoplankton bloom in a temperate shallow lake
81
REFERENCES
Abrantes N., Antunes S.C., Pereira M.J. and Gonçalves F. (2006) Seasonal succession of
cladocerans and phytoplankton and their interactions in a shallow eutrophic lake (Lake Vela,
Portugal) Acta Oecologica 29: 54-64.
Aguilera A., Zettler E., Gomez F., Amaral-Zettler L., Rodriguez N. and Amils R. (2007)
Distribution and seasonal variability in the benthic eukaryotic community of Rio Tinto (SW,
Spain), an acidic, high metal extreme environment. Syst. Apll. Microbiol. 30: 531-546.
Amann R.I., Krumholz L. and Stahl D.A. (1990) Fluorescent-oligonucleotide probing of
whole cells for determinative, phylogenetic, and environmental studies in microbiology. J.
Bacteriol. 172: 762-770.
Antunes S.C., Abrantes N. and Gonçalves F. (2003) Seasonal variation of the abiotic
parameters and the cladoceran assemblage of Lake Vela: comparison with previous studies.
Annales de Limnologie – International Journal of Limnologie 39: 255-264.
APHA (1992) Standard methods for the examination of water and wastewater; 19th ed.
American public health association, Washington, D.C. 991 pp.
Azam F., Fenchel T., Field J.G., Gray J.S., Meyerreil L.A. and Thingstad F. (1983) The
Ecological role of water-columm microbes in the sea. Marine Ecology-Progress Series 10:
257-263.
Briee C., Moreira D. and Lopez-Garcia P. (2007) Archaeal and bacterial community
composition of sediment and plankton from a suboxic freshwater pond. Research in
Microbiology 158: 213-227.
Daims H., Brühl A., Amann R., Schleifer K.-H. and Wagner M. (1999) The domain-specific
probe EUB338 is insufficient for the detection of all Bacteria: Development and evaluation of
a more comprehensive probe set. Syst. Appl. Microbiol. 22: 434-444.

Capítulo III - Bacterioplankton dynamics during the development of a phytoplankton bloom in a temperate shallow lake
82
de Figueiredo D.R., Reboleira A.S.S.P., Antunes S.C., Abrantes N., Azeiteiro U., Gonçalves
F. and Pereira M.J. (2006) The effect of environmental parameters and cyanobacterial blooms
on phytoplankton dynamics of a Portuguese temperate lake. Hydrobiologia 568: 145-157.
de Figueiredo D.R., Azeiteiro U.M., Gonçalves F. and Pereira M.J. (2004) Aphanizomenon
flos-aquae grown under different nutrient concentrtions na the effects of its exudates on
growth of two green algae. Fresenius Environmental Bulletin 13: 657-664.
Eiler. A. and Bertilssom S. (2004) Composition of freshwater bacterial communities
associated with cyanbacterial blooms in four Swedish lakes. Environmental Microbiology 12:
1228-1243.
Erhart R., Bradford D., Seviour R J., Amann R. and Blackall L.L. (1997) Development and
use of fluorescent in situ hybridization probes for the detection and identification of
Microthrix parvicella in activated sludge. Syst. Appl. Microbiol. 20: 310-318.
Fandino L.B., Riemann L., Steward G.F., Long R.A. anf Azam F. (2001) Variations in
bacterial community structure during a dinoflagellate bloom analyzed by DGGE and 16S
rDNA sequencing. Aquat. Microb. Ecol. 23: 119-130.
Ferrier-Pagès C. and Furla P. (2001) Pico-nanoplankton biomass and production in the two
largest atoll lagoons of French Polynesia. Mar. Ecol. Prog. Ser. 211: 63-76.
Fott B. (1968) Das Phytoplankton des Süsswasses, Systematik und Biologie. 3 Teil:
Cryptophyceae, Chloromonadophyceae, Dinophyceae. E. Schweizerbart’sche
Verlagsbuchandlung, Stuttgart.
Geitler L. (1932) “Cyanophyceae” In: Rabenhorst’s, L. (Ed), Kryptogamen-Flora von
Deutschland, Österreich und der Schweiz, band 14. Akademische Verlagsgesellschaft,
Leipzig.
Capítulo III - Bacterioplankton dynamics during the development of a phytoplankton bloom in a temperate shallow lake
83
Glöckner F. O., Amann R., Alfreider A., Pernthaler J., Psenner R., Trebesius K., and Schleifer
K.-H. (1996) An in situ hybridization protocol for detection and identification of planktonic
bacteria. Syst. Appl. Microbiol. 19: 403-406.
Hall A. and Lucas M.F.M.B. (1981) Analysis of ammonia in brackish waters by the
indophenol blue technique: comparison of two alternative methods. Rev. Port. Quim. 23: 205-
211.
Haukka K., Kolmonen E., Hyder R., Hietala J., Vakkilainen K., Kairesalo T., Haario H. and
Sivonen K. (2006) Effect of nutrient loading on bacterioplankton community composition in
lake mesocosms. Microbial Ecology 51: 137-146.
Hiorns W.D., Methé B.A., Nierzwicki-Bauer S.A., Zehr J.P. (1997) Bacterial diversity in
Adirondack mountain lakes as revealed by 16S rRNA gene sequences. Appl. Environ.
Microbiol. 63: 2957-2960.
Höfle M.G., Haas H. and Dominik K. (1999) Seasonal dynamics of bacterioplankton
community structure in a eutrophic lake as determined by 5S rRNA analysis. Appl. Environ.
Microbiol. 65: 3164-3174.
Huber-Pestalozzi G. (1961) Das Phytoplankton des Süsswasses, Systematik und Biologie. 4
Teil: Euglenophyceae. E. Schweizerbart’sche Verlagsbuchandlung, Stuttgart. 606 pp.
Kisand V. and Tammert H. (2000) Bacterioplankton strategies for leucine and glucose uptake
after a cyanobacterial bloom in a eutrophic shallow lake. Soil Biology and Biochemistry 32:
1965-1972.
Komárek J. and Fott B. (1983) Das phytoplankton des Süsswassers, systematic un biologie. 7.
Teil, 1. Hälfte, Chlorophyceae (Grünalgen). Ordnung: Chlorococcales. Scweizerbart’sche
Verlagsbuchhandlung, Stuttgart. 1044 pp.
Komárek J. and Anagnostidis K. (1989) Modern approach to the classification system of
cyanophytes – 4 – Nostocales. Archives of hydrobiology (Supplement 82): 247-345.
Capítulo III - Bacterioplankton dynamics during the development of a phytoplankton bloom in a temperate shallow lake
84
Komárek J. and Anagnostidis K. (1999) Cyanoprokaryota - 1 Teil Chloococcales. In: Ettl, H.,
G. Gärtner, H. Heynig & D. Mollenhauer (Eds). Süβwasserflora von Mitteleuropa, Band 19/1.
G. Fisher Verlag, Jena, Stuttgart, Lübeck, Ulm. 548 pp.
Lindström E.S. (1998) Bacterioplankton community composition in a boreal forest lake.
FEMS Microb. Ecol. 27: 163-174.
Lindström E.S. (2000) Bacterioplankton community composition in five lakes differing in
trophic status and humic content. Microbial Ecology 40: 104-113.
Lorenzen C.J. (1967) Determination of chlorophyll and phaeo-pigments: spectrophotometric
equations. Limnol. Oceanogr. 12: 343-346.
Lund J.W.G., Kipling C. and Le Cren E.D. (1958) The inverted microscope method of
estimating algal numbers and statistical basis of estimations by counting. Hydrobiology 11:
143-170.
Madigan M., Martinko J. and Parker J. (2000) Brock, Biology of Microorganisms; 9th Ed.
Prentice Hall, Inc., Upper Saddle River, New Jersey. 991 pp.
Manz W., Amann R., Ludwig W., Wagner M. and Schleifer K.-H. (1992) Phylogenetic
oligodeoxynucleotide probes for the major subclasses of Proteobacteria: problems and
solutions. Syst. Appl. Microbiol.15: 593-600.
Methé B.A., Zehr J.P. (1999) Diversity of bacterial communities in Adirondack lakes: Do
species assemblages reflect water chemistry? Hydrobiologia 401: 77-96.
Pallant J. (2004) SPSS Survival Manual. Open University Press. 304 pp.
Panzenbock M., Mobes-Hansen B., Albert R. and Herndl G. (2000) Dynamics of Phyto- and
bacterioplankton in a high Artic lake on Franz Joseph Land archipelago. Aquat. Microb. Ecol.
21: 265-273.
Capítulo III - Bacterioplankton dynamics during the development of a phytoplankton bloom in a temperate shallow lake
85
Pernthaler A., Pernthaler J. and Amann R. (2002) Fluorescence In situ Hybridization and
Catalyzed Reporter Deposition for the Identification of Marine Bacteria. Appl. Environ.
Microbiol. 68: 3094-3101.
Pflugmacher S. (2002) Possible allelopathic effects of cyanotoxins, with reference to
Microcystin-LR, in aquatic ecosystems. Environ. Toxicol. 17: 407-413.
Pinhassi J., Sala M.M., Havskum H., Peters F., Guadayol O., Malits A. and Marrasé C. (2004)
Changes in Bacterioplankton Composition under Different Phytoplankton Regimens. Appl.
Environ. Microbiol. 70: 6753-6766.
Riemann L., Steward G.F. and Azam F. (2000) Dynamics of Bacterial Community
Composition and Activity during a Mesocosm Diatom Bloom. Appl. Environ. Microbiol. 66:
578-587.
Rodier J. (1984) L’analyse de l’eau, eaux naturelles, eaux résiduaires, eau de mer (chimie,
physico-chemie, bactériologie, biologie). 7ed. Dunoud, Bordas, Paris. 700 pp.
Schäfer H., Bernard L., Courties C., Lebaron P., Servais P., Pukall R., Stackebrandt E.,
Troussellier M., Guindulain T., Vives-Rego J. and Muyzer G. (2001) Microbial community
dynamics in Mediterranean nutrient-enriched seawater mesocosms: changes in the genetic
diversity of bacterial populations. FEMS Microbiol Ecol 34: 243–253.
Schönhuber W., Zarda B., Eix S., Rippka R., Herdman M., Ludwig W. and Amann R. (1999)
In situ identification of cyanobacteria with horseradish peroxidase- labeled, rRNA-targeted
oligonucleotide probes. Appl. Environ. Microbiol. 65: 1259-1267.
Spatharis S, Tsistsis G., Danielidis D.B., Chi T.D. and Mouillot D. (2007) Effects of pulsed
nutrient inputs on phytoplankton assemblage structure and blooms in an enclosed coastal area.
Estuarine Coastal and Shelf Science 73: 807-815.
Capítulo III - Bacterioplankton dynamics during the development of a phytoplankton bloom in a temperate shallow lake
86
Stahl D.A. and Amann R. (1991). Development and application of nucleic acid probes. In: E.
Stackebrandt and M. Goodfellow (ed.), Nucleic acid techniques in bacterial systematics. pp.
205-248. John Wiley & Sons Ltd., Chichester, England.
Thingstad T.F. and Lignell R. (1993) Phosphorus cycling and algal-bacterial competition in
Sandsfjord, western Norway. Mar. Ecol. Prog. Ser. 13: 9-27.
Toolan T., Wehr J.D. and Findlay S. (1991) Inorganic phosphorus stimulation of
bacterioplankton production in a mesoeutrophic lake. Appl. Environ. Micrbiol. 57: 2074-
2078.
Torréton J.P., Talbot V. and Garcia N. (2000) Nutrient stimulation of bacterioplankton growth
in Tuamotu atoll lagoons. Aquat. Micrb. Ecol. 21: 125-137.
Wallner G., Amann R. and Beisker W. (1993) Optimizing fluorescent in situ hybridization
with rRNA-targeted oligonucleotide probes for flow cytometric identification of
microorganisms. Cytometry 14: 136-143.
White P.A., Kalff J., Rasmussen B. and Gasol J.M. (1991) The effect of temperature and algal
biomass on bacterial production and specific growth rate in freshwater and marine habitats.
Microb. Ecol. 21: 99-118.
Williams P.J. (1990) The importance of losses during microbial growth: commentary on the
physiology, measurement and ecology of the release of dissolved organic material. Mar.
Microb. Food Webs 4: 175-206.
Zwart G., Hiorns W.D., Methé B.A., van Agterveld M.P., Huismans R., Nold S.C., Zehr J.P.
and Laanbroek H.J. (1998) Nearly identical 16S rRNA sequences recovered from lakes in
North America and Europe indicate the existence of clades of globally distributed freshwater
bacteria. System Appl Microbiol 21: 546-556.

Capítulo IV
Discussão geral
Capítulo IV – Discussão geral
88
A eutrofização de sistemas aquáticos é frequentemente causada por excesso em
nutrientes associados a descargas de efluentes e à lixiviação de fertilizantes agrícolas. No
entanto, também pode ocorrer naturalmente, quando existe acumulação de nutrientes
(Spatharis et al., 2007). As actividades humanas podem acelerar este processo, dado que
aumentam o fluxo de nutrientes inorganicos e organicos para o ecossistema.
Os lagos pouco profundos encontram-se especialmente em risco de se tornarem
eutróficos, uma vez que estão sujeitos a efeitos top-down (Blanco et al., 2003; Gyllstrom et
al., 2005).
No trabalho realizado foi possível observar as relações tróficas existentes entre
fitoplancton, bacterioplancton e vírus e avaliar quais os factores reguladores do
fitoplancton, no sistema eutrofizado da Lagoa da Vela. Assim, podem ser enumerados três
factores: nutricionais, alelopáticos e virais.
� Factores nutricionais
Vários estudos laboratoriais e de campo (Williams, 1990; White et al., 1991;
Panzenbock et al., 2000) correlacionam a biomassa de fitoplâncton, bacterioplâncton e
produção bacteriana. Panzenbock e colaboradores (2000) concluíram que as bactérias
podem, receber directamente matéria orgânica do fitoplâncton, quer através da exsudação
por parte de células saudáveis, quer através da lise celular. Não obstante, estes mesmos
factores influenciam o sucesso de determinados grupos e, consequentemente, a estrutura da
comunidade procariota.
Utilizando abordagens independentes de cultivo bacteriano, como a técnica de FISH, é
possível avaliar a dinâmica da comunidade procariota de uma forma mais abrangente.
Assim, foi possível verificar um aumento da abundância de procariotas após o bloom,
período em que também foi verificado um aumento da condutividade e dos nutrientes
disponíveis. Dado que estes valores se mantiveram em níveis elevados durante o bloom, é
possível inferir que a biomassa de fitoplâncton serviu de fonte primordial de substratos
para as bactérias heterotróficas. Esta tendência está de acordo com o observado em outros
estudos (Sundh, 1992) que verificaram que o carbono orgânico dissolvido (DOC) libertado
pelo fitoplâncton é uma importante fonte de carbono para as bactérias heterotróficas.
Capítulo IV – Discussão geral
89
Tem sido demonstrado que as bactérias heterotróficas competem, com sucesso, por
nutrientes inorgânicos com o fitoplâncton (Thingstad et al., 1993). As bactérias têm,
aproximadamente, potenciais de absorção de nutrientes inorgânicos 100 vezes mais
elevados que o fitoplâncton (Blackburn et al., 1998) com baixas concentrações de
nutrientes inorgânicos, a vantagem competitiva do bacterioplâncton sobre o fitoplâncton, é
uma ideia consensual (Torréton et al., 2000). A competição entre bactérias e fitoplâncton
por nutrientes inorgânicos dissolvidos levanta algumas questões, apontadas por Kirchman
(1994). Limitações nutritivas severas podem resultar na produção (ou eventual libertação)
de matéria organica com elevados rácios de C:N e C:P. A consequente utilização destes
materiais pelas bactérias plantónicas irá gerar uma necessidade intracelular de azoto (ou
fósforo), estimulando assim a absorção de nutrientes orgânicos dissolvidos pelas bactérias
(Caron, 1994). Assim, dependendo da velocidade a que a absorção ocorre, a vantagem será
ou das bactérias ou do fitoplâncton.
Associações entre fitoplâncton e bactérias ocorrem quer durante a fase crescimento,
quer durante a fase de senescência de um bloom. Estas interacções podem conduzir a uma
optimização paralela dos potenciais de crescimento entre bactérias e fitoplâncton, podendo
também reflectir adaptações ecológicas e fisiológicas mutuamente benéficas (Gons et al.
2002; de Figueiredo et al., 2006). O fitoplâncton, e em particular as cianobactérias, pode
também tirar vantagem da associação, uma vez que é sensível à deficiente disponibilidade
de CO2 (Pearl, 1996). As bactérias associadas à ficoesfera, podem suprir esta deficiência
através do processo de mineralização, que recicla o CO2. As bactérias da ficoesfera podem
ainda aumentar os potenciais de fixação de N2 de cianobactérias fixadoras de azoto (Pearl,
1996), tornando-as assim mais eficazes sobre outras que também tenham a mesma
capacidade, mas não tão apurada.
Durante diferentes fases do bloom, ocorrem alterações na dinâmica da comunidade de
bacterioplâncton (Fandino et al., 2001; Pinhassi et al., 2004; Riemann et al., 2000). O
género Cytophaga, conhecido pela sua elevada capacidade de degradação de matéria
orgânica em diferentes fases de bloom (Fandino et al., 2001), manteve-se bem
representado durante todo o período de amostragem.
O Filo Proteobacteria inclui as bactérias nitrificantes (α, β e γ). Estas estão
amplamente distribuídas em habitats onde existam elevadas quantidades de amónia, ou
seja, onde ocorra elevada decomposição proteica (Madigan et al., 2000). Durante o período
Capítulo IV – Discussão geral
90
de amostragem, α-Proteobacteria apresentou abundância crescente coincidente com
aumentos de sólidos voláteis e totais e abundância de fitoplâncton. Isto está de acordo com
observações de outros autores (Pinhassi et al., 2004) que demonstram relações positivas
deste subgrupo com aumentos de nutrientes inorgânicos.
A análise de regressão permite inferir que, durante o bloom, as comunidades
procariotas interagem com os produtores primários usando os exsudados de matéria
orgânica fornecidos pela comunidade fitoplanctónica.
� Factores virais
Os vírus são parasitas obrigatórios que podem determinar a diversidade das espécies
bacterianas (Weinbauer & Rassoulzadegan, 2004). Embora sejam agentes infecciosos de
pequenas dimensões, a sua elevada abundância atribui-lhes um papel importante no
controlo estrutura e função das comunidades bacterianas dos ecossistemas de água doce
(Manage et al., 1999; Weinbauer, 2004). A sua especificidade em relação aos hospedeiros
implica que possam alterar significativamente a estrutura das comunidades de bactérias e
microalgas.
Devido a grandes avanços técnicos durante os anos 90, verificou-se que, nos sistemas
aquáticos, estes organismos constituem uma componente dinâmica e significativa das
comunidades microbianas (Suttle et al., 1990). O número de vírus num sistema aquático
normalmente excede de 10 a 100 vezes mais o numero de bactérias (Hennes et al., 1995).
Estima-se que, diariamente, aproximadamente 20% de bactérias heterotróficas e 51% de
cianobactérias são destruídas por lise viral (Fuhrman & Suttle, 1993; Suttle, 1993). Desta
forma, os vírus desempenham papéis importantes no ciclo de nutrientes e na estruturação
da comunidade microbiana (Fuhrman, 1999; Fuhrman, 2000).
Durante o bloom de fitoplâncton, verificou-se uma correlação positiva entre a
abundância de vírus e bactérias, tal como o descrito para outros sistemas aquáticos
(Wommack & Colwell, 2000; Fischer & Velimirov, 2002; Bettarel et al., 2003; Vrede et
al., 2003). Por outro lado, existem vários estudos (Boehme et al., 1993; Maranger & Bird,
1995; Weinbauer et al., 2004) que apontam uma correlação entre os vírus e a concentração
de clorofila a. Baixos rácios de vírus/bactérias, frequentemente observados neste estudo,
parecem indicar que, durante um bloom, uma grande fracção de vírus infecta células de
Capítulo IV – Discussão geral
91
fitoplâncton. Desta forma, e de acordo com o descrito por Maranger & Bird (1995), o
fitoplâncton pode representar um reservatório hospedeiro importante para o virioplâncton.
No entanto, os valores médios de viruses-to-bacteria ratios (VBR) obtidos encontram-se
muito abaixo do esperado para este tipo de sistema (Wommack & Colwell, 2000). Assim, é
possível aferir que a dinâmica viral pode ter resultado da contribuição conjunta de
bacteriófagos, cianófagos e vírus parasitas de algas.
Capítulo IV – Discussão geral
92
Referências
Blackburn N., Fenchel T. & Mitchel J. (1998) Microscale nutrients patches in planktonic
habitats shown by chemotactic bacteria. Science 282: 2254-2256.
Blanco S., Romo S., Villena M.J. & Martínez S. (2003) Fish communities and food web
interactions in some shallow Mediterranean lakes. Hydrobiologia 506: 473-480.
Bettarel Y., Sime-Ngando T., Amblard C., Carrias J.F. & Portelli C. (2003) Virioplankton
and microbial communities in aquatic systems: a seasonal study in two lakes of differing
trophy. Fresh. Biol. 48: 810-822.
Boehme J., Frischer M.E., Jiang S.C., Kellogg C.A., Pichard S., Rose J.B., Steinway C. &
Paul J.H. (1993) Viruses, bacterioplankton and phytoplankton in the southeastern Gulf-of-
Mexico distribution and contribution to oceanic DNA pools. Mar. Ecol. Progr. Ser. 7: 1-
10.
Caron D.A. (1994) Inorganic nutrients, bacteria and the microbial loop. Microb. Ecol. 28:
295-298.
de Figueiredo D.R., Reboleira A.S.S.P., Antunes S.C., Abrantes N., Azeiteiro U.M.,
Gonçalves F., Pereira M.J. (2006) The effect of environmental parameters and
cyanobacterial blooms on phytoplankton dynamics of a Portuguese temperate lake.
Hydrobiologia 568: 145-157.
Fandino L.B., Riemann L., Steward G.F., Long R.A. & Azam F. (2001) Variations in
bacterial community structure during a dinoflagellate bloom analyzed by DGGE and 16S
rDNA sequencing. Aquat. Microb. Ecol. 23: 119-130.
Fischer U.R. & Velimirov B. (2002) High control of bacterial production by viruses in a
eutrophic oxbow lake. Aquat. Microb. Ecol. 27: 1-12.

Capítulo IV – Discussão geral
93
Fuhrman J.A. & Suttle C.A. (1993) Viruses in marine planktonic systems. Oceanography
6: 50-62.
Fuhrman J. (1999) Marine viruses and their biogeochemical and ecological effects. Nature
399: 541-548.
Fuhrman J. (2000) Impact of viruses on bacterial processes. In: D.L. Kirchman (ed.),
Microbial ecology of the oceans. John Wiley & Sons Inc., New York, N.Y. p. 327-350.
Gons H.J., Ebert J., Hoogveld H.L., van den Hove L., Pel R., Takkenberg W. & Woldringh
C.J. (2002) Observations on cyanobacterial population collapse in eutrophic lake water.
Antoine van Leeuwenhoek Intern. J. Gen. and Molec. Microbiol. 81: 319-326.
Gyllstrom M., Hansson L.A., Jeppesen E., García-Criado F., Gross E., Irvine K., Kairesalo
T., Kornijow R., Miracle M.R., Nykanen M., Nõges T., Romo S., Stephen D., van Donk E.
& Moss B. (2005) The role of climate in shaping zooplankton communities of shallow
lakes. Limnol. and Oceanog. 50: 2008-2021.
Hennes K.P., Suttle C.A. & Chan A.M. (1995) Fluorescently labelled virus probes show
that natural virus populations can control the structure of marine microbial communities.
Appl. Environ. Microbiol. 61: 3623-3627.
Kirchman D. (1994) The uptake of inorganic nutrients by heterotrophic bacteria. Microb.
Ecol. 28: 255-271.
Madigan M., Martinko J. & Parker J. (2000) Brock, Biology of Microorganisms; 9th Ed.
Prentice Hall, Inc., Upper Saddle River, New Jersey. p. 991.
Manage P.M., Kawabata Z. & Nakano S. (1999) Seasonal changes in densities of
cyanophage infectious to Microcystis aeruginosa in a hyper eutrophic pond. Hydrobiologia
411: 211-216.
Capítulo IV – Discussão geral
94
Maranger R. & Bird D.F. (1995) Viral abundance in aquatic systems – comparison
between marine and fresh-waters. Mar. Ecol. Prog. Ser. 121: 217-226.
Panzenbock M., Mobes-Hansen B., Albert R. & Herndl G. (2000) Dynamics of phyto- and
bacterioplankton in a high Artic lake on Franz Joseph Land archipelago. Aquat. Microb.
Ecol. 21: 265-273.
Pearl H.W. (1996) Microscale physiological and ecological studies of aquatic
cianobactéria: macroscale implications. Microscopy research and technique 33: 47-72.
Pinhassi J., Sala M.M., Havskum H., Peters F., Guadayol O., Malits A. & Marrasé C.
(2004) Changes in bacterioplankton composition under different phytoplankton regimens.
Appl. and Environ. Microbiol. 70: 6753-6766.
Riemann L., Steward G.F. & Azam F. (2000) Dynamics of Bacterial Community
Composition and Activity during a Mesocosm Diatom Bloom. Appl. and Environ.
Microbiol. 66: 578-587.
Sundh I. (1992) Biochemical composition of dissolved organic carbon derived from
phytoplankton and used by heterotrophic bacteria. Applied and Environm. Mycrob. 58:
2938-2947.
Suttle C.A., Chan A.M. & Cottrell M.T. (1990) Infection of phytoplankton by viruses and
reduction of primary productivity. Nature 347: 467-469.
Suttle C.A. (1993) Enumeration and isolation of viruses. In Kemp P.F., Sherr B.R., Sherr
E.B. & Cole J.J. (eds.), Aquatic microbial ecology. Lewis Publishers, Boca Raton, p. 121-
134.
Spatharis S, Tsistsis G., Danielidis D.B., Chi T.D. & Mouillot D. (2007) Effects of pulsed
nutrient inputs on phytoplankton assemblage structure and blooms in an enclosed coastal
area. Estuarine, Coastal and Shelf Science 73: 807-815.

Capítulo IV – Discussão geral
95
Thingstad T.F., Skjoldal E.F. & Bohne R.F. (1993) Phosphorus cycling and algal-bacterial
competition in Sandsfjord, western Norway. Mar. Ecol. Prog. Ser. 99: 239-259.
Torréton J.P., Talbot V. & Garcia N. (2000) Nutrient stimulation of bacterioplankton
growth in Tuamotu atoll lagoons. Aquat. Microb. Ecol. 21: 125-137.
Vrede K., Stensdotter U. & Lindstrom E.S. (2003) Viral and bacterioplankton dynamics in
two lakes with different humic contents. Microb. Ecol. 46: 406-415.
Weinbauer M.G., Fuks D., Puskaric S. & Peduzzi P. (2004) Diel, seasonal and depth-
related variability of viruses and dissolved DNA in the northern Adriatic sea. Microb. Ecol.
30: 25-41.
Weinbauer M.G. (2004) Ecology of prokaryotic viruses. FEMS Microbiol. Rev. 28: 127-
181.
Weinbauer M.G. & Rassoulzadegan F. (2004) Mini-review: are viruses driving microbial
diversification and diversity. Environ. Microbiol. 6: 1-11.
Williams P.J. (1990) The importance of losses during microbial growth: commentary on
the physiology, measurement and ecology of the release of dissolved organic material.
Mar. Microb. Food Webs 4: 175-206.
White P.A., Kalff J., Rasmussen B. & Galson J.M. (1991) The effect of temperature and
algal biomass on bacterial production and specific growth rate in freshwater and marine
habitats. Microb. Ecol. 21: 99-118.
Wommack K.E. & Colwell R.R. (2000) Virioplankton: virus in aquatic ecosystems.
Microb. and Molec. Biol. Rev. 64: 69-114.
Recommended