World Union of Jewish Studies / האיגוד העולמי למדעי היהדות
PLANNING THE UNITED STATES JEWISH POPULATION STUDY: Toward Insight intoAmerican-Jewish Demography and IdentityAuthor(s): Fred MassarikSource: Proceedings of the World Congress of Jewish Studies / דברי הקונגרס העולמי למדעיVolume V, DIVISION V: RESEARCH PROJECTS-REPORTS AND ARTICLES ,היהדות, כרך הBASED ON THE PROJECTS' FINDINGS; JEWISH DEMOGRAPHY / כרך ה, חטיבה ה: מפעלימחקר בתחום מדעי היהדות: דינים-וחשבונות ומאמרים מדעיים, המבוססים על תוצאות מפעליהמחקר; מאמרים בדמוגרפיה יהודית*pp. 251*-263 תשכ"ט / 1969Published by: World Union of Jewish Studies / האיגוד העולמי למדעי היהדותStable URL: http://www.jstor.org/stable/23524112 .
Accessed: 13/06/2014 00:05
Your use of the JSTOR archive indicates your acceptance of the Terms & Conditions of Use, available at .http://www.jstor.org/page/info/about/policies/terms.jsp
.JSTOR is a not-for-profit service that helps scholars, researchers, and students discover, use, and build upon a wide range ofcontent in a trusted digital archive. We use information technology and tools to increase productivity and facilitate new formsof scholarship. For more information about JSTOR, please contact [email protected].
.
World Union of Jewish Studies / האיגוד העולמי למדעי היהדות is collaborating with JSTOR todigitize, preserve and extend access to Proceedings of the World Congress of Jewish Studies /דברי הקונגרס העולמי למדעי היהדות
http://www.jstor.org
This content downloaded from 62.122.79.40 on Fri, 13 Jun 2014 00:05:47 AMAll use subject to JSTOR Terms and Conditions
PLANNING THE
UNITED STATES JEWISH POPULATION STUDY:
Toward Insight into American-Jewish Demography and Identity
Fred Massarik
Los Angeles
For the United States Study of Jewish Population, this is a moment of
progress and confluence. Several basic streams of activity presently
converge, rooted in more than a decade of development. This status
report highlights several current key issues, following a brief review of
the Study's history, concept and design. This paper cannot, of course, elaborate the mass of particulars specified by the Study's scientific
directors and technical staff.1 These details, including questionnarire and
interview content, sample plans, field work cost equations and the like
will appear in a series of final report documents, 1973-74.2
I. Recapitulation of the Study's History
In 1961, it was proposed by this author to the Council of Jewish Federa
tions and Welfare Funds, a U.S. national advisory and coordinating
agency for Jewish communal activities, that it assume leadership in deve
lopmentof the first nation-wide study of the U.S. Jewish population. As is
well-known, the principle of separation of church and state, while subject to somewhat varied interpretations by Jewish organizations and other
groups, has the effect of preventing the U.S. Census from including
religious queries in its decennial count. Thus, community studies and
1. The Associate Scientific Directors include (in 1969) Dr. Morris Axelrod, Director,
Survey Research Program, Harvard-M.I.T. Joint Center for Urban Studies;
Stanley K. Bigman, Senior Associate, Washington (D.C.) Center for Metropolitan
Studies; Alvin Chenkin, Supervisor, Department of Statistics, Council of Jewish
Federations and Welfare Funds, New York; Professor Sidney Goldstein, Chairman,
Department of Sociology and Anthropology, Brown University, Providence, Rhode
Island; Saul Kaplan, Research Director, Chicago (Illinois) Jewish Federation; Pro
fessor Bernard Lazerwitz, Director, Public Opinion Survey Unit, University of
Missouri; and Professor Albert J. Mayer, Department of Sociology, State University,
Temple, Arizona. Yehuda Lev, was Research Manager.
2. Address requests to Fred Massarik, Scientific Director, U. S. National Jewish
Population Study RSB, Rm. 304 590 N. Vermont Ave..Los Angeles, Calif. 90004.
251 י
This content downloaded from 62.122.79.40 on Fri, 13 Jun 2014 00:05:47 AMAll use subject to JSTOR Terms and Conditions
252* FRED MASSARIK
incidental data contained in occasional national surveys have been the
usual sources of systematic information on the U.S. Jewish population.
Further, it was recognized that, even had it been possible to include a
religion question in the Census, the need for greater richness of infor
mation on specifically Jewish topics (e.g. Jewish education, identity,
observances, etc.) would have necessitated a separate, major study. Upon consultations with scholars at the Hebrew University,3 a series of techni
cal memoranda were prepared as basis for discussion,4 funding obtained,5 and a design elaborated.6
II. Study Concept and Design
A complete enumeration of the U.S. Jewish population under non
governmental auspices is, of course, financially and technically unfeasible.
Instead, a sampling survey of substantial scale must suffice. While, of course, anyone would be pleased to obtain the largest possible rep resentative sample size, inevitable compromises between ideal and reality
(together with improvements in sampling methodology), have established
the range of 10,000 to 12,000 Jewish interviews as target. The actual
number of completed, detailed Jewish household interviews is near 7,500,
augmented by several thousand mail questionnaires. The sample design is based on a multi-stage concept, making use of
several levels of stratification. It takes account of the problem of defining Jewishness for research purposes, and of the manifest impossibility of
establishing a convenient sample frame that would list, item by item, all
relevant potential respondent households. As will be noted later, the use
of available lists of Jewish households, except in rare instances, fails to
provide an adequate basis for sampling, although lists can be used in
conjunction with area probability procedures. Thirty-nine strata are defined, taking into account geography and
estimated Jewish population size. Of these, eighteen, with estimated
Jewish populations of approximately 30,000 and up per stratum, are self
3. Especially Professors Moshe Davis and Roberto Bachi, and Drs. Gad Nathan
and U. O. Schmelz.
4. Prepared by Dr. Gad Nathan.
5. By the Council of Jewish Federations and Welfare Funds, N.Y. with the pro fessional leadership of Philip Bernstein and Dan Rosenberg.
6. Through the CJFWF Technical Advisory Committee, composed of the Associate
Scientific Directors, and by the Research Manager, with the aid of external consultants,
including the late Dr. William Hurwitz, U.S. Census, Professor Raymond Jessen,
University of California, Los Angeles, and others.
This content downloaded from 62.122.79.40 on Fri, 13 Jun 2014 00:05:47 AMAll use subject to JSTOR Terms and Conditions
ÜNlTEt) STAtES JEWISH EOPÜLATIÖH SfUDY 253*
representing.Twenty strata are sampled with varying probabilities ranging from .50 to about .07. According to American Jewish Yearbook figures, (1968), the self-representing strata contain 4,734,000 of the estimated
Jewish population of about 5,779,000, about 82 %. Primary sampling units selected from the balance of the strata, contain an estimated Jewish
population of roughly 242,000, or slightly more than an additional 4 %-To the extent to which present figures may be relied on (and on the macro
level there is some support for their adequacy),7 we conclude that the
Study will have contact with communities that in their totality contain
approximately 86 % of the U.S. Jewish population.
The remaining stratum consists of the more than two-thousand counties
for which no Jewish population is shown at present. There are indications
that indeed these counties contain only a very small number of Jewish
households.8 Nonetheless, a sample of such counties is drawn atafrac
tion of .01 to .02 or less.
To provide a sense of the variety of communities included, here follows
a listing of the primary sampling units (showing principal community or
popular designation). In each instance, definitions of U.S. Census Stand
ard Metropolitan Areas and patterns of Jewish population distribution
are considered:9
1. Los Angeles, California
2. San Francisco-Oakland, California
3. Washington, D.C.
4. Miami, Florida
5. Chicago, Illinois
6. Baltimore, Maryland 7. Boston, Massachusetts
8. Rhode Island-Cape Cod
9. Minneapolis-St. Paul, Minnesota
10. Milwaukee, Wisconsin
11. Cincinnati, Ohio
12. Detroit, Michigan 13. St. Louis, Missouri
14. Newark, New Jersey Counties 15. Greater New York
16. Cleveland, Ohio
17. Philadelphia, Pennsylvania 18. Pittsburgh, Pennsylvania 19. Hartford, Connecticut
20. Buffalo, New York
7. For large Jewish communities and regions the Distinctive Jewish Names (ratio
Method (Fred Massarik "New Approaches to the Study of the American Jew"
The Jewish Journal of Sociology,\0\. VIII, No. 2, Dec. 1966), provides results showing
reasonably good fit, (usually ±\0"/o) with American Jewish Yearbook figures.
8. The majority of these counties are located in rural and other sparsely settled
areas.
9. Some changes were made in PSU definition, going beyond SMSA boundaries,
to include contiguous Jewishly-populated counties.
This content downloaded from 62.122.79.40 on Fri, 13 Jun 2014 00:05:47 AMAll use subject to JSTOR Terms and Conditions
254* FRED MASSARIK
21. Denver, Colorado
22. Houston, Texas
23. Tucson-Las Vegas, (respecti
vely Arizona, Nevada.) 24. Seattle-Tacoma, Washington 25. Louisville, Kentucky 26. South Bend, Indiana
27. Stamford, Connecticut
28. Utica, New York
29. Poughkeepsie, New York
30. Atlantic City, New Jersey 31. Red Bank, New Jersey
32. Allentown, Pennsylvania 33. Atlanta, Georgia 34. Williamsburg-Charleston,
West Virginia, Virginia 35. Erie-Elmira, Pennsylvania,
New York
36. Nashville, Tennessee
37. Williamsport, Pennsylvania 38. Lafayette, Arkansas
39. Counties with zero-estimates
of Jewish population
Within each primary sampling unit, secondary strata based on estimat
ed intra-unit Jewish population concentration, are defined. These
sub-strata typically divide the primary sampling unit into high, medium
and low concentration levels for census tracts, zip codes or similar divi
sions.10 Differential sampling fractions now are applied. Care is
taken to obtain balance among conflicting substantive and economic con
siderations, considering both relative homogeneity of respondent charac
teristics in higher concentrations (where per interview cost is likely to be
relatively low), and the necessity of having sufficient numbers of cases in the low concentrations (where per interview cost is high). Low concen
trations are of importance, in light of some evidence that higher
proportions of assimilated and intermarried Jewish households reside
in such areas.
Within each secondary unit, tertiary segments or "chunksיי are random
ly chosen and contiguous dwellings (usually 20 to 40) are identified. A pre-listing procedure attempts to provide, as possible, name of house
hold head. While in high concentrations this procedure adds little, it
does make it possible in medium and low concentrations to proceed with a rating procedure that further adds design efficiency; expert "judges" are asked to classify a given name into one of four categories: "definitely Jewish'1, "probably Jewish", "probably not Jewish" and
"definitely not Jewish". Varied sampling ratios now may be applied, sampling households allocated to the first two categories, at a higher rate than those falling within the last two categories. Again, it will be
10. Op. cit. F. Massarik.
This content downloaded from 62.122.79.40 on Fri, 13 Jun 2014 00:05:47 AMAll use subject to JSTOR Terms and Conditions
UNITED STATES JEWISH POPULATION STUDY 255*
noted that the more assimilated may appear more frequently in the
"probably not Jewish" and "definitely not Jewish'5 classifications.
Pre-listing also serves the purpose of making possible use of the mails
as means for eliciting certain basic demographic and objective information. In turn, for various items that require reflection (probably exclusive of those dealing with attitudes), some improvement in response
quality may be expected. As has been publicized, the 1970 U.S. Census
has made use of the mails and 'drop-off'-procedures in selected areas.
While the U.S. National Study is by no means comparable to the Census
in most respects, two considerations have inclined us to experiment with
this approach: (1) the high education level of the Jewish population,
particular its younger segments, suggests that reasonably encouraging
response rates to a "questionnaire form" may be obtained, (2) a Los
Angeles study, probinga potentially threatening topic, did obtain res
ponse rates of circa 30 %. While personal contact typically will be ne
cessary, some savings in interview time, in excess of cost of mailing mechanics (together with some qualitative gains) may result.
The U.S. National Jewish Population Study is concerned both with
demographic and non-demographic issues. There is no question what
ever that vital statistics — death rates, birth rates, fertility data, etc.
are of great significance in assessing the survival capacity of the U.S.
Jewish community. At the same time, matters related to Jewish identity also are of major importance. Questionnaire and interview schedule
content is addressed to these vital statistics and identity topics in balance.
A working conference on the study of Jewish identity, convened by the U.S. Jewish Population Study staff was held in 1968. This conference
resulted in many suggestions incorporated in the Study design.
The Study's questionnaires and interview schedules are almost entirely in accord with the list of "topics recommended for inclusion in question naire", prepared by the Division of Jewish Demography and Statistics, Institute of Contemporary Jewry, the Hebrew University, Jerusalem.
III. Some Current Key Issues
The following is a brief "grab bag" summary of design matters that
may be of interest.
1. The Study employs a very comprehensive definition of "Jewishness",
including minimal self-identification, ancestry, and the like. A screening section in questionnaire and interview schedule implements this defini
tion.
This content downloaded from 62.122.79.40 on Fri, 13 Jun 2014 00:05:47 AMAll use subject to JSTOR Terms and Conditions
256* FRED MASS ARItt
2. Random respondent selection is employed in attitudinal queries.
This, of course, necessitates call backs in many contacts. "Adults"
only are eligible respondents. 3. There are no substitutions for unavailable or refusing households.
4. A minimum response rate of 85 % desired with a further minimum
of 70 % in any primary sampling unit. Actual results in urban PSUs
are lower.
5. Young people away at college or in the Armed Services are enu
merated with their parents5 or other "base" households. A special sample of campus populations may be designed in connection with a tie-in sub
study. Possible duplication in enumeration is taken into account in
weighting the Study sample. 6. Interview length is expected to be about one hour, exclusive of
mail response. Actual length is found to be near one-and one-half hours.
7. The questionnaure and interview contains certain basic schedules, obtained from all households, and a number of special schedules are
administered on a sub-sample basis, or for particular sub-population
(e.g. aged, divorced, etc.). 8. The fact that the Study is conducted under Jewish auspices is
indicated.
9. Intensive follow up with initial refusals by specially trained inter
viewers is carried out.
We turn now to consideration of three further issues variously connect
ed with Study tests: (A) non-response, (B) problems with use of available
lists as sample frames, and (C) tertiary stratification by rating of likeli
hood that a particular household, with known family name, will contain
one or more Jewish respondent(s).
(A) Non-response
Various circumstances in the U.S. lead to heightened concern with non
response generally and with refusals particularly. Issues such as "crime
in the streets", fear of intruders, "invasion of privacy" and the like, to
gether with negative publicity given to "Census'snooping'" and polls un
derline these apprehensions. The urban character of the Jewish population would seem to aggravate the problem. There have been significant refusal
problems in some recent urban surveys.However, as Stephan has noted"...
factors (related to survey success) observed to be important in previous studies may have only a low predictive validity in new situations."11
11. Frederick F. Stephan, "The Art of Inquiry", Public Opinion Quarterly, Summer
This content downloaded from 62.122.79.40 on Fri, 13 Jun 2014 00:05:47 AMAll use subject to JSTOR Terms and Conditions
UNITED STATES JEWISH POPULATION STUDY 257*
In New York, it appears that for particular kinds of housing, such
as apartments guarded by "doormen" and other "restricted access"
situations, special techniques for assuring response are required. Letters
by community leaders and well-known neighbors, and telephone ap
pointments are among the devices that are employed. Somewhat less
"officially," some New York interviewers have perfected skills in con
vincing the less skeptical doormen of the study's legitimacy, while
other interviewers purportedly have become experts in by-passing the building "gatekeepers" by making their way through basements and
similar labyrinthine paths to the assigned doors.
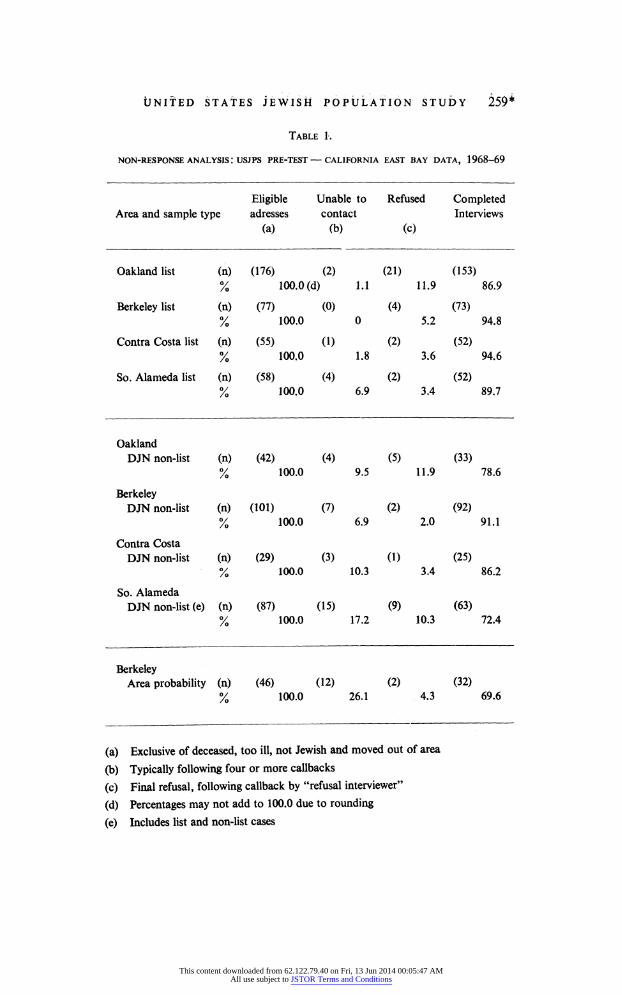
From the other side of the continent, the East Bay Area of California,
composed of Oakland, Berkeley and surrounding suburbs, come
generally encouraging findings. In the combined pre-test community
study, final refusal rates are relatively low. In the various sub-samples,12 these rates range from two percent to twelve percent. The results, show
ing patterns of non-response and completion, appear in Table 1.
Some of the major conclusions derived from the Oakland pre-test are
summarized as follows:
1. It was possible to reduce final "hard core" refusals substantially by
employment of specialized "refusal" interviewers.
2. Refusal rates tended to be highest in urban sections, particularly in
Oakland itself.
3. The "unable to contact" following a minimum of four callbacks,
continue to be a source of some concern, though the anomalous situation
in the vicinity of the University of California, Berkeley campus represents a special situation. (Some unable-to-contacts, particularly in non-list and
area probability samples would, of course, be found to be not Jewish, and
thus would fall outside the study frame).
4. In only two of nine sample types did the combination of refusals
and unable-to-contacts significantly depress completion rates below
approximate acceptable tolerance levels, (So. Alameda DJN, Berkeley
Area Probability); in one instance, (Oakland DJN), the figure, based on a
1963, p. 268. This issue also contains other relevant articles by C. F. Cannell and
Floyd J. Fowler, H. Laurence Ross and Lee N. Robins.
12. Based on Jewish Welfare Federation mailing lists (designated 'list') 106 "dis
tinctive Jewish names" drawn from telephone directories not on the list (designated
DJN non-list) and a small area probability sample.
This content downloaded from 62.122.79.40 on Fri, 13 Jun 2014 00:05:47 AMAll use subject to JSTOR Terms and Conditions
258* FRED MASSARIK
small sample, was just barely below tolerance. In the remaining six
sample types, completion rates were well above the danger point.
(B) Problems with use of available lists as sample frames. Two major difficulties bedevil the potential use of available lists as basis for samp ling; (1) typically, community lists, "master files", etc. are quite incom
plete, particularly in large Jewish communities; (2) they reflect syste matic biases.
Table 2 throws some light on list completeness. It provides an index
of coverage, as revealed by responses of communal executives (in large and medium size communities) or by lay leaders (in small communities),
estimating the proportion of Jewish households represented in the
community's list of known Jewish households.
With a score of 5.0 indicating '90 % and over' completeness, 4.0, '80 to
89 %'j 3.0, '70-79 %'j 2.0, '50-69 %'j and 1.0, 'under 50X', we find that
lists in large Jewish communities, above 100,000, (containing more than
seventy percent of the estimated U.S. Jewish population), are judged to
be not more than 50-69 % complete, on average. Unfortunately, other studies show that even this figure tends to be an over-estimate. In the
very large cities, the figure often appears to be as low as 30 to 35 %, and
even stable communities, who had believed their lists to be nearly com
plete, have found upon careful examination that they are missing sub
stantial numbers of Jewish households. Typically, while list coverage certainly can be improved, costs to develop necessary cross-files, door-to
door canvasses etc. are substantial.
Most Jewish community lists are developed initially for purposes of
fund-raising, though often they are augmented by other household addresses for purposes of mailing community bulletins and similar public relations purposes. Unfortunately, specific fund-raising requirements (which often lead to "morgueing" of persistent non-givers and others who
appear to disaffiliate), are such that, even with augmentation, the result
ing lists reflect some bias. While one cannot argue that any one list,
resulting from a given mix of community policy and local circumstance is generally typical, a review of the East Bay data, Table 3, shows the
nature of expected biases. Here, the list contains generally larger house
holds, whose heads have had somewhat less education than their non-list
(area probability sample) counterparts. The list contains more stable Jewish population elements, — those who have lived longer in the area, who have moved less often in the past and who are less likely to have
plans to move in the future. List households are more likely to be con
gregation members and are more likely to be aware of the Jewish Welfare
This content downloaded from 62.122.79.40 on Fri, 13 Jun 2014 00:05:47 AMAll use subject to JSTOR Terms and Conditions
ÜNITED STATES JEWISH POPULATION STUDY 259*
Table 1.
NON-RESPONSE ANALYSIS: USJPS PRE-TEST — CALIFORNIA EAST BAY DATA, 1968-69
Eligible Unable to Refused Completed
Area and sample type adresses contact Interviews
(a) (b) (c)
Oakland list (n) "7
(176) (2) 100.0(d) 1.1
(21) 11.9
(153) 86.9
Berkeley list (n) 0/־
(77) 100.0
(0) 0
(4) 5.2
(73) 94.8
Contra Costa list (n) 7־
(55) 100.0
(1) 1.8
(2) 3.6
(52) 94.6
So. Alameda list (n) 7־
(58) 100.0
(4) 6.9
(2) 3.4
(52) 89.7
Oakland
DJN non-list (n) 7־
(42) 100.0
(4) 9.5
(5) 11.9
(33) 78.6
Berkeley
DJN non-list (n) 7־
(101) 100.0
(7) 6.9
(2) 2.0
(92) 91.1
Contra Costa
DJN non-list (n) 7־
(29) 100.0
(3) 10.3
(1) 3.4
(25) 86.2
So. Alameda
DJN non-list (e) (n) 7־
(87) 100.0
(15) 17.2
(9) 10.3
(63) 72.4
Berkeley
Area probability (n) 7־
(46) 100.0
(12) 26.1
(2) 4.3
(32) 69.6
Exclusive of deceased, too ill, not Jewish and moved out of area
Typically following four or more callbacks
Final refusal, following callback by "refusal interviewer"
Percentages may not add to 100.0 due to rounding
Includes list and non-list cases
This content downloaded from 62.122.79.40 on Fri, 13 Jun 2014 00:05:47 AMAll use subject to JSTOR Terms and Conditions
260* fREö mass ari k
Table 2
COMMUNITY JUDGMENT OF LIST COMPLETENESS
Estimated Jewish population Coverage index (a)
100,000 + 2.0
40,000-99,999 3.6
15,000-39,999 4.0
10,000-14,999 4.9
5,000-9,999 4.2
2,000-4,999 4.3
Under 2,000 4.7
(a) For definition, see text
Table 3.
EXAMPLES OF BIAS IN AVAILABLE LISTS: USJPS PRE-TEST—CALIFORNIA EAST BAY DATA 1968-1969 (a)
List Non-list
(Area probabilty)
Household size (mean) 3.0 2.7 Years of education (mean) 14.9 16.6 Years lived in East Bay (mean) 18.7 6.0 Times moved (last ten years) 1.6 3.9
Any plans to move (/") 14.2 68.8
Congregation members ( %) 32.5 12.5 Awareness of Jewish
Welfare Federation ( %) 97.4 43.8
Any Jewish education (/) 70.1 84.4
Member, one or more Jewish organizations (0/0) 37.7 9.4
Member, one or more general organizations (/) 49.4 31.2
(a) Berkeley respondents
This content downloaded from 62.122.79.40 on Fri, 13 Jun 2014 00:05:47 AMAll use subject to JSTOR Terms and Conditions
UNITED STATES JEWISH POPULATION STUDY 261*
Federation. As to Jewish education, an intriguing pattern emerges, with
higher incidence of Jewish education in the non-list group. On the other
hand, membership in Jewish organizations (as well as in general organi
zations) is greater for list households.
It is apparent that, if the data of Table 3 may be generalized even in
modest measure, with ample caveats and allowances for local variations, the exclusive use of lists is problematical. While not reported here, infor
mal inquiries similar to the present strongly support the contention that, even with conventional augmentation, Jewish community lists represent
particular selected segments of total Jewish populations, not their entirety.
However, knowing the proportion of list coverage, it becomes possible to sample from lists directly, weighting the results appropriately, together with the results provided by non-list samples representing households
unknown to the organized Jewish community, as derived by area prob
ability procedures.
(C) Tertiary stratification by rating of likelihood that a particular
household, with known family name, will contain one or more Jewish
respondent(s).
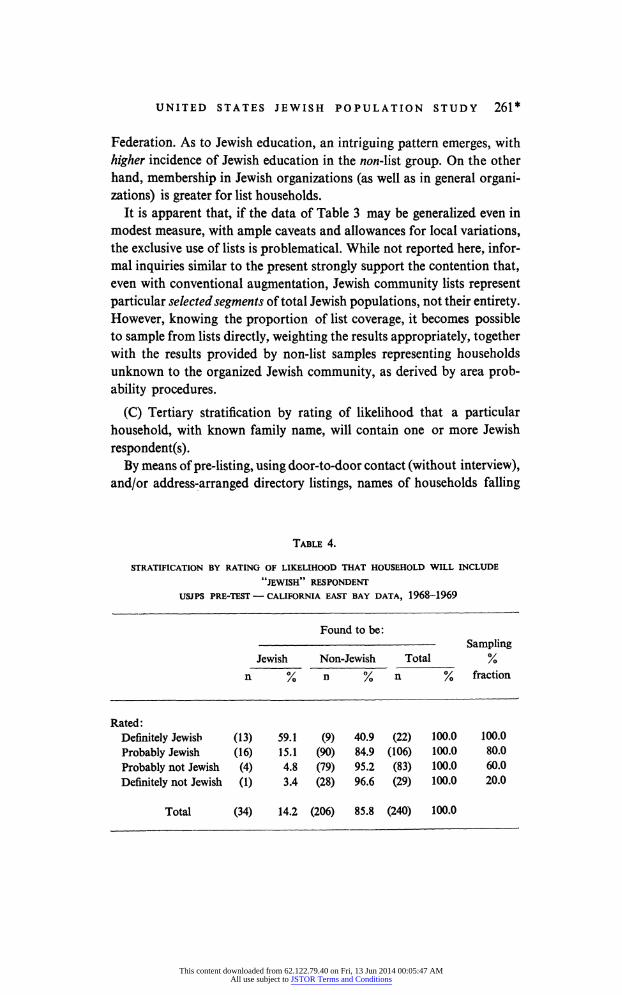
By means of pre-listing, using door-to-door contact (without interview),
and/or address-arranged directory listings, names of households falling
Table 4.
STRATIFICATION BY RATING OF LIKELIHOOD THAT HOUSEHOLD WILL INCLUDE
"JEWISH" RESPONDENT
USJPS PRE-TEST — CALIFORNIA EAST BAY DATA, 1968-1969
Found to be:
Sampling
Jewish Non-Jewish Total %
% n x n % fraction
(13) 59.1 (9) 40.9 (22) 100.0 100.0
(16) 15.1 (90) 84.9 (106) 100.0 80.0
(4) 4.8 (79) 95.2 (83) 100.0 60.0
(1) 3.4 (28) 96.6 (29) 100.0 20.0
(34) 14.2 (206) 85.8 (240) 100.0
Rated:
Definitely Jewish
Probably Jewish
Probably not Jewish
Definitely not Jewish
Total
This content downloaded from 62.122.79.40 on Fri, 13 Jun 2014 00:05:47 AMAll use subject to JSTOR Terms and Conditions
262* FRED MASSARIK
within the tertiary "chunks" may be obtained. We have found that raters
who are familiar with Jewish names are able to provide highly discrimin
ant judgements as to whether a given name is attached to a dwelling that
is likely to contain one or more Jewish respondents; see Table 4. On
the basis of these judgements it is possible to develop further stratifica
tions. For instance, we may include in the sample 100 ̂ of households
rated "definitely Jewish", 80 % of those rated "probably Jewish", 60 % of those rated "probably not Jewish", and finally 20 % of those rated "de
finitely not Jewish". In turn, we may assure that enough cases will appear in the 'probably' and 'definitely not Jewish' categories in the over-all
nation-wide sample, without regional or local sub-classifications, to obtain a picture of these possibly-more-marginally-Jewish respondents.
IV. Study Time Table
In the Summer 1969 the following activities were in progress: (1) pre-testing of personal interview schedules, St. Louis, New York, Los Angeles, (2) pre-testing of proposed mail questionnaire procedure, New York, Los Angeles, and two small communities, (3) completion of secondary stratification (high, medium, low Jewish population con centrations), (4) preparation for tertiary stratification (designation of "chunks" or demographic segments within secondary strata), (5) review of field costs, and obtaining of bids for field work by various survey organizations, (6) discussion of possible "tie-ins" into National Study design by several local Jewish communities and voluntary organizations, (7) consideration of data processing procedures, and (8) preliminary discussion of division of labor for report preparation. Several of the associate scientific directors are continuing with work on their assign ments and a large clerical and semi-professional staff is engaged in a variety of detailed tasks.
For a number of practical and procedural reasons, field work pro ceeded in phases, commencing in late Fall 1969. Timing took into account local community conditions and over-all Study pacing. In con nection with the former, some communities needed to deal with local circumstances as, for instance Miami, with its influx of winter residents that makes January more desirable as a field work period than November. Phasing of field work is influenced by the feasibility of sub-contracting major portions of the field work to competent survey organizations.
This content downloaded from 62.122.79.40 on Fri, 13 Jun 2014 00:05:47 AMAll use subject to JSTOR Terms and Conditions
UNITED STATES JEWISH POPULATION STUDY 263*
Initial highly preliminary findings were reported in 1971. Further
reports appear in 1972, with a book-length manuscript projected for 1973-74.
Inevitably, the U.S. National Jewish Population Study has had to
contend with the unexpected, but prospects are favorable that by its means we shall deepen our insights into American Jewish life.
This content downloaded from 62.122.79.40 on Fri, 13 Jun 2014 00:05:47 AMAll use subject to JSTOR Terms and Conditions
Recommended

![ה התיכ ימייסמל תרבוחmatic.co.il/wp-content/uploads/2017/06/כיתה-ה-סופי.pdf · ]ןאכ דלקה['ה התיכ ימייסמל תרבוח םיינורשע םירבשו](https://img.pdfslide.tips/doc/110x75/5f196e66a7645b680008ae66/-oe-maticcoilwp-contentuploads201706-pdf.jpg)

![Westminster Leningrad Codex [4.14] - Wikimedia...The Westminster Leningrad Codex Genesis 1 ש˛מ ר˛־ל כ ת6א ˆו ה" נימˆל ה מ הˆב ה־ת˛אˆו ה% נימˆל ־י](https://img.pdfslide.tips/doc/110x75/612794bceccc982c394f0b3a/westminster-leningrad-codex-414-wikimedia-the-westminster-leningrad-codex.jpg)