Embed Size (px)
Citation preview
DTE Energy: Mid-Year Business Update
July 2, 2008
2
Safe Harbor Statement
The information contained herein is as of the date of this presentation. DTE Energy expressly disclaims any current intention to update any forward-looking statements contained in this document as a result of new information or future events or developments. Words such as “anticipate,” “believe,” “expect,” “projected” and “goals” signify forward-looking statements. Forward-looking statements are not guarantees of future results and conditions but rather are subject to various assumptions, risks and uncertainties. This presentation contains forward-looking statements about DTE Energy’s financial results and estimates of future prospects, and actual results may differ materially. Factors that may impact forward-looking statements include, but are not limited to: the potential requirement to refund proceeds received from synfuel partners; the uncertainties of successful exploration of gas shale resources and inability to estimate gas reserves with certainty; the effects of weather and other natural phenomena on operations and sales to customers, and purchases from suppliers; economic climate and population growth or decline in the geographic areas where we do business; environmental issues, laws, regulations, and the cost of remediation and compliance, including potential new federal and state requirements that could include carbon and more stringent mercury emission controls, arenewable portfolio standard and energy efficiency mandates; nuclear regulations and operations associated with nuclear facilities; impact of electric and gas utility restructuring in Michigan, including legislative amendments and Customer Choice programs; employee relations and the impact of collective bargaining agreements; unplanned outages; access to capital markets and capital market conditions and the results of other financing efforts which can be affected by credit agency ratings; the timing and extent of changes in interest rates; the level of borrowings; changes in the cost and availability of coal and other raw materials, purchased power and natural gas; effects of competition; impact of regulation by the FERC, MPSC, NRC and other applicable governmental proceedings and regulations, including any associated impact on rate structures; contributions to earnings by non-utility subsidiaries; changes in and application of federal, state and local tax laws and their interpretations, including the Internal Revenue Code, regulations, rulings, court proceedings and audits; the ability to recover costs through rate increases; the availability, cost, coverage and terms of insurance; the cost of protecting assets against, or damage due to, terrorism; changes in and application of accounting standards and financial reporting regulations; changes in federal or state laws and their interpretation with respect to regulation, energy policy and other business issues; amounts of uncollectible accounts receivable; binding arbitration, litigation and related appeals; changes in the economic and financial viability of our suppliers, customers and trading counterparties, and the continued ability of such parties to perform their obligations to the Company; and timing, terms and proceeds from any asset sale or monetization. This presentation should also be read in conjunction with the “Forward-Looking Statements” section in each of DTE Energy’s and Detroit Edison’s 2007 Form 10-K and 2008 Forms 10-Q (which sections are incorporated herein by reference), and in conjunction with other SEC reports filed by DTE Energy and Detroit Edison.
3
Introduction
• Gerry Anderson, President and COO
• Dave Meador, Executive Vice President and CFO
• Lisa Muschong, Director of Investor Relations
Participants
Presentation Outline
• Michigan Energy Legislation & Detroit Edison Rate Case Update
• Non-Utility Business Update
• Earnings Guidance Update
4
Legislation Will Be a Historical Step inImproving Michigan’s Energy Policies
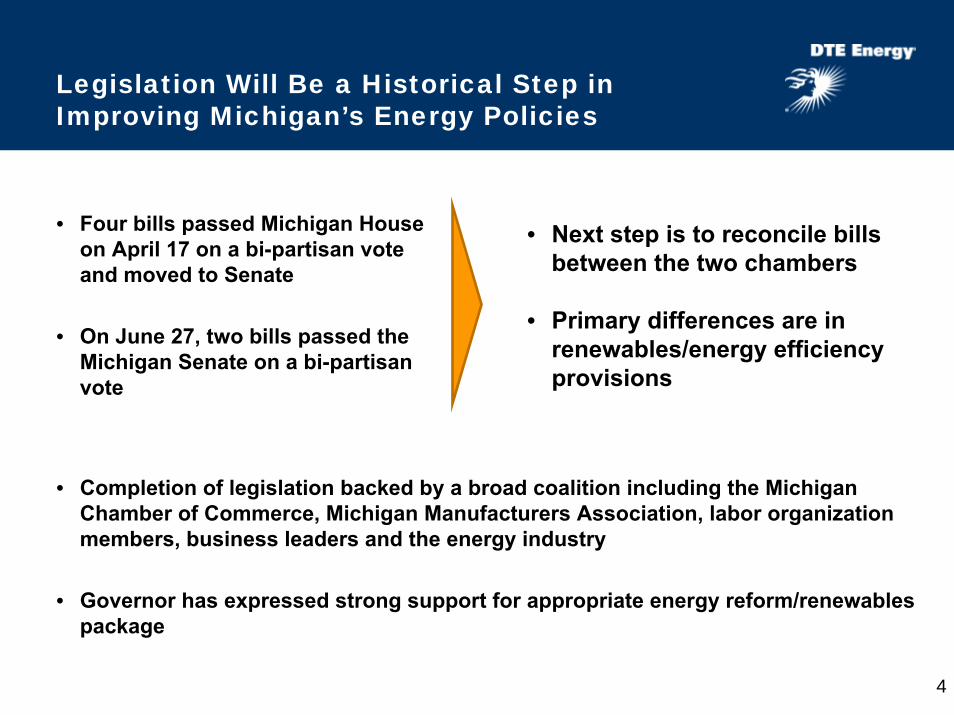
• Four bills passed Michigan House on April 17 on a bi-partisan vote and moved to Senate
• On June 27, two bills passed the Michigan Senate on a bi-partisan vote
• Completion of legislation backed by a broad coalition including the Michigan Chamber of Commerce, Michigan Manufacturers Association, labor organization members, business leaders and the energy industry
• Governor has expressed strong support for appropriate energy reform/renewables package
• Next step is to reconcile bills between the two chambers
• Primary differences are in renewables/energy efficiency provisions
5
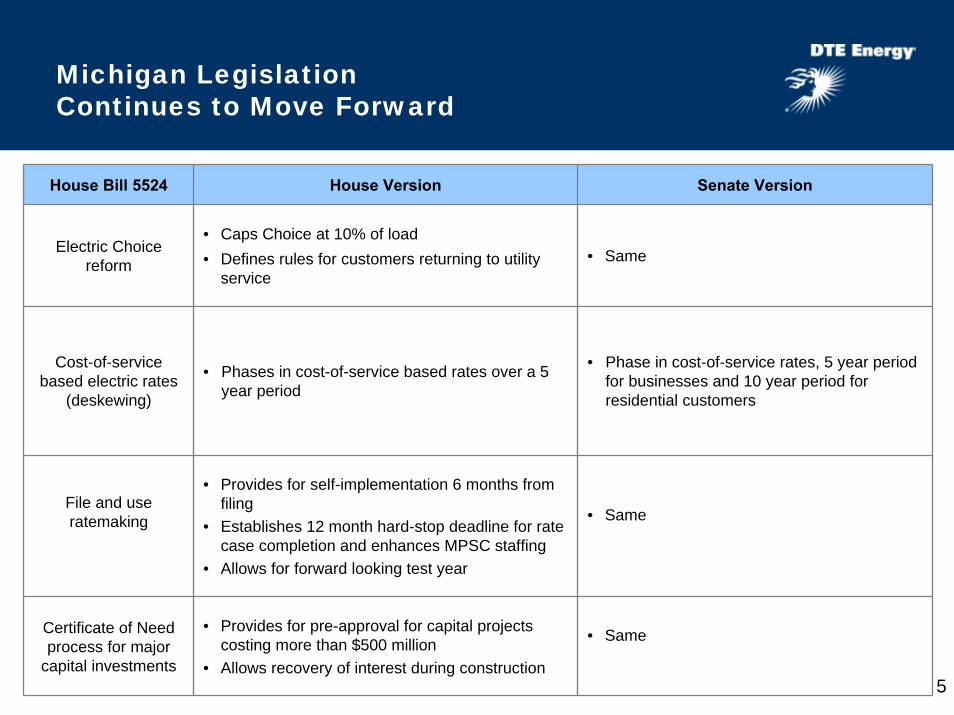
Michigan Legislation Continues to Move Forward
House Bill 5524 House Version Senate Version
Electric Choice reform
• Caps Choice at 10% of load• Defines rules for customers returning to utility
service• Same
Cost-of-service based electric rates
(deskewing)
• Phases in cost-of-service based rates over a 5 year period
• Phase in cost-of-service rates, 5 year period for businesses and 10 year period for residential customers
File and use ratemaking
• Provides for self-implementation 6 months from filing
• Establishes 12 month hard-stop deadline for rate case completion and enhances MPSC staffing
• Allows for forward looking test year
• Same
Certificate of Need process for major
capital investments
• Provides for pre-approval for capital projects costing more than $500 million
• Allows recovery of interest during construction
• Same
6
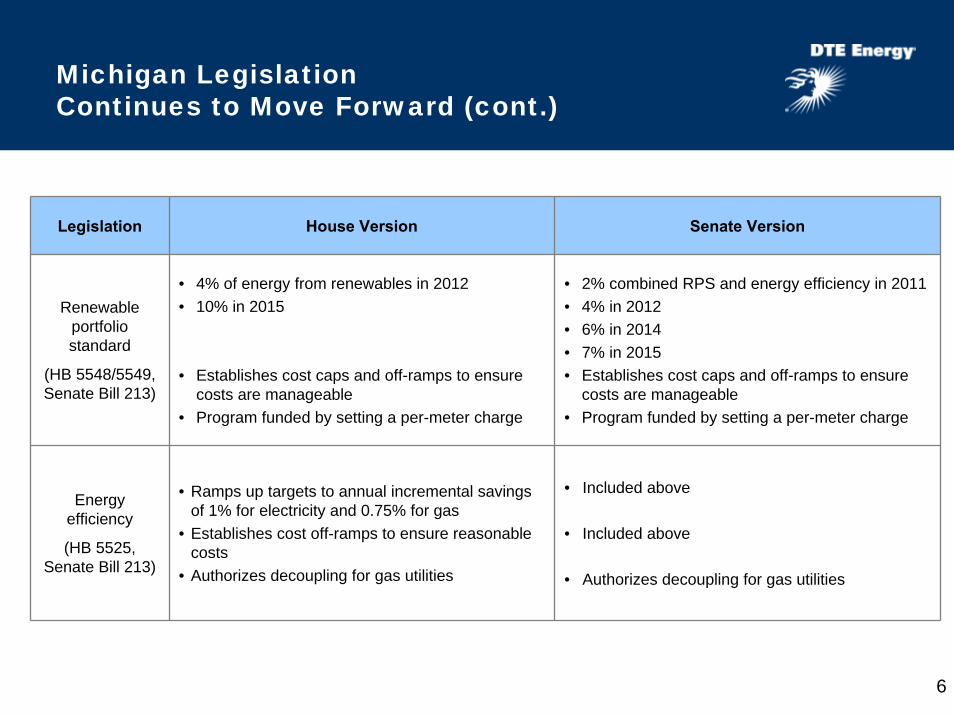
Michigan Legislation Continues to Move Forward (cont.)
Legislation House Version Senate Version
Renewable portfolio standard
(HB 5548/5549, Senate Bill 213)
• 4% of energy from renewables in 2012• 10% in 2015
• Establishes cost caps and off-ramps to ensure costs are manageable
• Program funded by setting a per-meter charge
• 2% combined RPS and energy efficiency in 2011• 4% in 2012• 6% in 2014• 7% in 2015• Establishes cost caps and off-ramps to ensure
costs are manageable• Program funded by setting a per-meter charge
Energy efficiency
(HB 5525, Senate Bill 213)
• Ramps up targets to annual incremental savings of 1% for electricity and 0.75% for gas
• Establishes cost off-ramps to ensure reasonable costs
• Authorizes decoupling for gas utilities
• Included above
• Included above
• Authorizes decoupling for gas utilities
7
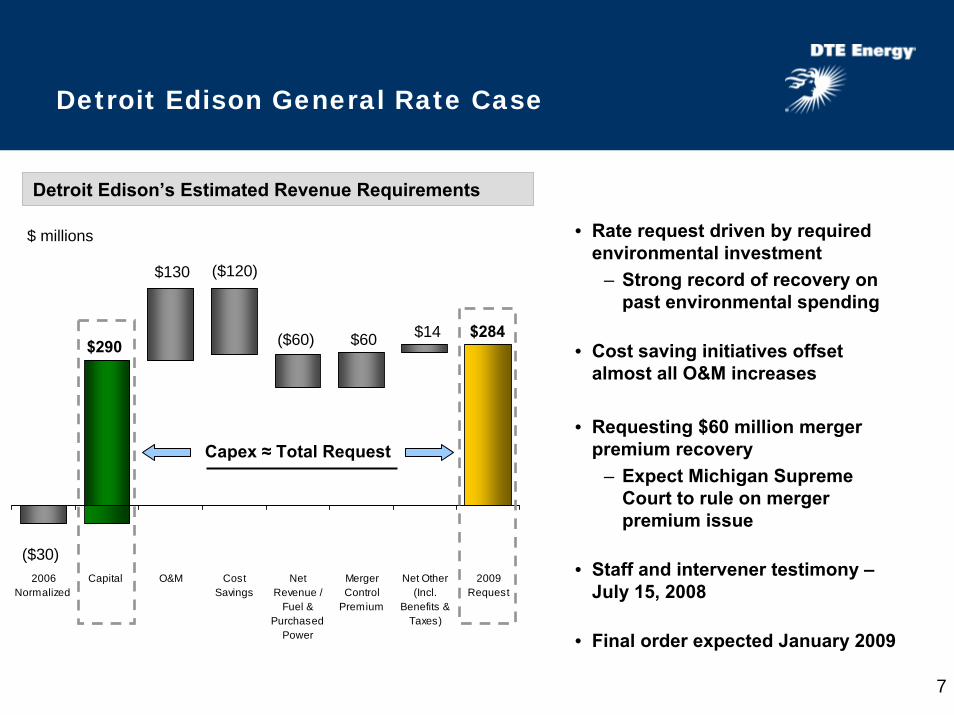
Detroit Edison General Rate Case
2006Normalized
Capital O&M CostSavings
NetRevenue /
Fuel &Purchased
Power
MergerControl
Premium
Net Other(Incl.
Benefits &Taxes)
2009Request
($30)
$130
$290 ($60)
($120)
$60 $14 $284
Detroit Edison’s Estimated Revenue Requirements
• Rate request driven by required environmental investment
– Strong record of recovery on past environmental spending
• Cost saving initiatives offset almost all O&M increases
• Requesting $60 million merger premium recovery
– Expect Michigan Supreme Court to rule on merger premium issue
• Staff and intervener testimony –July 15, 2008
• Final order expected January 2009
$ millions
Capex ≈ Total Request
8
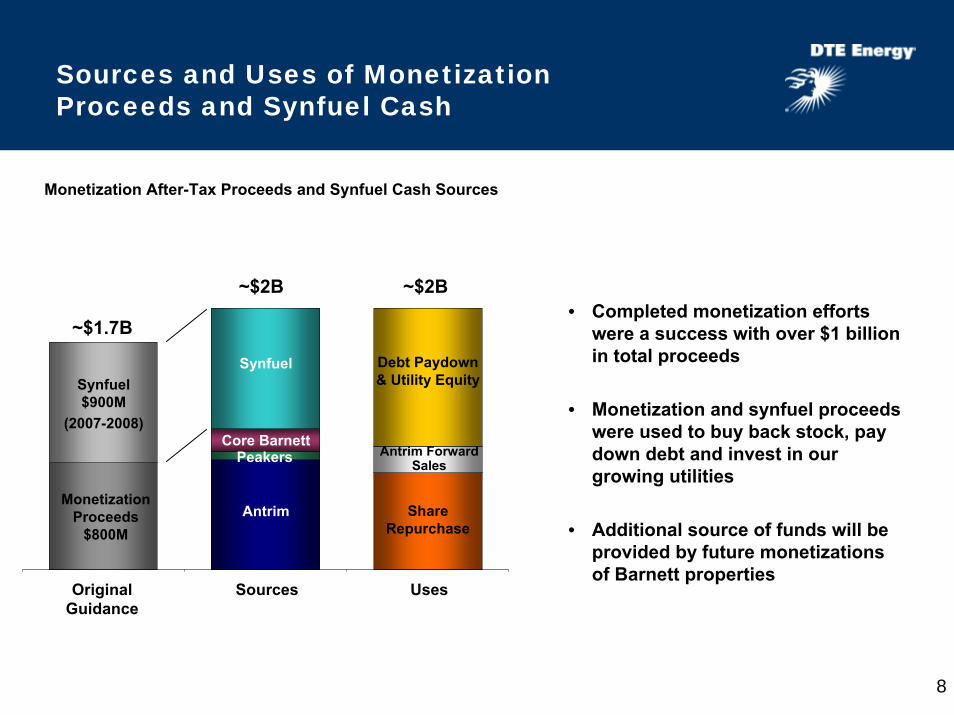
Sources and Uses of Monetization Proceeds and Synfuel Cash
Original Guidance
Sources
Monetization Proceeds
$800MAntrim
PeakersCore Barnett
~$2B
Uses
Debt Paydown & Utility Equity
Share Repurchase
~$2B
Synfuel $900M
(2007-2008)
Synfuel
~$1.7B
Antrim Forward Sales
Monetization After-Tax Proceeds and Synfuel Cash Sources
• Completed monetization efforts were a success with over $1 billion in total proceeds
• Monetization and synfuel proceeds were used to buy back stock, pay down debt and invest in our growing utilities
• Additional source of funds will be provided by future monetizations of Barnett properties
9
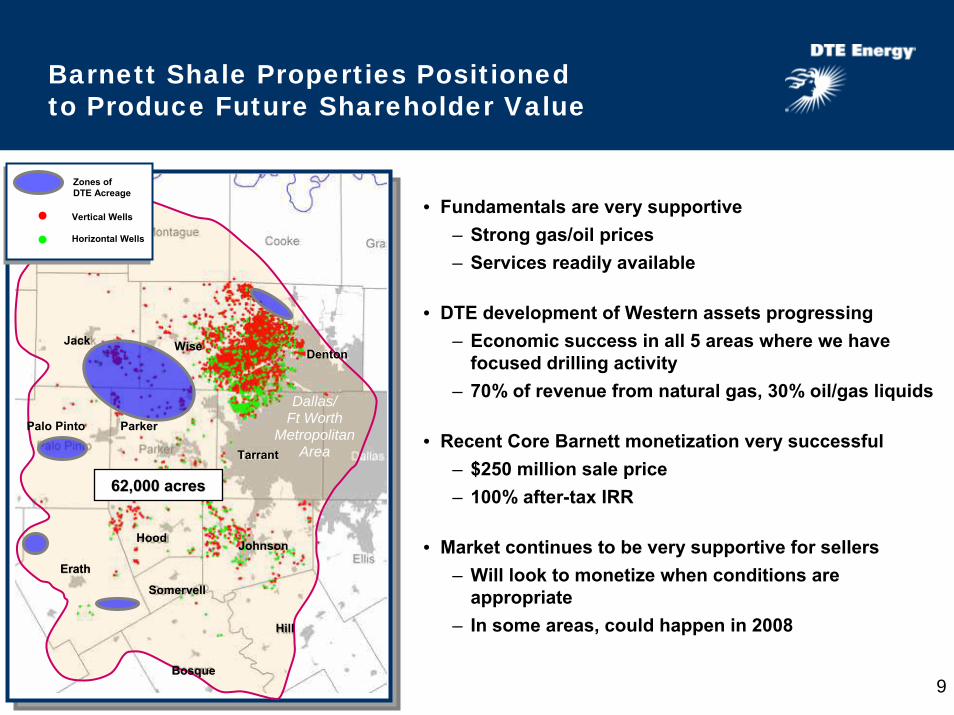
Barnett Shale Properties Positioned to Produce Future Shareholder Value
• Fundamentals are very supportive – Strong gas/oil prices– Services readily available
• DTE development of Western assets progressing– Economic success in all 5 areas where we have
focused drilling activity– 70% of revenue from natural gas, 30% oil/gas liquids
• Recent Core Barnett monetization very successful– $250 million sale price– 100% after-tax IRR
• Market continues to be very supportive for sellers– Will look to monetize when conditions are
appropriate– In some areas, could happen in 2008
Clay
Zones of DTE Acreage
Vertical Wells
Horizontal Wells
Dallas/Ft Worth
MetropolitanArea
62,000 acres62,000 acres
Hood Johnson
Erath
Jack
Somervell
Hill
Wise
Tarrant
Bosque
Parker
Denton
Palo Pinto
10
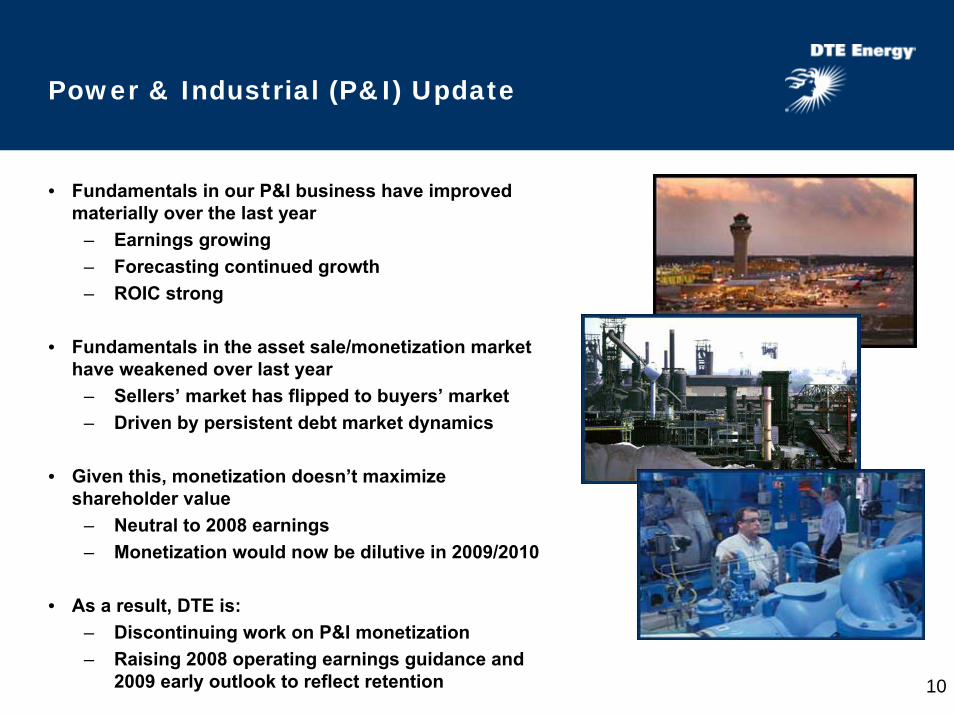
Power & Industrial (P&I) Update
• Fundamentals in our P&I business have improved materially over the last year
– Earnings growing– Forecasting continued growth– ROIC strong
• Fundamentals in the asset sale/monetization market have weakened over last year
– Sellers’ market has flipped to buyers’ market– Driven by persistent debt market dynamics
• Given this, monetization doesn’t maximize shareholder value
– Neutral to 2008 earnings– Monetization would now be dilutive in 2009/2010
• As a result, DTE is:– Discontinuing work on P&I monetization– Raising 2008 operating earnings guidance and
2009 early outlook to reflect retention
11
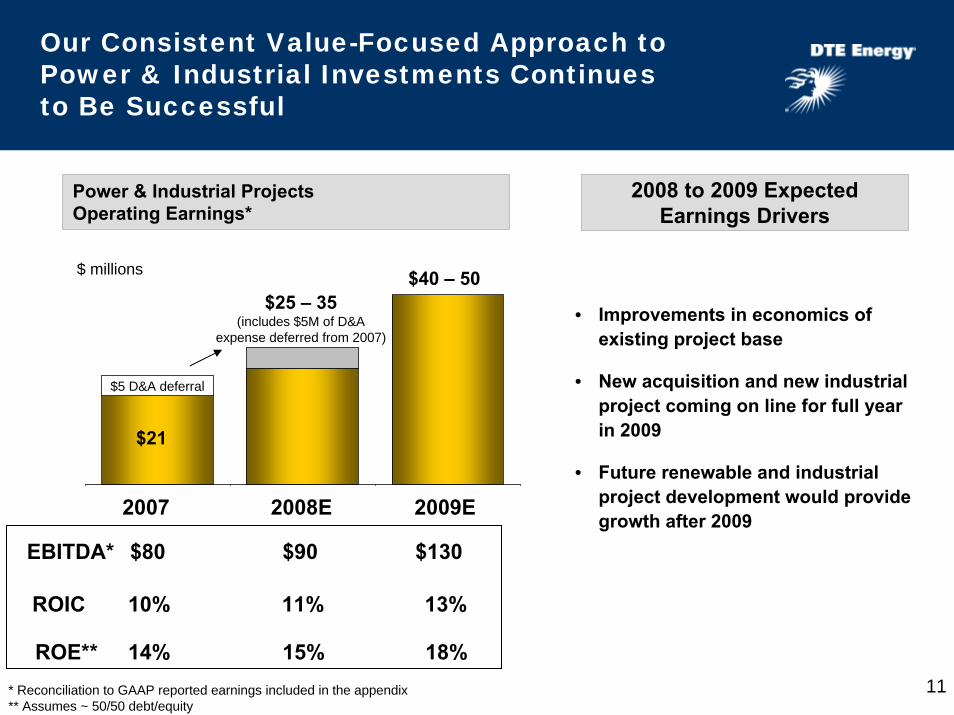
Our Consistent Value-Focused Approach to Power & Industrial Investments Continues to Be Successful
* Reconciliation to GAAP reported earnings included in the appendix** Assumes ~ 50/50 debt/equity
$21
$25 – 35(includes $5M of D&A
expense deferred from 2007)
$40 – 50
2007 2008E 2009E
Power & Industrial ProjectsOperating Earnings*
$ millions
ROIC
ROE**
10%
14%
11%
15%
13%
18%
EBITDA* $80 $90 $130
• Improvements in economics of existing project base
• New acquisition and new industrial project coming on line for full year in 2009
• Future renewable and industrial project development would provide growth after 2009
2008 to 2009 Expected Earnings Drivers
$5 D&A deferral
12
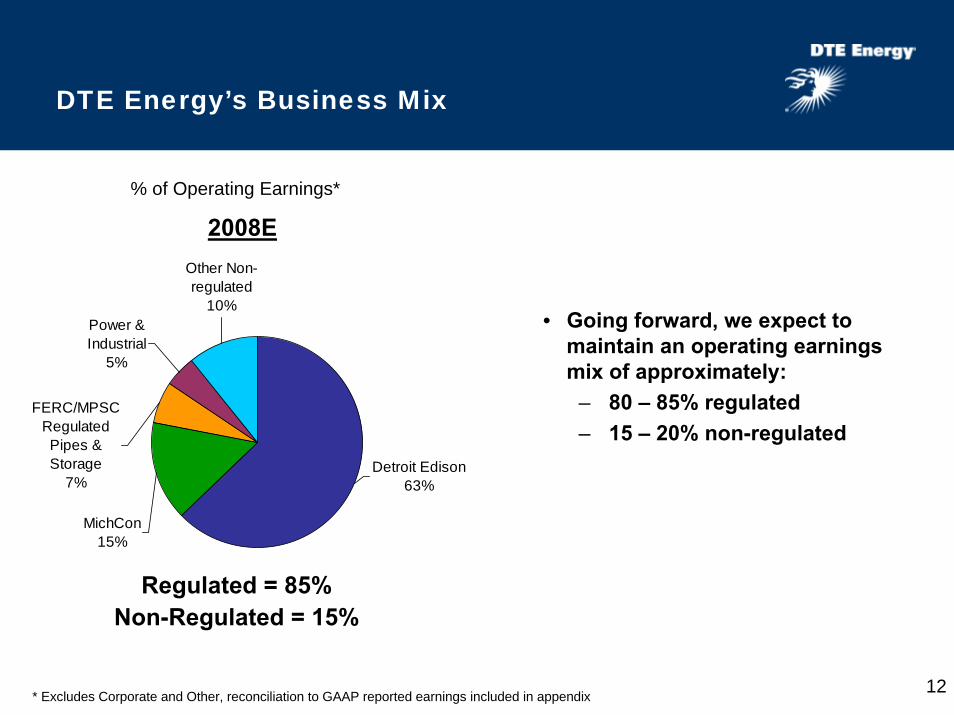
DTE Energy’s Business Mix
2008E
Non-Regulated = 15%Regulated = 85%
* Excludes Corporate and Other, reconciliation to GAAP reported earnings included in appendix
% of Operating Earnings*
Other Non-regulated
10%Power & Industrial
5%
Detroit Edison63%
FERC/MPSC Regulated Pipes & Storage
7%
MichCon15%
• Going forward, we expect to maintain an operating earnings mix of approximately:
– 80 – 85% regulated– 15 – 20% non-regulated
13
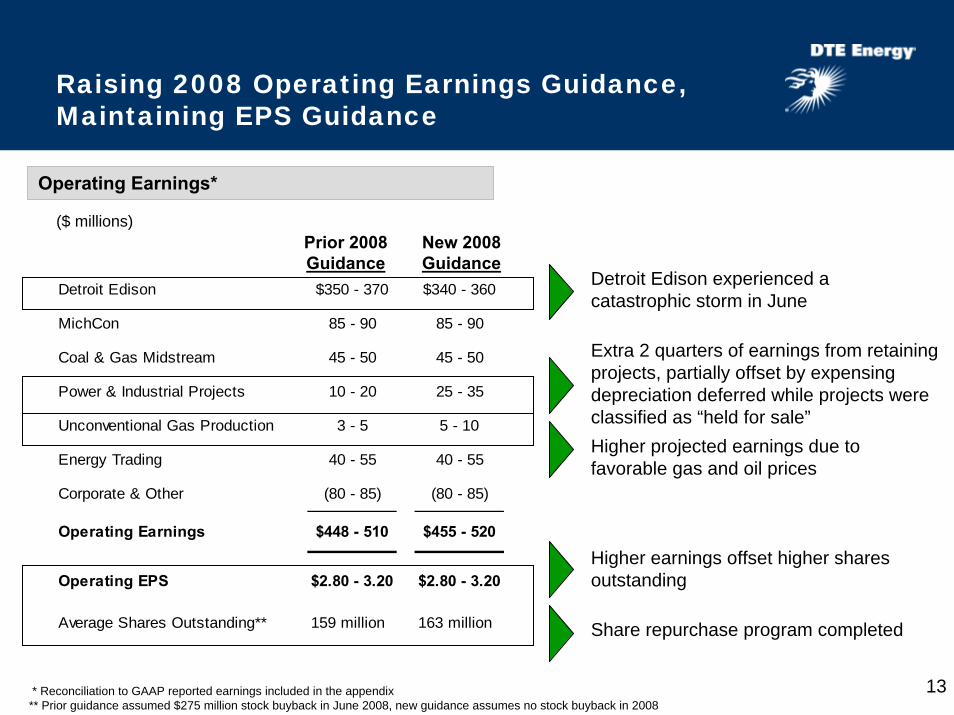
Raising 2008 Operating Earnings Guidance,Maintaining EPS Guidance
Detroit Edison $350 - 370 $340 - 360
MichCon 85 - 90 85 - 90
Coal & Gas Midstream 45 - 50 45 - 50
Power & Industrial Projects 10 - 20 25 - 35
Unconventional Gas Production 3 - 5 5 - 10
Energy Trading 40 - 55 40 - 55
Corporate & Other (80 - 85) (80 - 85)
Operating Earnings $448 - 510 $455 - 520
Operating EPS $2.80 - 3.20 $2.80 - 3.20
Average Shares Outstanding** 159 million 163 million
Prior 2008 Guidance
New 2008 Guidance
Operating Earnings*
($ millions)
* Reconciliation to GAAP reported earnings included in the appendix** Prior guidance assumed $275 million stock buyback in June 2008, new guidance assumes no stock buyback in 2008
Extra 2 quarters of earnings from retaining projects, partially offset by expensing depreciation deferred while projects were classified as “held for sale”
Higher earnings offset higher shares outstanding
Detroit Edison experienced a catastrophic storm in June
Share repurchase program completed
Higher projected earnings due to favorable gas and oil prices
14
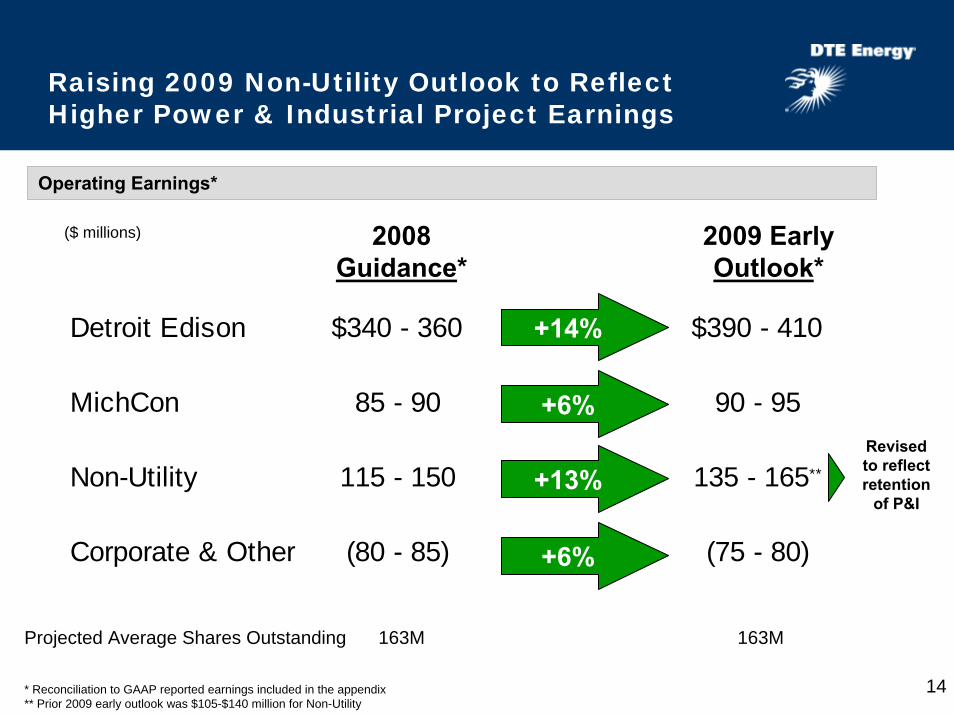
Raising 2009 Non-Utility Outlook to Reflect Higher Power & Industrial Project Earnings
Detroit Edison $340 - 360 $390 - 410
MichCon 85 - 90 90 - 95
Non-Utility 115 - 150 135 - 165**
Corporate & Other (80 - 85) (75 - 80)
2008Guidance*
($ millions)
+6%
2009 EarlyOutlook*
+13%
+6%
+14%
Projected Average Shares Outstanding 163M 163M
* Reconciliation to GAAP reported earnings included in the appendix** Prior 2009 early outlook was $105-$140 million for Non-Utility
Operating Earnings*
Revised to reflect retention
of P&I
15
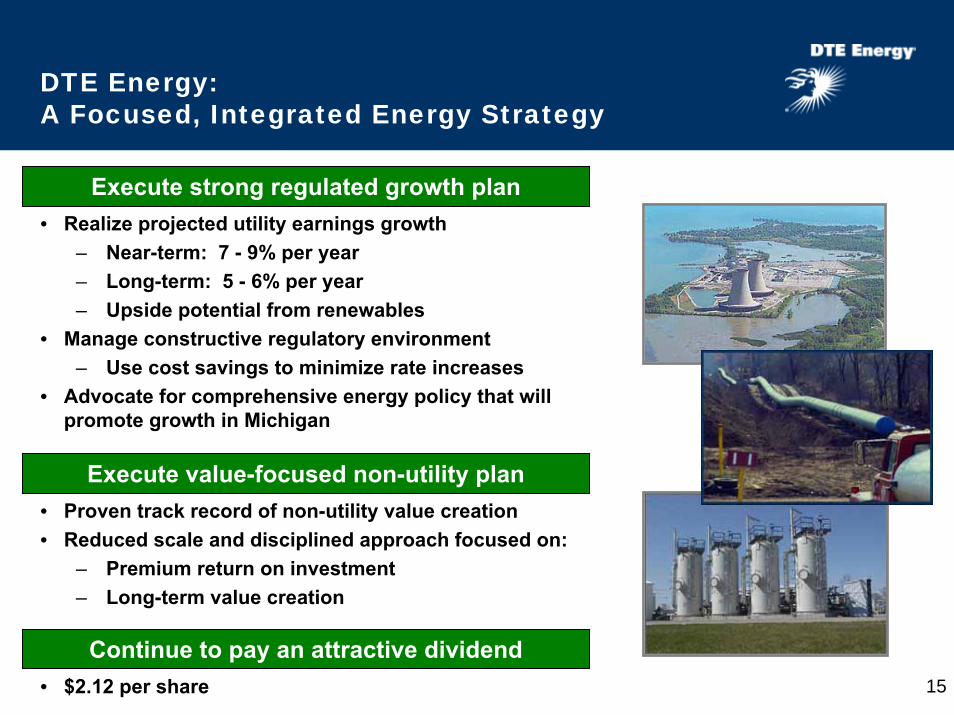
Execute strong regulated growth plan
DTE Energy:A Focused, Integrated Energy Strategy
Execute value-focused non-utility plan
Continue to pay an attractive dividend• $2.12 per share
• Realize projected utility earnings growth– Near-term: 7 - 9% per year– Long-term: 5 - 6% per year– Upside potential from renewables
• Manage constructive regulatory environment– Use cost savings to minimize rate increases
• Advocate for comprehensive energy policy that will promote growth in Michigan
• Proven track record of non-utility value creation• Reduced scale and disciplined approach focused on:
– Premium return on investment– Long-term value creation

16
Contact Us
DTE Energy Investor Relations
www.dteenergy.com/investors
313-235-8030
Appendix
18
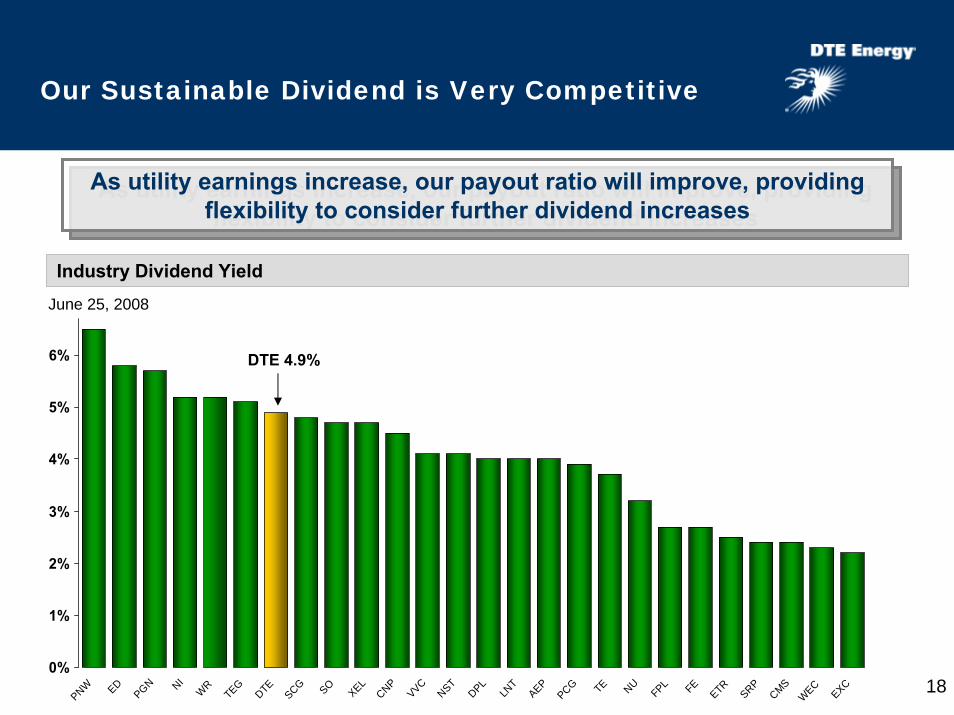
Our Sustainable Dividend is Very Competitive
As utility earnings increase, our payout ratio will improve, providing flexibility to consider further dividend increases
As utility earnings increase, our payout ratio will improve, providing flexibility to consider further dividend increases
Industry Dividend Yield
0%
1%
2%
3%
4%
5%
6%
PNW ED
PGN NI
WR
TEG
DTE
SCG SO
XEL
CNP
VVC
NST
DPL
LNT
AEP
PCG TE NU
FPL FE
ETR
SRP
CMSWEC
EXC
DTE 4.9%
June 25, 2008
19
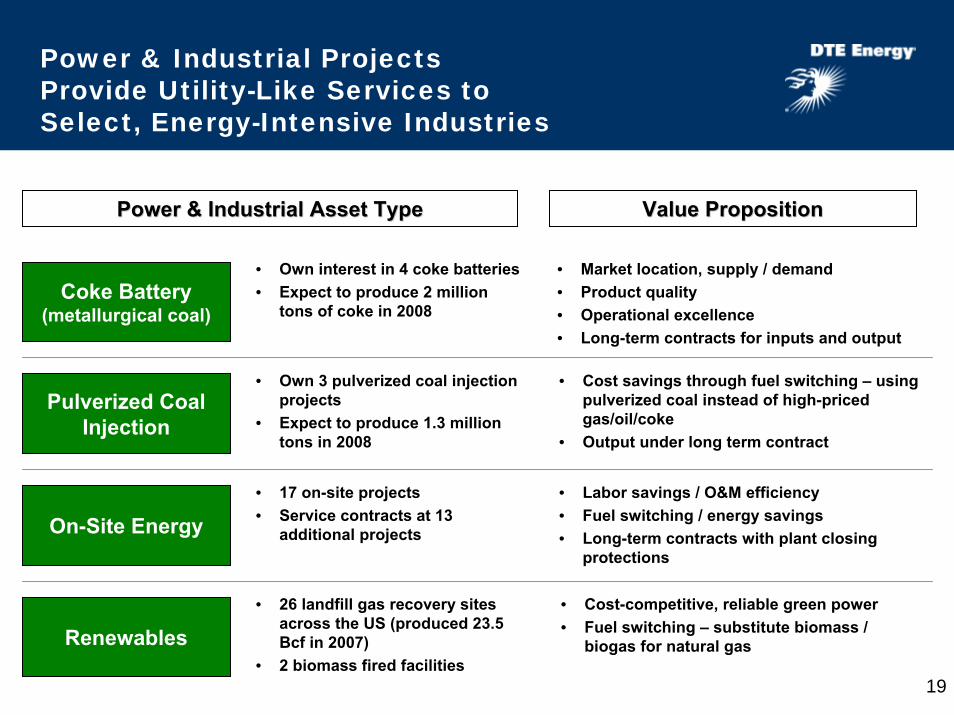
Power & Industrial Projects Provide Utility-Like Services to Select, Energy-Intensive Industries
Coke Battery(metallurgical coal)
Pulverized CoalInjection
On-Site Energy
Renewables
Value PropositionValue PropositionPower & Industrial Asset TypePower & Industrial Asset Type
• Own interest in 4 coke batteries • Expect to produce 2 million
tons of coke in 2008
• Market location, supply / demand • Product quality• Operational excellence• Long-term contracts for inputs and output
• Own 3 pulverized coal injection projects
• Expect to produce 1.3 million tons in 2008
• 17 on-site projects• Service contracts at 13
additional projects
• Cost savings through fuel switching – using pulverized coal instead of high-priced gas/oil/coke
• Output under long term contract
• Labor savings / O&M efficiency• Fuel switching / energy savings• Long-term contracts with plant closing
protections
• 26 landfill gas recovery sites across the US (produced 23.5 Bcf in 2007)
• 2 biomass fired facilities
• Cost-competitive, reliable green power• Fuel switching – substitute biomass /
biogas for natural gas
20
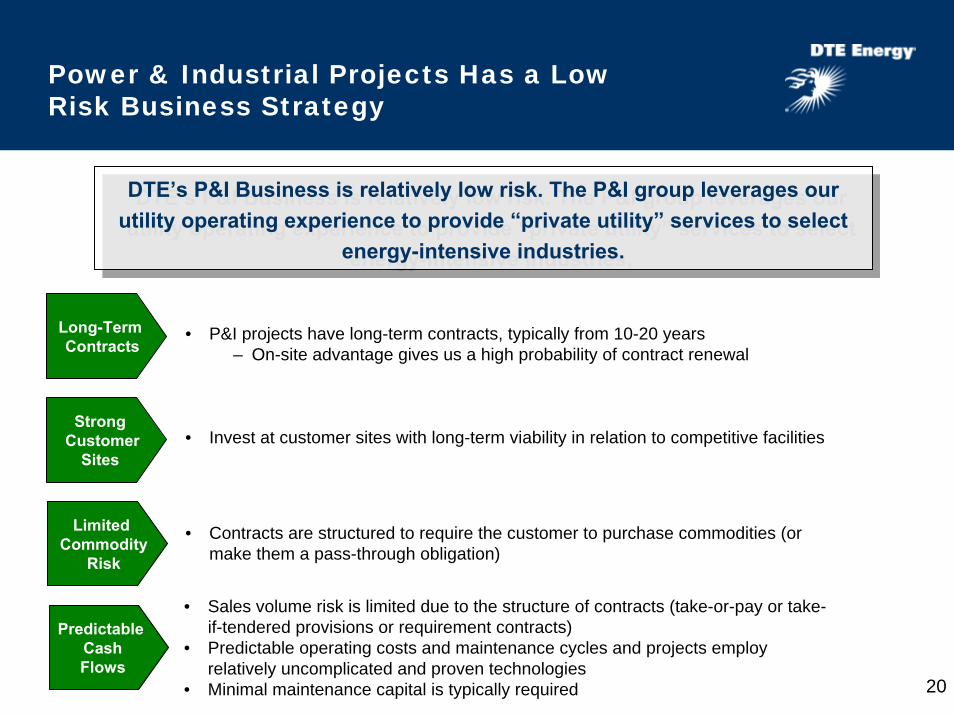
Long-TermContracts
• P&I projects have long-term contracts, typically from 10-20 years – On-site advantage gives us a high probability of contract renewal
StrongCustomer
Sites• Invest at customer sites with long-term viability in relation to competitive facilities
LimitedCommodity
Risk
• Contracts are structured to require the customer to purchase commodities (or make them a pass-through obligation)
Predictable CashFlows
• Sales volume risk is limited due to the structure of contracts (take-or-pay or take-if-tendered provisions or requirement contracts)
• Predictable operating costs and maintenance cycles and projects employ relatively uncomplicated and proven technologies
• Minimal maintenance capital is typically required
Power & Industrial Projects Has a Low Risk Business Strategy
DTE’s P&I Business is relatively low risk. The P&I group leverages our utility operating experience to provide “private utility” services to select
energy-intensive industries.
DTE’s P&I Business is relatively low risk. The P&I group leverages our utility operating experience to provide “private utility” services to select
energy-intensive industries.
21
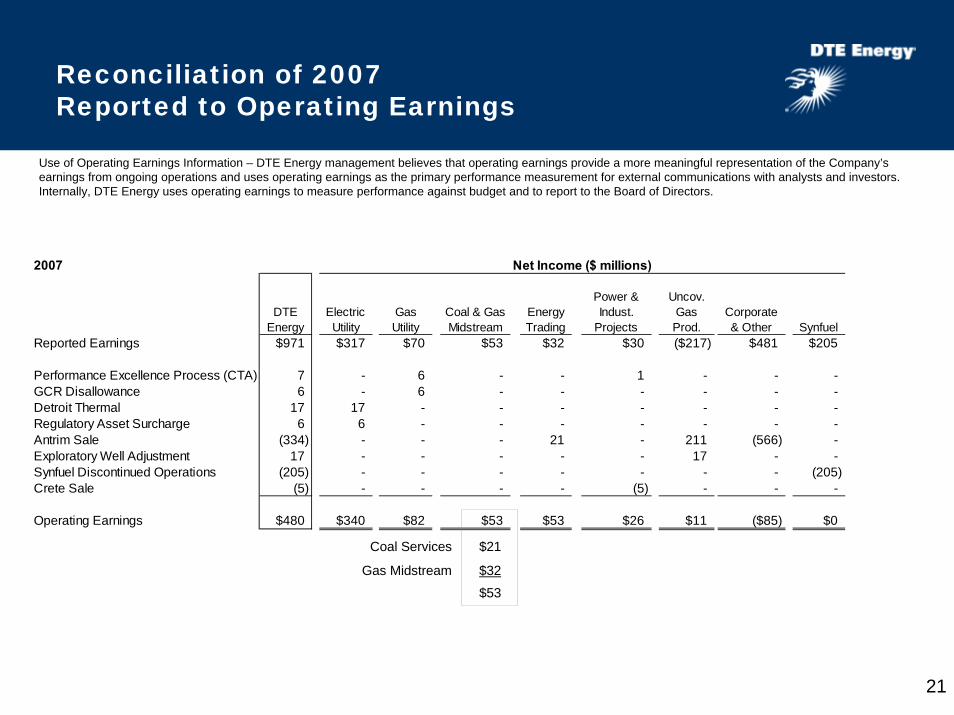
Reconciliation of 2007Reported to Operating Earnings
Use of Operating Earnings Information – DTE Energy management believes that operating earnings provide a more meaningful representation of the Company’s earnings from ongoing operations and uses operating earnings as the primary performance measurement for external communications with analysts and investors. Internally, DTE Energy uses operating earnings to measure performance against budget and to report to the Board of Directors.
2007
DTE Energy
Electric Utility
Gas Utility
Coal & Gas Midstream
Energy Trading
Power & Indust.
Projects
Uncov. Gas Prod.
Corporate & Other Synfuel
Reported Earnings $971 $317 $70 $53 $32 $30 ($217) $481 $205
Performance Excellence Process (CTA) 7 - 6 - - 1 - - - GCR Disallowance 6 - 6 - - - - - - Detroit Thermal 17 17 - - - - - - - Regulatory Asset Surcharge 6 6 - - - - - - - Antrim Sale (334) - - - 21 - 211 (566) - Exploratory Well Adjustment 17 - - - - - 17 - - Synfuel Discontinued Operations (205) - - - - - - - (205) Crete Sale (5) - - - - (5) - - -
Operating Earnings $480 $340 $82 $53 $53 $26 $11 ($85) $0
Net Income ($ millions)
Coal Services
Gas Midstream
$21
$32
$53
22
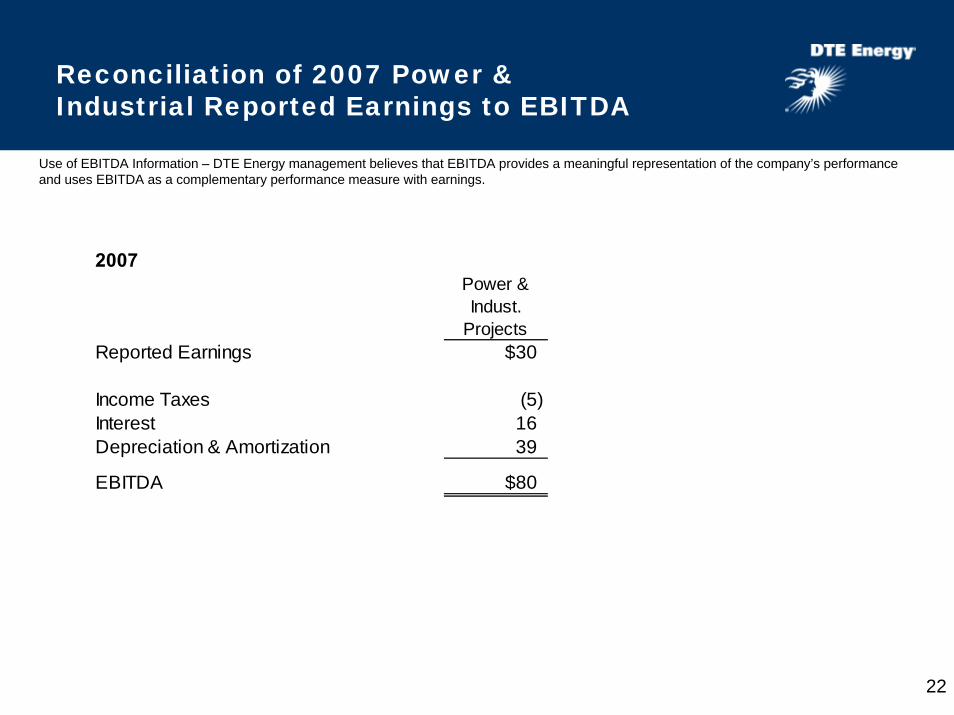
Reconciliation of 2007 Power & Industrial Reported Earnings to EBITDA
Use of EBITDA Information – DTE Energy management believes that EBITDA provides a meaningful representation of the company’s performance and uses EBITDA as a complementary performance measure with earnings.
2007Power & Indust.
Projects Reported Earnings $30
Income Taxes (5) Interest 16 Depreciation & Amortization 39
EBITDA $80
23
Reconciliation of 2008 and 2009 Reported to Operating Earnings
Use of Operating Earnings Information – DTE Energy management believes that operating earnings provide a more meaningful representation of the company’s earnings from ongoing operations and uses operating earnings as the primary performance measurement for external communications with analysts and investors. Internally, DTE Energy uses operating earnings to measure performance against budget and to report to the Board of Directors.
Use of EBITDA Information – DTE Energy management believes that EBITDA provides a meaningful representation of the company’s performance and uses EBITDA as a complementary performance measure with earnings.
In this presentation, DTE Energy provides 2008 guidance and 2009 early outlook for operating earnings. It is likely that certain items which impact the company’s 2008 and 2009 reported results will be excluded from operating results. A reconciliation to the comparable 2008 and 2009 reported earnings/net income guidance/early outlook is not provided because it is not possible to provide a reliable forecast of specific line items. These items may fluctuate significantly from period to period and may have a significant impact on reported earnings.
In this presentation, DTE Energy provides 2008 and 2009 EBITDA for its Power & Industrial Projects segment. It is possible that certain items which impact the company’s 2008 and 2009 reported results will be excluded from operating results and EBITDA. A reconciliation to the comparable 2008 and 2009 reported earnings is not provided because it is not possible to provide a reliable forecast of specific line items. These items may fluctuate significantly from period to period and may have a significant impact on reported earnings.