Embed Size (px)
Citation preview
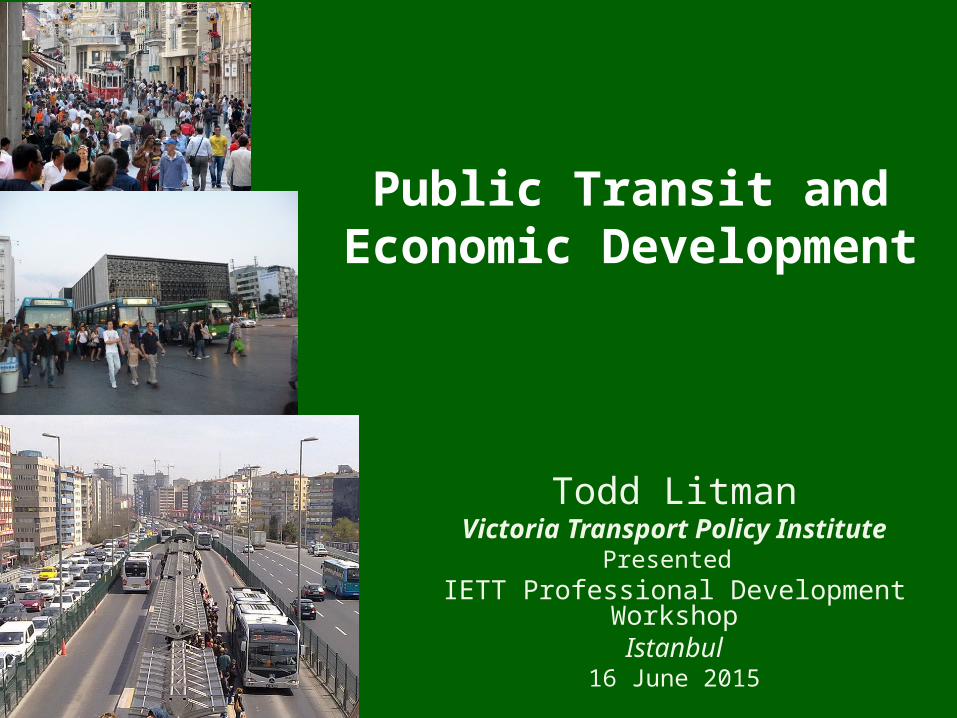
Public Transit and Economic Development
Todd LitmanVictoria Transport Policy Institute
Presented IETT Professional Development Workshop
Istanbul16 June 2015
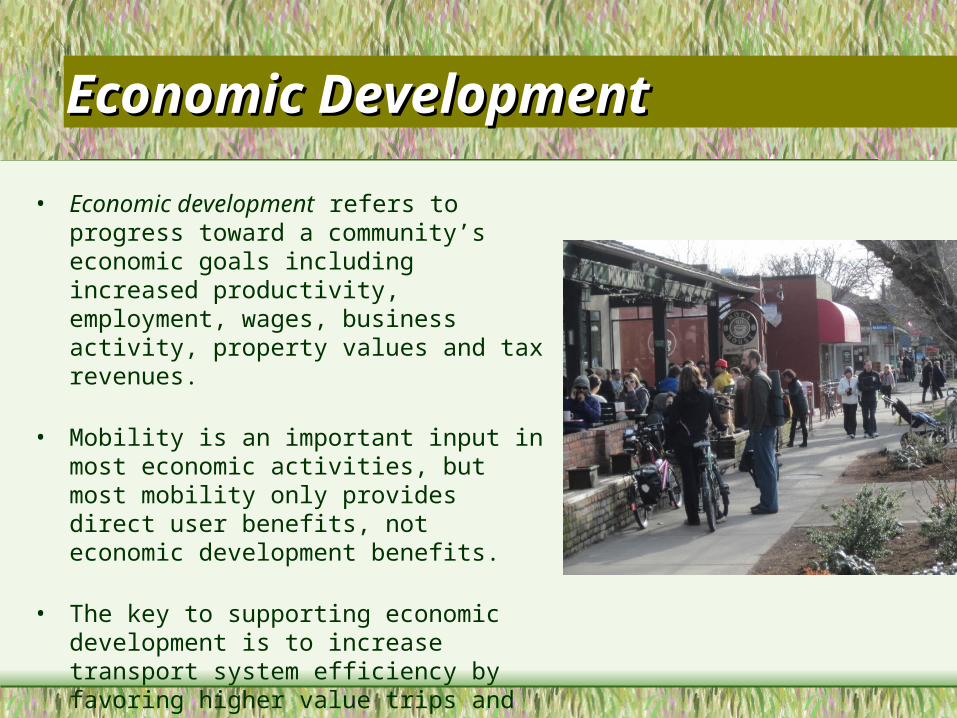
Economic DevelopmentEconomic Development
• Economic development refers to progress toward a community’s economic goals including increased productivity, employment, wages, business activity, property values and tax revenues.
• Mobility is an important input in most economic activities, but most mobility only provides direct user benefits, not economic development benefits.
• The key to supporting economic development is to increase transport system efficiency by favoring higher value trips and more efficient modes.
Transit and Economic Transit and Economic DevelopmentDevelopment
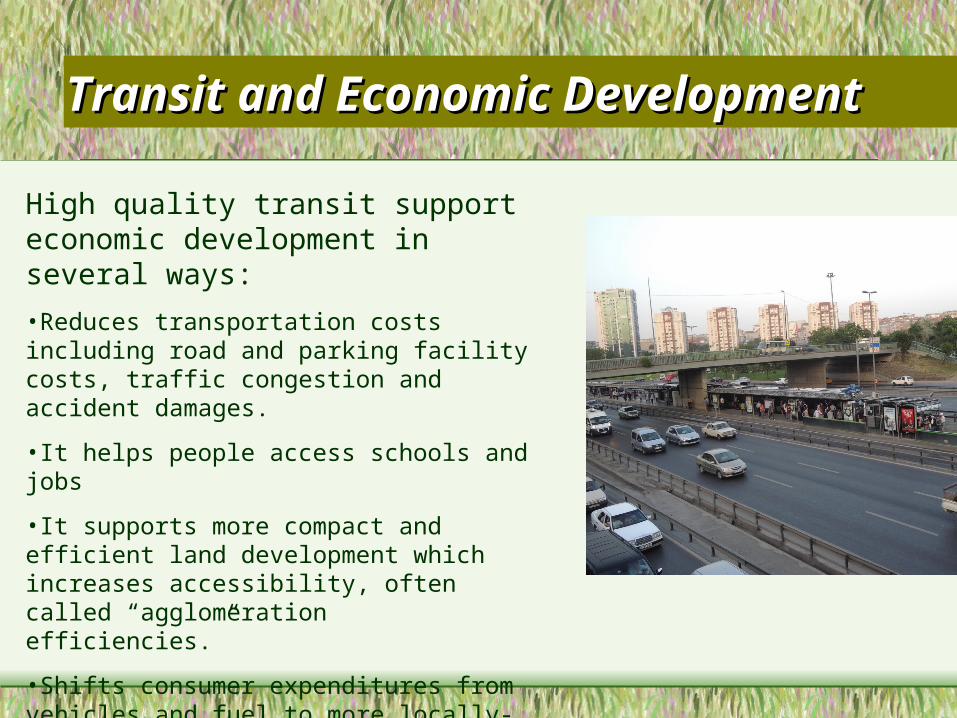
High quality transit support economic development in several ways:
•Reduces transportation costs including road and parking facility costs, traffic congestion and accident damages.
•It helps people access schools and jobs
•It supports more compact and efficient land development which increases accessibility, often called “agglomeration efficiencies.”
•Shifts consumer expenditures from vehicles and fuel to more locally-produced goods.
•Supports specific industries such as tourism.
Public Transit Travel And GDPPublic Transit Travel And GDP
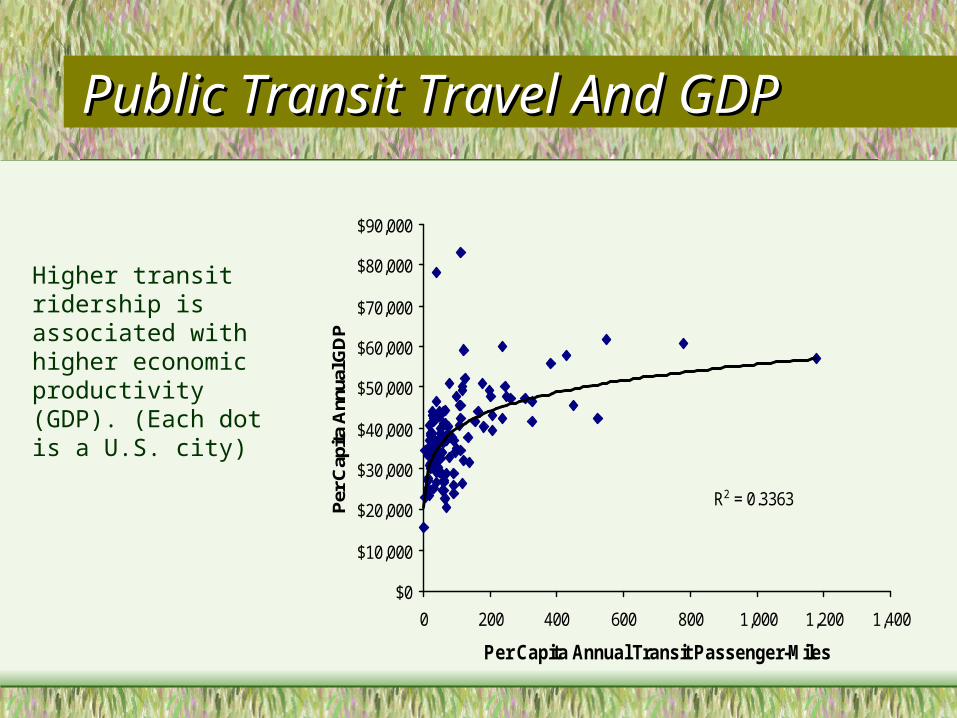
Higher transit ridership is associated with higher economic productivity (GDP). (Each dot is a U.S. city)
R2 = 0.3363
$0
$10,000
$20,000
$30,000
$40,000
$50,000
$60,000
$70,000
$80,000
$90,000
0 200 400 600 800 1,000 1,200 1,400
Per Capita Annual Transit Passenger-Miles
Per
Cap
ita A
nnua
l GD
P
Vehicle Travel And GDPVehicle Travel And GDP
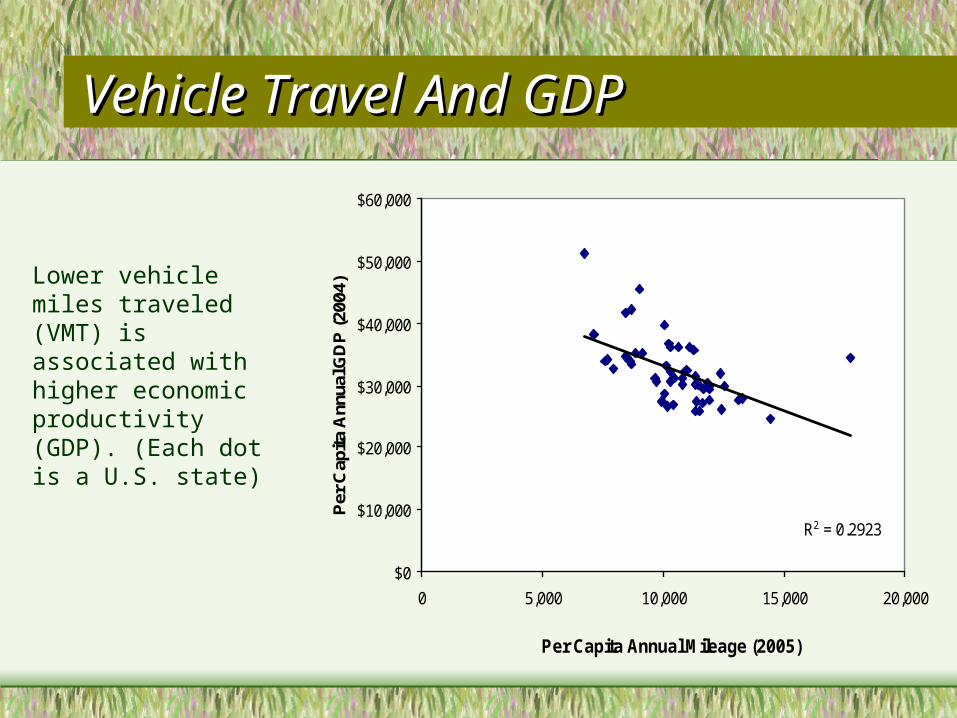
Lower vehicle miles traveled (VMT) is associated with higher economic productivity (GDP). (Each dot is a U.S. state)
R2 = 0.2923
$0
$10,000
$20,000
$30,000
$40,000
$50,000
$60,000
0 5,000 10,000 15,000 20,000
Per Capita Annual Mileage (2005)
Per
Cap
ita A
nnua
l GD
P (2
004)
Per Capita GDP and Urban Per Capita GDP and Urban DensityDensity
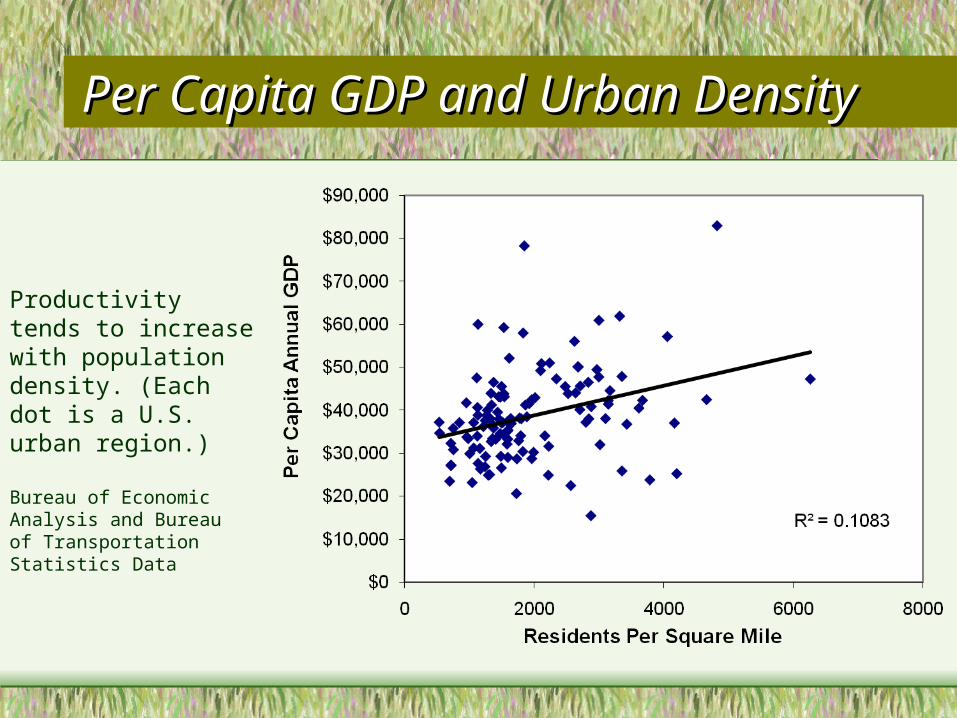
Productivity tends to increase with population density. (Each dot is a U.S. urban region.)
Bureau of Economic Analysis and Bureau of Transportation Statistics Data
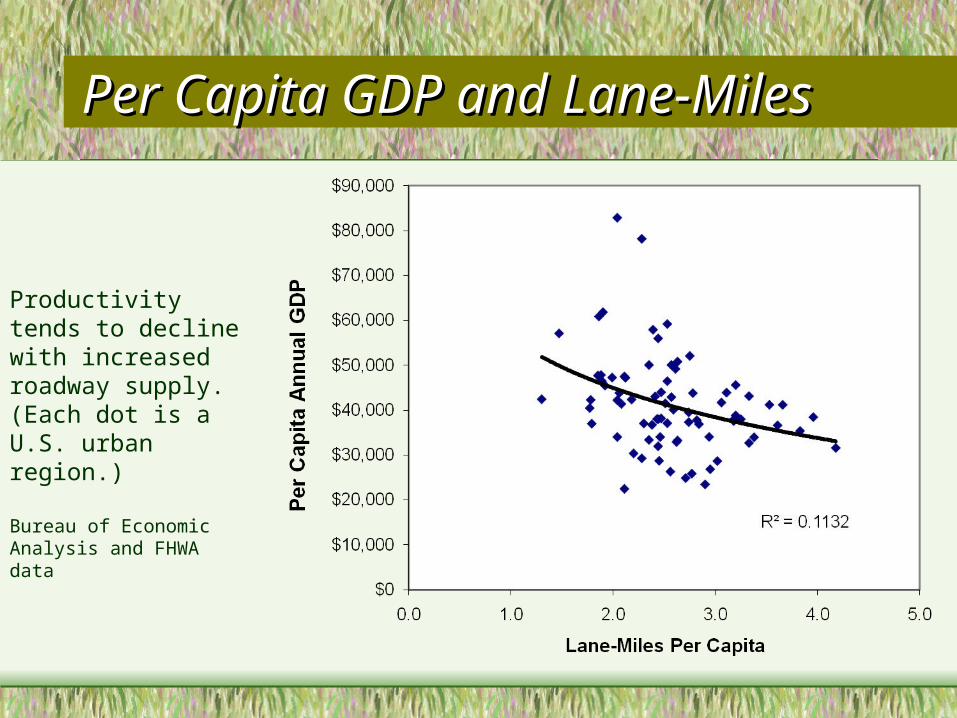
Per Capita GDP and Lane-Per Capita GDP and Lane-MilesMiles
Productivity tends to decline with increased roadway supply. (Each dot is a U.S. urban region.)
Bureau of Economic Analysis and FHWA data
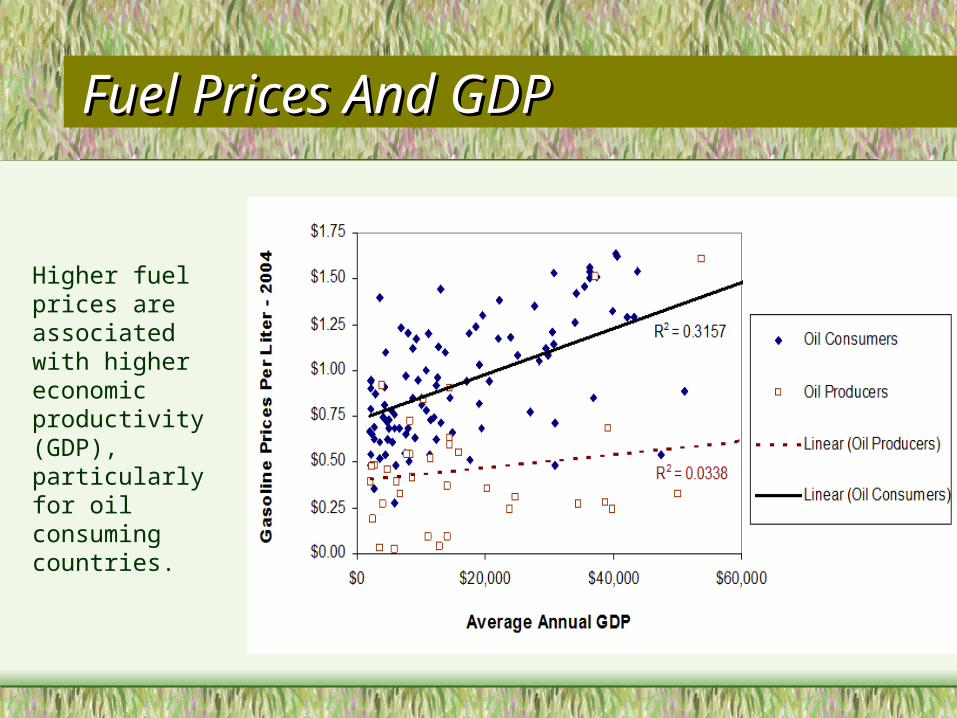
Fuel Prices And GDPFuel Prices And GDP
Higher fuel prices are associated with higher economic productivity (GDP), particularly for oil consuming countries.
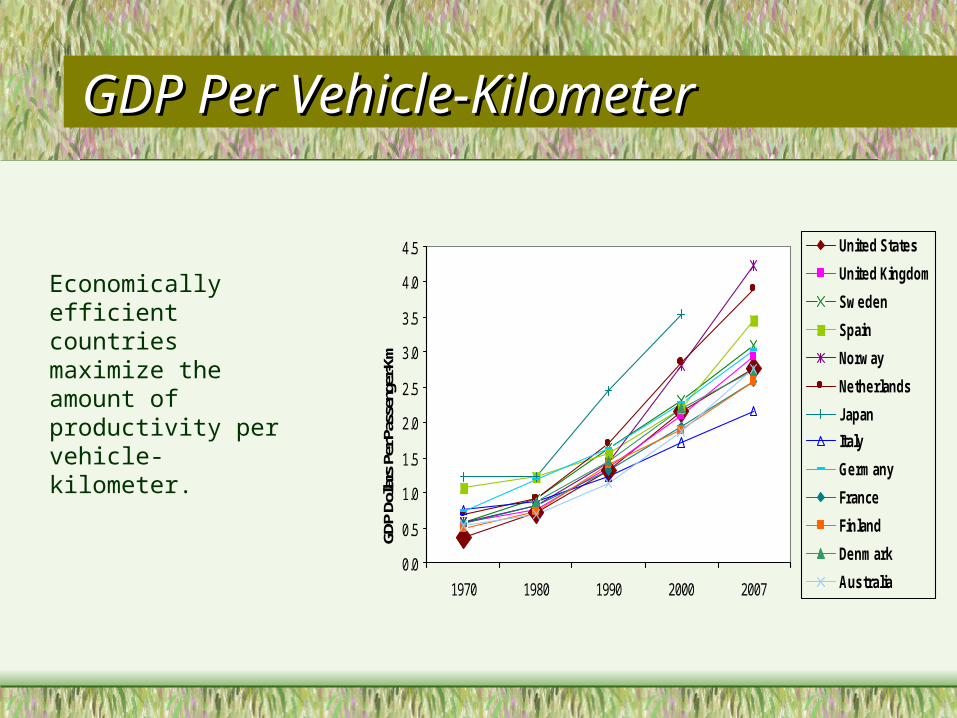
GDP Per Vehicle-KilometerGDP Per Vehicle-Kilometer
0.0
0.5
1.0
1.5
2.0
2.5
3.0
3.5
4.0
4.5
1970 1980 1990 2000 2007
GDP
Dolla
rs P
er P
asse
nger
-Km
United States
United Kingdom
Sweden
Spain
Norway
Netherlands
Japan
Italy
Germany
France
Finland
Denmark
Australia
Economically efficient countries maximize the amount of productivity per vehicle-kilometer.
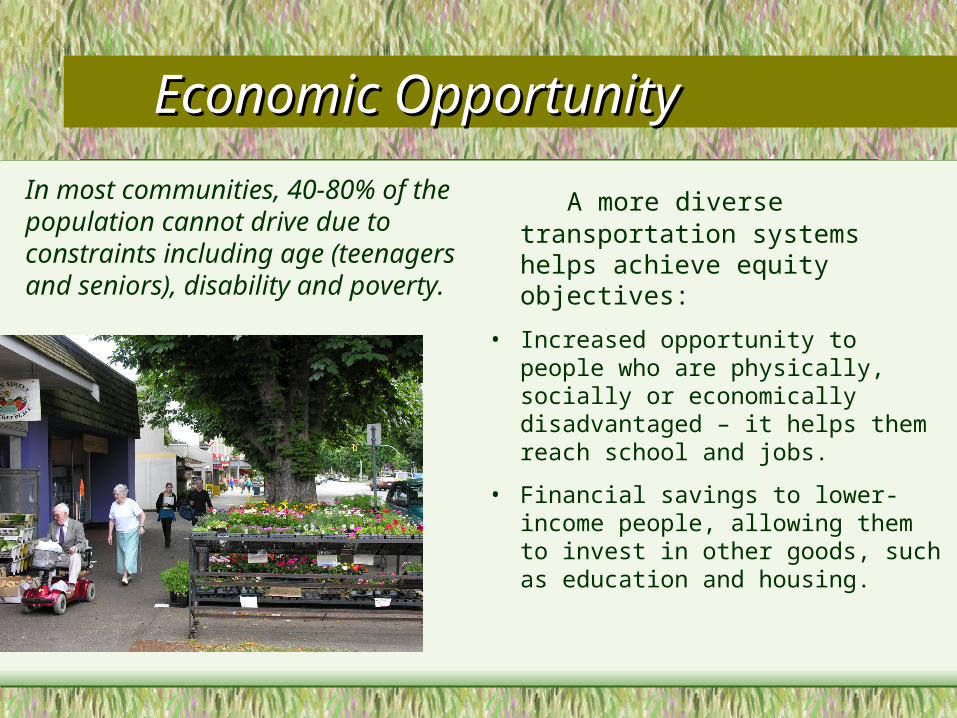
Economic Economic Opportunity Opportunity
A more diverse transportation systems helps achieve equity objectives:
• Increased opportunity to people who are physically, socially or economically disadvantaged – it helps them reach school and jobs.
• Financial savings to lower-income people, allowing them to invest in other goods, such as education and housing.
In most communities, 40-80% of the population cannot drive due to constraints including age (teenagers and seniors), disability and poverty.
Keeping Lira In Istanbul Keeping Lira In Istanbul
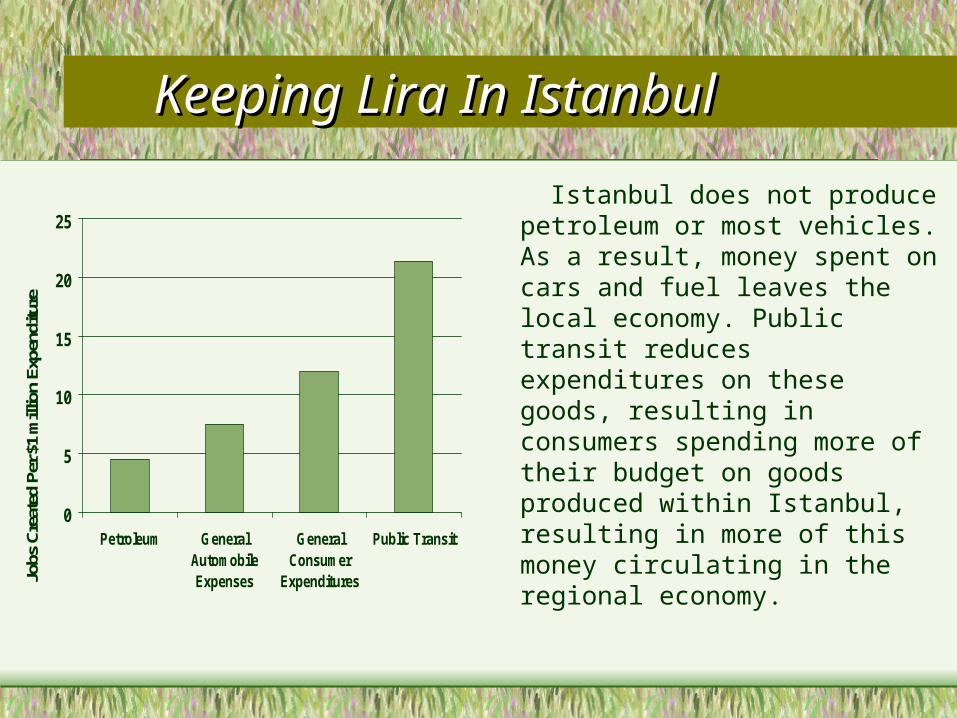
Istanbul does not produce petroleum or most vehicles. As a result, money spent on cars and fuel leaves the local economy. Public transit reduces expenditures on these goods, resulting in consumers spending more of their budget on goods produced within Istanbul, resulting in more of this money circulating in the regional economy.
0
5
10
15
20
25
Petroleum GeneralAutomobileExpenses
GeneralConsumer
Expenditures
Public Transit
Jobs
Cre
ated
Per
$1
mill
ion
Expe
nditu
re
More Livable CommunitiesMore Livable Communities
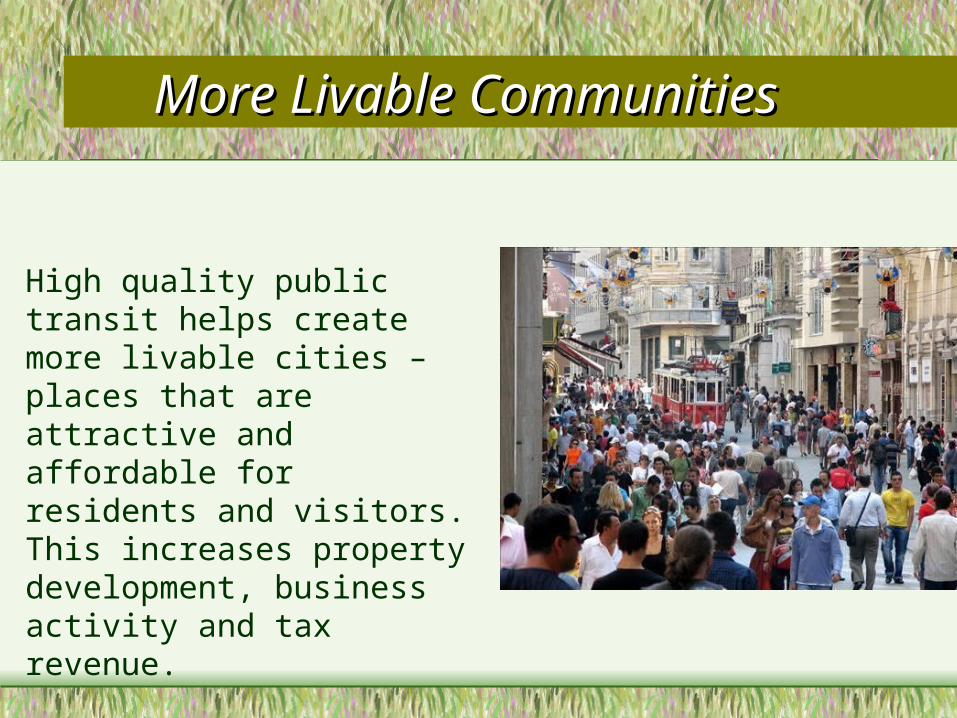
High quality public transit helps create more livable cities – places that are attractive and affordable for residents and visitors. This increases property development, business activity and tax revenue.
Transit-Oriented Transit-Oriented DevelopmentDevelopment
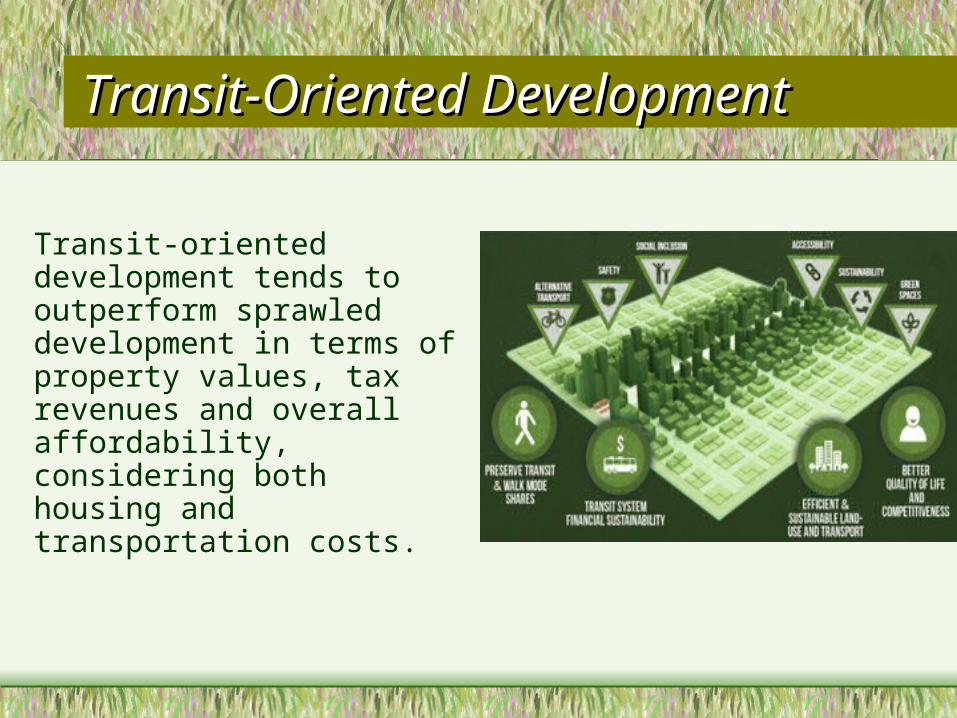
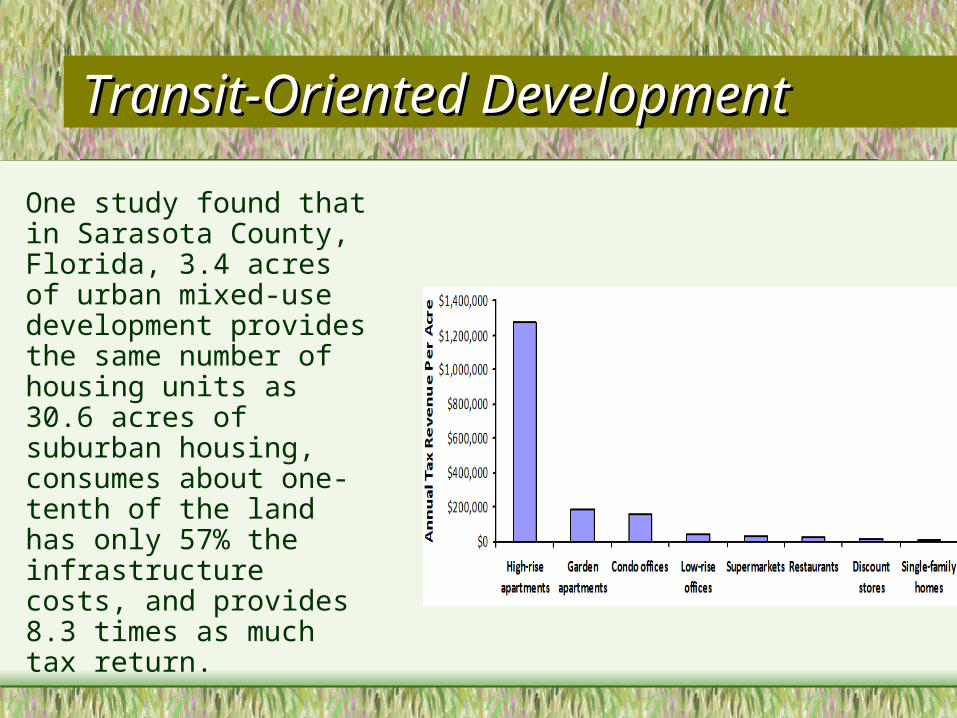
Transit-oriented development tends to outperform sprawled development in terms of property values, tax revenues and overall affordability, considering both housing and transportation costs.
Transit-Oriented Transit-Oriented DevelopmentDevelopment
One study found that in Sarasota County, Florida, 3.4 acres of urban mixed-use development provides the same number of housing units as 30.6 acres of suburban housing, consumes about one-tenth of the land has only 57% the infrastructure costs, and provides 8.3 times as much tax return.
Tourism is A Growing Tourism is A Growing IndustryIndustry
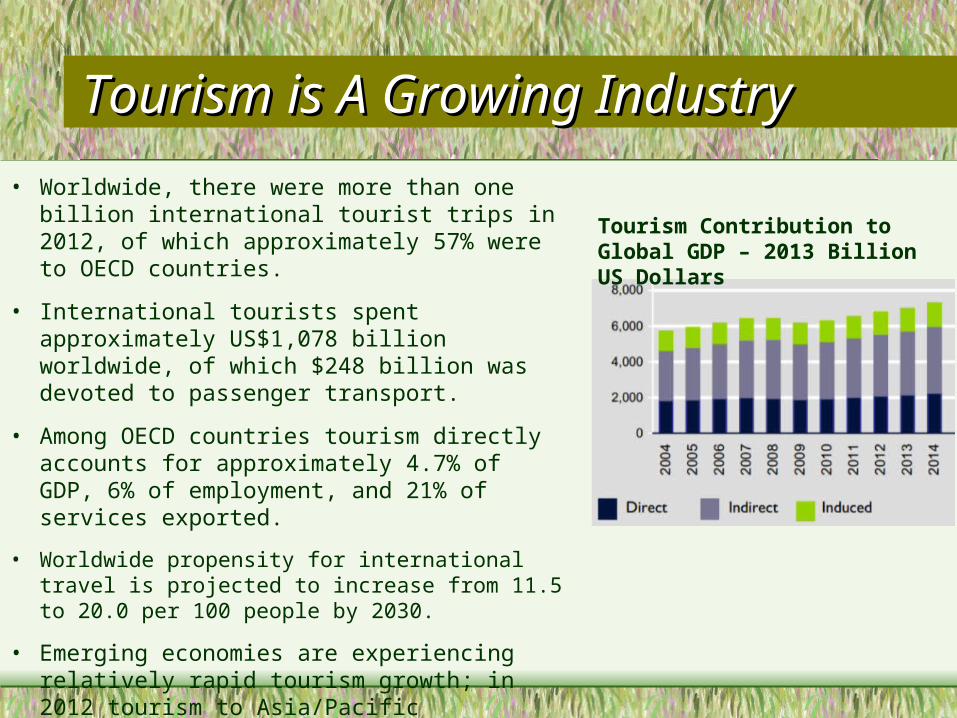
• Worldwide, there were more than one billion international tourist trips in 2012, of which approximately 57% were to OECD countries.
• International tourists spent approximately US$1,078 billion worldwide, of which $248 billion was devoted to passenger transport.
• Among OECD countries tourism directly accounts for approximately 4.7% of GDP, 6% of employment, and 21% of services exported.
• Worldwide propensity for international travel is projected to increase from 11.5 to 20.0 per 100 people by 2030.
• Emerging economies are experiencing relatively rapid tourism growth; in 2012 tourism to Asia/Pacific destinations grew 7% compared to 3% in Europe.
Tourism Contribution to Global GDP – 2013 Billion US Dollars
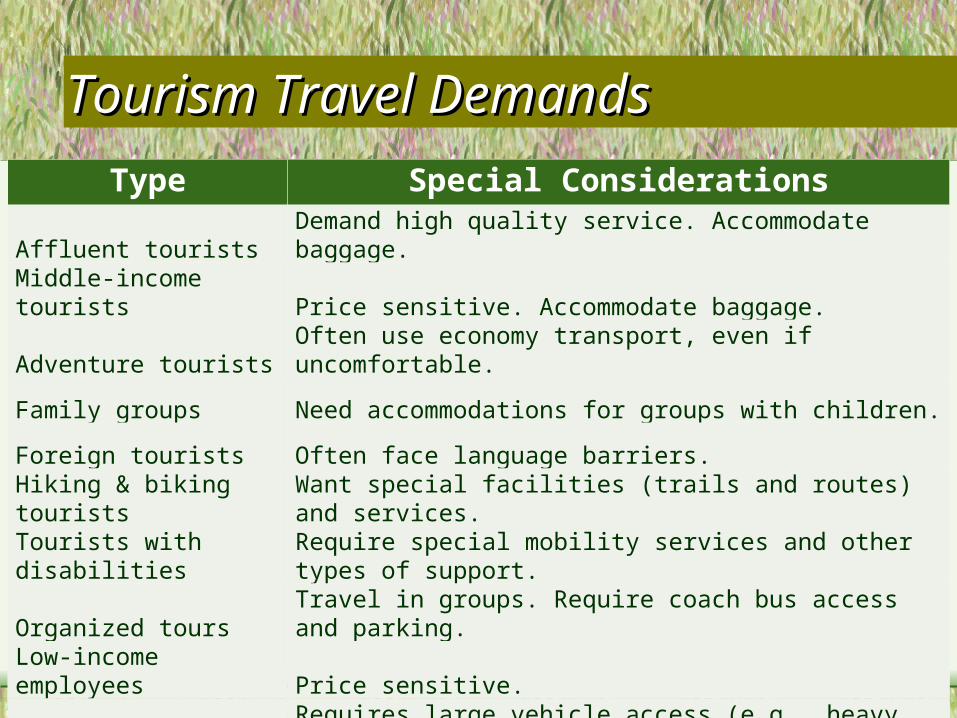
Tourism Travel DemandsTourism Travel Demands
Type Special Considerations
Affluent tourists Demand high quality service. Accommodate baggage.
Middle-income tourists Price sensitive. Accommodate baggage.
Adventure tourists Often use economy transport, even if uncomfortable.
Family groups Need accommodations for groups with children.
Foreign tourists Often face language barriers.
Hiking & biking tourists Want special facilities (trails and routes) and services.
Tourists with disabilities Require special mobility services and other types of support.
Organized tours Travel in groups. Require coach bus access and parking.
Low-income employees Price sensitive.
Freight Requires large vehicle access (e.g., heavy diesel trucks).
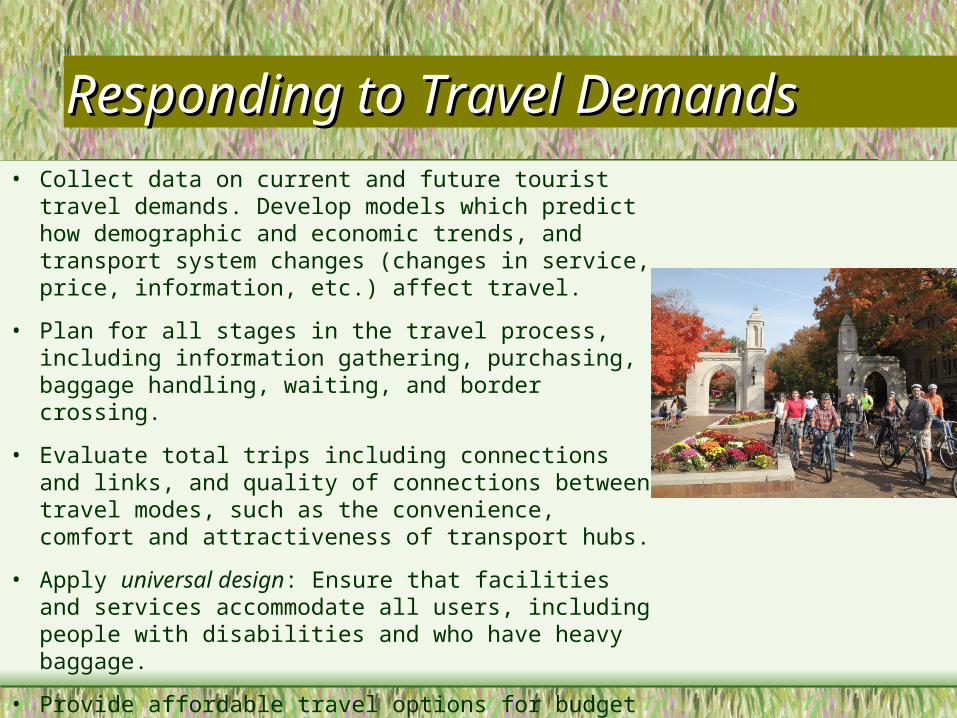
Responding to Travel Responding to Travel DemandsDemands
• Collect data on current and future tourist travel demands. Develop models which predict how demographic and economic trends, and transport system changes (changes in service, price, information, etc.) affect travel.
• Plan for all stages in the travel process, including information gathering, purchasing, baggage handling, waiting, and border crossing.
• Evaluate total trips including connections and links, and quality of connections between travel modes, such as the convenience, comfort and attractiveness of transport hubs.
• Apply universal design: Ensure that facilities and services accommodate all users, including people with disabilities and who have heavy baggage.
• Provide affordable travel options for budget tourists and tourist industry employees, such as public transportation access to airports, and bicycling for local travel.
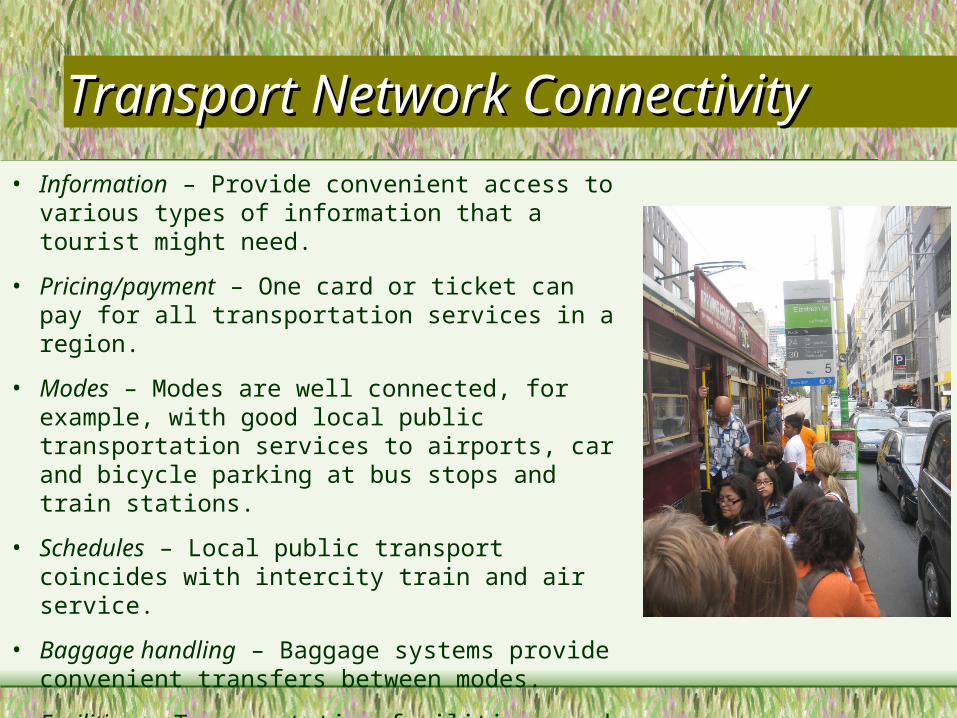
Transport Network Transport Network ConnectivityConnectivity
• Information – Provide convenient access to various types of information that a tourist might need.
• Pricing/payment – One card or ticket can pay for all transportation services in a region.
• Modes – Modes are well connected, for example, with good local public transportation services to airports, car and bicycle parking at bus stops and train stations.
• Schedules – Local public transport coincides with intercity train and air service.
• Baggage handling – Baggage systems provide convenient transfers between modes.
• Facilities – Transportation facilities, such as stations and airports, are designed to serve and connect multiple modes and users (visitors, locals etc.).
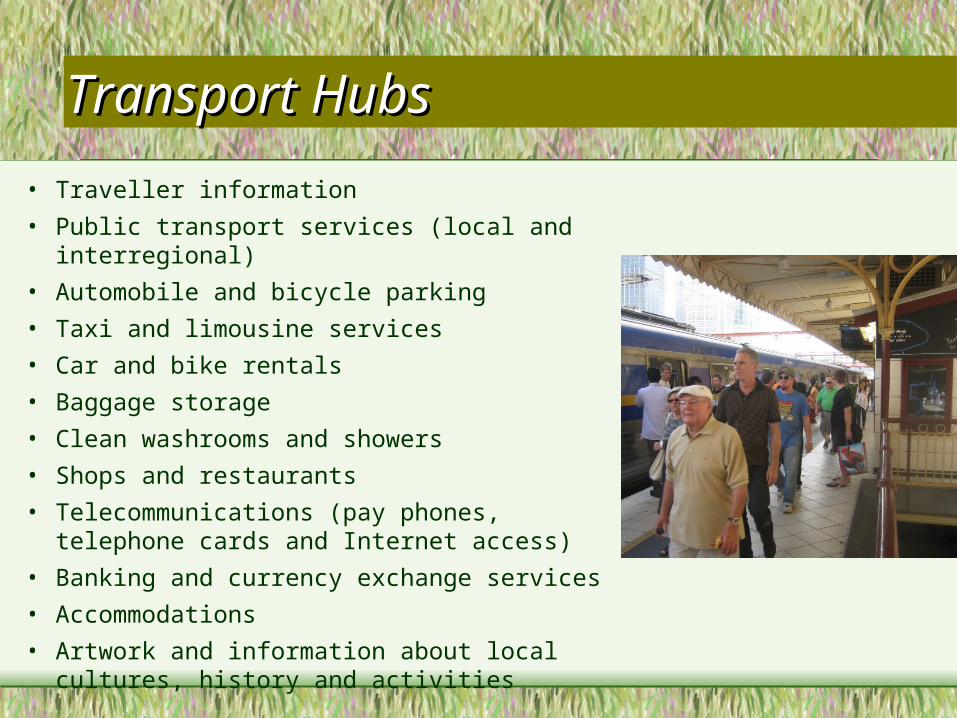
Transport HubsTransport Hubs
• Traveller information
• Public transport services (local and interregional)
• Automobile and bicycle parking
• Taxi and limousine services
• Car and bike rentals
• Baggage storage
• Clean washrooms and showers
• Shops and restaurants
• Telecommunications (pay phones, telephone cards and Internet access)
• Banking and currency exchange services
• Accommodations
• Artwork and information about local cultures, history and activities
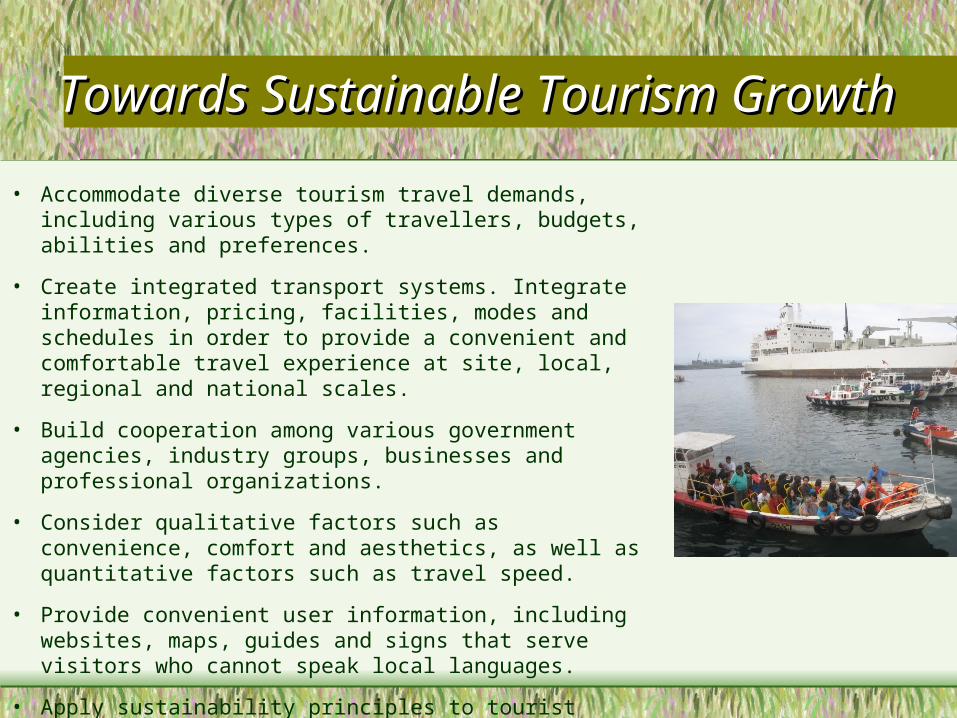
Towards Sustainable Tourism Towards Sustainable Tourism GrowthGrowth
• Accommodate diverse tourism travel demands, including various types of travellers, budgets, abilities and preferences.
• Create integrated transport systems. Integrate information, pricing, facilities, modes and schedules in order to provide a convenient and comfortable travel experience at site, local, regional and national scales.
• Build cooperation among various government agencies, industry groups, businesses and professional organizations.
• Consider qualitative factors such as convenience, comfort and aesthetics, as well as quantitative factors such as travel speed.
• Provide convenient user information, including websites, maps, guides and signs that serve visitors who cannot speak local languages.
• Apply sustainability principles to tourist transport planning.
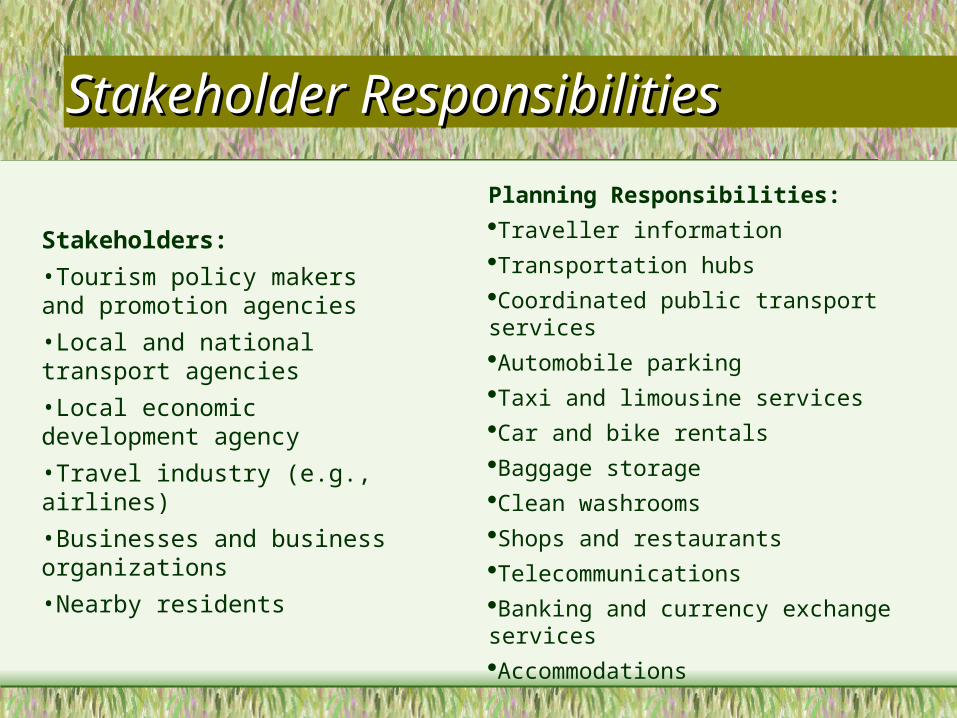
Stakeholder ResponsibilitiesStakeholder Responsibilities
Stakeholders:
•Tourism policy makers and promotion agencies
•Local and national transport agencies
•Local economic development agency
•Travel industry (e.g., airlines)
•Businesses and business organizations
•Nearby residents
Planning Responsibilities:Traveller informationTransportation hubsCoordinated public transport servicesAutomobile parkingTaxi and limousine servicesCar and bike rentalsBaggage storageClean washroomsShops and restaurantsTelecommunicationsBanking and currency exchange servicesAccommodations
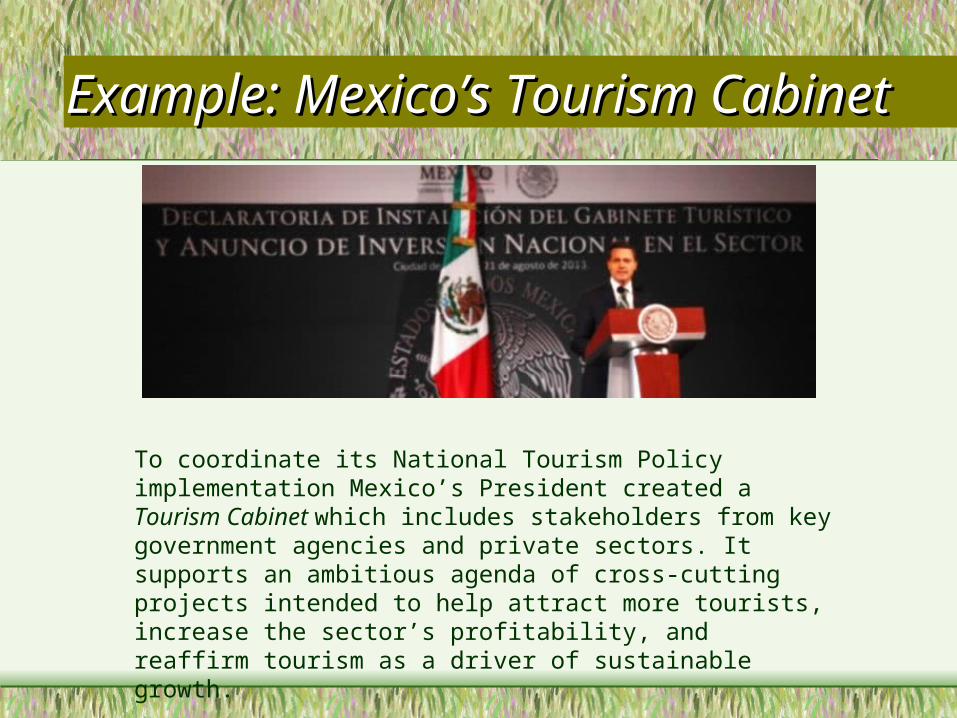
Example: MexicoExample: Mexico’’s Tourism s Tourism CabinetCabinet
To coordinate its National Tourism Policy implementation Mexico’s President created a Tourism Cabinet which includes stakeholders from key government agencies and private sectors. It supports an ambitious agenda of cross-cutting projects intended to help attract more tourists, increase the sector’s profitability, and reaffirm tourism as a driver of sustainable growth.
Example:Example: NETS NETS
The Network for Sustainable Mobility in Tourism (NETS) is a network of sustainable tourist transportation organizations in Germany and Austria that work to improve the quality of vacations and the environment as well as to raise the standard of living for both guests and locals. Its partners include tourist destinations that offer sustainable mobility, travel and mobility service providers, public agencies and other organizations that promote environmentally friendly tourist transport in the region. NETS helps tourism and transport experts exchange knowledge, and develop and promote high quality environmentally sustainable tourism packages.
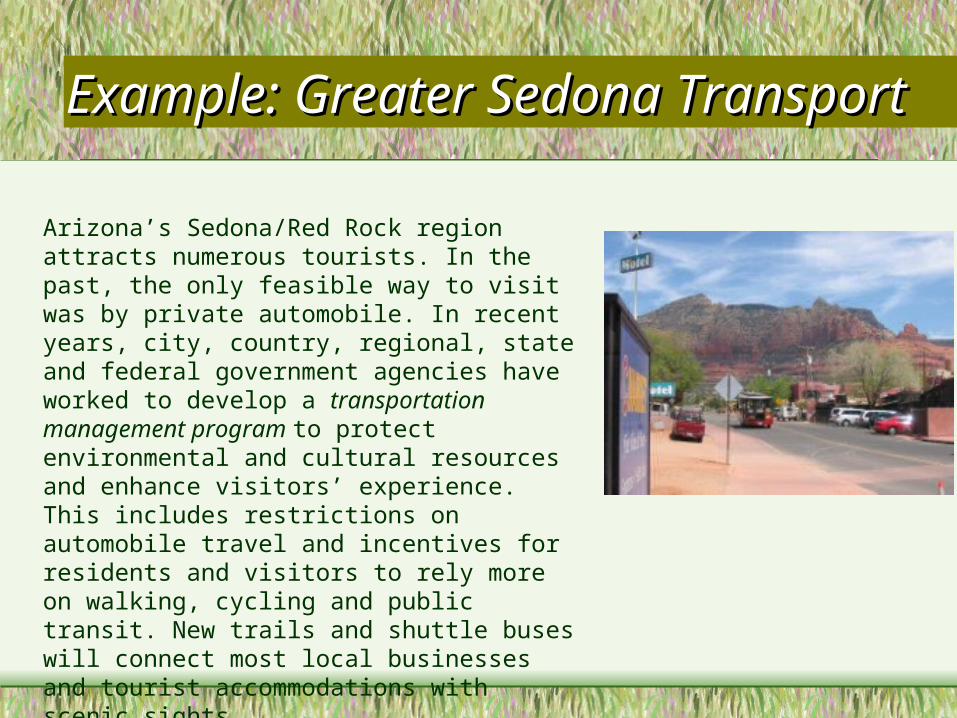
Example:Example: Greater Sedona Greater Sedona TransportTransport
Arizona’s Sedona/Red Rock region attracts numerous tourists. In the past, the only feasible way to visit was by private automobile. In recent years, city, country, regional, state and federal government agencies have worked to develop a transportation management program to protect environmental and cultural resources and enhance visitors’ experience. This includes restrictions on automobile travel and incentives for residents and visitors to rely more on walking, cycling and public transit. New trails and shuttle buses will connect most local businesses and tourist accommodations with scenic sights.
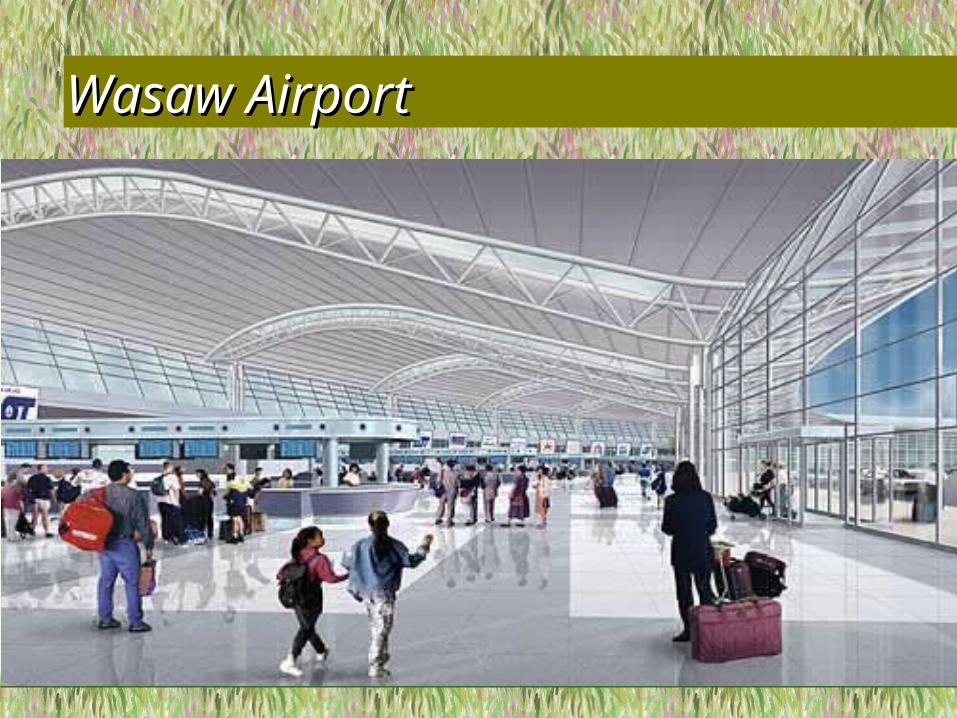
Wasaw AirportWasaw Airport
Discussion QuestionsDiscussion Questions
• How will current demographic and economic trends affect tourism travel demands?
• How well do current policies and planning practices respond to these changing demand?
• How well do your tourism and transport agencies cooperate to improve tourist transport?
• What are barriers to better cooperation?
• What specific policy changes could help overcome these barriers?
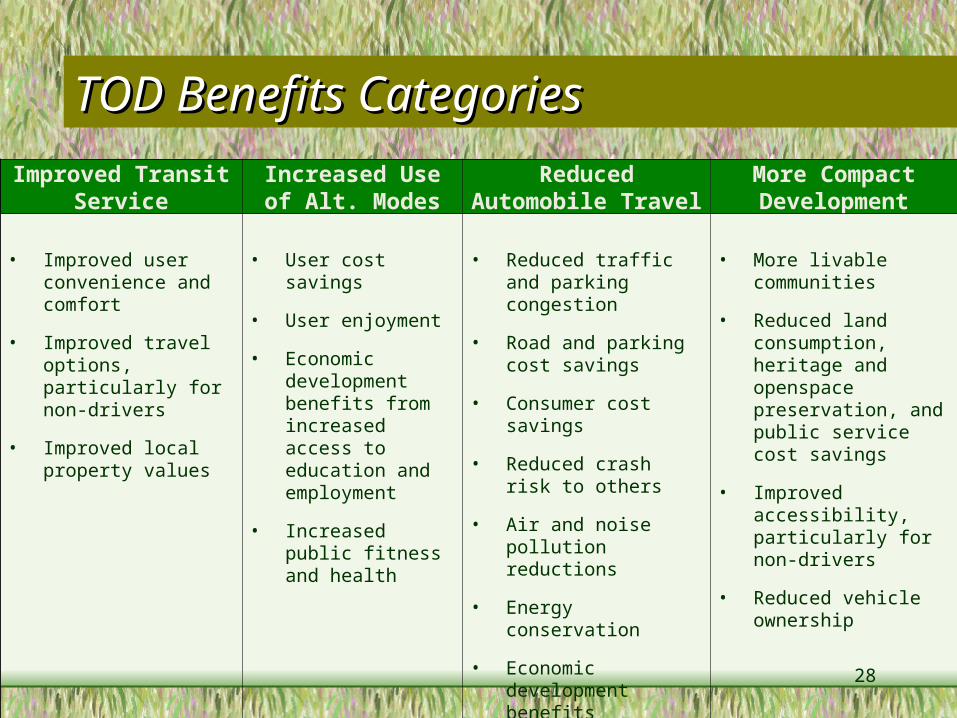
TOD Benefits CategoriesTOD Benefits Categories
Improved Transit Service
Increased Use of Alt. Modes
Reduced Automobile Travel
More Compact Development
• Improved user convenience and comfort
• Improved travel options, particularly for non-drivers
• Improved local property values
• User cost savings
• User enjoyment
• Economic development benefits from increased access to education and employment
• Increased public fitness and health
• Reduced traffic and parking congestion
• Road and parking cost savings
• Consumer cost savings
• Reduced crash risk to others
• Air and noise pollution reductions
• Energy conservation
• Economic development benefits
• More livable communities
• Reduced land consumption, heritage and openspace preservation, and public service cost savings
• Improved accessibility, particularly for non-drivers
• Reduced vehicle ownership
28
29
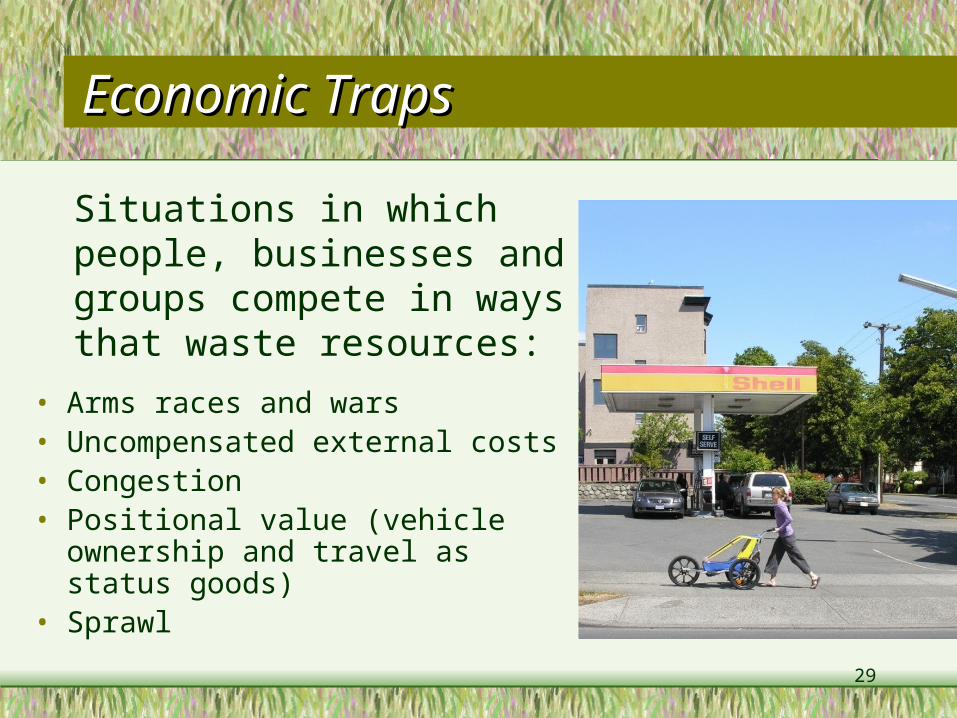
Economic TrapsEconomic Traps
• Arms races and wars• Uncompensated external costs• Congestion• Positional value (vehicle ownership
and travel as status goods)• Sprawl
Situations in which people, businesses and groups compete in ways that waste resources:
30
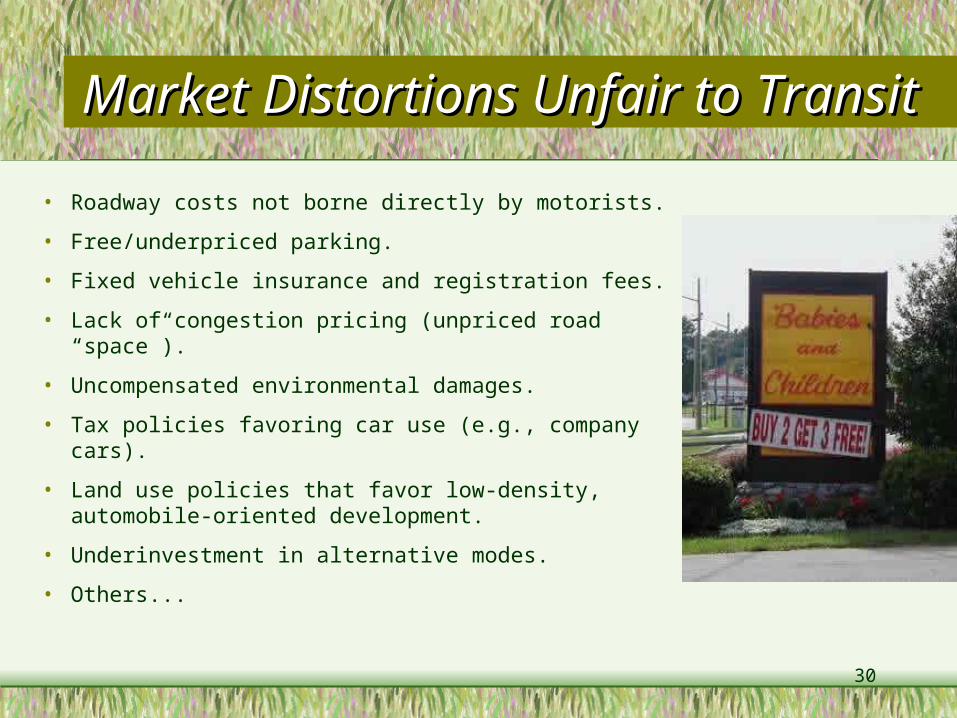
Market Distortions Unfair to Market Distortions Unfair to TransitTransit
• Roadway costs not borne directly by motorists.
• Free/underpriced parking.
• Fixed vehicle insurance and registration fees.
• Lack of congestion pricing (unpriced road “space”).
• Uncompensated environmental damages.
• Tax policies favoring car use (e.g., company cars).
• Land use policies that favor low-density, automobile-oriented development.
• Underinvestment in alternative modes.
• Others...
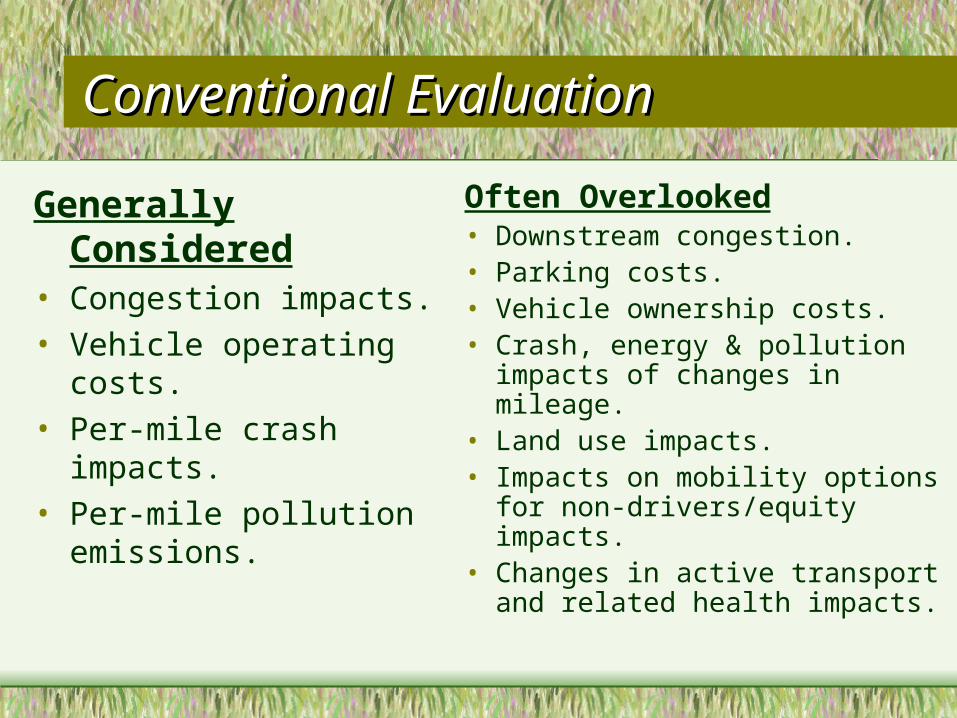
Conventional EvaluationConventional Evaluation
Generally Considered• Congestion impacts.• Vehicle operating costs.• Per-mile crash impacts.• Per-mile pollution
emissions.
Often Overlooked• Downstream congestion.• Parking costs.• Vehicle ownership costs.• Crash, energy & pollution
impacts of changes in mileage.• Land use impacts.• Impacts on mobility options for
non-drivers/equity impacts.• Changes in active transport
and related health impacts.
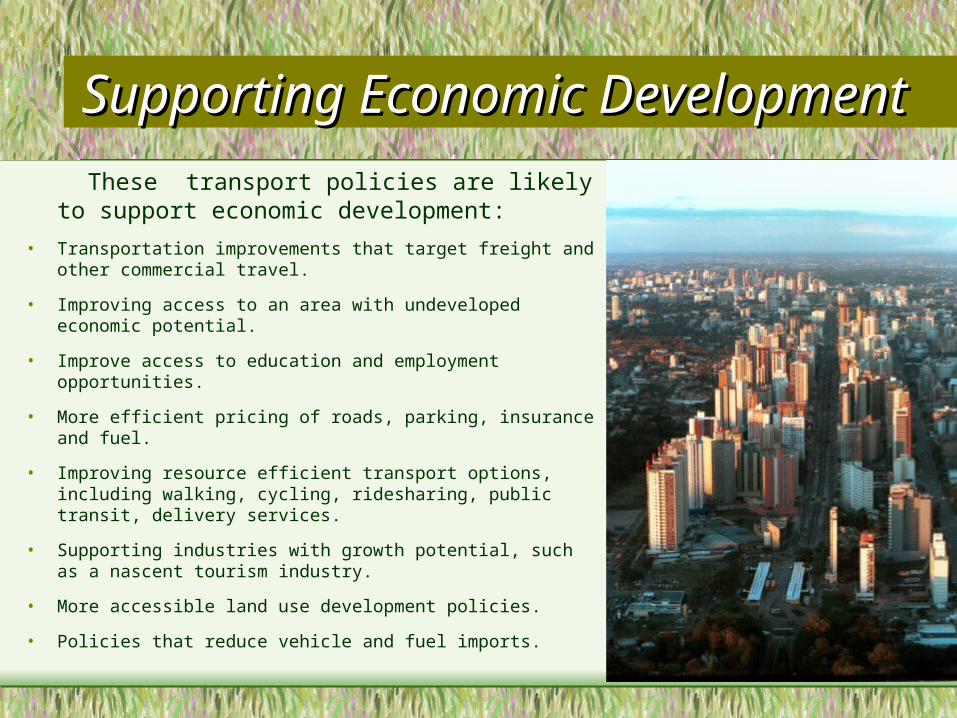
Supporting Economic Supporting Economic DevelopmentDevelopment
These transport policies are likely to support economic development:
• Transportation improvements that target freight and other commercial travel.
• Improving access to an area with undeveloped economic potential.
• Improve access to education and employment opportunities.
• More efficient pricing of roads, parking, insurance and fuel.
• Improving resource efficient transport options, including walking, cycling, ridesharing, public transit, delivery services.
• Supporting industries with growth potential, such as a nascent tourism industry.
• More accessible land use development policies.
• Policies that reduce vehicle and fuel imports.
Discussion QuestionsDiscussion Questions
• What transit economic development benefits are most important in Istanbul?
• How well do decision-makers and the general public understand the ways that public transit can support economic development?
• What more information is needed?• What policy reforms are appropriate in
Istanbul?
“The Mobility-Productivity Paradox: Exploring The Negative Relationships Between Mobility and Economic Productivity”
“Are Vehicle Travel Reduction Targets Justified?”
“Socially Optimal Transport Prices and Markets”
“Smart Transportation Economic Stimulation”
“Transportation Cost and Benefit Analysis”
“Online TDM Encyclopedia”
and more...
www.vtpi.org